Modeling of Polystyrene under Confinement: Exploring the Limits ofIterative Boltzmann InversionBeste Bayramoglu†,‡ and Roland Faller†,*†Department of Chemical Engineering & Materials Science, UC Davis, Davis, California 95616, United States‡Department of Food Engineering, Izmir Institute of Technology, Izmir, Turkey 35430
*S Supporting Information
ABSTRACT: We explore the limits of a purely structure based coarse-graining technique, the iterative Boltzmann inversion(IBI), in the coarse-graining of a confined concentrated polystyrene solution. In the first place, some technical considerations andchallenges encountered in the course of the optimization process are represented. The concepts of the choice of the initialpotentials and the cross-dependency of the interactions as well as the order of optimization are discussed in detail. Furthermore,the transferability of a previously developed CG confined polystyrene solution model, the “parent CG confined model”, todifferent degrees of confinement at constant concentration and temperature is examined. We investigate if a CG force fielddeveloped for a confined polymer solution by IBI is sensitive to changes in the degree of localization or arrangement of polymersnear the surfaces although the concentration is kept constant. For this purpose, reference atomistic simulations on systems ofdifferent confinement levels have been performed. The differences in the structure and dynamics of the chains are addressed.Results are compared with those of an unconfined (bulk) system at the same concentration. The chain dimensions andorientations as a function of the distance from the surfaces are also reported. To the best of our knowledge, this is the firstcomputational study that investigates the structural behavior of polymers in close proximity of the surfaces in a concentratedpolymer solution rather than in a melt. Transferability of the parent CG confined model is tested by employing the parent forcefield in CG simulations of the reference systems. Results indicate that the degree of arrangement of monomers and solventmolecules near the surfaces is an important factor that needs to be paid attention to when considering the application of a CGforce field developed by IBI to different degrees of confinement.
1. INTRODUCTION
Polymers are present in every aspect of our lives due to theirversatile applications.1 An important application of polymers istheir use as lubricants or adhesives,2 which generates the needto improve our understanding of the structure, thermody-namics, and rheology of polymers near solid surfaces.1
Molecular dynamics simulations are complementary to experi-ments and are a great tool to study structural and dynamicproperties of polymers. Modeling polymers, however, is achallenging task due to the enormous variety of length and timescales involved in the description of their structural anddynamic properties.3 The use of mesoscale models, which linkthe length and time scales in higher resolution to those incoarser-level representations, is essential, as a single modelingapproach cannot capture all relevant properties.3−6 The
development of mesoscale models is called “coarse-graining”,which can be defined as the derivation of a less detailed model(incorporating fewer degrees of freedom by grouping severalatoms into superatoms) from a detailed atomistic model.7
If the aim of coarse-graining is to reproduce the structure ofthe higher resolution model, a number of computationalmethods are available.8 According to Milano et al. the basic ideagoes back to Soper,9 which was adapted and named iterativeBoltzmann inversion (IBI) by Reith et al.10 IBI reproduces thestructure of the underlying atomistic system by means of aniterative optimization scheme through which the effective
Received: April 23, 2013Revised: July 31, 2013Published: September 17, 2013
potentials between superatoms (CG sites) are obtained.3 It ismotivated by Henderson’s theorem11 which states that there isa unique mapping between the radial distribution function(g(r)) and the intermolecular potential (V) for simple pairwiseadditive and spherically symmetric potentials at a giventhermodynamic state point:12
= −V k T g rln( ( ))B (1)
eq 1 is actually a potential of mean force and it equals thepotential energy only in the limit of infinite dilution.10
According to Chan et al.12 this is only valid for particles ormolecules with a single interaction site rather than moleculeswith multiple interaction sites (like polymers) since the relationdoes not account for orientation correlations. However, thisdoes not prohibit its use in the iteration algorithm (see eq 5)for the coarse-graining of polymeric systems with IBI, as thealgorithm just serves as a numerical path among many possibleones that yield one effective CG potential by satisfying thecondition that the trial CG potential converges when thecorresponding conformational distribution matches the refer-ence distribution in the atomistic simulations12 and nouniqueness is assumed.What makes IBI attractive is the use of numerical potentials
rather than less flexible analytical potentials in the force fielddevelopment that also enables the automatization of the wholeprocess minimizing human intervention.4,10,13 However, animportant drawback of the method is the strong state-pointdependence and limited transferability of the potentials.4,13−16
Nevertheless, studies showed that the temperature trans-ferability can be improved through a careful choice of mappingpoint(s)17 and/or inclusion of sufficient chemical detail.18,19
Recently, we have developed separate CG models ofpolystyrene (PS) in various environments (melt, dilutesolution, unconfined and confined concentrated solution)using IBI.3 The performance of the technique in terms ofreproduction of the local and global structures and speed-up indynamics was studied for each system. Developing mesoscalemodels for confined polymers is more challenging compared tobulk systems, since one has to account for not only theintermolecular interactions between the chains and surface, butalso the surface geometry and chemistry.3,19 As a consequence,there are only few reports on coarse-graining of polymers inclose contact with surfaces.19−22 Moreover, considering thedensity fluctuations near surfaces in confined systems,1,20,23,24 itis even more challenging to develop a CG model by means of astructure based coarse-graining technique such as IBI as thesystem is locally in different state points.3 In the previouspublication,3 we briefly addressed some of the challenges facedduring our implementation of the IBI method on coarse-graining of the confined concentrated PS solution. Here, we godeeper into those challenges as well as some technicalconsiderations in the first part, giving better insight into thelimits of IBI technique on coarse-graining of confinedheterogeneous polymeric systems. In the later part of themanuscript, the transferability of the developed CG model todifferent levels of confinement is explored. Considering thedensity fluctuations near the surfaces, it would be interesting tosee how much the model we developed (which is referred asthe “parent CG confined model” in the second part) is sensitiveto different local states close to the surfaces. For this purpose,we employed the same “parent” force field in CG simulations oftwo different confined PS solution systems, which have thesame number of molecules with different separation distances
between the walls. These systems differ in the confinementsurface area as the decrease/increase in the volume of thesystem by more/less confinement is compensated by anincrease/decrease of the surface area to keep the concentrationconstant, which is expected to have an impact on the degree oflocalization (or arrangement) of polymer chains near thesurfaces. In a more general scope, we aim to examine if IBIoptimized CG potentials are sensitive to quantitative differ-ences in localization of PS monomers close to the surfaces.Therefore, we explore the limits of iterative Boltzmanninversion technique in developing CG potentials that can beused for a range of confinement levels (at constantconcentration and temperature). Besides, the differences inthe local and global structure and the dynamics of the chains indifferent confinement levels are also addressed based on theresults of the corresponding reference atomistic simulations. Inorder to make an appropriate comparison, previous simulationresults of an unconfined (bulk) system (of the sameconcentration)1,3 are also presented. To the best of ourknowledge, this is the first computational study that reports thestructural behavior of polymers in the vicinity of surfaces in aconcentrated solution rather than in a melt.
2. COARSE-GRAINED FORCE FIELDPARAMETERIZATION OF POLYSTYRENE SOLUTIONUNDER CONFINEMENT
The main focus of this part is to get deeper into the technicaldetails and considerations in the course of the coarse-grained(CG) force field parametrization of a confined concentratedpolystyrene (PS) solution of which the results were reported ina previous publication.3 The challenges faced during theimplementation of the iterative Boltzmann inversion (IBI)method are discussed further and conclusions/suggestions onseveral important points are presented. In IBI, the CG model isdeveloped from the results of a reference atomistic simulation.We have reported the methodological details and results of theatomistic simulations earlier.1,3 In short, the reference system iscomposed of 48 PS chains of 15 monomers with a ratio of mesoto racemic dyads of 1:1 solvated in 745 toluene moleculesconfined between opposing graphene surfaces (each composedof two sheets) separated by 4.51 nm in z-direction. The all-atom model for PS was taken from earlier studies.6,25 Allnonbonded interactions between atoms no further than threebonds away within a chain were excluded. Bond lengths wereconstrained using the LINCS algorithm.26 A united-atomtoluene model, where CH and CH3 parts are pseudo atoms,was used.27 The interaction between graphene walls (fixed inspace) and the rest of the system was described by a 6−12Lennard-Jones potential.28 Coulomb interactions were treatedby the particle mesh Ewald (PME) method29,30 with a cutoff of1.5 nm, while the cutoff for the van der Waals interactions was1.7 nm. The temperature was kept at 450 K by the weak-coupling scheme31 with time constants of 0.1−0.5 ps during theinitial stages of equilibration, then it was switched to Nose−Hoover32,33 T-coupling with a time constant of 0.5 ps.Coarse-graining started with the extraction of superatom
centers (see section 2.2 for the description) from the outputconfiguration of the reference atomistic simulation: i.e., the finalcoordinates were used as the initial configurations for the CGsimulations. The initial setup of CG walls was described indetail previously.3 Numerical potential tables for the CGsimulations were generated as follows: All bond lengthdistributions were fitted to Gaussians; dihedral distributions
were smoothed by cubic splines. Bending angle distributions,radial distribution functions (RDFs) and corrected potentialswere smoothed by cubic splines when needed. To conservetotal energy, the minima of the corrected bonded potentialswere shifted to zero, and the corrected nonbonded potentialsbeyond the cutoff (r ≥ 1.7 nm) were set to zero by shifting thewhole potential preserving the shape.3
The technical details in the CG simulations are the same asin atomistic simulations. All CG simulations were carried outusing GROMACS (version 4.0.7)34−36 in NVT ensemblesunder orthorhombic periodic boundary conditions. The timesteps used in the atomistic and CG simulations were 2 and 5 fs,respectively. Production runs lasted for 20 and 40 ns foratomistic and CG simulations, respectively.2.1. Coarse-Graining Methodology. In iterative Boltz-
mann inversion (IBI), atomistic simulations are used ascalibration in terms of the structure.14 The method has beendescribed in detail elsewhere;10,37,38 so we limit ourselves to abrief explanation of the basics. Coarse-graining starts withchoosing an appropriate mapping scheme in which a number ofatoms (typically 10 to 20) are grouped into a superatom (orCG site). One assumes that the total potential energy of theCG system can be separated into bonded and nonbondedinteraction energies so that they can be optimized separately. Itis further assumed that the conformational distributions (bond,angle, and dihedral angle distributions) are not correlated. Notethat this is an approximation since individual distributions aredependent on the full set of potentials through higher-ordercorrelations in dense systems.10 However, experience showsthat one can largely avoid the correlation of at least bond andbending/dihedral angle distributions with an appropriate choiceof mapping scheme/point.4,15 The initial potentials arecommonly obtained by taking the Boltzmann inverse of thetarget probability distributions of the atomistic simulation:
ξ ξ= −V k T P( ) ln( ( ))CGB
target(2)
Here, Ptarget(ξ) is the Jacobian transformed target probabilitydistribution of the corresponding degrees of freedom (bond,angle, dihedral distributions or pair correlation functions g(r)),kB is the Boltzmann constant and T is the temperature at whichthe atomistic simulations were carried out.The distributions calculated at the end of the first trial CG
simulation (0th iteration) will deviate from the targets due topacking effects. This requires the modification of the effectiveinteraction potentials, which is done by adding a correctionterm to the previous trial potential Vi
CG(ξ):
ξ ξξξ
= ++
⎡⎣⎢
⎤⎦⎥V V a k T
PP
( ) ( ) ln( )( )i
CGiCG
iiCG
1 B target(3)
In eq 3, the correction term includes a convergence controlconstant, ai, which normally ranges from 0.05 to 1 dependingon the deviation between the calculated distribution, Pi
CG(ξ),and the target, Ptarget(ξ). The effective potential is iterated untilthe target distribution is reproduced to a sufficient degree. Thedegree of convergence of the effective potentials is measured bya merit function:
∫∫
ξ ξ ξ
ξ ξ=
−f
P P
P
[ ( ) ( )] d
[ ( )] dmeritiCG target 2
target 2(4)
In this study, iterations were continued until fmerit < 0.003.Finally, a linear pressure correction term is usually added to the
long-range part of the optimized CG nonbonded interactionpotentials in case the resulting pressure is different from theatomistic system.10 The correction term is of the form
Δ = − ∼ −⎛⎝⎜
⎞⎠⎟V r A
rr
A k T( ) 1 , 0.1c
B(5)
where rc is the van der Waals cutoff. This step is included only ifone aims also to reproduce the thermodynamics of the systemas pressure correction might cause some deterioration in theconformational distributions. In such a case, the whole processturns into a cycle in which reoptimizations are performed untilboth the structure and pressure are reproduced. In this work,no pressure correction was performed considering the amountof deviation from the target pressure and the fact that the effectof pressure correction is seen mostly in the region beyond r > 1nm, which is not very important for the structural fit.10
2.2. Initial Considerations. The mapping scheme forpolystyrene was directly taken from an earlier publication.14 Asingle type of superatom, which represents a PS monomer, isused. The mapping point (superatom center) is the carbonatom the phenyl ring is attached to. The scheme simplifies thepotential derivation process by minimizing the number ofiterations due to use of a single type of superatom and a well-defined bond length between superatoms that comes with ourchoice of the mapping point. The solvent is toluene where themapping is straightforward: one superatom represents thewhole molecule with its center on its center of mass.3
We represent the surfaces by perfectly crystalline walls ratherthan continuous perfectly smooth surfaces as the latter isknown to increase the diffusive dynamics of the polymers nearthe walls.21 Each CG wall bead possesses the mass of a PSmonomer (104.06 amu). Each surface is composed of twosheets of 1368 beads arranged on a hexagonal lattice. Theclosest distance between beads is 0.254 nm (bond length of aPS monomer). The surfaces are lx = 8.36 nm × ly = 6.86 nm,with a separation distance of 5.095 nm in the z-direction, andfixed in space.3 Although this kind of representation of the CGsurfaces simplifies the procedure by decreasing the totalnumber of iterations, it introduces some unknowns to theprocess. As the CG wall beads are arbitrary, there is noinformation about the interactions between the beads and therest of the system. Furthermore, since there is no mappingwithin the walls, there are no target conformationaldistributions between the wall beads and PS monomers/TOLmolecules to build the effective potentials. The only structuralinformation we have from atomistic simulations is the densityprofiles of PS monomers and TOL molecules. This suggeststhat the aim should be to reproduce the density profiles asclosely as possible together with the target conformationaldistributions in the reference system. Regarding the interactionsassociated with the surfaces, their interaction with each otherwas excluded while the interactions with the rest of the systemwere described by 12−6 Lennard-Jones type potentials. Thechoices of appropriate parameters are explained below.
2.3. Choice of Initial Potentials. The iteration processneeds a reasonable initial guess potential to get started and theuse of Boltzmann inverse of the target conformationaldistribution is common and usually sufficient to start theoptimizations.Chan et al.12 studied the effect of use of different initial
potentials on the final effective potentials and concluded that,although they produce similar RDFs, different initial guess
potentials could reproduce similar effective pair potentials atlow temperatures but not at high temperatures, which suggeststhat the CG potentials obtained by IBI are not unique.
In our implementation of the method, the iterations werestarted with the Boltzmann inverses of the target conforma-tional distributions. However, the system turned into a
Figure 1. Visualization of the system (PS superatoms, yellow; TOL superatoms, blue) (a) at the end of the 1st trial (0th iteration) with the use ofBoltzmann inverse functions of the target conformational distributions as the initial guess potentials. The polymers are in a semiglassy state. (Theinteractions between the walls and PS superatoms are described by previously optimized CG PS−PS effective nonbonded potentials in the CG PSmelt system while the interactions between the walls and TOL superatoms are described by previously optimized CG PS−TOL effective potentialsin the CG dilute PS solution system (see inset of Figure 3). (b) PS micelles solvated by TOL molecules after a few iterations on PS−PS and TOL−TOL potentials. The iterations were started on a semiglassy state like in part a (except that there are no confining walls in this system). The systemturned into a solution only when PS−TOL pair potential was treated or when the dihedral potential was fixed together with manually changing theTOL−TOL potential before all the other pair potentials (not shown). (c) at the end of the 1st trial (0th iteration) using the optimized CG effectivepotentials of the unconfined concentrated solution system as the initial potentials (see section 2.3.2). The interactions between the walls and PSmonomers/TOL molecules are described by LJ potentials and shown in the inset of Figure 3. The walls are located in z-direction confining thesystem (except part b) and not shown for clarity.).
Figure 2. Dihedral distribution (a) and radial distribution functions (b, PS−PS; c, PS−TOL; d, TOL−TOL) between PS monomers and TOLmolecules at the end of 1st trial (0th iteration) with the use of Boltzmann inverse functions of the target conformational distributions as the initialguess potentials. The plot includes the results for three alternative initial trials: (i) with walls that interact with PS superatoms through previouslyoptimized CG effective nonbonded PS−PS potential of a melt3 (denoted as “CG PS−PS”) and with TOL superatoms through previously optimizedCG effective PS−TOL potential of a dilute solution3 (denoted as “CG PS−TOL”), (ii) without walls, and (iii) with walls that interact with the restof the system through 12−6 LJ potentials. See text for explanation.
semiglassy state in the first trial (0th iteration) where somepolymers are ordered. In the following subsections, we discussthe details of this transition, demonstrating that using theBoltzmann inverses of the target distributions as the initialpotentials is not always a convenient approach (for confinedsystems). Afterward, we present the results obtained by use ofan alternative set of initial potentials.2.3.1. Boltzmann Inverse Functions of the Target
Distributions. We started with the Boltzmann-inverse functionsof the target distributions between CG superatoms extractedfrom the atomistic confined concentrated PS solution system.The initial guess potentials between the wall beads and the restof the system were chosen arbitrarily. The optimized CGnonbonded PS−PS potential of the CG melt system wasdirectly used for the interactions between the walls and PSsuperatoms, while the optimized CG PS−TOL potential of theCG dilute solution system was directly used for the interactionsbetween the walls and TOL superatoms (see inset of Figure 3).We should note that the choice of this set of potentials is anarbitrary initial guess for the interactions between the walls andthe polymer solution, as one cannot expect a total agreementdue to the imbalance in entropic components (wall beads fixedin space vs free chains/molecules).At the end of the initial trial (0th iteration), it was observed
that some polymers crystallized in the solution and the systementered a semiglassy state as shown in Figure 1a. This behaviorwas reflected in some conformational distributions. It wasobserved that bond and bending angle distributions were notsignificantly off from the reference distributions (not shown),but the dihedral distribution and the RDFs were, as shown inFigure 2.The transformation of the system into a semiglassy state is
explained by the imbalance between the initial potentials(Figure 3). Overall, the attractive interactions between PSmonomers and TOL molecules cannot compete with thosebetween TOL molecules resulting in toluene becoming a worsesolvent. However, the transformation of the polymers into a
semiglassy state was mostly aided with the dihedral anglepotential (not shown) and purely repulsive nonbondedinteractions between the monomers. The dihedral distributionin Figure 2a indicates that polymers are more extended than inthe reference system, which is probably the reason for theformation of a system in semiglassy state composed of mostlystretched chains.In order to see the effect of walls and their interactions with
PS and TOL superatoms on this phase transition (falling out ofsolution), two more independent initial trial simulations werecarried out: one excluding the walls and one with wallsinteracting with the rest through 12−6 LJ type potentials (thesame ones that were used with the new set of initial potentialsas described in section 2.3.2) (see inset of Figure 3). In both ofthese trials, Boltzmann inverse functions of the targetdistributions were used as the initial potentials for theinteractions between PS and PS/TOL superatoms. However,polymers were still in glassy state. The resulting dihedraldistribution and the RDFs are also shown in Figure 2. It is clearfrom the distributions that the presence of walls, which interactwith the system through attractive forces (even though they areweak), softens the conformational distributions between PS andPS/TOL superatoms. Furthermore, the stronger theseinteractions are, the softer the distributions are. Nevertheless,they were not effective enough as the system was still insemiglassy state, which points that the situation seems to berelated mostly to the imbalance between the initial guesspotentials used for PS−PS, PS−TOL, and TOL−TOLinteractions.At this point, one should manually alter the potentials instead
of pursuing the iteration process in order to save time. This isbecause the initial dihedral and nonbonded distributions are farfrom the target distributions as a consequence of the phasetransformation. One needs to turn it back into a solution first.Furthermore, the speed of convergence is considerably affectedby the order of optimization,10 which is not a priori known inheterogeneous systems, but often the order can be inferredafter a few initial trials.39 The system could be turned back intoa solution only when we worked on the PS−TOL interactions.All attempts to optimize TOL−TOL and PS−PS potentialsonly led to micelles surrounded by TOL molecules (Figure 1b).Alternatively, the system was a solution when the dihedralpotential was fixed together with manually changing the TOL−TOL interactions before all the other nonbonded potentials.As there is no strong theoretical basis for using the
Boltzmann inverse functions of the target distributions in thereference system as the initial guess potentials,12 we completelydiscarded them and used previously optimized CG potentialsfor the unconfined solution system at the same concentration,3
which saved a lot of time as the optimization was completed inonly 18 iterations.
2.3.2. Optimized CG Effective Potentials of the UnconfinedConcentrated Solution System. The iteration procedure wasrestarted using the new set of initial potentials (see Figure 4);i.e., previously optimized (and pressure corrected) CG effectivepotentials of the unconfined PS solution system of the sameconcentration.3 Initial interactions between the CG walls andthe rest of the system were described by 12−6 type LJpotentials. Alternative sets of LJ parameters were tried and theone, which gave the best density profiles was chosen (Figure 5).The system did not phase separate at the end of the initial trial(Figure 1c), because the initial potentials are not substantiallydifferent from the final potentials as seen from Figure 4. The
Figure 3. Boltzmann inverse functions (BI) of the target radialdistribution functions in the atomistic confined concentrated solutionsystem, which were used as the initial potentials for the CGsimulations (0th iteration). Inset: Different sets of initial PS−walland TOL−wall interactions used in the 0th iteration. Same axes labelsare valid for the subplot. “CG PS−PS in melt sys” stands for theoptimized CG effective nonbonded PS−PS potentials of the meltsystem where “CG PS−TOL in dilute sys” stands for the optimizedCG effective PS−TOL potentials of the dilute solution system (seetext).
iterations were continued until both the target conformationaldistributions and the density profiles (not shown) werereproduced sufficiently. However, as mentioned before, theoverall process was a cycle of reoptimizations due to thecorrelations especially between nonbonded interactions. Duringthe process, the interactions between the surfaces and thesolution were manually modified a few times. Final potentialsare shown in Figure 5. We refer the reader to the previouspublication3 for detailed discussions on the differences in finalPS−wall and TOL−wall interactions as well as the resultingdensity profiles.We finalized the coarse-graining process without correcting
the pressure as the deviation (∼−15 bar) from the overall
target pressure (−16 bar, due to the negative lateral pressurecaused by anisotropic P-coupling1) is tolerable compared to theeffort to go through postoptimization. Because of the inherentcomplexity within the system, laborious work was neededfurther to fix both the structure and pressure. As a matter offact, previous experience showed that there is no significantdifference in the overall structure and static properties of thepolymers in a blend with or without pressure correction.3,40
In summary, the results show that, for the coarse-graining ofconfined polymer systems with IBI, using the Boltzmanninverses of the target distributions may not be convenient tostart the optimizations, as it might lead to unintendedconsequences such as phase transformations. This is because
Figure 4. Initial and final [(a) bond, (b) angle, (c) dihedral, (d) nonbonded PS−PS, (e) PS−TOL, and (f) TOL−TOL] distributions/potentials ofthe CG confined concentrated solution system. Initial potentials are the final optimized and pressure corrected CG potentials of the unconfinedconcentrated system of the same concentration and the initial distributions are the resulting structures with the use of these potentials. Finalpotentials are the optimized (not pressure corrected) potentials at the end of the iteration process and the final distributions are the resultingstructures (reproductions of the target structures) obtained by the use of these potentials.
the potentials of mean force (Boltzmann inverse functions)accounts neither for the higher order nonpairwise correlationsnor the PS orientation correlations (induced by theconnectivity of the PS monomers plus the presence of walls)in the system. On the other hand, first coarse-graining the
system without confinement and then using these optimizedpotentials as the initial potentials to start the iterations on theconfined system might be a good alternative.
2.4. Cross-Dependency of the Interactions and theOrder of Optimization. The main assumptions in IBI are thatthe effective potentials are independent of each other10,41 andthat the nonbonded interactions are pairwise.42 However, this isnot strictly true for dense and/or heterogeneous systems. It isknown that individual conformational distributions depend onall potentials in dense systems.10 The situation is even morecomplicated for heterogeneous systems composed of moleculeswith multiple interaction sites (like polymers). In that case, theorientation correlations must also be accounted for.12 There-fore, during the iteration process, corrections on one type ofpotential (and its corresponding distribution) usually alter theother(s) making reoptimizations unavoidable. For practicalpurposes, one should start with potentials that are least affectedby changes to all other ones; i.e., the stiffest ones. This is whythe order of optimization typically follows stretching, bendingangle, nonbonded and dihedral angle.10
In coarse-graining of polymeric systems, the choice of themapping scheme is an important factor, which influences the
Figure 5. Initial guess potentials and final LJ potentials between theCG walls and PS/TOL superatoms.
Figure 6. Contour plots of joint probability distributions between bond length (l) and bending angle (θ), bending angle (θ) and dihedral angle (ϕ),and nonbonded PS−PS RDF (r) and dihedral angle (ϕ) of PS monomers/superatoms for all PS chains in the system (a−c) and for only the chainsclose to the surfaces (d−f). Calculations are performed on the last 2 ns of the atomistic simulations.
correlation of individual distributions. A good mapping schemeprovides at least uncorrelated bond length and bending angledistributions. An appropriate way to check the dependency ofdifferent types of distributions is to calculate the 2-D jointprobability distributions between them. Figure 6 gives insightinto the nature of the correlations in the current systemthrough the joint bond length-bending angle, bending angle−dihedral angle and nonbonded PS−PS RDF−dihedral angleprobability distributions between PS superatoms (monomers).As it is interesting to see if/how these cross-correlations differfor surface segments, the same calculations were performedsolely on the chains near the surfaces (which were determinedas described in section 3.1.2). We should note that the resultsreported in Figure 6 are from atomistic simulations. In order tocheck if the correlations are reproduced sufficiently by our CGmodel, the same calculations were performed on the CGsimulations. A comparison between the atomistic and CGresults is available in the Supporting Information. Briefly, fewslight differences were found in the joint bending angle-dihedralangle distributions; i.e., some regions that were not sampled inthe atomistic simulations were sampled in the CG simulations.This is clearly an artifact of the decoupled bonded distributionsassumption. An additional 1−4 repulsive interaction can beintroduced between PS superatoms to overcome thisproblem.41 However, since the peaks (i.e., most favorableconformations) were reproduced correctly and the deviationsfrom the atomistic results were mostly in rarely sampledregions, we concluded that the current CG force fieldsufficiently reproduces the cross-correlations without furthermodification.Turning back to Figure 6a, it is seen that the bond length and
angle distributions are not completely independent. However,the bond length is very well-defined and its 1-D bond lengthdistribution (Figure 4a) is very close to Gaussian. Because ofthe stiffness of the bond stretching potential, once the bondlength distribution was fixed by optimizing the stretchingpotential in the first iteration, it never needed to bereoptimized. This shows that the bond length distribution isvery weakly correlated (if at all) with the other distributions inthe current mapping scheme. Given that, it is not surprising toobserve no significant differences in the same type of cross-correlation for only the chains near the surfaces (Figure 6d).In contrast, the mapping scheme does not decorrelate
bending and dihedral angles (Figure 6b,e); i.e. in the course ofthe iteration process, modifications in one potential altered thedistribution of the other. Because of the stiffer nature of thebending potential, angle distribution was optimized within afew iterations. For all the chains in the system, we find thatlarger bending angles (θ > 140°) only appear with smallerdihedral angles (θ < 65°) (Figure 6b). However, the peak valuein the angle distribution (θ ∼ 115°), which is mainly correlatedwith the smaller peak (∼±35°) in the dihedral distribution,shows also a weaker correlation with the dihedral peak at∼±110°. In Figure 6e, the joint bending angle-dihedral angleprobability distribution only for the chains near the surfaces isgiven. It is clear that the ranges sampled in both θ and ϕ arevery similar as those in Figure 6b. The most prominentdifference is that the correlations are less localized for surfacechains; i.e. each bending angle in the range 110°−140° iscorrelated with a larger range of dihedrals. Moreover, it isobserved that cis conformations are more strongly correlatedwith bending angles 120−140° in surface chains while thecorrelation between θ ≈ 115° and ϕ ≈ ±35° is weaker than the
overall. Certainly, all of these differences are also seen in theindividual bending angle and dihedral distributions in Figure 10(see section 3.1.1).We also find a close relationship between the first peak of the
PS−PS RDF and the smaller peak value of the dihedraldistribution (±35°). Whenever the dihedral potential at ∼±35°was corrected; the first peak of the PS−PS RDF was fixed aswell. The correlation between the two for all the chains and forsurface segments only is clearly seen in Figure 6, parts c and f.Note that the strength of this correlation in surface chains is 2times more than the average for all chains in the system.Earlier, we mentioned that the order of optimization in IBI is
typically the stretching bond, bending angle, nonbonded, anddihedral angle potentials based on the strength of theinteractions. However, the order of the last two might changefor the first few trials unless the initially calculated dihedraldistribution is close to the target. During our first attempts ofthe implementation of the method using Boltzmann inversefunctions as the initial guess potentials (section 2.3.1), weobserved that it was impossible to improve the first peak of thePS−PS RDF without correcting the dihedral distribution first.Since the initial dihedral distribution was significantly off(Figure 2a), its negative effect on the first peak of PS−PS RDFwas substantial. On the contrary, by using an alternative set ofinitial potentials (section 2.3.2), there was no need fortreatment of the dihedral potential first since all initialdistributions were already close to the targets (Figure 4).Therefore, in case any initial dihedral distribution(s) is/are farfrom the target(s), we suggest that it/they should be iteratedbefore the treatment of nonbonded self-interactions, as thismight be crucial for the optimization of the local region in theRDFs.Figure 6c, also shows that the dihedrals in the range ±∼30°
to ±∼50° are strongly correlated with the structures at largerdistances (∼1.25 nm < r < ∼ 2.1 nm) while this correlation ismissing for surface segments (Figure 6f). For larger dihedralangles (>|∼ 90°|), the correlations are weak as they are muchless sampled than the small ones; Figure 6c,f also show that theweak shoulder at ϕ > |∼150°| (see Figure 4c), which appears tobe a clear peak for surface segments (Figure 10e), is mostlycorrelated with the second peak of the PS−PS RDF. Anotherclear distinction between surface chains and the average is thatthe dihedral angle ranges with which the first two peaks of PS−PS RDF are associated are larger for surface segments resultingin less localized correlations similar to Figure 6e. This is aconsequence of the increase in the probability of cisconformations as well as dihedrals larger than 130° in thechains near the surfaces (Figure 10e). Finally, some additionalcross-correlations (12 Å < r < 20 Å and 100° < ϕ < 140°, etc.)are observed for surface segments.The nature of the correlations between nonbonded
distributions is hard to define explicitly. The correlations arecomplicated due to nonpairwise contributions to all thenonbonded interactions as well as the effect of orientationcorrelations induced by the connectivity of the PS monomersplus the presence of walls. As expected, nonbonded PS pairpotentials are the most demanding with regards to the need forreoptimization. Nevertheless, due to a good set of initial guesspotentials, the optimization process was completed in 18iterations. Finally, we discuss the strength of the effect of PS inthe system with an example. During the initial iterations, weobserved that it was not possible to improve the TOL−TOLRDF without improving the PS−TOL interactions first,
although the initial TOL−TOL RDF was close to the targetRDF (Figure 4f). This is because, effectively, polystyrene rulesthe system due to the connectivity of the monomers. Localchain packing and orientation correlations have a considerableeffect.
3. SIMULATIONS OF CONFINED POLYSTYRENESOLUTION UNDER DIFFERENT DEGREES OFCONFINEMENTS
We now study the effect of confinement level on the structureand dynamics of PS chains first atomistically and then coarse-grained. We compare the results with those in the bulk(unconfined) system of the same concentration. Then we testthe transferability of our previously developed CG confinedconcentrated solution model3 to different confinement levelskeeping the overall concentration of the system and thetemperature constant. We call this model/system the “parentCG confined system/model”, and the reference atomisticconfined concentrated solution system/model the “parentreference confined system/model” from now on (see Table 1).
3.1. Atomistic Simulations. Effect of ConfinementLevel. The methodological details and results of the atomisticsimulations of the parent reference confined system and thebulk system were reported earlier.1 The reference system, with48 PS chains of 15 monomers and 745 TOL molecules, isconfined between opposing graphene surfaces separated by4.51 nm in z-direction. This corresponds to an H/Rgb ratio of
6.23, where H is the distance between the surfaces (Δz) and Rgb
is the average radius of gyration of a PS chain in the bulksolution (composed of 48 PS chains and 778 TOL molecules).1
Keeping the overall effective concentration of the system thesame as the reference (963.3 kg/m3), two additional confine-ment levels are studied: a smaller confinement with H/Rgb =
3.91 (Δz = 2.83 nm) and a larger confinement with H/Rgb =8.62 (Δz = 6.23 nm).The equilibration runs for the smaller confinement system
started with the final configuration of the equilibrated parentsystem except that the graphene surfaces were larger in size(10.806 × 9.359 nm2, see Table 1) to compensate for thedecrease in height. The initial distance between the walls (4.6nm) was decreased to 2.83 nm in 59 steps. At each step thesystem was relaxed for 5 ps after the distance between thesurfaces was reduced by 0.03 nm. Preparation of the initial
configuration of the larger confinement system was morecumbersome. We started again with the final configuration ofthe parent system rotated 90° about the z-, and x-axes, each.This was performed in order to achieve the desired system sizein xy-plane (7.122 × 5.956 nm2, see Table 1) faster. Once thesimulation box x and y dimensions were adjusted by gradualalterations of mainly the y-box dimension followed byrelaxation MD runs with short time steps (dt = 0.1 fs), thewalls were added to the system in z-direction with an initialseparation distance of 11.12 nm. The reason for such a largeinitial separation was to prevent any possible overlaps betweensolution and wall atoms. Then, the distance between the wallswas reduced to 6.23 nm in 166 steps with relaxation runs for 5ps between each reduction of 0.03 nm. In all of thesesimulations, the simulation box dimension in the z-directionwas 50 nm, which was big enough to avoid interactionsbetween periodic images.1,28 All the equilibration runs wereperformed at constant temperature (450 K) controlled by theweak-coupling scheme introduced by Berendsen31 with a timeconstant of 0.1 ps, which was later switched to Nose−HooverT-coupling32,33 (τt = 0.5 ps) for the production runs.Simulations lasted until the density profiles/end-to-enddistance distributions of PS monomers were not significantlychanging during the last few 5 ns increments of the productionrun. Analyses were made on the last 2 ns of the whole trajectoryfor both of the systems. All other technical details are the sameas described in section 2.
3.1.1. Local Structure. Differences in the local arrangementof PS monomers in different confinement levels werecharacterized through bond/angle/dihedral distributions, radialdistribution functions (RDFs) between monomer centers(excluding end monomers) and density profiles. Additionally,the answer to the question “Is the effect of confinement, thusthe surface arrangement of polymers significant for the chainsnear the surfaces in terms of bonded conformationaldistributions?” was searched for. This was achieved byperforming the calculations only for those chains, which werethe nearest to the surfaces during the last 2 ns of thecorresponding trajectories as described in section 3.1.2.As local structure is linked with density profiles, we start our
discussions on them. Figure 7 shows PS and TOL densityprofiles for all confinement levels. Only the largest confinementsystem (Δz = 6.23) differs from the other systems in terms ofPS and TOL surface densities suggesting to categorize systemsin terms of average surface concentrations. PS average surfaceconcentrations are close to each other in systems Δz = 2.83 andΔz = 4.51 (0.174 mg/m2 and 0.168 mg/m2, respectively) whileit is much smaller (0.09 mg/m2) in Δz = 6.23. Similarly, TOLsurface concentrations are close to each other in smallerconfinements whereas there is a pronounced adsorption oftoluene molecules (∼3.5 times of PS) on the walls in Δz =6.23. This can be explained by the order parameter measure-ments (Sz) of the end-to-end vectors (of PS chains), whichgives information about the relative orientation of the chainswith respect to the surface normal:
= ⟨ Θ⟩ −S32
cos12z
2(6)
Here, Θ is the angle between the end-to-end vector and thesurface normal. Sz varies between −0.5 and 1. Values of −0.5, 0,and 1 mean perpendicular, isotropic, and parallel orientation ofend-to-end vectors with respect to the surface normal,respectively. The results in Figure 8 indicate that the chains
Table 1. Details of the Atomistic and CG Confined Systemsa
6.531 5.75 7.04 × 6.097aΔz is the separation distance between the walls and Δzeffective is theeffective distance in z-direction that the solution occupies, which isdetermined based on the density profiles. Each system is composed of48 PS chains (of 15 monomers) and 745 toluene molecules. bSystemdetails for the “parent reference confined system”. cSystem details forthe “parent CG confined system”.
in close proximity with the surfaces are aligned only weaklyparallel to the surfaces, as the order parameters are muchsmaller in magnitude than −0.5. The degree of parallelalignment in the vicinity of the walls decreases with increasingseparation between the walls and almost disappears for thelargest confinement system (Δz = 6.23). It is observed thatonly a small portion of the chains are aligned weakly parallel tothe walls (at 2 nm < z < 2.5 nm), while the rest are alignedweakly normal with respect to the walls (at −2.5 nm > z > −1and 1.5 nm < z < 2 nm of Δz = 6.23). This is the reason behind
the conspicuous localization of toluenes near the surfaces in thelargest confinement system. As PS chains align less parallel tothe surfaces, the space left on the surfaces is preferably filledwith TOL molecules, which are smaller and more mobile.Different alignment of polymers near the surfaces in Δz = 6.23results from the tendency to increase their entropy. Recall thatthe concentration and the interaction between the walls and PSmonomers/TOL molecules are equal in all systems. However,confining surface area is the smallest in Δz = 6.23 system, whilethe separation distance between the walls is the largest (seeTable 1), which provides more freedom to the monomers toarrange/orient themselves in as many ways as possible whencompared to the smaller confinement systems. This is alsodemonstrated in Figure 8; i.e., the chains in the middle of theΔz = 6.23 system show bulklike isotropic orientations notfeeling the confinement. Note that random orientationsdecrease with confinement and finally disappear. The chainsin the center of the smallest confinement system show weaklynormal alignment with respect to the walls.End monomer density profiles also support the order
parameter results, which suggest that the weak degree ofparallel alignment of PS chains near the surfaces increases withthe degree of confinement. In Figure 9, the normalized endmonomer densities (by multiplication with the ratio of 15 total
Figure 7. (a) PS and (b) TOL density profiles along z-direction fordifferent confinement levels. Corresponding average surface concen-trations (SC) in mg/m2 are also given in the labels.
Figure 8. Order parameters (Sz) of end-to-end vectors with respect tothe surface normal for different degrees of confinement.
Figure 9. Comparison of PS density profile with normalized endmonomer density profile for different degrees of confinement. Endmonomer profiles are scaled by 7.5.
monomers/2 end monomers) are compared with the whole PSdensities. It is clear that the end monomers migrate closer tothe surfaces. End monomer adsorption increases with degree ofconfinement for two reasons: first, the surface area gets larger asthe separation distance between the walls decreases allowingmore chains, therefore end monomers, to migrate; second, dueto the geometrical restrictions in z-direction, chains near thewalls adopt relatively more flattened (parallel) conformationscompared to larger confinement systems, again allowing moreend monomers to migrate closer to the surfaces.19 As the chainsshow more flattened conformations near the walls, fewer chainsfrom the rest of the solution will be able to reach the surfacesresulting in reduced total amount of adsorption. This is why adistinct difference in PS surface adsorption was not observedbetween Δz = 2.83 and Δz = 4.51 systems, although theconfining surface areas were quite different.Next, we address the bonded conformational distributions.
Bond distance between monomer centers was found to be0.254 nm and represented by a Gaussian distribution in allsystems including the bulk (Figure 4a). Figure 10a shows theoverall bending angle distributions (all chains) for the three
confinement levels together with the bulk case. It is observedthat the distributions are not significantly different from thebulk, at least for larger confinements. Observation of the overalldihedral distributions (Figure 10b) indicates an increase in bothcompact and more elongated states with confinement. Analysisof static properties (end-to-end distance (Ree), parallel andnormal components of square of radius of gyration and theratio Ree
2/Rg2) of the polymer chains, which characterizes their
conformations/shapes, gives a better idea. The chains haverelatively more elongated conformations in the smallestconfinement system. Comparison of the dihedral distributionsin the bulk and confined systems indicates that the chainsexhibit compact states less in the bulk than under confinement(probabilities of ±35° and 0° are smaller without confinement),which is also indicated by the Ree calculations. The relative freeenergies in Figure 10c show that the dihedral interactions arethe softest in the bulk as the barriers are less pronounced. Notethat almost all barriers are on the order of thermal energy and,therefore, accessible.Comparison of the bonded distributions for the surface
segments with the overall and within different degrees of
Figure 10. Bonded conformational probability distributions between PS monomers for different confinement levels and corresponding relative freeenergies in kT for all PS chains in the system (a−c) and for chains near the surfaces only (d−f). The analyses were made on the last 2 ns of thecorresponding trajectories.
confinement shows clear differences indicating that the surfacelocalization/arrangement of the polymers has a significanteffect. In Figure 10d, it is seen that the bending angledistribution of the surface chains in Δz = 6.23 is significantlydifferent from those in smaller confinements. There is anincrease in the intensity of the peak angle, ∼115°, and aconsequent decrease in the probabilities of larger angles (θ >130°), which can be explained again by the order parameterresults. As the surface chains show almost no parallel alignmentin Δz = 6.23, the driving force for adopting larger bendingangles is diminished. Note that the angle distributions arealmost the same in Δz = 2.83 and Δz = 4.51 due to similar PSsurface concentrations and alignment behavior near thesurfaces.Inspection of Figure 10e reveals that dihedral distributions
are significantly different for surface chains compared to theoverall for all the confinement levels studied. Smallerconfinement systems (Δz = 2.83 and Δz = 4.51) show similarbehaviors in terms of the change in dihedrals (again due to theirsimilar weakly parallel alignment on the surfaces); i.e., anincrease in the probabilities of cis conformations and dihedralangles larger in magnitude than ∼±150° is observedaccompanied by a decrease in the intensities of ∼±35°. Incontrast, when there is almost no parallel alignment near thesurfaces as in Δz = 6.23, it seems like there is no driving forcefor the segments to adopt additional larger dihedrals. Weobserve an increase in the probabilities of only the two peakvalues (±35° and ±110°) together with a significant decrease incis conformations. The effect of arrangement of the chains nearsurfaces is also observed in the corresponding relative freeenergies (Figure 7f). One can easily notice how different theyare in systems Δz = 4.51 and Δz = 6.23 for surface chains whilethey are alike for all the chains (Figure 7c).Figure 11a shows the local packing of PS monomers through
radial distribution functions between nonbonded monomers(excluding up to the third nearest bonded neighbors). Allstructures of the bulk are reproduced at the same positions inall confined systems. The probability of finding the fourthnearest neighbor to a monomer in a chain plus the first nearestneighbor from other chains (1st peaks) is the same regardlessof the degree of confinement. The probability of finding farthermonomers seems to decrease as Δz increases. In all confinedsystems, intensities are smaller than in the bulk. This is due tothe finite size effect introduced by the presence of walls, i.e. themonomers near the walls in the confined systems inevitably willhave fewer neighbors (from other chains) at intermediate andlarger distances than the ones at the center of the system.1 Thisis also the reason for negative slopes in the RDFs. The finitesize effect increases with the degree of confinement and is thelargest in the smallest confinement system (Δz = 2.83), asexpected. Finally, the PS−PS RDF in the largest confinementsystem (Δz = 6.23) is close to the bulk at intermediatedistances (∼1 nm ≤ r ≤ ∼1.5 nm). This indicates that mostchains do not feel the effect of confinement as suggested by theorder parameters of end-to-end vectors (Figure 8). The chainsin the center of the system are randomly oriented like in anunconfined system.Radial distribution functions between monomers and solvent
molecules characterize the differences in solvation shells aroundPS monomers (Figure 11b), while TOL−TOL RDFs monitorthe local packing of toluenes around themselves (Figure 11c).All solvation shells are reproduced at the same locations in eachsystem including the bulk, as one would expect TOL molecules
to approach PS monomers at the same distances. Note that thesame finite-size effects are observed in these RDFs as well; i.e.,lower intensities and sharper negative slopes in the tails withincreasing confinement.
3.1.2. Static Properties. Static properties of PS chains wereinvestigated by means of end-to-end distances (Ree), radii ofgyration (Rg) and persistence lengths (lp) for each system(Table 2). The data for the parent atomistic confined systemand the unconfined system were reported earlier.1 The resultsshow that Rg is largest in the bulk, while Ree is largest in thesmallest confinement system (Δz = 2.83). The ratio Ree
2/Rg2
provides an estimate for the conformation of a chain; a ratio of6 represents a random walk, a ratio smaller than 6 indicates amore compact conformation, while a ratio bigger than 6indicates a more elongated conformation.1,43 Therefore, ourchains are compact in all systems; they are most elongatedunder strongest confinement. Elongation increases weakly withdegree of confinement. In order to take a closer look to thedimensions of the chains relative to the surfaces, the square ofthe parallel ((Rgx
2 + Rgy2)/2) and normal components (Rgz
2) ofthe radius of gyration were calculated (Table 2). The resultsindicate that the average chain dimensions parallel to the
Figure 11. Radial distribution functions between (a) PS monomers(RDF PS−PS), (b) PS monomers and TOL molecules (RDF PS−TOL), and (c) TOL molecules (RDF TOL−TOL) for differentconfinement levels.
surfaces does not change with confinement, while the averagedimensions normal to the surfaces are slightly, though notsystematically, decreased. These results are in good agreementwith the literature for both simulations and experiments.44−47
Since the systems studied are not ultraconfined (as the smallestH/Rgb ratio is 3.9), significant changes in the dimensions of the
chains normal to the surfaces would not be expected.The changes in chain conformations/dimensions with
respect to the distance from the surfaces were also investigated.To achieve this, the distance between the walls in z-directionwas divided into slices of 0.6 to 1.5 nm in each confined system.For the last 2 ns of each production run (which is much smallerthan the diffusion times of chains that are ∼20 ns for Δz = 4.51and Δz = 6.23 systems and ∼100 ns for Δz = 2.83), chainswere indexed into groups according to the slice that theircenters of mass were found. The static properties were thencalculated for each group. The changes in end-to-end distances(Ree), normalized parallel ((Rgx
2 + Rgy2)/2(Rg
2)) and normal
components (Rgz2/Rg
2) of the radii of gyration are given inFigure 12, parts a−c, respectively. It is observed that Ree and(Rgx
2 + Rgy2)/2(Rg
2) get smaller from the middle of the systemtoward the surfaces, while Rgz
2/Rg2 gets larger. The trend is
rather pronounced for the smallest confinement system (Δz =2.83), while it is less prominent for the largest confinementsystem (Δz = 6.23). Evidently, the results are supporting thedata in Table 2. We should note that the trend seen in Figure12, parts a−c, is contrary to some literature results on confinedpolymer melts,19,20,22 which observed that the chains wereelongated in the x−y plane, while they were compressed in thenormal direction toward the surfaces. However, this was mainlybecause the chains adopted completely flattened conformationsnear the surfaces. In contrast, we see that the chains werealigned only weakly parallel to the surfaces even in the smallestconfinement system and no transformation from a spherical toan oblate conformation near the walls existed. There may be anumber of factors determining the behavior of the polymersclose to the surfaces such as the structure and chemistry of the
Table 2. Static Properties of PS Chains under Different Confinement Levels and in the Unconfined (Bulk) System
aPersistence lengths were calculated excluding the end monomers. The bond length between the backbone carbons in a PS chain is 0.153 nm.Standard errors of all the data are stated as well.
Figure 12. Static properties of the chains as a function of the distance from the walls for different degrees of confinement. (a) End-to-end distance(Ree). (b) Normalized parallel component of the radius of gyration. (c) Normalized normal component of the radius of gyration. (d) Persistencelength. Standard errors are given as error bars. Centers of the systems are at z = 0.
walls, its interactions with the polymer, chemistry and size ofthe polymer, degree of confinement, etc. Possibly the presenceof toluenes causes the difference in the orientation of PS chainsnear the surfaces in our system, compared to that in a confinedpolymer melt. As, there are more components in a solutionthan in a melt; there is an adsorption competition to decreasethe free energy in the system. Considering dissimilar mobilitiesof the molecules resulting from the differences in sizes andpolymer connectivity of the monomers in polymer chains, thepreferred adsorption of toluenes on the surfaces is apprehend-able.Figure 12d shows the change in persistence length as a
function of distance from the surfaces. We observe thatpersistence lengths are larger for the chains, which are closer tothe surfaces in all systems. As the persistence length is ameasure of flexibility, it is not surprising to see such an increasecloser to the walls; i.e., chains become less flexible due to thegeometrical restrictions near the surfaces.3.1.3. Dynamic Properties. In order to investigate the effect
of confinement on the global relaxation of PS chains, we useend-to-end vector autocorrelation functions (ACFs). Figure13a shows the ACFs (calculated using second order Legendrepolynomials) of PS chains under confinement and in the bulk.The results for the bulk and Δz = 4.51 system have beenreported previously.3 It is seen that the chains are fully relaxedin all systems as all ACFs decay to zero. Relaxation is the fastestin the bulk, while it slows down with degree of confinement, asthe rotational motion is dramatically restricted close to surfaces.
Since the systems studied here have the same concentration,the number of chains in close contact with the surfacesincreases as confinement increases, leading to a decrease in thenumber of freely rotating/translating chains. Similar effects onthe relaxation dynamics of polymer chains have been reportedin the literature.19,20,48 However, we should note that theystudied the effect of pore size while keeping the parallelcomponent of the pressure constant to ensure that the solutionis in equilibrium with the bulk. This was not our main concernas the primary objective of this study is to test the applicabilityof our CG confined concentrated solution model to differentconfinement levels at constant concentration (and temper-ature).The effect of confinement on the translation of PS chains is
captured by mean square displacements (MSD) and diffusioncoefficients. In order to reduce end effects, MSDs (Figure 13b)were calculated for the central five monomers of a chain.Diffusion coefficients were calculated based on MSDs (Table3). The results indicate similar behavior in the diffusive motionas in the chain relaxation; i.e. diffusion is fastest in the bulk anddecreases dramatically with confinement.
3.2. Coarse-Grained Simulations. Transferability OfThe Confined Solution Model To Different ConfinementLevels. Here we test the transferability of our parent CGconfined model on different confinement levels; we haveemployed the model on systems Δz = 2.83 and Δz = 6.23, ofwhich the results of atomistic simulations are reported above.The details of the initial configuration preparation for the newCG systems and the simulation parameters are explained below.
3.2.1. Simulations Details. The preparation of the initialconfiguration, choice of the mapping scheme/point, wallsuperatoms and the simulation parameters for the parent CGconfined system were described in detail in a previouspublication3 and summarized in section 2 together with thetechnical considerations during the optimization process. Here,we describe how the CG confined systems of smaller and largerconfinement levels were generated. We use the mappingscheme described in section 2.2 for atactic polystyrene. CGwalls are made of beads of the mass of a PS monomer (104.06amu) on a hexagonal lattice. For the smaller confinementsystem (Δz = 2.83), each surface is composed of 2400 beads,while for the larger confinement system (Δz = 6.23) eachsurface is made of 1024 beads. In the formation of our CGsurfaces, we paid attention to reproduce the correspondingreference systems’ wall dimensions as closely as possible.However, due to the limitations imposed by the choice of ourCG wall beads, a perfect match with the reference values couldnot be achieved. Though, they were sufficiently close to theatomistic surfaces (see Table 1). The separation distancesbetween the walls (as defined by the centers of wall beads)were set as 3.21 and 6.53 nm for the smaller and largerconfinement systems, respectively, considering the larger
Figure 13. Dynamic properties of PS under different degrees ofconfinement (and in bulk) in atomistic simulations: (a) end-to-endvector autocorrelation functions (C2(t)) based on second orderLegendre polynomials; (b) mean square displacements (MSDs) of thecenter of mass of the central five PS monomers.
Table 3. Diffusion Coefficients of PS Chains as a Function ofConfinement
effective sizes of CG superatoms and the need to reproduce theeffective (true) concentration of the reference system.3 Table 1also shows the effective distances between the CG walls (asdetermined by the density profiles along the z-direction), whichthe effective (true) concentration calculations of our CGsystems were based on.Initial configurations to the CG simulations were prepared by
the extraction of superatom centers from the outputconfigurations of their corresponding reference atomisticsimulations for both systems. The parent confined solutionsystem model was used in all simulations. The production runsfor both of the systems lasted for 50 ns and the analyses weremade in the last 5 ns of the whole trajectory.3.2.2. Reproduction of the Local Structure. Reproduction
of the local structure was checked by calculating bonded andnonbonded conformational distributions and density profiles.We start our discussion on the results with density profiles asthey assist in discussion of the reproduction of the conforma-tional distributions. Figure 14 shows density profiles obtainedin the CG simulations and reference atomistic simulations. Forthe smallest confinement system, the density of PS monomersnear the surfaces is reproduced well while the density in the
center of the system is overestimated. There is a slightunderestimation of TOL density profile; but reproduction issatisfactory. The density profile of the whole system (Figure14c) indicates that the layering behavior of the system isproduced correctly; however the system has moved a littletoward the middle compared to the reference atomistic system.This is obviously due to the localization of PS chains in thecenter of the system. The reason for that might be the slightlydecreased solvation capability of TOL molecules as seen inFigure 16c. As the PS monomers are less solvated by toluenes,the nonbonded interactions between each other become moreeffective leading to formation of clusters.In the largest confinement system, the density of PS
monomers near the surfaces is overestimated, while the densityof PS in the middle of the system is underestimated.Correspondingly, the density of TOL molecules near thewalls is underestimated while it is overestimated in the middle.The reason for this behavior becomes clear when we comparethe reference (atomistic) PS and TOL density profiles of thissystem with the parent confined system (see Figure 7). Thedensity of PS near the walls is much lower and the density ofTOL molecules near the walls is much larger than in the parentconfined system (Δz = 4.51). We remind that the whole CGforce field was optimized based on the structure of theatomistic parent confined system. Therefore, the PS-wallinteractions (which are obviously too strong) and TOL-wallinteractions (too weak) in CG simulations of the largerconfinement system led to overestimation/underestimation ofthe PS/TOL densities closer to the walls. On the other hand,the estimated densities near the surfaces are good in thesmallest confinement system, which is because the surfaceconcentrations of both PS and TOL in the atomistic Δz = 2.83system are not quantitatively much different than the atomisticparent system (see the labels in Figure 7).The bonded conformational distributions are shown in
Figure 15 with end monomers excluded. It is clear that bonddistributions in both of the CG confined systems arereproduced perfectly by the parent CG confined model (Figure15a,b). In an earlier study, we have shown that bond lengthbetween PS monomers is well-defined regardless of theenvironment that the polymers are in (a melt, dilute andconcentrated solution, and a confined concentrated solution).3
Also bending angle distributions obtained from the CGsimulations are in very good agreement with their correspond-ing reference structures (Figure 15c,d). Finally, as torsioninteractions are the softest bonded interactions this is a morecritical test (Figure 15d,e). The deviations from the referencestructures are still within 0.6% as measured by the meritfunction (eq 6).Next, we address the capability of our parent CG confined
model to reproduce the nonbonded distributions. Parts a, c,and e of Figure 16 show the RDFs of the smallest confinementsystem (Δz = 2.83) and the corresponding reference RDFs.The nearest neighbors to a PS monomer (1st two peaks in PS−PS RDF) are reproduced very well. However, a slightunderestimation of the probability density of farther monomersis observed in the region ∼1 < r < ∼ 1.75 nm. This might bedue to the more localized organization of PS chains in themiddle of the system compared to the reference system asshown by the density profile in Figure 14a. As the chains clusterin the center, deeper and wider wells are formed in the densityprofile, which points to a deficiency of PS monomers/chains inthat region. Therefore, we can say that there are less distant
Figure 14. Reference atomistic versus CG: (a) PS, (b) TOL, and (c)PS + TOL density profiles (in direction of the normal to the surfaces)for different degrees of confinement.
neighbors to a monomer in the CG system than in thereference, leading to the discrepancy in PS−PS RDFs. Lesssignificant deviations from the references are observed in PS−TOL and TOL−TOL RDFs. Figure 16c suggests that solventquality of TOL is slightly decreased in the CG system, due tothe more localized organizations of PS chains in the middle; i.e.toluenes do not have the same degree of freedom to approachPS monomers as in the reference atomistic system.
For the PS−PS RDF in the largest confinement system (Δz= 6.23), we observe that the reproduction of local structures isvery good (except the minor discrepancy in the first peak,which is probably due to assigning spherically symmetric CGpotentials to PS). The discrepancy at larger distances is greaterthan in the smallest confinement system. The reason for thislarger underestimation in the probability density of the farthermonomers may be the overestimated PS densities near thewalls and underestimated densities in the middle of the system
Figure 15. Reproduction of the reference (atomistic) bonded conformational distributions of the smallest (Δz = 2.83) and the largest confinement(Δz = 6.23) systems by the parent CG confined model. Key: (a, b) bond length; (c, d) bending angle; (e, f) dihedral angle probability distributions.
(Figure 14a). Similar to the case in the smallest confinementsystem, there are much less distant neighbors to the monomersin the CG system than in the reference system. This effect ismore significant in the largest confinement system, becauseoverestimation of the PS densities near walls is significantly
greater compared to that in the CG Δz = 2.83 system. Weobserve that the reproduction of PS−TOL RDF is excellent.This might be due to a balance between the effect of increase inthe density of PS monomers near the walls (and the deficiencyin the middle) and the effect of increase in the density of TOL
Figure 16. Reproduction of the reference (atomistic) nonbonded conformational distributions of the smallest (Δz = 2.83) and the largestconfinement (Δz = 6.23) systems by the parent CG confined model. Key: (a, b) PS−PS; (c, d) PS−TOL; (e, f) TOL−TOL radial distributionfunctions.
molecules in the middle (and the deficiency near the walls).Finally, we observe a slight overestimation in the packing oftoluenes around themselves at larger distances (r > 1 nm)(Figure 16f).In summary, we have observed that the reproduction of the
local structure in the atomistic Δz = 2.83 system by our parentCG confined model works fairly well. We believe this is becausedensity profiles/surface concentrations in both of the atomisticsystems (Δz = 2.82 and Δz = 4.51) are similar. In contrast,reproduction of the local structure in the atomistic Δz = 6.23system was rather poor. Although the conformationaldistributions do not deviate more than 0.9% from thereferences, the density profiles show significant differences.This is because of the similar argument that surfaceconcentrations and degree of alignment of the chains nearthe surfaces in two of the reference systems (Δz = 6.23 and Δz= 4.51) are different from each other. Therefore, the interactionpotentials (between the walls and the monomers/molecules)optimized based on the structure on one system may be toostrong or not strong enough to capture the reference structureof the other system, even at the same concentration.3.2.3. Reproduction of the Global Structure. In section
3.1.2, the static properties of PS chains were reported based onall-atom data. For a CG system all static properties arecalculated based on superatom centers. Our mapping schemeassigns the Carbon atoms at which the phenyl rings areattached as superatom centers. Therefore, calculations of end-to-end distances are based on these last carbon atoms at bothends and will be shorter, since the actual atoms are further apartfrom the superatom centers.3 In order to compare the atomisticwith CG data, we recalculated the static properties of PS chainsin the confined atomistic systems based on CG mapping points(Table 4 “scaled atomistic data”).
Comparison of the coarser-scaled values from the atomisticsimulations with the calculated values from CG simulationsshow that the global structure of PS are slightly overestimatedfor all CG systems, which is probably due to the increased endeffects with coarse-graining. As PS chains used in this study areoligomers (composed of 15 monomers), it is expected that endmonomers show some excluded volume effects. This effect willbe larger in a CG system, because the end monomers(superatoms) are larger as they are treated as perfect spheresthroughout the simulations.3 Considering the same degree ofoverestimation in the parent confined model (in comparison to
its atomistic values), we can say that the estimation of staticproperties for the CG Δz = 2.83 and Δz = 6.23 systems arereasonable.We should note that the Ree
2/Rg2 data in the last column of
Table 4 do not represent the correct conformation of the chainsas they are calculated based on the mapping points. Theyindicate that the chains are in extended conformations (becausethe ratio is greater than 6) although they are in more compactform in reality (based on all-atom data, see column 4 of Table2). Therefore, one should be careful not to make conclusionsabout the conformations of polymer chains based solely on CGdata but should also seek for the atomic scale results, especiallyfor oligomers.
4. CONCLUSIONSRecently, we developed a coarse-grained (CG) model for aconcentrated polystyrene (PS) solution under confinementusing the iterative Boltzmann inversion (IBI).3 Reproductionsof the local and global structure of the polymers as well as theefficiency of the model in terms of dynamics were discussed indetail. In this study, we establish the limits of the technique inthe coarse-graining of confined polymeric systems. The aim is2-fold: to get a better insight about the limits of the method bygoing deeper into the technical considerations and challengesfaced in the course of the optimization process, and toinvestigate the transferability of the CG model developed onthat specific system (referred as the “parent CG confinedmodel”) on similar systems at constant concentration andtemperature, but at different degrees of confinement.In the first part of the manuscript, we refer to some technical
points and difficulties encountered in the implementation ofthe method on our system. Among those, the choice of theinitial guess potentials is an important one. We observed thatwith the use of Boltzmann inverse functions of the targetconformational distributions from the atomistic simulations asthe initial guess potentials, which is the common practice in theimplementation of IBI, the system turned into a semiglassystate (polymers were crystallized in the solution). Alternatively,the system was still a solution when a different set of initialguess potentials was used; i.e. previously optimized CGeffective potentials of the same system without confinement.3
Clearly, this was due to the incorrect dihedral potential andimbalance between the initial guess potentials used for PS−PS,PS−TOL, and TOL−TOL interactions in the formerimplementation, as the potentials of mean force (Boltzmanninverse functions) account neither for the higher ordernonpairwise correlations nor the PS orientation correlationsin the system. Therefore, we suggest that, for coarse-graining aconfined polymeric system with IBI, it might be a good idea tocoarse-grain the same system without confinement first. Onecan use the optimized potentials as the initial guess potentialsfor the iterations on the confined system then since there is nostrong theoretical basis in IBI for the use of Boltzmann inversefunctions as the initial potentials.12 Apart from this, we alsodiscuss how the cross-correlations differ for only the surfacesegments compared to the overall and the order ofoptimization. Typically, the order of optimization is stretchingbond, bending angle, nonbonded and dihedral angle potentialsbased on the strength of the interactions. However, experienceshowed that, if the initial dihedral distribution is substantiallydifferent from the target distribution, it would be beneficial tochange the order of the last two terms for the first fewiterations, as this might be crucial to correct the radial
Table 4. Reference (Atomistic) Coarser-Scaled StaticProperties of the PS Chains versus Values Obtained with theParent CG Confined Model for Each Confinement Level
distribution function (RDF) between PS monomers in localdistances.The test of transferability of the parent CG confined model
to different degrees of confinement (at constant concentrationand temperature) is the other goal of the study. Specifically, weare interested to see if a CG force field developed for a confinedsystem by a purely structure-based coarse-graining technique,such as iterative Boltzmann inversion (IBI), is sensitive tochanges in the degree of localization or arrangement ofpolymers near the surfaces although the concentration is keptconstant. For this purpose, we have performed referenceatomistic simulations on systems of two different confinementlevels; i.e., systems with a smaller and a larger confinement level(compared to the parent reference confined system). Thedifferences in the structure and dynamics of the polymers incomparison to the parent reference confined system and anunconfined (bulk) system of same concentration are alsoaddressed.Local structures of the polymers were characterized through
bond/angle/dihedral angle distributions, radial distributionfunctions (RDFs) and density profiles, while the globalstructures were described in terms of end-to-end distances(Ree) and radii of gyration (Rg). Orientation of chains withrespect to the surface normal was captured by the calculationsof order parameter for end-to-end vectors of the polymers.Density profiles indicated that the degree of localization of PSand toluene (TOL) molecules near the surfaces weresignificantly different in the largest confinement system thanin the rest. This was due to the relatively (but still weakly)more normal orientation of PS chains along the surfaces, whichled to a preferential localization of TOL molecules near thesurfaces. Analysis of the static properties indicated that thechains were compact (compared to a Gaussian chain) in allsystems including the bulk. However, they showed moreelongated conformations as the degree of confinementincreased. This does not mean that the chain dimensionsparallel to the surfaces were increased as no significant changesin average chain dimensions either parallel or normal to thesurfaces were observed. For a closer look on the effect ofconfinement on chain dimensions, the changes in chainconformations/dimensions with respect to the distance fromthe surfaces were also investigated. It was observed that theend-to-end distance and the parallel component of the radius ofgyration slightly decreased while the normal component of theradius of gyration slightly increased from the middle of thesystem toward the surfaces with the trend being less prominentas the degree of confinement decreases. The results arecontrary to literature data on confined polymer melts, wherethe chains adopted fully parallel (flattened) orientations in closeto the surfaces.19,20,22 Though, our order parameter resultsshowed that the PS chains were aligned only weakly parallel tothe surfaces even in the smallest confinement system. Wesuppose this is a consequence of the preferred localization ofTOL molecules in the vicinity of the surfaces resulting from theadsorption competition to decrease the total free energy.Therefore, we believe this study is an important contribution tothe understanding of the differences in polymer conformations/orientations close to surfaces in a concentrated solution fromthat in a melt. To the best of our knowledge, there is nocomputational study that explores this difference. In addition tothe static properties, rotational and translational dynamics of PSchains were examined through end-to-end vector autocorrela-tion functions and mean-square displacements. It was observed
that relaxation of end-to-end vectors and diffusion of the chainswere drastically slowed down by the presence of walls.The transferability of our parent CG confined model to
different confinement levels (keeping the concentration andtemperature constant) was tested by employing the parentforce field in CG simulations of the above-mentioned systems.Results showed that reproducibility of the local structure in thesmallest confinement system was fairly well. We believe this isbecause the degree of arrangement of PS chains and TOLmolecules close to the surfaces in the reference atomisticsmaller confinement system is similar to that of the parentconfined atomistic system (as indicated by the density profiles).In contrast, reproduction of the local structure in the largestconfinement system by our parent CG confined model waspoor, which is because both PS and TOL density profiles weredifferent from those of the parent reference confined system.Therefore, interaction potentials between the walls and themonomers/TOL molecules, which were optimized based onthe structure of the parent system, failed to mimic the realinteractions between the walls and the rest of the largerconfinement system. In conclusion, our results show that thedegree of arrangement of monomers/molecules near thesurfaces is an important factor affecting the transferability of aCG force field, which is developed by a structure-based coarse-graining technique such as IBI, to different degrees ofconfinement.
■ ASSOCIATED CONTENT*S Supporting InformationComparison of the overall joint conformational probabilitydistributions (of PS monomers/superatoms) in the atomisticsimulations and in coarse-grained simulations. This material isavailable free of charge via the Internet at http://pubs.acs.org.
■ ACKNOWLEDGMENTSWe would like to gratefully acknowledge Dr. David M. Huangand Dr. Petra Tras̈kelin for providing scripts used for dataanalysis and Dr. Halil Mecit Oztop for his support in thestatistical analysis of the data. This work was supported by theU.S. Department of Energy, Office of Science, Basic EnergySciences (grant number DE-FG02-06ER46340). BB was alsopartially supported by The Scientific and TechnologicalResearch Council of Turkey (TUBITAK).
■ REFERENCES(1) Bayramoglu, B.; Faller, R. Phys. Chem. Chem. Phys. 2011, 13 (40),18107−18114.(2) Advincula, R. C.; Brittain, W. J.; Caster, K. C.; Ruhe, J., PolymerBrushes. In Wiley-VCH: Weinheim, Germany, 2004.(3) Bayramoglu, B.; Faller, R. Macromolecules 2012, 45, 9205−9219.(4) Faller, R. Polymer 2004, 45 (11), 3869−3876.(5) Theodorou, D. N. Chem. Eng. Sci. 2007, 62 (21), 5697−5714.(6) Sun, Q.; Faller, R. Macromolecules 2006, 39 (2), 812−820.(7) Megariotis, G.; Vyrkou, A.; Leygue, A.; Theodorou, D. N. Ind.Eng. Chem. Res. 2011, 50 (2), 546−556.(8) Milano, G.; Goudeau, S.; Muller-Plathe, F. J. Polym. Sci., Part B:Polym. Phys. 2005, 43 (8), 871−885.
(9) Soper, A. K. Chem. Phys. 1996, 202, 295.(10) Reith, D.; Putz, M.; Muller-Plathe, F. J. Comput. Chem. 2003, 24(13), 1624−1636.(11) Henderson, R. L. Phys. Lett. A 1974, 49, 197−198.(12) Chan, E. R.; Striolo, A.; McCabe, C.; Cummings, P. T.; Glotzer,S. C. J. Chem. Phys. 2007, 127 (11).(13) Ghosh, J.; Faller, R. Mol. Simul. 2007, 33 (9−10), 759−767.(14) Sun, Q.; Faller, R. Comput. Chem. Eng. 2005, 29 (11−12),2380−2385.(15) Sun, Q.; Ghosh, J.; Faller, R. In Coarse-Graining of CondensedPhase and Biomolecular Systems; Voth, G. A., Ed.; CRC Press: BocaRaton, FL, 2009; pp 69−82(16) Ghosh, J.; Wong, B. Y.; Sun, Q.; Pon, F. R.; Faller, R.Mol. Simul.2006, 32 (3−4), 175−184.(17) Qian, H.-J.; Carbone, P.; Chen, X.; Karimi-Varzaneh, H. A.;Liew, C. C.; Muller-Plathe, F. Macromolecules 2008, 41 (24), 9919−9929.(18) Carbone, P.; Varzaneh, H. A. K.; Xiaoyu, C.; Muller-Plathe, F. J.Chem. Phys. 2008, 128 (6).(19) Eslami, H.; Karimi-Varzaneh, H. A.; Muller-Plathe, F. Macro-molecules 2011, 44 (8), 3117−3128.(20) Aoyagi, T.; Takimoto, J.; Doi, M. J. Chem. Phys. 2001, 115 (1),552−559.(21) Varnik, F.; Binder, K. Int. J. Mater. Res. 2009, 100 (11), 1494−1502.(22) Varnik, F.; Baschnagel, J.; Binder, K. Eur. Phys. J. E 2002, 8 (2),175−192.(23) Eslami, H.; Karimi-Varzaneh, H. A.; Muller-Plathe, F. Macro-molecules 2011, 44 (8), 3117−3128.(24) Baschnagel, J.; Varnik, F. J. Phys.: Condens. Matter 2005, 17 (32),R851−R953.(25) Sun, Q.; Faller, R. J. Phys. Chem. B 2005, 109 (33), 15714−15723.(26) Hess, B.; Bekker, H.; Berendsen, H. J. C.; Fraaije, J. J. Comput.Chem. 1997, 18 (12), 1463−1472.(27) Schuttelkopf, A. W.; van Aalten, D. M. F. Acta Crystallogr., Sect.D: Biol. Crystallogr. 2004, 60, 1355−1363.(28) Traskelin, P.; Kuhl, T. L.; Faller, R. Phys. Chem. Chem. Phys.2009, 11 (47), 11324−11332.(29) Darden, T.; York, D.; Pedersen, L. J. Chem. Phys. 1993, 98 (12),10089−10092.(30) Essmann, U.; Perera, L.; Berkowitz, M. L.; Darden, T.; Lee, H.;Pedersen, L. G. J. Chem. Phys. 1995, 103 (19), 8577−8593.(31) Berendsen, H. J. C.; Postma, J. P. M.; Vangunsteren, W. F.;Dinola, A.; Haak, J. R. J. Chem. Phys. 1984, 81 (8), 3684−3690.(32) Nose, S. Mol. Phys. 1984, 52 (2), 255−268.(33) Hoover, W. G. Phys. Rev. A 1985, 31 (3), 1695−1697.(34) Hess, B.; Kutzner, C.; van der Spoel, D.; Lindahl, E. J. Chem.Theory Comput. 2008, 4 (3), 435−447.(35) Van der Spoel, D.; Lindahl, E.; Hess, B.; Groenhof, G.; Mark, A.E.; Berendsen, H. J. C. J. Comput. Chem. 2005, 26 (16), 1701−1718.(36) Lindahl, E.; Hess, B.; van der Spoel, D. J. Mol. Model. 2001, 7(8), 306−317.(37) Theodorou,D. N. In Computer Simulations in Condensed MatterSystems: From Materials to Chemical Biology; Springer: Berlin, 2006.(38) Peter, C.; Kremer, K. Soft Matter 2009, 5 (22), 4357−4366.(39) Sun, Q.; Faller, R. J. Chem. Theory Comput. 2006, 2 (3), 607−615.(40) Faller, R.; Schmitz, H.; Biermann, O.; Muller-Plathe, F. J.Comput. Chem. 1999, 20 (10), 1009−1017.(41) Harmandaris, V. A.; Adhikari, N. P.; van der Vegt, N. F. A.;Kremer, K. Macromolecules 2006, 39 (19), 6708−6719.(42) Binder, K.; Paul, W.; Virnau, P.; Yelash, L.; Muller, M.; GonzalezMacDowell, L. In Coarse-Graining of Condensed Phase and BiomolecularSystems; Voth, G. A., Ed.; CRC Press: Boca Raton, FL, 2009; pp 399−414.(43) Doi, M.; Edwards, S. F., The Theory of Polymer Dynamics;Clarendon Press: Oxford, U.K., 1986.
(44) Jones, R. L.; Kumar, S. K.; Ho, D. L.; Briber, R. M.; Russell, T.P. Nature 1999, 400 (6740), 146−149.(45) Jones, R. L.; Kumar, S. K.; Ho, D. L.; Briber, R. M.; Russell, T.P. Macromolecules 2001, 34 (3), 559−567.(46) Winkler, R. G.; Gerstmair, A.; Reineker, P.; Matsuda, T.; Yoon,D. Y. Int. J. Quantum Chem. 1994, 52 (2), 437−456.(47) Pakula, T. J. Chem. Phys. 1991, 95 (6), 4685−4690.(48) Eslami, H.; Muller-Plathe, F. J. Phys. Chem. B 2009, 113 (16),5568−5581.


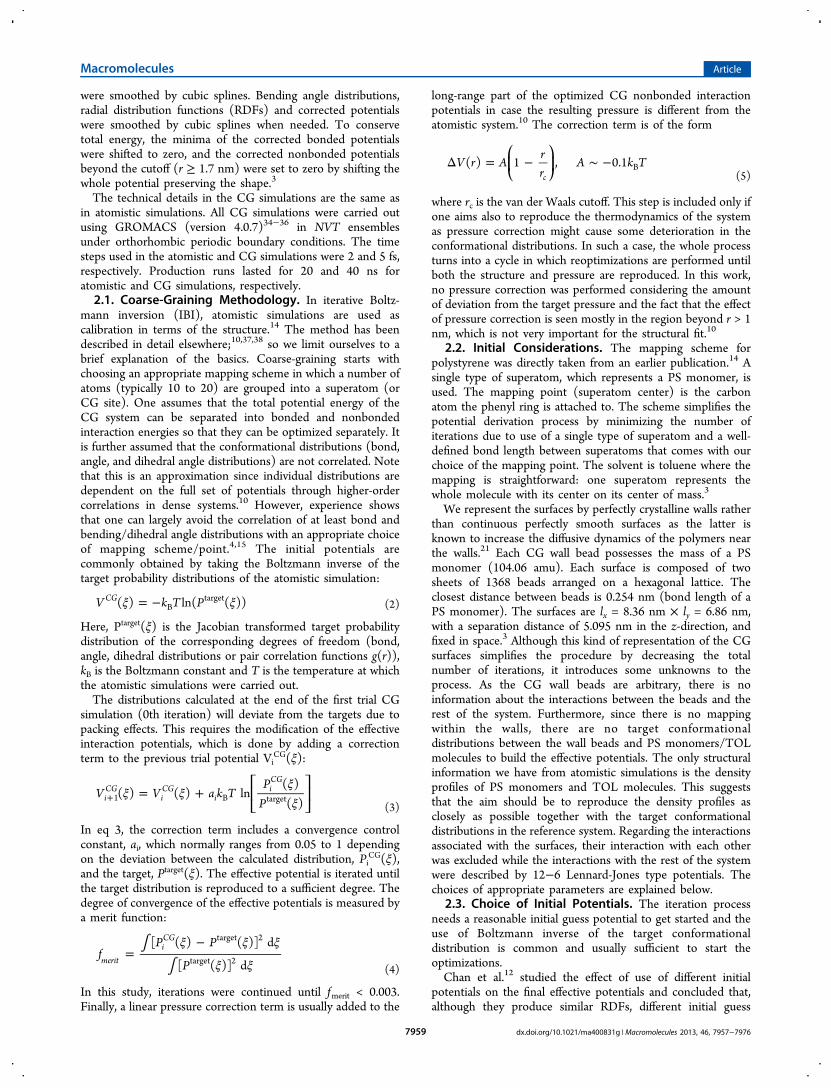
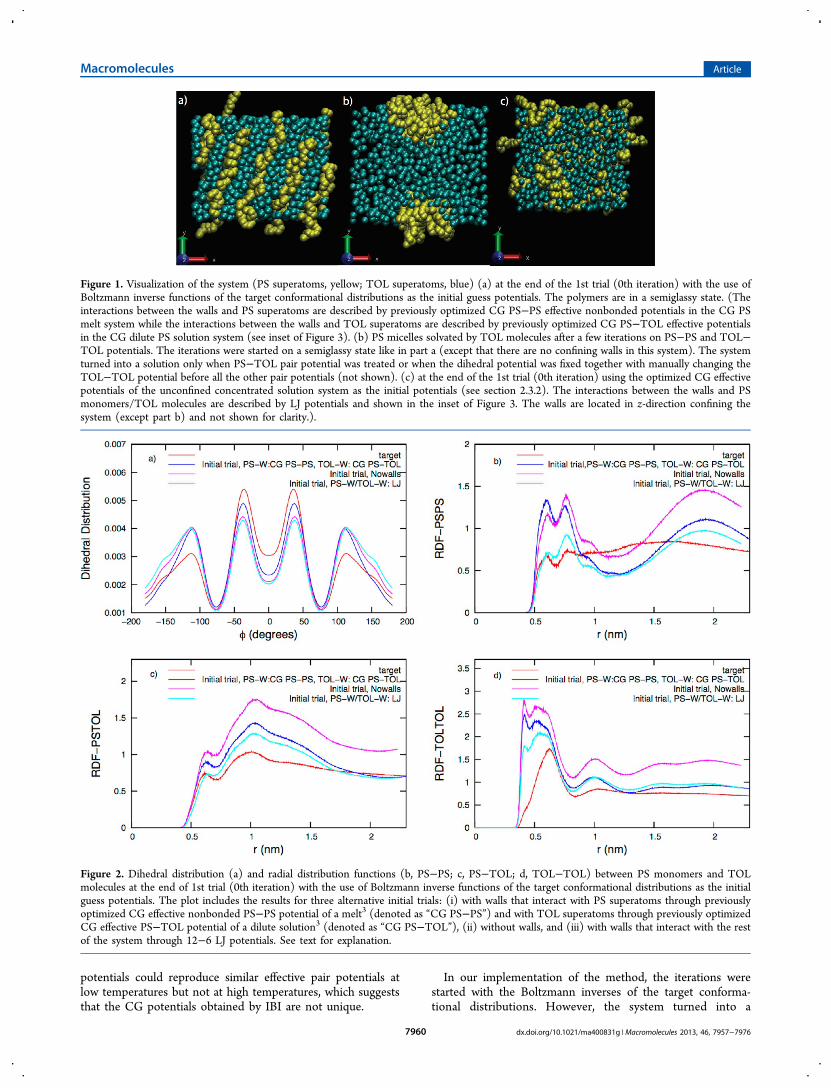
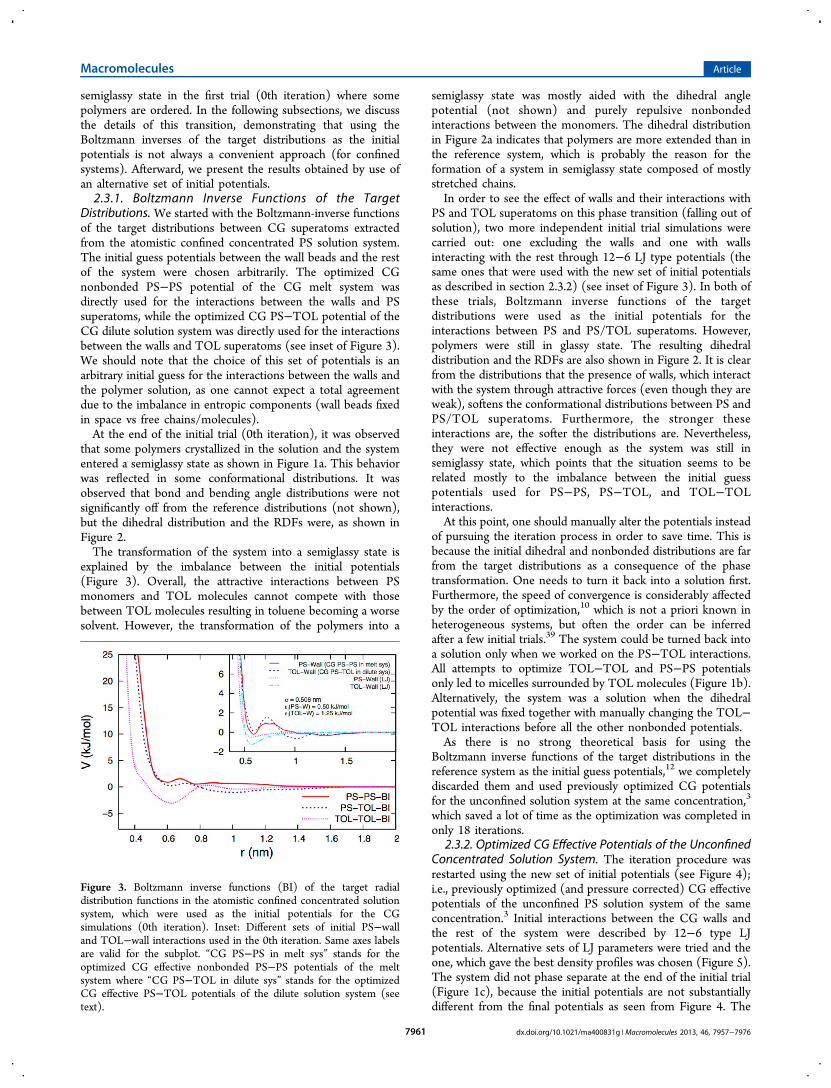

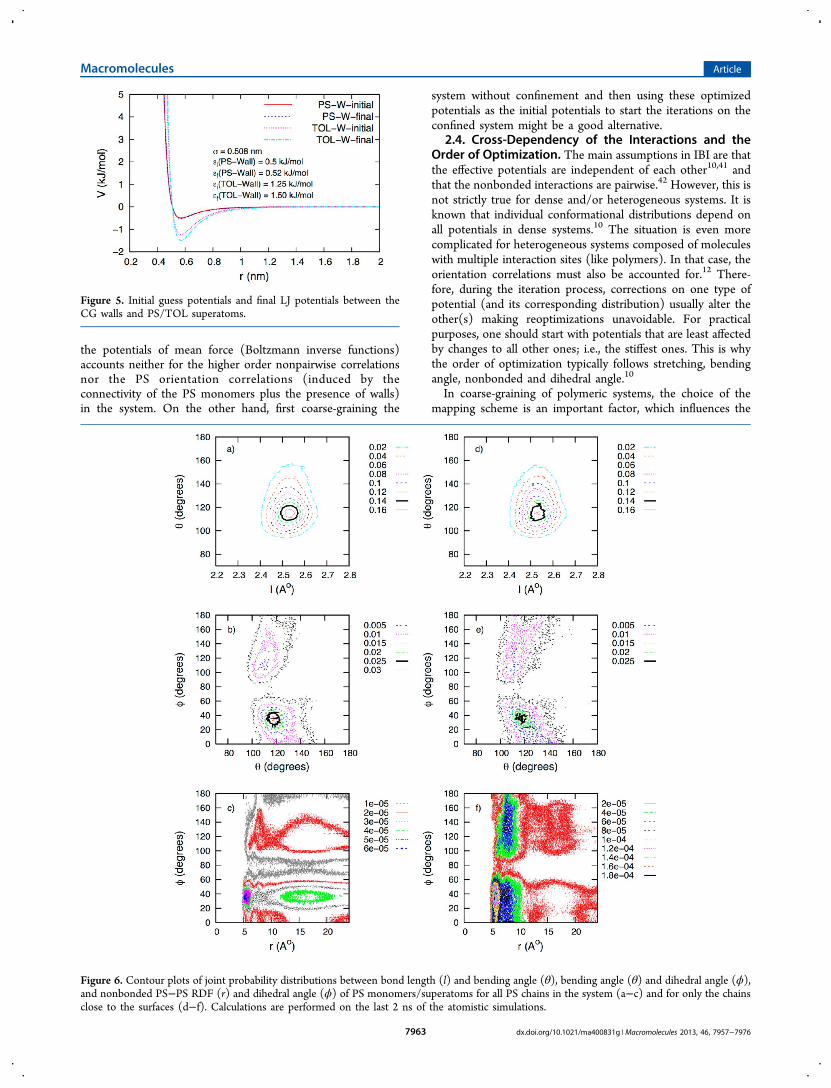
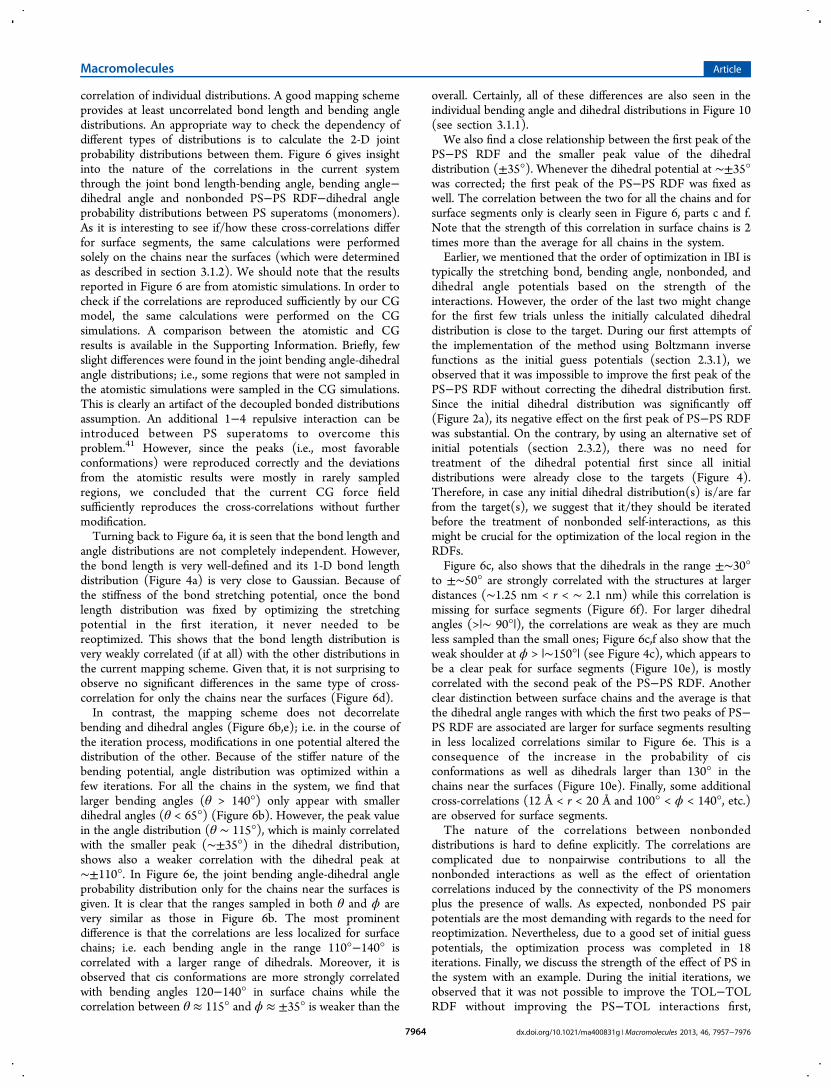

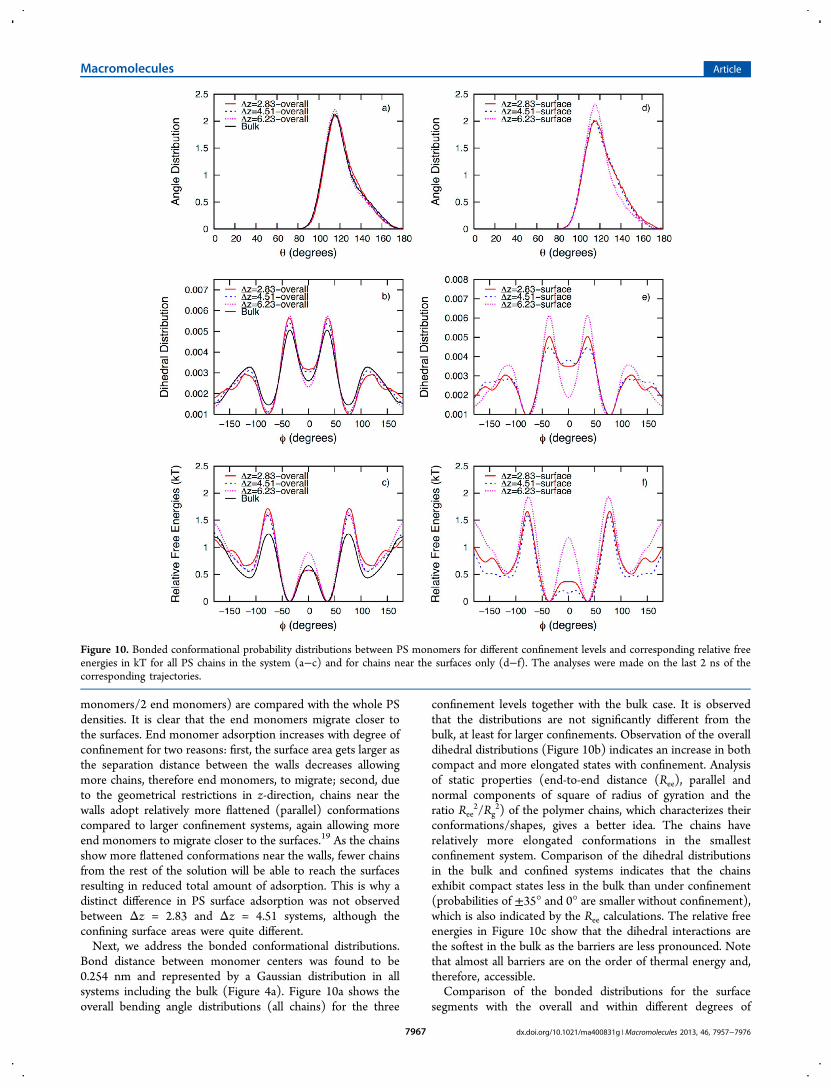

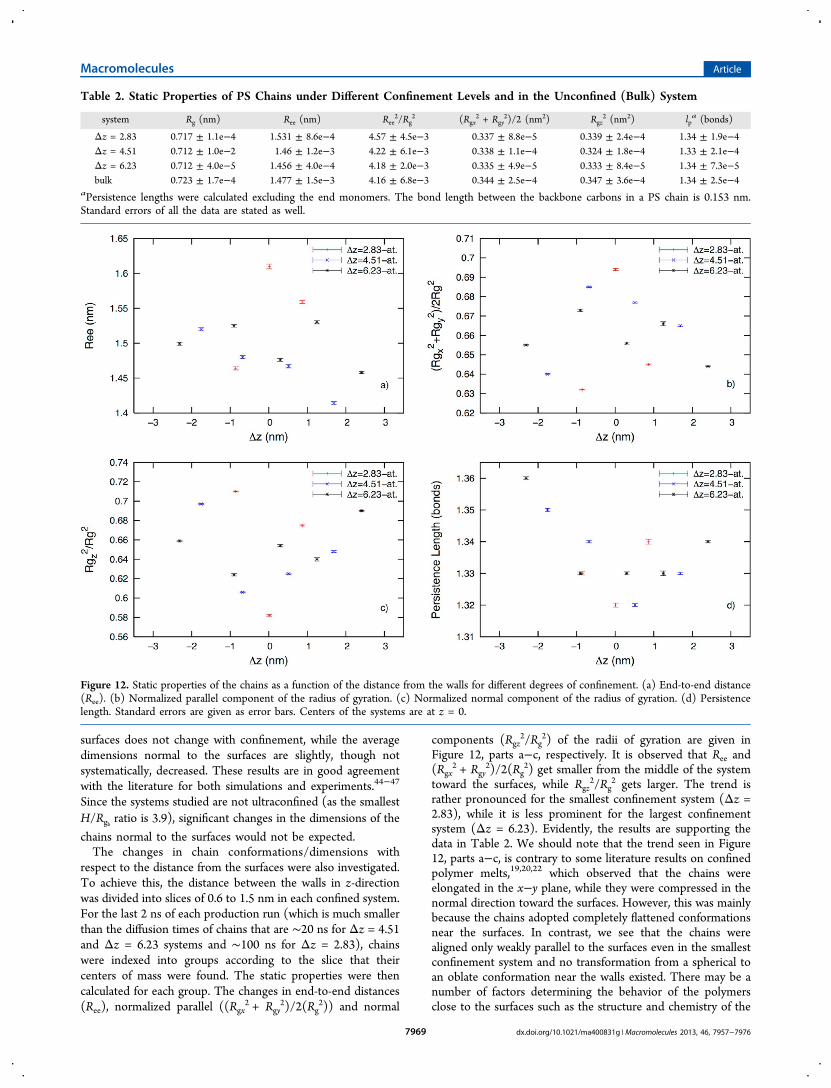

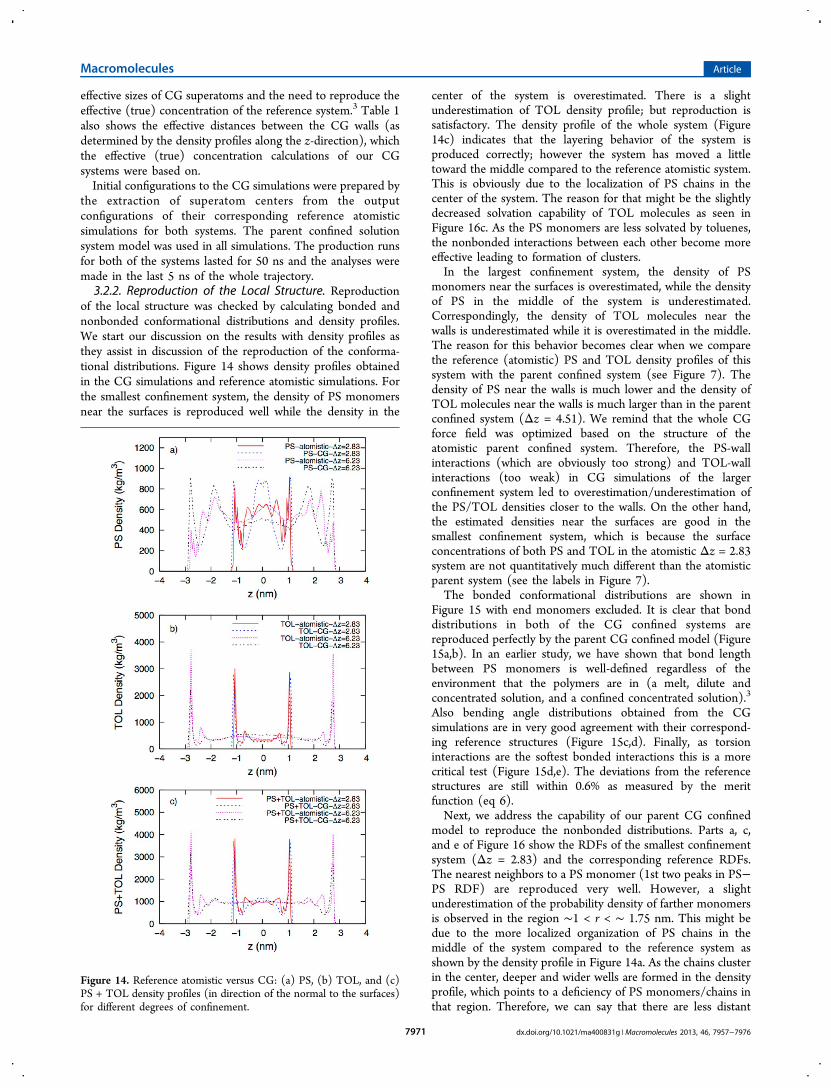
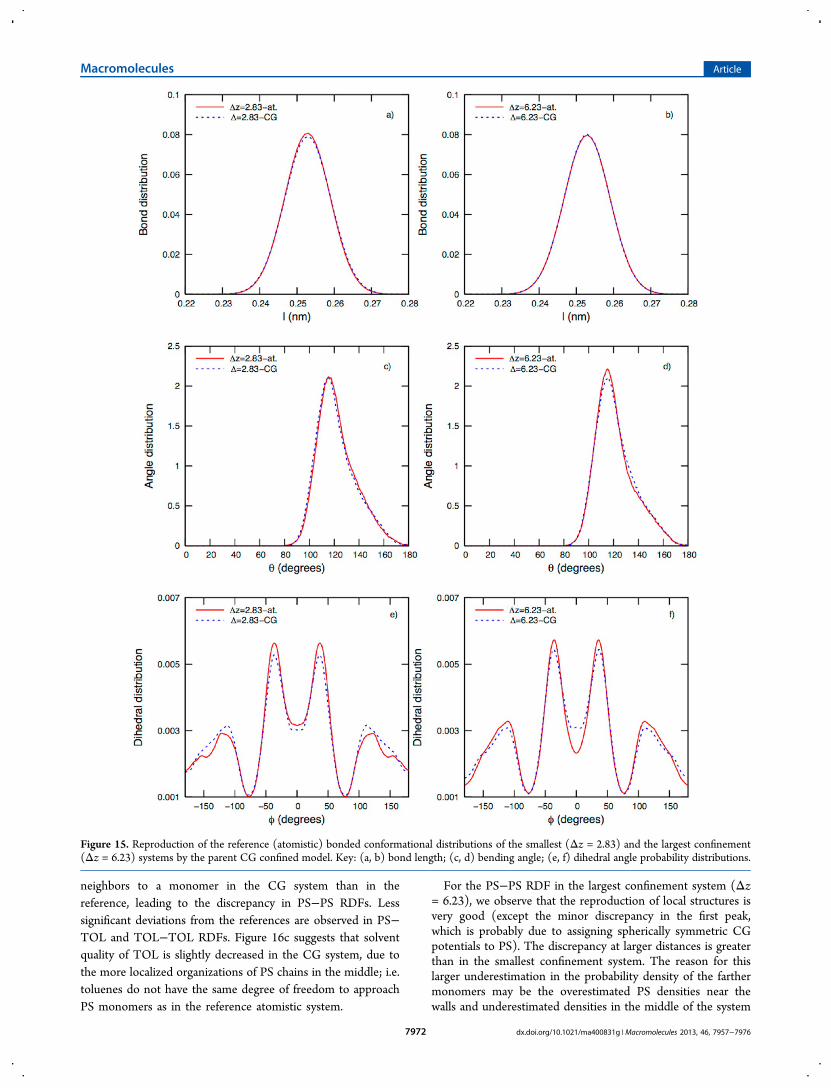
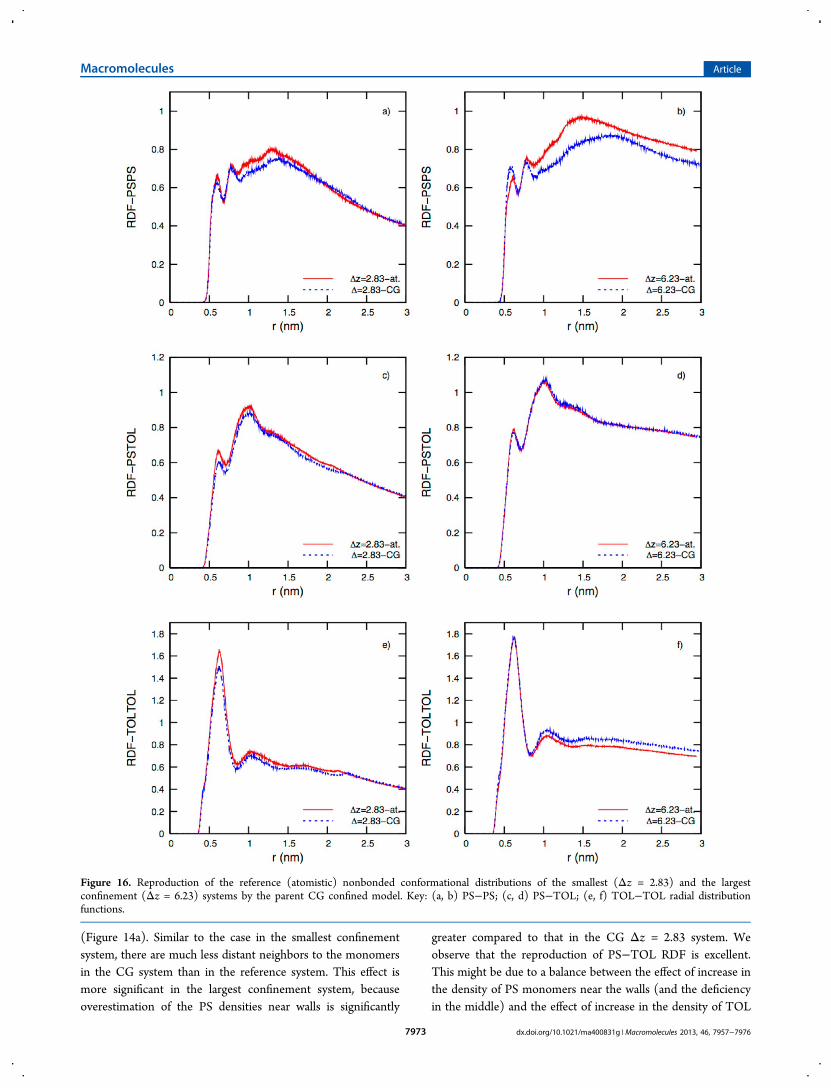


![Fig.6_taue 6_Fig_taue: Energy confinement times form the ISS95 [24] scaling vs. experimental confinement times. The colored data indicate contributions to.](https://static.documents.pub/doc/80x56/56649c715503460f949223d9/fig6taue-6figtaue-energy-connement-times-form-the-iss95-24-scaling.jpg)


