Modeling of the Seawater Greenhouse Systems G.R. Salehi 1,* , M. Ahmadpour 2 , H. Khoshnazar 3 1 Islamic Azad University Nowshahr Branch,Nowshahr,Iran 2 Islamic Azad University Takestan Branch,Takestan,Iran 3 Shiraz university,Shiraz,Iran * Corresponding author. Tel: +989122031671, E-mail: [email protected]Abstract: The Seawater Greenhouse system uses sunlight, seawater and air to provide freshwater and cooled and humid air, so that in addition to provide the water required for greenhouse, supply more sustainable environmental condition from cultivation of crops in arid coastal regions. In this system ambient air is passed through the two evaporative cooling pads, which plant growth area is placed between those pads, by fans that placed end of the building, and then returned taking humidity on the tube-and-fin condenser. In order to decrease the entrance heating load to the plants, use pipe arrays to provide shade. This paper tries to describe simulation the Seawater Greenhouse considering condition of the Bandar Abbas City in IRAN. it shows that by increasing entrance air relative humidity, the water production and floor temperature increases and the differential temperature decreases. Also with increasing seawater flow rate, the water production increases and differential temperature and floor temperature decreases. With increasing entrance air flow rate, the water production water production and floor temperature decreases and differential temperature increases. Different cycle is developed and investigate in this paper and shows that in cycle that is water exist from first evaporator is passed under the greenhouse floor, is the effective cycle and produces more water than other cycle. Keywords: Seawater greenhouse, cycle design, condenser Nomenclature D Pipe diameter........................................... m E Pipe thickness .......................................... m F Seeing surface ............................................. g Acceleration due to gravity.................. m⋅s -2 h enthalpy ..............................................kjkg -1 h heat transfer coefficient ................. wm-2 k-1 I solar radiation intensity.......................wm-2 k Thermal conductivity ....................... wm-1 k-1 M mass ...................................................... kg M0 flow rate ............................................... lits-1 Nu Nusselt number ........................................... p pressure .................................................. pa pr Prandtl number ........................................... Q Heat transfer ............................................ kj Re Reynolds number ........................................ T Temperature ............................................. k U Specific energy....................................kjkg-1 V velocity................................................. m⋅s-1 V viscosity ............................................... m⋅s-1 V transmittance ....................................... m⋅s-1 1 Entering air to first evaporator ................... 2 Entering Water to first evaporator .............. 3 Water out from first evaporator .................. 4 Air out from first evaporator ...................... 5 Entering Water to pipes array ..................... 7 Entering air to growing space ..................... 8 Air out from roof space ............................... 9 Air out from growing space ......................... 10 Entering water to second evaporator .......... 11 Entering air to second evaporator .............. 12 Water out from second evaporator.............. 13 Air out from second evaporator ................. 14 Entering water to condenser ....................... 15 Water out from condenser ........................... 16 water production ......................................... 17 Air out from condenser ................................ α absorptance ................................................. ε Emittance..................................................... ϕ Relative humidity ......................................... ω Water content .............................................. ω stefan-boltzmann constant ............... wm-2 k-4 1. Introduction The earliest solar distillation plant on record was designed and built in 1872 by Charles Wilson in Chile [1]. It was further developed at the University of Arizona in 1961 in cooperation with the Georgia Institute of Technology and the University of Sonora, Mexico at Puerto Peñasco,New Mexico. A well detailed study about sun fresh water making plans and 3733
Transcript
Modeling of the Seawater Greenhouse Systems
G.R. Salehi 1,*, M. Ahmadpour 2, H. Khoshnazar3
1Islamic Azad University Nowshahr Branch,Nowshahr,Iran 2Islamic Azad University Takestan Branch,Takestan,Iran
Abstract: The Seawater Greenhouse system uses sunlight, seawater and air to provide freshwater and cooled and humid air, so that in addition to provide the water required for greenhouse, supply more sustainable environmental condition from cultivation of crops in arid coastal regions. In this system ambient air is passed through the two evaporative cooling pads, which plant growth area is placed between those pads, by fans that placed end of the building, and then returned taking humidity on the tube-and-fin condenser. In order to decrease the entrance heating load to the plants, use pipe arrays to provide shade. This paper tries to describe simulation the Seawater Greenhouse considering condition of the Bandar Abbas City in IRAN. it shows that by increasing entrance air relative humidity, the water production and floor temperature increases and the differential temperature decreases. Also with increasing seawater flow rate, the water production increases and differential temperature and floor temperature decreases. With increasing entrance air flow rate, the water production water production and floor temperature decreases and differential temperature increases. Different cycle is developed and investigate in this paper and shows that in cycle that is water exist from first evaporator is passed under the greenhouse floor, is the effective cycle and produces more water than other cycle. Keywords: Seawater greenhouse, cycle design, condenser
Nomenclature D Pipe diameter ........................................... m E Pipe thickness .......................................... m F Seeing surface ............................................. g Acceleration due to gravity .................. m⋅s-2 h enthalpy ..............................................kjkg-1 h heat transfer coefficient ................. wmP
-2Pk P
-1 I solar radiation intensity ....................... wmP
-2 k Thermal conductivity ....................... wmP
-1Pk P
-1 M mass ...................................................... kg MP
-1 Nu Nusselt number ........................................... p pressure .................................................. pa pr Prandtl number ........................................... Q Heat transfer ............................................ kj Re Reynolds number ........................................ T Temperature ............................................. k U Specific energy ....................................kjkgP
-1 V velocity ................................................. m⋅s P
-1
V viscosity ............................................... m⋅s P
-1 V transmittance ....................................... m⋅s P
-1P
1 Entering air to first evaporator ................... 2 Entering Water to first evaporator .............. 3 Water out from first evaporator .................. 4 Air out from first evaporator ...................... 5 Entering Water to pipes array ..................... 7 Entering air to growing space ..................... 8 Air out from roof space ............................... 9 Air out from growing space ......................... 10 Entering water to second evaporator .......... 11 Entering air to second evaporator .............. 12 Water out from second evaporator .............. 13 Air out from second evaporator ................. 14 Entering water to condenser ....................... 15 Water out from condenser ........................... 16 water production ......................................... 17 Air out from condenser ................................ α absorptance ................................................. ε Emittance ..................................................... ϕ Relative humidity ......................................... ω Water content ..............................................
ω stefan-boltzmann constant ............... wmP
-2Pk P
-4
1. 0BIntroduction The earliest solar distillation plant on record was designed and built in 1872 by Charles Wilson in Chile [1]. It was further developed at the University of Arizona in 1961 in cooperation with the Georgia Institute of Technology and the University of Sonora, Mexico at Puerto Peñasco,New Mexico. A well detailed study about sun fresh water making plans and
3733
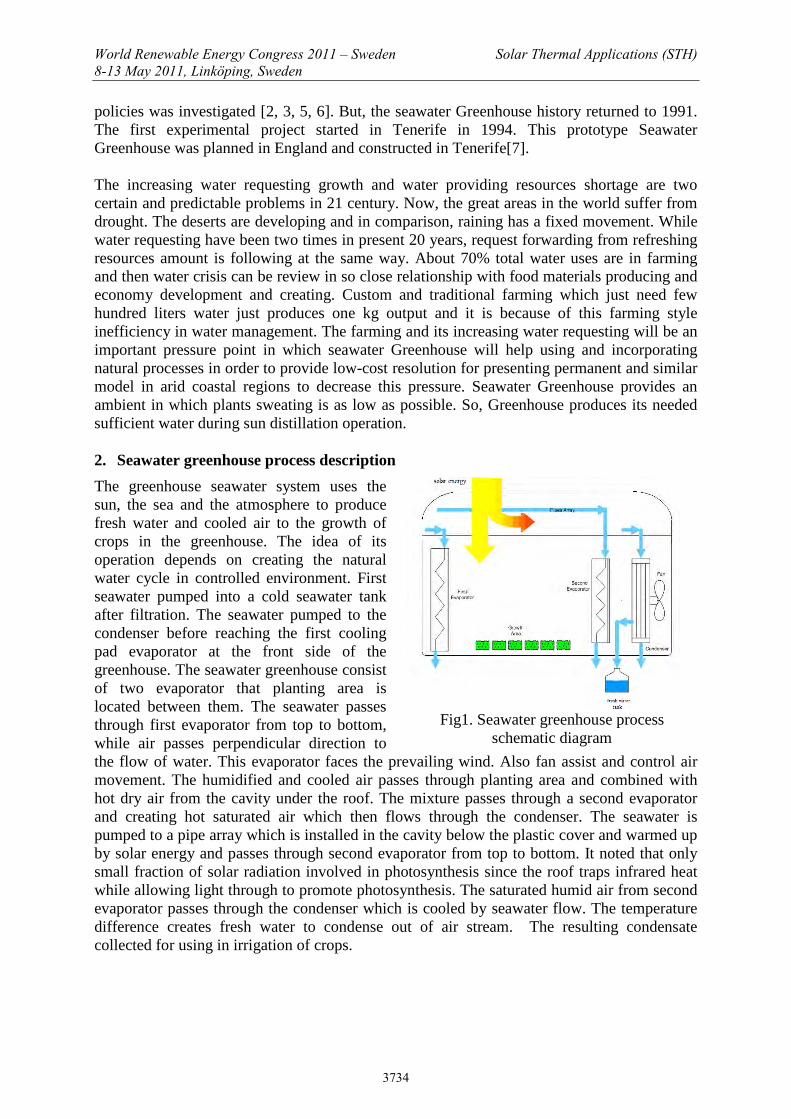
policies was investigated [2, 3, 5, 6]. But, the seawater Greenhouse history returned to 1991. The first experimental project started in Tenerife in 1994. This prototype Seawater Greenhouse was planned in England and constructed in Tenerife[7]. The increasing water requesting growth and water providing resources shortage are two certain and predictable problems in 21 century. Now, the great areas in the world suffer from drought. The deserts are developing and in comparison, raining has a fixed movement. While water requesting have been two times in present 20 years, request forwarding from refreshing resources amount is following at the same way. About 70% total water uses are in farming and then water crisis can be review in so close relationship with food materials producing and economy development and creating. Custom and traditional farming which just need few hundred liters water just produces one kg output and it is because of this farming style inefficiency in water management. The farming and its increasing water requesting will be an important pressure point in which seawater Greenhouse will help using and incorporating natural processes in order to provide low-cost resolution for presenting permanent and similar model in arid coastal regions to decrease this pressure. Seawater Greenhouse provides an ambient in which plants sweating is as low as possible. So, Greenhouse produces its needed sufficient water during sun distillation operation. 2. Seawater greenhouse process description The greenhouse seawater system uses the sun, the sea and the atmosphere to produce fresh water and cooled air to the growth of crops in the greenhouse. The idea of its operation depends on creating the natural water cycle in controlled environment. First seawater pumped into a cold seawater tank after filtration. The seawater pumped to the condenser before reaching the first cooling pad evaporator at the front side of the greenhouse. The seawater greenhouse consist of two evaporator that planting area is located between them. The seawater passes through first evaporator from top to bottom, while air passes perpendicular direction to the flow of water. This evaporator faces the prevailing wind. Also fan assist and control air movement. The humidified and cooled air passes through planting area and combined with hot dry air from the cavity under the roof. The mixture passes through a second evaporator and creating hot saturated air which then flows through the condenser. The seawater is pumped to a pipe array which is installed in the cavity below the plastic cover and warmed up by solar energy and passes through second evaporator from top to bottom. It noted that only small fraction of solar radiation involved in photosynthesis since the roof traps infrared heat while allowing light through to promote photosynthesis. The saturated humid air from second evaporator passes through the condenser which is cooled by seawater flow. The temperature difference creates fresh water to condense out of air stream. The resulting condensate collected for using in irrigation of crops.
Fig1. Seawater greenhouse process
schematic diagram
3734
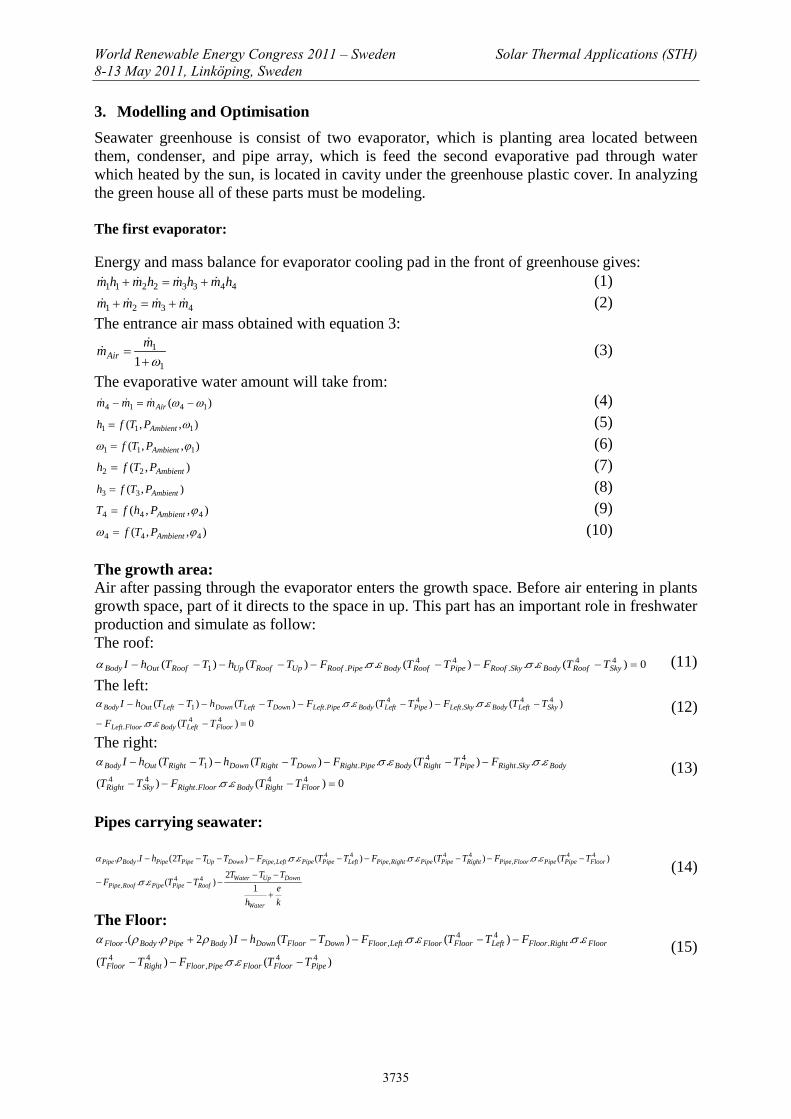
3. Modelling and Optimisation Seawater greenhouse is consist of two evaporator, which is planting area located between them, condenser, and pipe array, which is feed the second evaporative pad through water which heated by the sun, is located in cavity under the greenhouse plastic cover. In analyzing the green house all of these parts must be modeling. The first evaporator:
Energy and mass balance for evaporator cooling pad in the front of greenhouse gives: 44332211 hmhmhmhm +=+ (1)
4321 mmmm +=+ (2) The entrance air mass obtained with equation 3:
1
1
1 ω+=
mmAir
(3)
The evaporative water amount will take from: )( 1414 ωω −=− Airmmm (4)
The growth area: Air after passing through the evaporator enters the growth space. Before air entering in plants growth space, part of it directs to the space in up. This part has an important role in freshwater production and simulate as follow: The roof:
In this stage, by taking two control volumes around the Greenhouse up and down space that separating by the pipes carrying seawater, we have the following equations.
The entering air divided into two branches that flowing down branch has the duty of humidification and cooling of the ambient and the up branch has the duty of by removing the heat gained from sun by pipe arrays and applying it increasing humidity capacity of air in exit. These two branches were mixed by near the second evaporator and caused increasing air temperature and moisture capacity. These combinations write as follow:
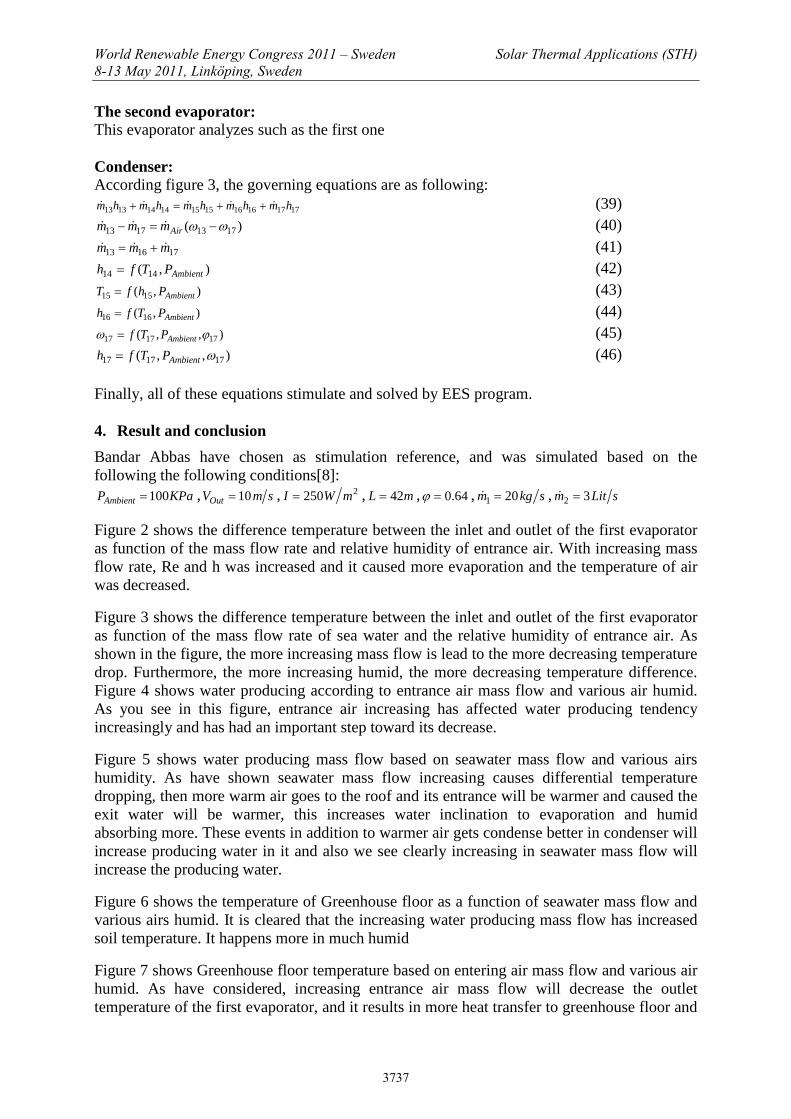
Finally, all of these equations stimulate and solved by EES program. 4. Result and conclusion Bandar Abbas have chosen as stimulation reference, and was simulated based on the following the following conditions[8]:
KPaPAmbient 100= , smVOut 10= , 2250 mWI = , mL 42= , 64.0=ϕ , skgm 201 = , sLitm 32 = Figure 2 shows the difference temperature between the inlet and outlet of the first evaporator as function of the mass flow rate and relative humidity of entrance air. With increasing mass flow rate, Re and h was increased and it caused more evaporation and the temperature of air was decreased. Figure 3 shows the difference temperature between the inlet and outlet of the first evaporator as function of the mass flow rate of sea water and the relative humidity of entrance air. As shown in the figure, the more increasing mass flow is lead to the more decreasing temperature drop. Furthermore, the more increasing humid, the more decreasing temperature difference. Figure 4 shows water producing according to entrance air mass flow and various air humid. As you see in this figure, entrance air increasing has affected water producing tendency increasingly and has had an important step toward its decrease. Figure 5 shows water producing mass flow based on seawater mass flow and various airs humidity. As have shown seawater mass flow increasing causes differential temperature dropping, then more warm air goes to the roof and its entrance will be warmer and caused the exit water will be warmer, this increases water inclination to evaporation and humid absorbing more. These events in addition to warmer air gets condense better in condenser will increase producing water in it and also we see clearly increasing in seawater mass flow will increase the producing water. Figure 6 shows the temperature of Greenhouse floor as a function of seawater mass flow and various airs humid. It is cleared that the increasing water producing mass flow has increased soil temperature. It happens more in much humid Figure 7 shows Greenhouse floor temperature based on entering air mass flow and various air humid. As have considered, increasing entrance air mass flow will decrease the outlet temperature of the first evaporator, and it results in more heat transfer to greenhouse floor and
3737
decrease its temperature. In addition, entrance air mass flow increase affects Re and Nu and increasing h and absorbs multiple heat, so we can say the higher humid will be as the same as more soil temperature. As we see in this figure, entrance mass flow increasing has decrease heat, and more humid, will increase Greenhouse floor in a certain air mass flow. .The difference cycles was simulated here to find the optimum cycles in this Greenhouse. The stimulations were done according the Bandar Abbas conditions. The first cycle which has shown by C1 in the figures, is the simplest one and the other plan is based on changes changes in this plan. C2 is a plan for decreasing the greenhouse floor temperature. The air which exits the condenser will be passed the under of the growth space in order to decrease Greenhouse floor temperature. C3 is a similar plan with the same goal by another approach. In this cycle, the water which exit the first evaporator is passed the under of Greenhouse floor space, like previous plan, for decreasing the temperature. C4, C5 and C6 have considered in order to low cost and each of them includes these changes: condenser feeding from the first evaporator exit water, pipes array feeding through condenser exit and finally pipes array feeding by the second evaporator exit. Now, we study these graphs in detail: Considering present cycles we can see with increasing humidity the water producing was increased. Another important result will obtain from this graph is C3>C2>C6>C5>C4>C1 Figure 8 shows water producing in different cycles according to various air humid, and describe cycle 3 is the best in water production and providing pleasure heat for greenhouse floor (in this way and through thermal transmitting increasing to the air produces water) and also says condenser feeding through exit water from operator just low cost and hasn't so profits in water producing. Figure 9 shows water producing in different cycles based on various entrance air mass flow rate. This graph interpretation is like graph 8 and the alone point which isn't mentioned is in all cycles increasing entrance air mass flow water producing is decreased. Figure 10 shows the location of different places in basic cycle.
-4
-2
0
2
4
6
8
10 12 14 16 18 20 22 24 26 28 30 32
Inlet Air Mass Flow
Diff
eren
tial T
empe
ratu
re
R.H. = 1 R.H. = 0.8 R.H. = 0.6 R.H. = 0.4
-4
-2
0
2
4
6
8
1 1.3 1.6 2.2 2.5 2.8 3.1 3.4 3.7 4 4.3 4.6
Seaw ater Mass Flow
Diff
eren
tial T
empe
ratu
re
R.H. = 1 R.H. = 0.8 R.H. = 0.6 R.H. = 0.4
Fig 2- effect of heat inlet mass flow in Diff. T. Fig 3- effect of sea water mass flow in Diff. T
-6-4
-2024
68
10 12 14 16 18 20 22 24 26 28 30 32
Inlet Air mass Flow
Prod
uced
wat
er
R.H. = 1 R.H. = 0.8 R.H. = 0.6 R.H. = 0.4
2.222.72
3.223.724.224.72
5.225.72
1 1.3 1.6 2.2 2.5 2.8 3.1 3.4 3.7 4 4.3 4.6
Seaw ater Mass Flow
Prod
uced
Wat
er
R.H. = 1 R.H. = 0.8 R.H. = 0.6 R.H. = 0.4
Fig 4- effect of inlet mass flow in produced water Fig 5- effect of sea water mass flow in produced
water
3738
307
307.5
308
308.5
309
309.5
310
1 1.3 1.6 2.2 2.5 2.8 3.1 3.4 3.7 4 4.3 4.6
Sea water Mass Flow
Floo
r tem
pera
ture
R.H. = 1 R.H.= 0.8 R.H.= 0.6 R.H.= 0.4
Fig 6-effect of sea water mass flow on floor temp. Fig 7-effect of air mass flow on Floor Temperature
0
2
4
6
8
10
1 2 3 4 5 6
Suggested Cycles
Prod
uced
Wat
er
R.H. = 1 R.H. = 0.6 R.H. = 0.4 R.H. = 0
-2
0
2
4
6
8
10
1 2 3 4 5 6
Suggested CyclesPr
oduc
ed W
ater
m1 = 10 m1 = 15 m1 = 20 m1 = 25
Fig 8- effect of suggested cycles in produced water
Fig 9- effect of suggested cycles in produced water in mass
22 ,Tm
4
4
4
ϕTm
1
1
1
ϕTm
777 ,, ϕTm
666 ,, ϕTm
DownDownDown Tm ϕ,,
UpUpUp Tm ϕ,,
999 ,, ϕTm
888 ,, ϕTm
11
11
11
ϕTm
13
13
13
ϕTm
17
17
17
ϕTm
1212 ,Tm1515 ,Tm
1616 ,Tm
1414 ,Tm
10
10
Tm
5
5
Tm
Out
Right
hT
InFloor hT ,
Out
Left
hT
OutRoof hT ,
PipePipe hT ,
WaterWater hT ,
SkyT
FirstEvaporator
GrowthArea
Pipes Array
SecondEvaporator Condenser
Fan
مخزن آب
33 ,Tm
Fig 10. Location of basic cycle
C1
C2
Fig 11. Location of different places in basic cycle
3739
C3
InFloor hT ,
C4
C5
►ļ╢╘▼Ř╘Ļ╘ĥĻ╘
C6
Fig 11. continue 5. Conclusion The seawater greenhouse was investigated in the Bandar Abass wether conditions.it shows that by increasing entrance air relative humidity, the water production and floor temperature increases and the differential temperature decreases. Also with increasing seawater flow rate, the water production increases and differential temperature and floor temperature decreases. With increasing entrance air flow rate, the water production water production and floor temperature decreases and differential temperature increases. Also different cycle is developed and investigates in this paper and shows that in cycle C3 which is water exist from first evaporator is passed under the greenhouse floor, is the effective cycle and produces more water than other cycle. References [1] Talbert, S. G., Lof, C-M Wong and E. N. Sieder, 1970. Manual on solar
[2] Yadav. Y. P. and L. K. Jha, 1989. A double-basin solar still coupled to a collector and operating in the thermo siphon mode. Energy, 14(10): 653–659.
[3] Hamed, O. A., E. I. Eisa and W. E. Abdullah, 1993.Overview of solar desalination. Desalination, 93: 563–579.
[4] Farid, M. M. 1999.Recent developments in solar desalination. In: Water Management, Purification and Conservation in Arid Climates. Vol. II.Water Purification. M. F. A.
[5] Goosen and W. H. Shayya. Technomic Publishing Co., Lancaster, PA, pp. 277–296.
[6] Goosen, M. F. A., S. S. Sablani, W. H. Shayya, C. Paton, and H. Al-Hinai, 2000.Thermodynamic and Economic considerations in solar desalination. Desalination, 129: 63–89.
[7] Paton, A. C. and P. A. Davis, 1996. International Engineering Conference (IEC) “Mutah 2004”, Mutah University, JORDAN, April 26-28. Pages 523-540.
[8] Data Processing Center, Annual Weather Report of the Year 2000