Jurnai Pengurusan 13(1994) 17-27 Modeling Premium Growth in the Malaysian Motor Insurance Industry Lee Tak Chen, Hendon Redzuan, Rasidah Mohd Said & Arawati Agus ABSTRACT The motor Insurance Industry came Into the limelight since the enforcement of mandatory motor Insurance coverage In 1959 ThIs paper uses a modeling techmque to ascertain the varIOus components and parameters that affect the chalJge In premIums receIved by the entire Industry, or a segment of It. Once these components & parameters are Identified, the actual growth of new premIums can be derzved by extrapolating the components and parameters In one or more expressIOns (or commonly referred to as a formula). These expressIOns could be useful In forecasting the future market dynamIcs of the motor Insurance Industry. ABSTRAK Industrz Insurans motor telah menjadi perhatlan ramal sejak Insurans motor diwajibkan kepada pengguna-penggunajalan raya dalam tahun 1959 Kertas kerja Inl merupakan kajian menggunakan teknik pemodelan untuk menentukan komponen dan parameter yang memberz kesan ke atas perubahan jumlah premIum yang direrzma oleh keseluruhan Industrz Insurans motor atau sesuatu segmen darlnya. Setelah komponen dan parameter Inl dikenalpastl, pertumbuhan premIum baru yang sebenar boleh didapatl dengan mengekstrapolasl komponen & parameter ke dalam ungkapan (juga dirujuk sebagal formula). Ungkapan Inl amat berguna bagl meramalkan pasaran dinamik bagl Industrz 1m di masa depan. INTRODUCTION The motor Insurance Industry In MalaysIa IS at a crossroad, facIng a mynad of problems. The problems facIng the motor Insurance Industry are deep and complicated. The senousness of the problem can be seen from the claIm rattos for motor Insurance policIes for the past three years, WhICh stood at 144.0%,198.6% and 173.11%for 1989, 1990, and 1991, respectIvely. Many factors are suggested for the root causes of these problems. Among others, fraud and an anttquated system of premIUm structure for motor Insurances are
Transcript
Jurnai Pengurusan 13(1994) 17-27
Modeling Premium Growth in the Malaysian Motor Insurance Industry
Lee Tak Chen, Hendon Redzuan, Rasidah Mohd Said & Arawati Agus
ABSTRACT
The motor Insurance Industry came Into the limelight since the enforcement of mandatory motor Insurance coverage In 1959 ThIs paper uses a modeling techmque to ascertain the varIOus components and parameters that affect the chalJge In premIums receIved by the entire Industry, or a segment of It. Once these components & parameters are Identified, the actual growth of new premIums can be derzved by extrapolating the components and parameters In one or more expressIOns (or commonly referred to as a formula). These expressIOns could be useful In forecasting the future market dynamIcs of the motor Insurance Industry.
ABSTRAK
Industrz Insurans motor telah menjadi perhatlan ramal sejak Insurans motor diwajibkan kepada pengguna-penggunajalan raya dalam tahun 1959 Kertas kerja Inl merupakan kajian menggunakan teknik pemodelan untuk menentukan komponen dan parameter yang memberz kesan ke atas perubahan jumlah premIum yang direrzma oleh keseluruhan Industrz Insurans motor atau sesuatu segmen darlnya. Setelah komponen dan parameter Inl dikenalpastl, pertumbuhan premIum baru yang sebenar boleh didapatl dengan mengekstrapolasl komponen & parameter ke dalam ungkapan (juga dirujuk sebagal formula). Ungkapan Inl amat berguna bagl meramalkan pasaran dinamik bagl Industrz 1m di masa depan.
INTRODUCTION
The motor Insurance Industry In MalaysIa IS at a crossroad, facIng a mynad of problems. The problems facIng the motor Insurance Industry are deep and complicated. The senousness of the problem can be seen from the claIm rattos for motor Insurance policIes for the past three years, WhICh stood at 144.0%,198.6% and 173.11%for 1989, 1990, and 1991, respectIvely. Many factors are suggested for the root causes of these problems. Among others, fraud and an anttquated system of premIUm structure for motor Insurances are
18 Jurnai Pengurusan 13
Identified as the major causes (Fong 1990; Peng 1992). With the vehIcle populatton growmg at double digIt rates m recent years, the current cnsls IS expected to worsen if appropnate remedies are not taken.
The Road Traffic Act 1958 reqUlres all vehIcles usmg the public roads be protected under the motor msurance coverage. According to Gibson (1990), motor msurance has always been consIdered as a "grudge purchase" because of ItS mandatory law Ansmg from thIS feelings, commumty cnttclsm IS not uncommon whenever there IS an mcrease m premmm or detenoratlOn m standard of servIce expected from the msurance mdustry
An owner of a vehIcle IS reqUlred by law to have at mlmmum, the "Act Only" coverage. It gIves protectton to the msured agamst claIms mvolvmg bodily mJunes to a thIrd party, ansmg from the use of the msured's vehIcle. Other types of motor poliCIes available m market are: 1. ThIrd party policy 2. ThIrd party, fire & theft policy 3. ComprehensIve policy
The thIrd party policy covers bodily mJury and property damage of a thIrd party On the other hand, the thIrd party, fire & theft policy not only provIdes thIrd party protectlOn but also safeguards agamst losses due to fire and theft to the msured's vehIcle. The comprehensIve- policy offers a far WIder scope of protectlOn, mcluding bodily mJunes, among others, to the msured.
ThIS paper IS a prelimmary study undertaken by the authors on the market dynamIcs of msurance mdustry m MalaysIa. In thIS paper, we are concerned WIth finding a techmque for estlmatmg the vanous components of change m the total premmm recelVed by the mdustry, or by a segment of the mdustry These components mclude new premmm caused by new vehIcles, proVIsIon for no clatm discount for eXlstmg vehIcles, complete loss of vehIcles, and for a segment of the mdustry, the flow of premmm from other segments of the mdustry due to customer sWltchmg. Understanding the behavlOf of the varIOUS components and mteractlOn among them are Important for the study of the market dynamIcs of the mdustry
While It IS true that these changes may be obtatned by data collectton, such approach may be ImpractIcal or too costly Currently, the data available are m the form of aggregates, where the components are not separated. Thus, modeling seems to be the only VIable approach for studymg these components of change.
ThIS paper IS organIsed as follows. In the next sectlOn, the expresslOns relatmg the vanous components that effect the change m total msurance premmm are presented. ThIS IS followed by the techmques used for esttmatmg the parameters m the expressIons. Finally, we apply thIS approach to the data for 1986-1991 and discuss the results.
Motor Insurance Industry 19
MODELING PREMIUM GROWTH
To study the changes In total premlUm for the entue Industry, or a segment of the Industry, It IS necessary to Identify the different components In the system that affect these changes. Histoncal data for these components of change may not be readily available, and are sometlmes too costly to be maIntaIned. A theoretlcal framework to obtaIn estlmates of some of the components IS thus useful.
ANNUAL CHANGE IN TOTAL PREMIUM FOR THE INDUSTRY
The maIn Increase In premlUm for the entIre Industry IS caused by the Increase In new vehIcles that reqUire Insurance coverage. Two factors are causIng the reductIOn of total premlUm for the Industry, namely, the complete loss of some of the Insured vehIcles and the provISIOn for No Clatm DIscounts (NCD'S) for eXIstIng Insured vehIcles. The NCD'S are structured according to four categones of vehIcles: (1) pnvate cars, (2) commerCIal cars, (3) motorcycles, and (4) motor trades. The NCD structures for the vanous categones are gIVen In Table 1. As can be seen from the table, the rates of discount are qUite hIgh. Therefore, the NCD'S are the major causes of premlUm reductIOn. Note that the premlUm may also Increase when the Insureds who currently enJoy NCD'S made claims.
TABLE l. NCD structures
Number of consecuhve (1) (2) (3) (4) preceding years Pnvate Commercial Motor-cycles Motor no clrums were made cars cars trades
One 25% 15% 15% 25% Two 30% 20% 20% 30% Three 38.5% 25% 25% 38.5% Four 45.0% 25% 25% 38.5% Five or more 55.0% 25% 25% 38.5%
To illustrate how the No ClaIm Discount works, suppose the premlUm for a policy IS Ao and NCD rate for year one IS XI. The premlUm In year one, say AI' will therefore be (l-x1)Ao. In the follOWIng year, if no claims were made, the Insured IS entltled to a discount rate of x2• Therefore, the premlUm for year two IS gIVen by
(1)
20 Jurnal Pengurusan 13
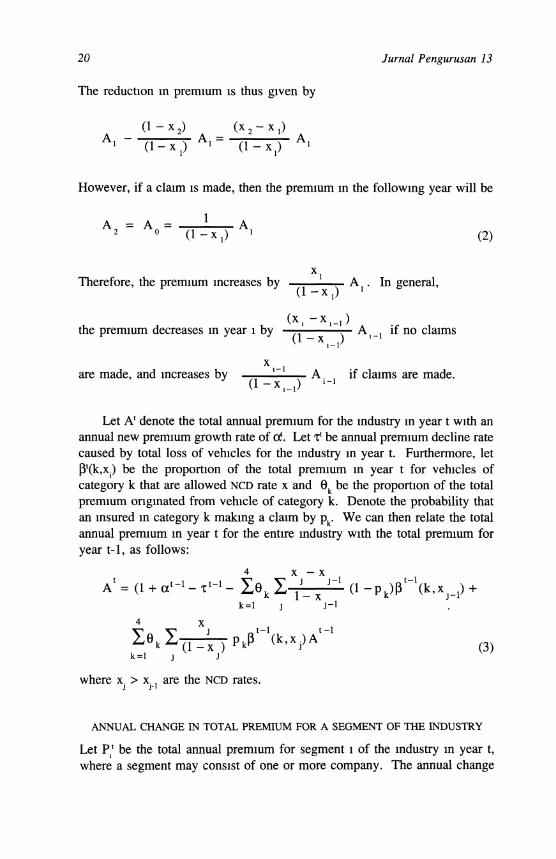
The reductlOn 10 premlUm IS thus gIVen by
However, if a clrum IS made, then the prenuum 10 the folloW1Og year will be
(2)
Therefore, the premlUm 10creases by
(XI -XI_I) the premIum decreases 10 year 1 by (1 _ X ) AI_I if no clrums
I-I
are made, and 10creases by X
I-I A. I if claIms are made. (I-xI_I) 1-
Let At denote the total annual premlUm for the 10dustry 10 year t WIth an annual new premlUm growth rate of rio Let tt be annual premlUm decline rate caused by total loss of vehIcles for the 10dustry 10 year t. Furthermore, let ~t(k,x) be the proportIon of the total premIum 10 year t for vemcles of category k that are allowed NCD rate X and ak be the proportlOn of the total premlUm ong1Oated from vehIcle of category k. Denote the probability that an 10sured 10 category k mak10g a clrum by Pk. We can .then relate the total annual premlUm 10 year t for the entire 10dustry WIth the total premlUm for year t-l, as follows:
(3)
where x. > x. I are the NCD rates. J J-
ANNUAL CHANGE IN TOTAL PREMIUM FOR A SEGMENT OF THE INDUSTRY
Let PIt be the total annual premlUm for segment 1 of the 10dustry 10 year t, where a segment may consIst of one or more company. The annual change
Motor Insurance Industry 21
m premmm for segment 1 of the mdustry can be expressed as
t t-l t-l t-l A = (1 + a .0. + ° -b 't -
1 1 1 1 1
~t-l(k,x.)A t-l J 1
(4)
where aj IS the portIOn of the mdustry' S total new premmm that IS captured by segment 1, and bj IS the portIOn of the mdustry's reductIOn m total premmm due to loss vehIcles covered by segment 1. An Important parameter m expreSSIOn (4) IS Ojt, WhIch IS the portIOn of the premmm for segment 1 that IS gamed from other compames not m segment 1, less the portIon of the total premmm that IS lost to other companIes not m segment 1. A posItIve Ojl thus mdicates that there are more premmms flowmg mto segment 1 than flowmg out, and VIce-versa. Therefore, Ojl IS a measure of effectIveness of segment 1 m enhancmg ItS share of the premmm. The parameters Pk' I3jl(k,x) and 9k
are mterpreted sImilarly as theIr counterparts m expreSSIOn (3). Note that expreSSIOns (3) and (4) may be adjusted for mflatIon. However,
thIS IS not conSIdered m thIS paper.
PARAMETER ESTIMATIONS
ExpreSSIOns (3) and (4) proVIde US WIth a framework to examme m more detail each mdividual component m the change of premmm. Rather than vIewmg the total premmm m an aggregate form, we can now look at the mteractIVe effects of the components.
While m theory all the parameters m expreSSIOns (3) and (4) can be obtained through data collectIon, the process may be costly and ImpractIcal. For the purpose of our analYSIS, some of the parameters have to be estImated through theoretIcal means.
ESTIMATING 9K, THE PORTION OF PREMIUM ORIGINATED FROM VEHICLE OF CATEGORY K
The proportIOn of the premmm for year t contributed by poliCIes for vehIcles of category k, 9k, can be estImated usmg the proportIOn of regIstered vehIcles for that category recorded by the Road Safety Council 1991. The percentage of premmm obtamed from motor trade and motorcycles are very small compared to pnvate cars and commercIal vehIcles (MIl 1988) and are
22 Jurnai Pengurusan 13
therefore omItted from the study. Since the total regIstered vehIcles IS a cumulatIve sum of all eXlst10g vehIcles, the proportIons vary very little from year to year. In thIS study, we take the average for the years under studied, that IS 1986-1991. The ratIo ofpnvate cars to commercial cars IS found to be 4.25:1. With the average premium of a commerCIal policy estImated as 1.75 that of the average premIum for a pnvate car policy, we estImate 91 and 92 to be 0.71 (or 71%) and 0.29 (or 29%), respectIvely.
PROPORTION OF NCD
For each category of vehIcles, the proportIon of the premIUm eligible for vanous rates of discount, IWk,x) and l3i
t(k,x) can be estImated by modeling WIth a Markov process (Ross 1985). Since motor trades and motorcycles are omItted, only the proportIons for pnvate cars and commercIal vehIcles are estImated. The different NCD rates are the states 10 the Markov process. If a policy has no discount for a year but IS eligible for a 25% discount the follow1Og year, It IS SaId to have made a transitIOn from the "O%-state" to the "25%-state", and so on. The tranSItIon diagrams for the Markov process representIng the two types of ACT coverage are depIcted 10 Figure 1.
(a) PrIvate Cars
PI = 0.004
(b) Commercial Cars
FIGURE 1. TranSItIon Diagrams
Motor Insurance Industry 23
In equilibnum, the steady-state prababilitles represent the expected proportIOn of the premIum that are eligible for vanous rates of discount. To obtam these probabilitIes, the transItIon probabilitIes (PI and P2 m Figure 1) need to be estImated. Assummg that accIdents reported and recorded by the Traffic Safety Council will result m clatms, we then can use the reported aCCIdent rates as estImates for the probabilitIes that a clatm IS made. Since a policy will not receIve any discount if a clatm IS made, therefore PI and P2 can be estImated WIth the aCCident rate for pnvate and commerCIal vehIcles, respectIvely
Based on the report Issued by the Traffic Safety Council, the aCCIdent rates for the years 1986-1991 are qUIte stable. Therefore, the average aCCIdent rates are used, where PI = 0.044 and P2 = 0.20 (Traffic Safety Council). Usmg these values, the steady-states probabilitIes for the Markov process can be obtatned (Ross 1985) for each discount rate. Based on the Markov process, the estImates for W(k,x) and f3;t(k,x) are gIven m Table 2. Since these values are the state probabilitIes m equlibnum, therefore they are the same for every year. These proportIons are also assumed to be the same for the entIre mdustry and for any segment of the mdustry
TABLE 2. W(k,x) and I3 jt(k,x)
(a) Private Cars
Rates of Discount 0 25% 30% 38.5% 45% 55%
ProportIon 0.044 0.042 0.040 0.038 0.036 0.80
(b) Commerczal Vehicles
Rates of Discount 0% 15% 20% 25%
ProportIOn 0.02 0.16 0.13 0.51
FINDINGS AND DISCUSSION
Over the years 1986-1991, there are 51-56 msurance companIes of different SIzes operatmg m MalaYSIa, offenng ACT policy as one of theIr products. DIstributIon of the premIUm among these companIes IS shown m Table 3.
As can be seen from Table 3, the motor msurance market IS mcreasmgly dommated by a few larger companIes. In fact, the combmed market shares of the three largest (in term of total premIUm receIved m 1991) companIes m
24 Jurnai Pengurusan 13
TABLE 3. DistributiOn of premIUm among companIes
CompanIes WIth 1986 1987 1988 1989 1990 1991 share of premIUm
Above 20% 0 0 0 0 1 Above 10% but less 0 0 1 3 2
than 20% Above 5% but less 7 7 7 4 5 3
than 10% Above 1% but less 17 15 12 8 5 5
than 5% Less than 1% 31 32 36 40 39 41
Total 55 54 55 55 51 52
Sources: Compiled from Director General of Insurance (DOl) Report, Bank Negara Ma/aysza, 1986-1991
ACT poliCIes Increases from 16.86% In 1986 to 57.92% In 1991. The decline In the number of companIes WIth market shares between 1-10% IS accomparued by the Increase In small companIes WIth very small share (less than 1 %) of the total premIUm.
GROWTH IN NEW PREMIUM
As noted before, the net change In the total annual premIUm IS affected by several components of change. If we omIt the component of total loss vehIcles, then the actual growth of new premIUm for the entIre industry can be obtained by USIng expreSSIOn (3). The percentage growth In the total prermum adjusted for the NCD for years 1985-1991 are shown In Table 4. Overall, the adjusted growth In premIUm after adjusted for NCD'S IS about 3% hIgher than the net change In premIUm.
TABLE 4. Growth m total premIUm for the mdustry
Total gross premIUm for 1985 = MR 119.70 Million
1986 1987 1988 1989 1990 1991
Net change (%) m 0.04 0.08 0.00 0.00 0.30 0.21 annual premIUm
Actual annual growth 0.07 0.11 0.03 0.03 0.33 0.24
(%) adjusted for NCD
Motor Insurance Industry 25
PREMIUM GROWTIf FOR A SEGMENT
The estimate for the growth 10 new premium IS used 10 expreSSlOn (4) for modeling the change 10 premIum for a segment of the mdustry. Since we assume that all compames will have the same proportIon of the vanous NCD's, the share of the total premmm attributed to segment 1m year t can be used as an estimate for aj and the share of the new premmm belongmg to segment 1 can then be calculated. Agam, if we omIt the component of total loss vehIcles, then the net flow of premIum mto segment 1 can be found. The net flow of premIum mto segment 1 mdicates the competitiveness of the segment. A pOSItive net flow represents the gam in market share. Non-zero flow suggests that the market IS not static. On the contrary, It mdicates an actIve sWltchmg of customers from one segment of the mdustry to another.
For example, let's diVIde the mdustry mto two segments; one WIth companIes constItl1ted 10 MalaysIa and the other with companIes constItuted outsIde MalaysIa. From 1987 onwards, no company that IS ongmally constituted 10 MalaYSIa has been reconstItl1ted 10 MalaYSia. However, out of the SIX companIes offenng ACT coverage 10 1987, only four contInue to offer ACT coverage 10 1991. The remammg two have WIthdrawn from thIS sector of the mdustry. Table 5 shows the net flow of premIum expressed as percentages of the total prelIDum receIved by the segment. It IS eVIdent that the segment compnses of companIes constItl1ted outSIde MalaySia IS losmg market share to those constituted 10 MalaYSIa, to a large extent due to the sWltchmg of the customers. It IS mterestmg to note that the share of the premmm from companIes constItl1ted outSIde MalaYSIa that have WIthdrawn from the market does not remain 10 thIS segment of the market.
TABLE 5. Net flow of premmm for companIes constItuted outsIde MalaYSIa
1987 1988 1989 1990 1991
Share of new premmm 2.59 1.77 1.57 1.59 1.88 (Million of RinggIt)
Net Flow -3.97 -1.44 -2.50 -2.00 -1.65 (Million of RinggIt)
Net flow In percentage -91% -32% -71% -71% -54% of segment's total premIUm
Another example IS to have the three mdustry leaders 10 1991 10 one segment, and the rest of the mdustry 10 the other. The three companIes
26 Jurnal Pengurusan 13
havmg the largest shares of the premIum m 1991 are Mercantile, MalaysIan NatIOnal Remsurance Berhad (MNRB) and People's. These three companIes receIved 57.92% of the total premIUm paId m 1991. Here, we are mterested m the net flow of premIUm mto or out of the segment consIstmg of the three companIes. As mdicated by the results m Table 6, there are actIve flows of prerruum mto and out of thIS segment of the market. The large net flow of premIUm mto these companIes smce 1990 IS makmg these companIes the dommatmg msurers.
TABLE 6. Net flow of premIum for the group of three comparues
1987 1988 1989 1990 1991
Share of new premIum 8.74 13.28 13.34 16.46 38.59 (Million of RmggIt)
Net Flow 0.55 -7.02 -6.51 25.13 5.6 (Million of RmggIt)
Net flow m percentage 2% -20% -16% 31% 5% of segment's total premIum
CONCLUSION
ThIS paper presents an approach for modeling the growth m premIUm for the motor msurance mdustry m MalaYSIa. ThIS approach may be useful m the future study of the market dynamICS of the mdustry. Of partIcular mterest IS the nature of competItIon and competItIve equilibnum m the motor msurance mdustry m MalaysIa. It IS hoped that such modeling approach will help m havmg a more profound understanding of the mdustry so that IS can be better managed and regulated.
REFERENCE
Anonymous. 1988. Why auto msurance IS sometlmes compulsory. Journal of American Insurance, 8-12.
Bank Negara MalaYSIa Laporan Tahunan Pengarah Insurans, 1985-1991 Best, C.F 1989. For msurance buyers, It'S the law of supply and demand. Journal
of Risk Management, 54. Braeutigam, R. & Ronald, R. 1986. Cost functlon estlmatIon and quality bIas: The
regualted automobile msurance mdustry Rand. Journal of Economics, 606-617 FerralOlo', D. 1991. OvervIew of mternatIonal msurance. Best's ReView, 11-12.
Motor Insurance Industry 27
Fong, P 1990 (Dec). Motor msurance-policies and proposals to mmimize vehIcle damage fraud. MIl Journal, 55-64.
Gibson, J. 1990 (Dec). Motor underwntmg: Insurance WIthout fears - an expenenced underwnter's approach. MIl Journal, 3- 10.
Howard, L.S. 1988 (June). Auto rates affected by diverse factors. NatIOnal Underwriter, 9-1l.
Maatman, GL 1989. A proposal for change: Affordable automobile msurance. Journal of Risk and Insurance, 518-524.
Peng,O.C. 1992 (Dec). Prudent motor msurance loss reservmg. MIl Journal, 44-45. Rosenfield, D. 1987 (August). A model for predictmg frequencIes of random events.
Journal of Management SCIence, 947-954. Ross, S.M. 1985. ProbabilistiC models, AcademIc Press Orlando. Samson, D. & Thomas, H. 1987 (June). Lmear models as aIds m msurance decIsIon
makmg: The estImatIOn of automobile msurance claImS. Journal of Busmess Research, 247-256.
Tsuruoka, D. Too Risky for Comfort. Far Eastern Economic ReView, 9.
FakUlti Pengurusan PemIagaan UmvefSlt1 Kebangsaan MalaysIa 43600 UKM Bangi Selangor Daml Ehsan