Modeling route choice of utilitarian bikeshare users with GPS data 1 2 3 4 5 Ranjit Khatri 6 Email: [email protected]7 The University of Tennessee, Knoxville 8 311 John D. Tickle Building 9 Knoxville, Tennessee 37996-2313 10 11 Christopher R. Cherry 12 Email: [email protected]13 The University of Tennessee, Knoxville 14 321 John D. Tickle Building 15 Knoxville, Tennessee 37996-2313 16 17 Shashi S. Nambisan 18 Email: [email protected]19 The University of Tennessee, Knoxville 20 320 John D. Tickle Building 21 Knoxville, Tennessee 37996-2313 22 23 Lee D. Han 24 Email: [email protected]25 The University of Tennessee, Knoxville 26 319 John D. Tickle Building 27 Knoxville, Tennessee 37996-2313 28 29 30 31 32 33 34 35 Preprint please cite: 36 37 Khatri, R., C. Cherry, S. Nambisan, L. Han (2016) Modeling route choice of bikeshare 38 users with GPS data. Transportation Research Record: Journal of the Transportation 39 Research Board. 2587. Doi:10.3141/2587-17. 40 41 42 6,385 words + 2 figures (500 words) + 2 tables (500 words) = 7,385 words 43 44 45
Transcript
Modeling route choice of utilitarian bikeshare users with GPS data 1 2 3 4 5 Ranjit Khatri 6 Email: [email protected] 7 The University of Tennessee, Knoxville 8 311 John D. Tickle Building 9 Knoxville, Tennessee 37996-2313 10 11 Christopher R. Cherry 12 Email: [email protected] 13 The University of Tennessee, Knoxville 14 321 John D. Tickle Building 15 Knoxville, Tennessee 37996-2313 16 17 Shashi S. Nambisan 18 Email: [email protected] 19 The University of Tennessee, Knoxville 20 320 John D. Tickle Building 21 Knoxville, Tennessee 37996-2313 22 23 Lee D. Han 24 Email: [email protected] 25 The University of Tennessee, Knoxville 26 319 John D. Tickle Building 27 Knoxville, Tennessee 37996-2313 28 29 30 31 32 33
34 35
Preprint please cite: 36 37
Khatri, R., C. Cherry, S. Nambisan, L. Han (2016) Modeling route choice of bikeshare 38 users with GPS data. Transportation Research Record: Journal of the Transportation 39 Research Board. 2587. Doi:10.3141/2587-17. 40
41 42
6,385 words + 2 figures (500 words) + 2 tables (500 words) = 7,385 words 43 44
45
Khatri, Cherry, Nambisan, Han 2
ABSTRACT 1
Understanding bicyclist’s route choice is a difficult problem given the many factors that 2 influence attractiveness of different routes. The advent of low-cost GPS devices has made 3 route choice analysis more precise. Bikeshare, with instrumented bikes, allows for better 4 assessment of revealed route preference of a large sub-population of cyclists. In this paper, 5 we used GPS data obtained from 9,101 trips made by 1,866 bikeshare users from Grid 6 Bikeshare in Phoenix, Arizona. This unique bikeshare system relies on Social Bicycles’ 7 onboard telematics that allows non-station origins and destinations and operates on a grid 8 street network, both enabling unique route choice analysis. The trips only include direct 9 utilitarian trips; removing circuitous trips that could include multiple destinations or be 10 recreational trips. The analysis focused on facility usage assessment and route choice 11 behavior. The results were compared between two categories of bikeshare users, registered 12 users and casual users. Registered users made shorter trips including roads with low volume 13 and preferred bike specific infrastructure A Path Size Logit Model was used to model route 14 choice. Riders were very sensitive to travel distance, with little deviation from the shortest 15 path to utilize more bike-friendly infrastructure. Travel on the bike-specific facilities is 16 equivalent to decreasing distance by 44.9% (53.3% for casual users). Left turns imposed 17 higher disutility compared to right turns for casual users. The proportion of one-way 18 segments, AADT, and length of the trip have a negative influence on route choice and a 19 number of signalized intersections have a positive influence on selecting a route. The results 20 were also compared with previous studies. 21
22
Khatri, Cherry, Nambisan, Han 3
INTRODUCTION 1
Bicycle use has grown in most North American and European cities in the past decade. A 2 46% upsurge in bicycle commuting has been seen in the United States from 2005 to 2013 (1). 3 This increase could be attributed to the growing concerns among public over the lack of 4 physical activity, increased auto dependency resulting degraded air quality, and congestion 5 that results in environmental, social and economic costs. Hence, investment on bicycling 6 could result in health care cost savings, fuel savings, and reduced emissions (2) in addition to 7 an increase in commute mode share (3). 8 In the course of understanding the riding behavior of cyclists, there have been several 9 efforts to determine route choice behavior. Two main approaches to predict factors 10 influencing route choice behavior of cyclists hinge on either stated preference (SP) data (4-6) 11 or revealed preference (RP) data (7-9). Most of these studies have focused on the presence of 12 various bike-specific infrastructure, route attributes, individual characteristics, land use and 13 so on. There are numerous studies using SP data that exploits the advantages such as ease of 14 data collection and simplicity in modeling. Typical SP surveys will allow the participants to 15 rate different type of factors and choose among different side-by-side alternative routes. Most 16 of these studies attempt to model behavioral intent and are inflicted by the possibility of bias 17 from their actual behavior (4). The Recent development of low-cost GPS has made an 18 accurate collection of the actual routes possible. Some studies collect data through GPS 19 installed on the bike of the participants (10), whereas other studies make use of the 20 smartphone applications (7, 8) to collect data. In addition to reduced burden on the 21 participants to remember the route, RP study is low-cost, efficient in mapping the route and 22 determining attributes of the route. 23
Previous route choice models, either based on SP or RP, have consistent findings on 24 some of the factors that influence route choice decisions for bicyclists, like distance, safety, 25 turn frequency, road grade, intersection control, traffic volumes, land use and aesthetics along 26 the route (5, 7, 9, 11, 12). This behavior is inconsistent with the driver’s route choice, who 27 generally chose routes based primarily on distance and duration of travel. In general, travel 28 time and suitability of the route remain two major objectives while selecting a route (11). Of 29 all route attributes, provision of facilities dedicated to cycling have been portrayed as a factor 30 that induces new cyclists, in addition to encouraging existing cyclists (5, 13). Some studies 31 found bike lanes to be superior to all other bike facilities, from a user perspective (12), while 32 others found off-street bike facilities were valued more than other bike facilities. Different 33 from most of the studies, another study found that longer the length of the bike facility, 34 higher is the deviation from shortest route to use them (14). Proximity to bicycle facilities 35 was another factor that induces use of bicycle infrastructure (14). 36
Planners and engineers require quality bicycling data, preferably unbiased by self-37 selection, to understand the behavior of cyclists. These are complemented by new methods of 38 real-time data collection using dedicated GPS devices or built-in GPS in smartphones. These 39 have facilitated researchers and practitioners with new techniques to assess the route choice 40 and behavior of cyclists on the road. Some cyclists are using smartphone applications such as 41 Strava, MapMyRide, CycleMaps or other fitness tracking applications to record and track 42 their data in order to encourage physical activity (15). However, those data sources are not 43 usually accessible to planners. Leveraging this technology, some cities are utilizing GPS data 44 collection techniques from open source applications like Cycle Tracks (12). These data 45 collection techniques utilize built-in GPS capabilities of smartphones, which provides high 46 quality revealed data at a reduced cost compared to SP surveys. The collected data is sent to 47 remote servers without any requirement to go to field to retrieve the data. Several 48
Khatri, Cherry, Nambisan, Han 4
applications are being used by the cities of US and Canada, like Cycle Tracks (San Francisco, 1 Calif.), Cycle Atlanta (Atlanta, Georgia), CyclePhilly (Philadelphia, Penn.), My ResoVelo 2 (Montreal, Quebec), and I Bike KNX (Knoxville, Tenn.). The data from these apps can 3 inform transportation planning in these cities and allows for disaggregate analysis. One of the 4 challenges with app-based data collection is that users have to opt-in and use the application 5 for every trip. 6 In the last decade, bikesharing system has gained popularity in many North American 7 cities along with the other major cities in the world. There are more than one million bicycles 8 under bikesharing scheme in more than 500 cities of 49 countries (16). This allows 9 individuals to use a bicycle for a short period of time between fixed bikeshare stations. Some, 10 like Grid Bikeshare in Phoenix, Ariz., have facilitated the use of public racks as the bike 11 stations, removing the requirement to return bikes to bikeshare stations. Bikeshare is meant 12 for efficient short-distance travel, thus solving the “first/last mile problem” by connecting to 13 other modes or providing urban circulation. Furthermore, bikeshare is meant for inducing 14 individuals to cycle and increasing total bicycle trips in a city. Although it can be beneficial 15 in reducing car use and increasing bicycle trips, some results suggest that bikeshare replaces 16 mostly public transit trips and walk trips rather than car trips (17, 18). In addition to 17 expanding docking stations and making convenient use of bikeshare, high substitution of car 18 trips could be obtained by making the travel time of bikeshare trips competitive to that of car 19 trip by achieving efficient routing or improving bicycle amenities (18). 20
Bikeshare systems are ripe for developing new data streams to understand bicycling 21 behavior in cities. Several recent studies have mined bikeshare data to understand flows 22 between stations and identify differences in user types (19). Bikeshare users are generally 23 classified as registered users (frequent users who subscribe to a membership that usually 24 includes unlimited use for the duration of the membership) and casual users (occasional users 25 who pay for service as they use it, often tourists). Unlike the casual users, who primarily 26 make recreational trips, commuting is the main purpose for registered users (18). 27
Most of the previous literature on bikeshare users focus on the demographics of users 28 (20), or station or system performance (19, 21). Recent bikeshare systems have included 29 vehicle-tracking telematics onboard the bicycle, which allows for a finer level of analysis, 30 i.e., vehicle-level analysis instead of station-level of analysis. This has opened a new 31 opportunity to investigate route choice, particularly as it relates to safety and comfort, of an 32 entire sub-population of bicyclists, bikeshare users. This subpopulation is an important group 33 because it constitutes a large portion of urban cyclists and represents an important part of the 34 travel trip, generally short urban center trips. To the author’s knowledge, there is no study 35 based on the real-time GPS data of bicyclists in bikeshare systems. Although there are many 36 route choice models trying to describe the conventional bicyclists’ trip patterns, 37 understanding the decision pattern of the bikeshare users is an important aspect of the route 38 choice question. This study relies on data from one of the first GPS-enabled bikeshare 39 systems in North America, the Grid Bikeshare system in Phoenix, Ariz. This system is unique 40 because it relies on Social Bicycles’ (SoBi) onboard telematics, it utilizes a more flexible 41 station and pricing protocol (e.g., users are not required to return bikes to stations), and it is 42 deployed in a city with a grid street network that provides many possible route choices. We 43 investigate and model bikeshare riders’ route choice and identify factors that influence that 44 choice. This is done using GPS tracks for each trip and conducting GIS-based analysis to 45 create alternative routes, similar to other studies, but with a more robust dataset and user type. 46 The rest of the paper presents the methodology that describes the data and modeling 47 approach, the results of the model, and conclusions and recommendations. 48
Khatri, Cherry, Nambisan, Han 5
METHODOLOGY 1
Data Description 2 Data were collected from Grid Bikeshare, which began operation in Phoenix, Ariz. in 2014. 3 The Grid Bikeshare system was installed in Fall 2014 and includes about 500 bikes and 39 4 stations (or hubs). The stations cover an area that is approximately 2.5 km East to West and 8 5 km North to South, covering downtown Phoenix. The system is also in the process of 6 expanding to Tempe and Mesa. Although the system relies heavily on stations, users can also 7 park bikes away from stations for a small fee. The target population for the study was all 8 registered users cyclists who either register monthly/annually for the bikeshare or are casual 9 users paying a marginal per-trip fee to rent a bike. The total dataset is segmented intro two 10 general categories: registered and casual users. The data used in this study include trips made 11 from November 2014 to May 2015, which includes 9,101 trips made by 1,866 users after data 12 cleaning. The available GPS data, collected by the telematics system, did not have 13 timestamps for each point and were not uniformly spaced in terms of time or distance. 14 However, date and time of the start and end of each trip were known. The frequency of the 15 GPS readings varied from 1 per minute to 25 per minute. 16 Data Cleaning 17
For each trip, data were collected using GPS devices. GPS data logging frequency varied but 18 their sub-minute resolution allowed reasonable route assignment. Raw GPS data obtained 19 were cleaned for further analysis in order to prevent any incorrect interpretation from the 20 results of the study. The GPS data includes errors, which could be associated with urban 21 canyons, unavailability of satellites, quality of GPS unit, and others. In addition to removing 22 the “error points”, another main objective of the data cleaning is to remove all the possible 23 recreational trips. With a high number of trips made on weekends [Figure 1(c)], it becomes 24 necessary to remove possible recreational trips. This was done for the current scope of 25 analysis because bicycle trips for recreational purposes are very different from the utilitarian 26 trips. For instance, recreational cyclists might be using longer route including bicycle-specific 27 facilities without apparent destinations. Also, many recreational trips returned to the origin, 28 or included loops, making route assignment and identification of alternate routes challenging 29 at best. The following are the two basic criteria for the data cleaning process. 30
1. Trips with following criteria were removed 31 a. Travel Time < 1 min 32 b. Travel Time > 90 minutes 33 c. Travel distance < 0.02 miles 34 d. Travel distance > 10 miles 35 e. Average velocity <1.5 mph 36 f. Average velocity > 25 mph 37 g. Trips having fewer than 10 GPS points 38
39 2. Trips based on the origin and destination and shortest distance were removed to eliminate 40
circuitous tours that were not likely destined for a specific place. 41 a. Trip distance > 3 × Euclidean O-D distance 42 b. Trip distance > 2.5 × shortest possible travel distance between the O-D pair 43
44
There were 20,468 trips in the raw data. Using first criteria mentioned above, 3,925 45 trips (20% of 20,468) were removed. For the remaining 16,543 trips, criteria 2(a) removed 46 approximately 25% of the remaining trips. There were only additional 71 trips deleted from 47
Khatri, Cherry, Nambisan, Han 6
the criteria 2(b), as most of the trips satisfying criteria 2(b) also satisfied criteria 2(a), and 1 were previously removed. There was a change in demographics of trips after data cleaning. 2 For casual members, the percentage of users, total miles traveled, and the number of trips 3 were reduced from 92% to 85%, 77% to 63% and 68% to 56%, respectively. For registered 4 members, the percentage of a number of users, total miles traveled, and the number of trips 5 increased from 8% to 15%, 32% to 44% and 23% to 37%, respectively. The majority of the 6 trips removed were casual trips. 7
Completing the road network 8 The road network in a GIS environment was provided by the Maricopa Association of 9 Governments. It included attributes for roadway segments that are of interest to this study 10 (e.g., Average Annual Daily Traffic (AADT), geometry, and bike-specific facilities.). We 11 supplemented that spatial dataset with crash data, speed limits and locations of signalized 12 intersections. The GPS data were matched to the road network after cleaning. For that 13 purpose, the road network had to be supplemented by additional links to predict the path of 14 the cyclists. In contrast to the motor vehicle drivers, the path followed by bicyclists includes 15 those links, which may not be present in the base network, such as parking facilities, alleys, 16 or shared use paths. Hence, all the additional or missing links were added using an ArcGIS 17 interface to include all the links used for bike travel. 18 Map matching 19
The raw GPS coordinates available from the bikeshare users were matched to the street 20 segments to identify all the links that were traversed during the trip. However, it is difficult to 21 estimate the path with high accuracy. Key reasons behind this are the inaccuracy of the data 22 points and the use of the sidewalks, parking lots and alleys, which are not represented as the 23 separate features on the map. The available methods for the map matching are geometric map 24 matching, topological map matching, and advanced map matching. The method used for this 25 study to match the GPS points is obtained from the study by Hudson et al. (22), which uses 26 the ArcGIS model for predicting the actual path of the bicyclists based on an algorithm 27 developed by Dalumpines and Scott (23). This algorithm successfully implements geometric 28 and topological map matching procedure with the help of network functions in ArcGIS. The 29 GIS model used the buffer of 250 feet around each GPS point for implementing the 30 algorithm. This value of 250 feet is determined based upon trial and error with the sample 31 trips, which provided the highest accuracy of matched trips. Two consecutive points should 32 be less than 500 ft. (Euclidean distance) apart to create the continuous restriction feature 33 while implementing the GIS model. Since the frequency of the GPS points was not uniform, 34 out of 12,454 trips used for map matching, 9,101 trips that accurately matched to the street 35 were used for final analysis. 36
Generation of Choice Sets 37 Alternative routes for the pair of origin and destination were created using the Network 38 Analyst extension in ArcGIS10.1. In total, there were six alternatives: five non-chosen and 39 one chosen alternative. Simple Labeled Route method was used to generate five non-chosen 40 alternatives (24). In this method, the shortest path between origin and destination was 41 determined such that certain attributes of the path were either maximized or minimized. The 42 five alternatives were created by maximizing use of bicycle friendly infrastructure along the 43 route and minimizing length, the number of signalized intersections, the proportion of one-44 way road segments and the number of junctions separately. These alternative routes were 45 joined to the street networks of the study area to attain attributes along the route. 46
47
Khatri, Cherry, Nambisan, Han 7
Discrete Route Choice Model 1
Discrete route choice methods empirically model and analyze the decision maker’s 2 preferences among a set of alternatives available to them (7, 11-13). The Multinomial Logit 3 (MNL) model is the simplest among the family of logit models, for which the probability of 4 choosing the alternative i among the alternatives available in the choice set Cn is given by 5
𝑃 𝑖 𝐶! =
exp 𝑉!"exp 𝑉!"!∈!"
(1)
Where, Cn is the choice set of alternatives, i is the chosen alternative, j is any 6 alternative within Cn, Vin and Vjn are the utility of the alternative i and j. 7
The Independence of Irrelevant Alternatives (IIA) property of the MNL model 8 suggests that the alternatives should be mutually exclusive, i.e. the alternative routes should 9 not have overlapping routes. If this is property is not considered, MNL will overestimate the 10 overlapping paths. Hence, a correction is introduced in the model in the form of a Path Size 11 (PS) factor given by following equation (25). 12
𝑃𝑆!" =
𝑙!𝐿!!∈Г!
1
(𝐿!𝐿!)ᵞ𝛿!"!∈!"
(2)
Where, la is the length of link a, Li is the length of the alternative i, Гi is the set of the 13 links of alternative i, δaj = 1 if j includes the link a, 0 otherwise, and ɣ = long-path correction 14 factor, which is considered 0 in our case. For this study, due to the few number of 15 alternatives, there are not any very long alternatives in our choice set Cn. Hence, the above 16 equation will be reduced to the basic Path Size Logit (PSL) model (26). After the correction 17 factor of PSL, the resulting probability that the alternative i is chosen from choice set Cn is 18 given by 19
𝑃 𝑖 𝐶! =
exp 𝑉!" + ln (𝑃𝑆!"exp 𝑉!" + ln (𝑃𝑆!")!∈!"
(3)
Where PSin will have values between 0 and 1, and hence, the ln(PSin) is always 20 negative. This implies that the utility decreases when there is more overlap between the 21 alternatives, as we are introducing the penalty for the route by introducing the path size factor. 22 The model was estimated through the freely available software Easy Logit Modeler (27). The 23 new form of the deterministic part of the utility function will be: 24
Un= βxn + βPS * ln (path size) (4) 25
Where, xn is the vector of attributes of the route and β is the estimated coefficient. 26 27
Distance trade-off calculation 28 To aid in interpretation, we can estimate marginal rates of substitution between distance and 29 other explanatory variables. The distance trade-off for a unit change in attributes can be 30 determined after estimating the utility coefficients of the attributes from following equation 31 for the non-unit changes: 32
Where β is the coefficient of the attributes of the path estimated from the model. 1 2
RESULTS 3 Descriptive Results 4
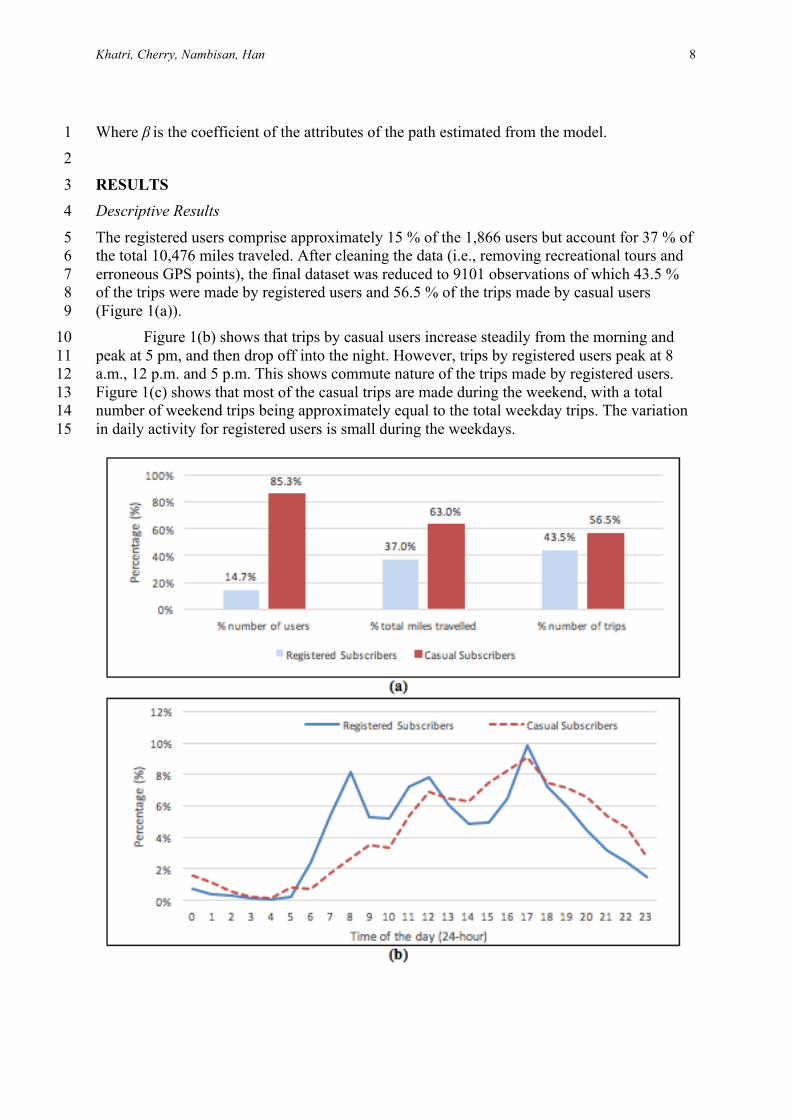
The registered users comprise approximately 15 % of the 1,866 users but account for 37 % of 5 the total 10,476 miles traveled. After cleaning the data (i.e., removing recreational tours and 6 erroneous GPS points), the final dataset was reduced to 9101 observations of which 43.5 % 7 of the trips were made by registered users and 56.5 % of the trips made by casual users 8 (Figure 1(a)). 9
Figure 1(b) shows that trips by casual users increase steadily from the morning and 10 peak at 5 pm, and then drop off into the night. However, trips by registered users peak at 8 11 a.m., 12 p.m. and 5 p.m. This shows commute nature of the trips made by registered users. 12 Figure 1(c) shows that most of the casual trips are made during the weekend, with a total 13 number of weekend trips being approximately equal to the total weekday trips. The variation 14 in daily activity for registered users is small during the weekdays. 15
Khatri, Cherry, Nambisan, Han 9
FIGURE 1 (a) Distribution of registered and casual users (b) Time of the day variation 1 for a percentage of trips for registered and casual users (c) Day of the week variation of 2 a number of trips for registered and casual users. 3
4
The trip behavior of the two user groups differed. The mean distance of the trips for 5 registered and casual users were 1.0 (std. dev: 0.64) and 1.3 (std. dev: 0.95) miles, 6 respectively; and similarly, the mean duration of the trip was 9.5 (std. dev: 7.2) and 14.5 (std. 7 dev: 11.7) minutes, respectively. Registered users were making high percentage (69%) of 8 trips with a travel time of less than 10 minutes. In contrast, 45% of casual user’s trips are less 9 than 10 minutes. Similarly, only 2% of the registered user’s trips and 10% of the casual user’s 10 trips have traveled time greater than 30 minutes. The statistics of the usage of roadway 11 infrastructure based on various characteristics of roadways provide insights on the behavior 12 of these users. A high proportion of registered users preferred using lower volume and lower 13 speed streets (Figure 2a, 2b, and 2c) implying familiarity with alternative routes on the 14 network. In contrast, the casual users were more inclined to use the higher volume and higher 15 speed roads. 16
Khatri, Cherry, Nambisan, Han 10
FIGURE 2 (a) Distribution of travel distance over classifications of roads (b) 1 Distribution of travel distance over a range of AADT (c) Distribution of travel distance 2 over different posted speed limit. 3
4 Model Results 5
Before modeling, the correlation between variables was analyzed. The speed limit was found 6 to be highly correlated with AADT along the route (Correlation Coefficient=0.60, p-7 value=0.000). AADT was included and the speed limit was excluded from a final model 8 based upon likelihood ratio test. AADT was scaled to a smaller value dividing by 1000 to 9 obtain more appropriately scaled parameter estimates. Furthermore, bicycle-vehicle-crash per 10 mile was tested in the model because it was hypothesized that number of crashes would act as 11 a proxy to the dangerous road. However, this variable was insignificant. Bikeshare users do 12 not likely know the number of bicycle-motor vehicle collision (or risk proxy) and could not 13 respond accordingly to avoid the routes with a high number of crashes. 14
Table 1 presents results for the estimation of the final Path Size Logit route choice 15 model. Two models were developed, one for registered subscribers and one for casual 16
Khatri, Cherry, Nambisan, Han 11
subscribers. The negative coefficient for distance variable supports the well-known fact that 1 bicyclists prefer shorter routes among available alternatives unless there are other desirable 2 attributes of other alternatives that outweigh the advantage of short distance. The magnitude 3 of the coefficient suggests that registered users are more sensitive to the length of selected 4 route compared to casual users. This is likely because registered users use bikeshare to make 5 utilitarian trips in most of the cases, which is reinforced by the time of the day and week of 6 the day variation shown in Figure 1(b) and 1 (c). The average length of the observed path for 7 registered users and casual users is 6.9 % and 8.3 % higher than the average length of shortest 8 path respectively. This statistics not only bolsters the difference in preference of these two 9 groups over the length of the route but also points to other factors influencing route choice. 10
AADT is associated with negative utility for both categories of users (Table 1). The 11 risks associated while traveling along high volume roads, which affects the perceived safety 12 of the users, is likely a major reason for the disutility towards high volume roads. The extent 13 of disutility is slightly higher for registered users. Registered users are those users who are 14 committed to using bikeshare system, and subscribed bikeshare for a month or year. Hence, 15 they are most likely to have information on which roads have a high flow of vehicles in the 16 surrounding network, and avoid them as far as possible. AADT was interacted with the peak 17 hour (7 am-9 am and 4 pm-6 pm) to test if the time of the day has an effect on route choice. 18 However, the disutility of high AADT perceived by bikeshare users does not change 19 significantly over the time of the day. 20
Both groups of users have a high preference towards including bike-specific facilities 21 on their route. This finding supports previous literature that asserts the preference of bike 22 lanes and bike routes among cyclists. Use of bike lanes, shared path or multiuse path have 23 many inherent advantages such as separation from high-speed traffic and increase in 24 perceived safety and freedom to ride at their preferred speed Travel on the bike-specific 25 facilities is equivalent to decreasing distance by 44.9% (53.3% for casual users). In peak 26 hours, registered users are more likely to use bike-specific facilities as compared to off-peak 27 hours. As bicycle facilities provide efficient and fast travel, registered users prefer using 28 bicycle facilities to avoid delay during peak hours. There is similar effect among casual users 29 but they are less sensitive towards using bike-specific facilities than registered users. 30
Registered users avoid including one-way road segments in their trip as far as 31 possible. The route choice behavior of casual users is not definitive regarding the inclusion of 32 one-way road segments. Registered users are aware of the information on the competing 33 routes, which allows them to choose a route that minimizes or avoids one-way street 34 segments. On the other hand, casual users (sometime tourists and most of the time infrequent 35 bicyclists) are unaware of the alternatives and could not avoid these segments. 36
A number of signalized intersections along the route is a positive factor for the 37 selection of the route. The coefficients for the number of signals per mile are equal for both 38 groups of bikeshare users. This result could be counterintuitive that the signalized 39 intersection on the route decreases the utility of the route because these intersections add 40 delay and potential risk. However, this might not be always true. Signalized intersections 41 provide relatively safe, protected crossings of large roadways. It is also reasonable that, in a 42 grid network, cyclists tend to ride on main arterials and tend to avoid routes that require them 43 to cross un-signalized (e.g., midblock) minor street crossings. The downtown Phoenix area is 44 highly signalized, making it difficult to avoid signals along various routes. 45
The number of turns along the route is another factor that a cyclist accounts for while 46 choosing a route. Both, registered and casual users, valued routes with fewer left- and right-47 turns, but in a different manner as suggested from Table 1. The difference in the value of 48
Khatri, Cherry, Nambisan, Han 12
coefficient shows that cyclists, in general, have a greater aversion to left turns compared to 1 right turns, as expected. The higher delay associated with left turns, at signalized as well as 2 TABLE 1 Estimation of Utility Coefficients 3
4
5
un-signalized intersections, and additional safety risk associated left turns compared to right 6 turns could be the main reasons for disutility of this variable for both users. The difference is 7 more pronounced for casual cyclists, but registered users do not seem to differentiate much 8 between left and right turns in terms of utility. We found that registered users mostly travel 9 on low volume and low-speed roads. Since the left and right turns have a similar effect in 10 terms of delay time or difficulty in maneuvering in low volume and low-speed roads mostly 11 traversed by registered users, they might give equal priority to left and right turns. For each 12 left turn, registered users would choose routes that were 3.2 % longer (6.3 % for casual users) 13 (Table 2). Corresponding additional percentage of route length for additional one right turn is 14 3.1 % and 4.8 % for each additional right turn. This clarifies the comparison between left and 15 right turns on the route made by registered and casual and users. 16
Effect of time of the day and day of the week was analyzed. For this, morning and 17 evening peak hour (7 am to 9 am and 4 pm to 6 pm) are categorized as peak hour. This 18 variable is interacted with other variables of the model. The proportion of bike-specific 19 facilities, the proportion of one-way road segments and trip length had significantly different 20 effects compared to off-peak hours. Both users were more likely to make shorter trip 21 avoiding one-way segments and including bike specific facilities. Other variables did not 22 have distinctly different effects at different times of the day. Travel on bike-specific facilities 23 in peak hour is equivalent to decreasing distance by 20.9% for registered users (17.1% for 24 casual users) compared to off-peak hours. Peak hour traffic and delays associated with travel 25
Est. Coeff. t -stat Rand. Err. Est.Coeff t -stat Rand. Err.ln(length) -4.64 -17.77 0.261 -2.83 -15.05 0.188Proportion of bike facilities 2.77 17.78 0.156 2.16 19.32 0.112Number of left turns per mile -0.14 -10.22 0.014 -0.17 -13.61 0.013Number of right turns per mile -0.14 -9.91 0.014 -0.13 -10.66 0.012Proportion of one way -0.43 -3.63 0.119 0.11 1.20** 0.090Numbers of signals per mile 0.25 17.99 0.014 0.24 20.81 0.012AADT/1000 -0.16 -21.27 0.007 -0.08 -15.80 0.005ln(length)*Peak hour -3.97 -6.63 0.598 -2.45 -5.19 0.472Proportion of bike * Peak hour 0.93 3.23 0.288 0.46 1.92* 0.239Proportion of one way * peak hour -0.57 -2.61 0.219 -0.49 -2.42 0.202ln(PS) 1.26 15.77 0.080 1.17 18.82 0.062
Log Likelihood at Zero -5587.23 -7533.47Log Likelihood at Convergence -4140.59 -6284.41Adjusted Rho Squared w.r.t. Zero 0.2569 0.1643Number of Cases 3958 5143** - Insignificant* - Significant at 90% Confidence Limit
Registered Subscribers Casual SubscribersVariable
Khatri, Cherry, Nambisan, Han 13
could be the major reason for selecting shorter routes by both users. This result also bolsters 1 the sensitiveness of registered users towards shorter trip length compared to casual users. 2 TABLE 2 Marginal Rate of Substitution with Distance (%) for Unit Change in 3 Attribute 4
Proportion of bike facilities -44.9 -53.3 Number of left turns per mile 3.2 6.3 Number of right turns per mile 3.1 4.8 Proportion of one-way 9.8 -3.7 Number of signals per mile -5.2 -8.2
Peak hour (Baseline: Off peak hour) Proportion of bike facilities -20.9 -17.1
Proportion of one-way facilities 15.5 22.0 5 Similarly, the advantage of fast travel without being interfered by a large number of high-6 speed vehicles during peak hour, in addition to increased perceived safety, can explain the 7 preference of bike specific facilities during peak hour as compared to an off-peak hour. A key 8 unobserved factor that likely varies between times of day, demographics, likely affects the 9 differences as well. 10
As the utility of overlapping paths is overestimated in the MNL, Path Size Correction 11 is introduced to adjust the utilities for overlap. Since the value of PS lies between 0 and 1 (1 12 for the unique route), ln (PS) is always negative. This will reduce the deterministic utility of 13 the route based on the degree of overlap. Hence, this corrects the overestimated utility of 14 overlapping routes in a set of alternatives. Similarly, the estimate of ln(PS) should be positive 15 and significantly different from 1, similar to our results (28). 16
17 DISCUSSION AND CONCLUSION 18
The main objective of the study was to use the real-time GPS data to determine the route 19 choice preference of bikeshare users. Although, the number of bikeshare system has 20 increased sharply in North America, thorough research on the behavior and route selection in 21 unknown, especially for bikeshare users. This research is unique because it is among the first 22 that looks at route-level analysis of bikeshare trip (enabled by GPS), it relies on a system 23 without strict station origin and destinations, and it is operated in a city with a grid 24 transportation system enabling many feasible alternative routes. 25
The findings from this paper can be compared across other studies of bicyclist route 26 choice. Several consistencies exist between this and previous studies that examine 27 conventional cyclists. Negative utility for the longer trips is consistent with all of the previous 28 studies. The length of the route results in negative utility for all of the studies. Consistent 29 positive preferences towards bike facilities can be seen in previous studies (9, 12, 13). A 30 study in San Francisco, California (12) found cyclists are willing to add a mile on bike lanes 31 in exchange for 0.5 miles of ordinary roads. This result is very near to the result of our study, 32 which indicates that if there is one mile of road with bicycle facilities it is equivalent to 0.55 33 miles of normal road (0.47 miles for casual users). A number of turns per mile was found to 34
Khatri, Cherry, Nambisan, Han 14
have distance trade-off value of 4.2% (commute trips) and 7.4% (non-commute trips 1 respectively (7).Left and right turns are analyzed separately in this paper. For registered and 2 casual users, distance trade-off is 3.2% for left-turn (3.2% for right turn) and 6.3% for left-3 turn (4.8% for right-turn) respectively. This gives a ground for comparability of registered 4 and casual users with the commute and non-commute trips. Other studies, however, estimated 5 17 % distance value for one turn. This is significantly higher than the value estimated by this 6 study (12). Signalized intersections were found to be used while crossing major roadways and 7 turning, traffic volume has a consistently negative impact on route choice (5, 13), especially 8 for left turns in the cross street with high AADT relative to right turns with the same AADT 9 in cross streets (7). This result of negative utility for AADT is consistent with this study too. 10 In spite of various studies that identify the possible risk factors for the cyclists making turns 11 or making through movements at signalized intersections (29), our study found preferences 12 towards signalized intersections. This might be attributed to either different behavior of 13 bikeshare users or benefits of protected phases through signalized intersections. 14
Since most of the origin and destination were fixed, though this bikeshare system 15 allows non-station origins and destinations, a future study could focus on the influence of the 16 placement of these stations on the route choice model to balance placing stations on visible, 17 busy streets that force users to ride on those streets for station access. The riders tended to 18 value travel distance more than other factors and planners should focus on providing better 19 alternative route information, especially to non-subscribing users, identifying station 20 locations that allow direct access to bike-friendly routes, and improving the safety and 21 operations of routes in the service area in regard to cycling (e.g., lowering speed limits on 22 main corridors). 23
This study suffers from several limitations. Discrete choice modeling was used due to 24 its simplicity and predictive power and precedence in route choice analysis. The future 25 research could utilize the alternative model forms such as machine learning and compare the 26 results with that of the discrete choice model. As a purely revealed preference study, we do 27 not know anything about the actual alternative routes that are in the choice set of the users. 28 We estimated five reasonable alternative routes. We also do not have any information on 29 demographic factors, such as age, gender, income, cycling frequency etc. that could influence 30 route choice or value of attributes. A Recent result from Capital Bikeshare member survey 31 report has identified that bikeshare users tend to be young, high income, white, and male 32 (30). We begin to understand some of these difference with the two different classes of users 33 (casual and registered). This study only focuses on a subset of cyclists, bikeshare riders, and 34 is not representative of many urban cyclists. This data, hence, suffers from self-selection bias, 35 those who self-select into bikeshare systems and choose a route, not those who decide not to 36 ride a bike because of the suitable route. Still, this paper provides a first attempt to estimate 37 route choice for an important and growing sub-population of cyclists, bikeshare users. 38
39 ACKNOWLEDGEMENTS 40
The authors would like to thank Southeastern Transportation Center (STC), a Federal 41 University Transportation Center, for funding this project and Social Bicycles for providing 42 the GPS data from the Grid Bikeshare, in Phoenix Arizona. 43 44
REFERENCES 45 1. League of American Bicyclists, Where we ride, analysis of bicycle commuting in American 46
cities. 2014. 47
Khatri, Cherry, Nambisan, Han 15
2. Gotschi, T., Costs and benefits of bicycling investments in Portland, Oregon. Journal of 1
Physical Activity and Health, 2011. 8(1): p. S49-S58. 2 3. Barnes, G., K. Thompson, and K. Krizek. A longitudinal analysis of the effect of bicycle 3
facilities on commute mode share. in 85th Annual Meeting of the Transportation Research 4 Board. Transportation Research Board, Washington, DC. 2006. 5
4. Stinson, M. and C. Bhat, Commuter bicyclist route choice: analysis using a stated preference 6 survey. Transportation Research Record: Journal of the Transportation Research Board, 7 2003(1828): p. 107-115. 8
5. Sener, I.N., N. Eluru, and C.R. Bhat, An analysis of bicycle route choice preferences in Texas, 9 US. Transportation, 2009. 36(5): p. 511-539. 10
6. Segadilha, A.B.P. and S. da Penha Sanches, Identification of Factors that Influence Cyclistś 11 Route Choice. Procedia-Social and Behavioral Sciences, 2014. 160: p. 372-380. 12
7. Broach, J., J. Dill, and J. Gliebe, Where do cyclists ride? A route choice model developed with 13 revealed preference GPS data. Transportation Research Part A: Policy and Practice, 2012. 14 46(10): p. 1730-1740. 15
8. Dill, J. and J. Gliebe, Understanding and measuring bicycling behavior: A focus on travel 16 time and route choice. 2008. 17
9. Broach, J., J. Gliebe, and J. Dill, Development of a Multi-class bicyclist route choice model 18 using revealed preference data. 2009. 19
10. Langford, B.C., A comparative health and safety analysis of electric-assist and regular 20 bicycles in an on-campus bicycle sharing system. 2013. 21
11. Ehrgott, M., J.Y. Wang, A. Raith, and C. Van Houtte, A bi-objective cyclist route choice 22 model. Transportation research part A: policy and practice, 2012. 46(4): p. 652-663. 23
12. Hood, J., E. Sall, and B. Charlton, A GPS-based bicycle route choice model for San 24 Francisco, California. Transportation letters, 2011. 3(1): p. 63-75. 25
13. Menghini, G., N. Carrasco, N. Schüssler, and K.W. Axhausen, Route choice of cyclists in 26 Zurich. Transportation research part A: policy and practice, 2010. 44(9): p. 754-765. 27
14. Larsen, J. and A. El-Geneidy, A travel behavior analysis of urban cycling facilities in 28 Montréal, Canada. Transportation research part D: transport and environment, 2011. 16(2): p. 29 172-177. 30
15. Klasnja, P. and W. Pratt, Healthcare in the pocket: mapping the space of mobile-phone health 31 interventions. Journal of biomedical informatics, 2012. 45(1): p. 184-198. 32
16. Franke, P., The Adoption of Motorized Two Wheelers: A Study of Transportation development 33 in Shanghai, China, in Department of City and Regional Planning. 1997, University of 34 California, Berkeley. 35
17. Shaheen, S., S. Guzman, and H. Zhang, Bikesharing in Europe, the Americas, and Asia: past, 36 present, and future. Transportation Research Record: Journal of the Transportation Research 37 Board, 2010(2143): p. 159-167. 38
18. Fishman, E., S. Washington, and N. Haworth, Bike Share: A Synthesis of the Literature. 39 Transport Reviews, 2013. 33(2): p. 148-165. 40
19. Wang, X., G. Lindsey, J.E. Schoner, and A. Harrison, Modeling Bike Share Station Activity: 41 Effects of Nearby Businesses and Jobs on Trips to and from Stations. Journal of Urban 42 Planning and Development, 2015: p. 04015001. 43
20. Buck, D., R. Buehler, P. Happ, B. Rawls, P. Chung, and N. Borecki, Are Bikeshare Users 44 Different from Regular Cyclists? A First Look at Short-Term Users, Annual Members, and 45 Area Cyclists in the Washington, DC, Region. Transportation Research Record: Journal of the 46 Transportation Research Board, 2013(2387): p. 112-119. 47
21. Schoner, J. and D. Levinson, Which Station? Access Trips and Bike Share Route Choice. 48 2013. 49
22. Hudson, J.G., J.C. Duthie, Y.K. Rathod, K.A. Larsen, and J.L. Meyer, Using smartphones to 50 collect bicycle travel data in Texas. 2012. 51
23. Dalumpines, R. and D.M. Scott, GIS-based map-matching: Development and demonstration 52 of a postprocessing map-matching algorithm for transportation research, in Advancing 53 geoinformation science for a changing world. 2011, Springer. p. 101-120. 54
Khatri, Cherry, Nambisan, Han 16
24. Ben-Akiva, M., M. Bergman, A.J. Daly, and R. Ramaswamy. Modeling inter-urban route 1
choice behaviour. in Proceedings of the 9th International Symposium on Transportation and 2 Traffic Theory, VNU Press, Utrecht. 1984. 3
25. Ramming, M.S., Network knowledge and route choice. 2001, Massachusetts Institute of 4 Technology. 5
26. NMCBen-Akiva, M. and M. Bierlaire, Discrete choice methods and their applications to 6 short term travel decisions, in Handbook of transportation science. 1999, Springer. p. 5-33. 7
27. Santos, A., N. McGuckin, H.Y. Nakamoto, D. Gray, and S. Liss, Summary of travel trends: 8 2009 national household travel survey. 2011. 9
28. Frejinger, E. and M. Bierlaire, Capturing correlation with subnetworks in route choice 10 models. Transportation Research Part B: Methodological, 2007. 41(3): p. 363-378. 11
29. Wachtel, A. and D. Lewiston, Risk factors for bicycle-motor vehicle collisions at 12 intersections. ITE Journal(Institute of Transportation Engineers), 1994. 64(9): p. 30-35. 13
30. 2014 Capital Bikeshare Member Survey Report. Available from: 14 http://www.capitalbikeshare.com/assets/pdf/cabi-2014surveyreport.pdf. 15