CCC ANNUAL REPORT CCC ANNUAL REPORT UIUC, August 12, 2010 Modeling Steel Slab Heat Transfer During Scarfing Processing Xiaoxu Zhou Brian G. Thomas Department of Mechanical Science and Engineering Department of Mechanical Science and Engineering University of Illinois at Urbana-Champaign Objective and Methodology • Objective: – To get basic ideas of heat transfer mechanism in scarfing processing • Methodology: Experiment & Modeling to make prediction match – Experiment & Modeling to make prediction match measurements University of Illinois at Urbana-Champaign • Metals Processing Simulation Lab • Xiaoxu Zhou 2
Transcript
CCC ANNUAL REPORTCCC ANNUAL REPORTUIUC, August 12, 2010
Modeling Steel Slab Heat Transfer
During Scarfing Processing
Xiaoxu ZhouBrian G. Thomas
Department of Mechanical Science and EngineeringDepartment of Mechanical Science and Engineering
University of Illinois at Urbana-Champaign
Objective and Methodology
• Objective: – To get basic ideas of heat transfer mechanism in
scarfing processing
• Methodology: Experiment & Modeling to make prediction match– Experiment & Modeling to make prediction match measurements
University of Illinois at Urbana-Champaign • Metals Processing Simulation Lab • Xiaoxu Zhou 2
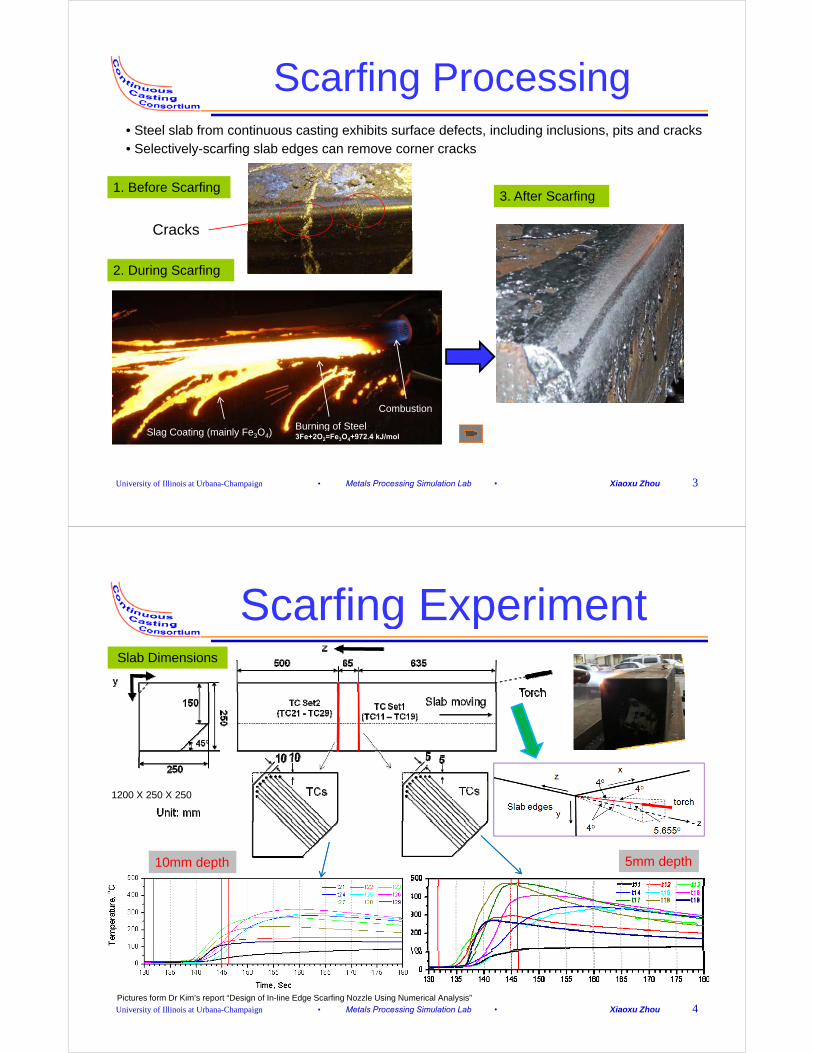
Scarfing Processing• Steel slab from continuous casting exhibits surface defects, including inclusions, pits and cracks• Selectively-scarfing slab edges can remove corner cracks
1. Before Scarfing3. After Scarfing
Cracks
2. During Scarfing
Cracks
Combustion
Burning of Steel
University of Illinois at Urbana-Champaign • Metals Processing Simulation Lab • Xiaoxu Zhou 3
Burning of Steel3Fe+2O2=Fe3O4+972.4 kJ/molSlag Coating (mainly Fe3O4)
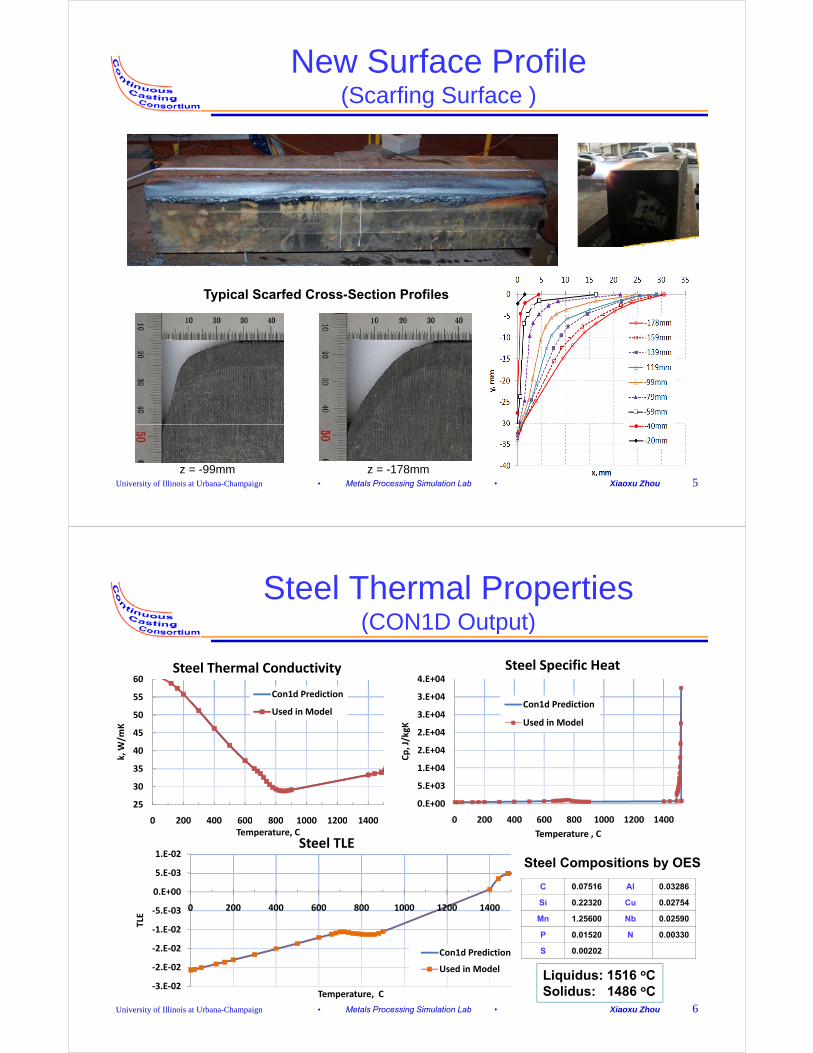
Scarfing Experimentg pSlab Dimensions
1200 X 250 X 250
5mm depth10mm depth
University of Illinois at Urbana-Champaign • Metals Processing Simulation Lab • Xiaoxu Zhou 4Pictures form Dr Kim’s report “Design of In-line Edge Scarfing Nozzle Using Numerical Analysis”
New Surface Profile(Scarfing Surface )(Scarfing Surface )
University of Illinois at Urbana-Champaign • Metals Processing Simulation Lab • Xiaoxu Zhou 6
-3.E-02
-2.E-02
2.E 02
Temperature, C
Con1d Prediction
Used in Model
S 0.00202
Liquidus: 1516 oCSolidus: 1486 oC
Two-Step ModelStep-1 model: Steady state heat transfer model with advection to get the first 12.3 s temp history
Scarfing Speed48.55mm/s
y z
( ) ( ( ) )pC T V T k T Tρ •∇ = ∇ • ∇
48.55mm/sx
Eulerian Method
St 2 d l T i t h t t fStep-2 model : Transient heat transfer model without advection to get the following 110s temp history
Lagrangian Method
University of Illinois at Urbana-Champaign • Metals Processing Simulation Lab • Xiaoxu Zhou 7
( ) ( ( ) )p
TC T k T T
tρ ∂ = ∇ • ∇
∂•Gambit is used to create the geometries•Fluent is used to do heat transfer calculation
Lagrangian Method
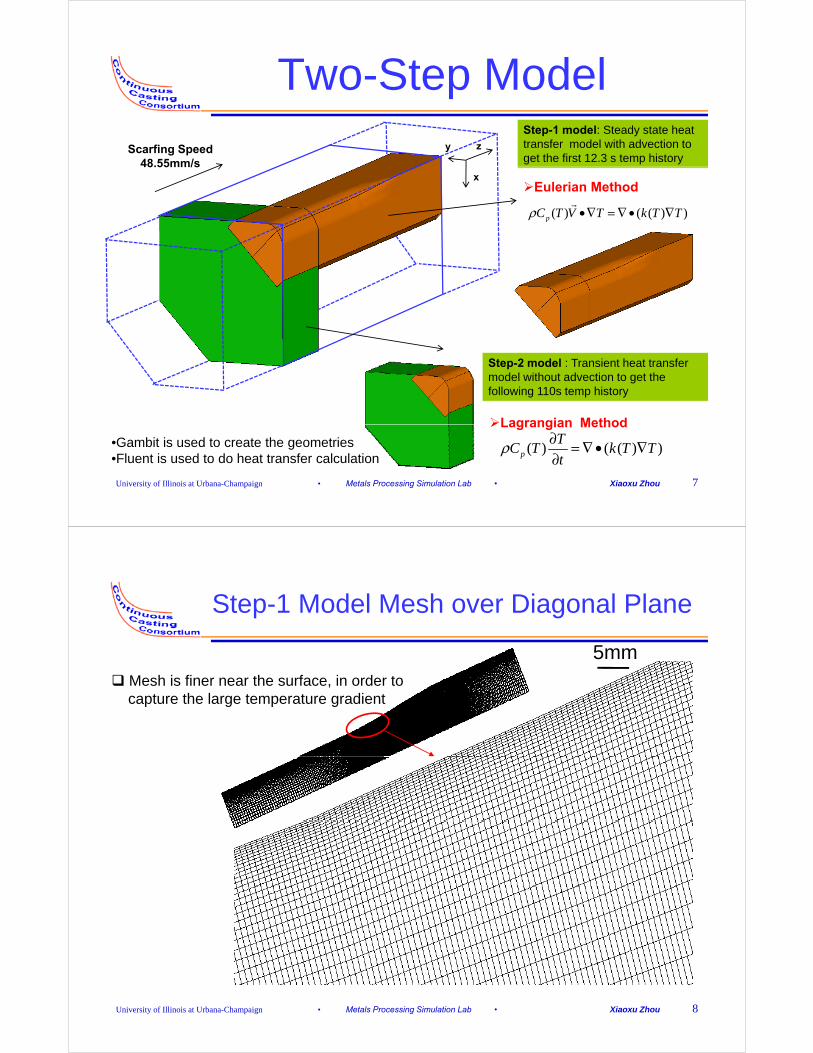
Step-1 Model Mesh over Diagonal Plane
5mm Mesh is finer near the surface, in order to
capture the large temperature gradient
University of Illinois at Urbana-Champaign • Metals Processing Simulation Lab • Xiaoxu Zhou 8
Step-1 Model
Domain and Dimensions
Unit: mm
595
250
Domain and Dimensions
16.6
100
180
70
45oC
The solution to the semi-infinite heat transfer problem will be valid if the following criterion is satisfied**** 2H
t <16
tα
<
26
304 10
7400 1000p steel
Wk mmk
kg JC sα
ρ−= = = × 595 12.3
48.55 /mm
t smm s
= = =>H > 28 mm Here:
University of Illinois at Urbana-Champaign • Metals Processing Simulation Lab • Xiaoxu Zhou 9***Refer to P94-97 in J. Danzig and C. Tucker’s book Modeling in Materials Processing
37400 1000p steelm kgK
Step-1 Model takes longer width and depth to guarantee this criterion.
Step-1 Model
Boundary Conditionsou da y Co d o sBC for the left side faceTemp=17oC
y z
78mm
Scarfing reaction region
BB
x78mm90mmSlag coating region
BC for the front face :Temp=17oC
AC1C2
Forced convection region
23mm BC for the right side faceTemp=17oC2nd curve D1
D3D2
C3Convection region
23mm
30mm
Scarfing coating regionBC for the bottom face: Temp=17oC
D3
Diagonal C4
University of Illinois at Urbana-Champaign • Metals Processing Simulation Lab • Xiaoxu Zhou 10
BC for the back face :Heat flux=0
(by scaling analysis, Peclet # >>1)
Note: geometry is NOT symmetric about the steel slab diagonal plane. Therefore, BCs are NOT symmetric either.
TCs
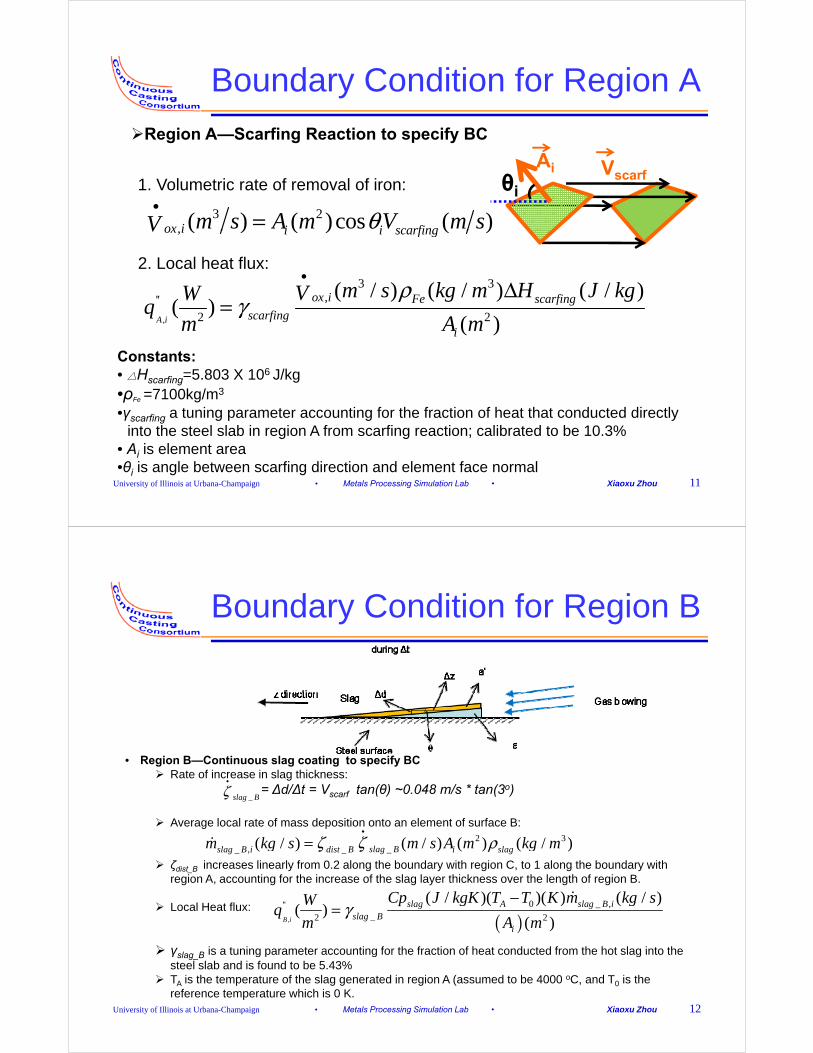
Boundary Condition for Region A
Region A—Scarfing Reaction to specify BC
Ai V
3 2( ) ( )cos ( )ox i i i scarfingm s A m V m sV θ•
=
1. Volumetric rate of removal of iron:Ai Vscarfθi
, ( ) ( ) ( )ox i i i scarfingV
3 3'' ( / ) ( / ) ( / )i F fim s kg m H J kgVW ρ
•Δ
2. Local heat flux:
,
,''2 2
( / ) ( / ) ( / )( )
( )A i
ox i Fe scarfingscarfing
i
m s kg m H J kgVWq
m A m
ργ
Δ=
Constants:Constants:• △Hscarfing=5.803 X 10⁶ J/kg•ρFe =7100kg/m3
•γscarfing a tuning parameter accounting for the fraction of heat that conducted directly
University of Illinois at Urbana-Champaign • Metals Processing Simulation Lab • Xiaoxu Zhou 11
--into the steel slab in region A from scarfing reaction; calibrated to be 10.3% • Ai is element area•θi is angle between scarfing direction and element face normal
Boundary Condition for Region B
R i B C ti l ti t if BC• Region B—Continuous slag coating to specify BC Rate of increase in slag thickness:
= ∆d/∆t = Vscarf tan(θ) ~0.048 m/s * tan(3o)
Average local rate of mass deposition onto an element of surface B:
_slag Bζ
Average local rate of mass deposition onto an element of surface B:
ζdist_B increases linearly from 0.2 along the boundary with region C, to 1 along the boundary with region A, accounting for the increase of the slag layer thickness over the length of region B.
2 3__ , _( / ) ( / ) ( ) ( / )slag Bslag B i dist B i slagm kg s m s A m kg mζ ζ ρ=
Local Heat flux:
γ is a tuning parameter accounting for the fraction of heat conducted from the hot slag into the
( ),
0 _ ,''_2 2
( / )( )( ) ( / )( )
( )B i
slag A slag B islag B
i
Cp J kgK T T K m kg sWq
m A mγ
−=
University of Illinois at Urbana-Champaign • Metals Processing Simulation Lab • Xiaoxu Zhou 12
γslag_B is a tuning parameter accounting for the fraction of heat conducted from the hot slag into the steel slab and is found to be 5.43%
TA is the temperature of the slag generated in region A (assumed to be 4000 oC, and T0 is the reference temperature which is 0 K.
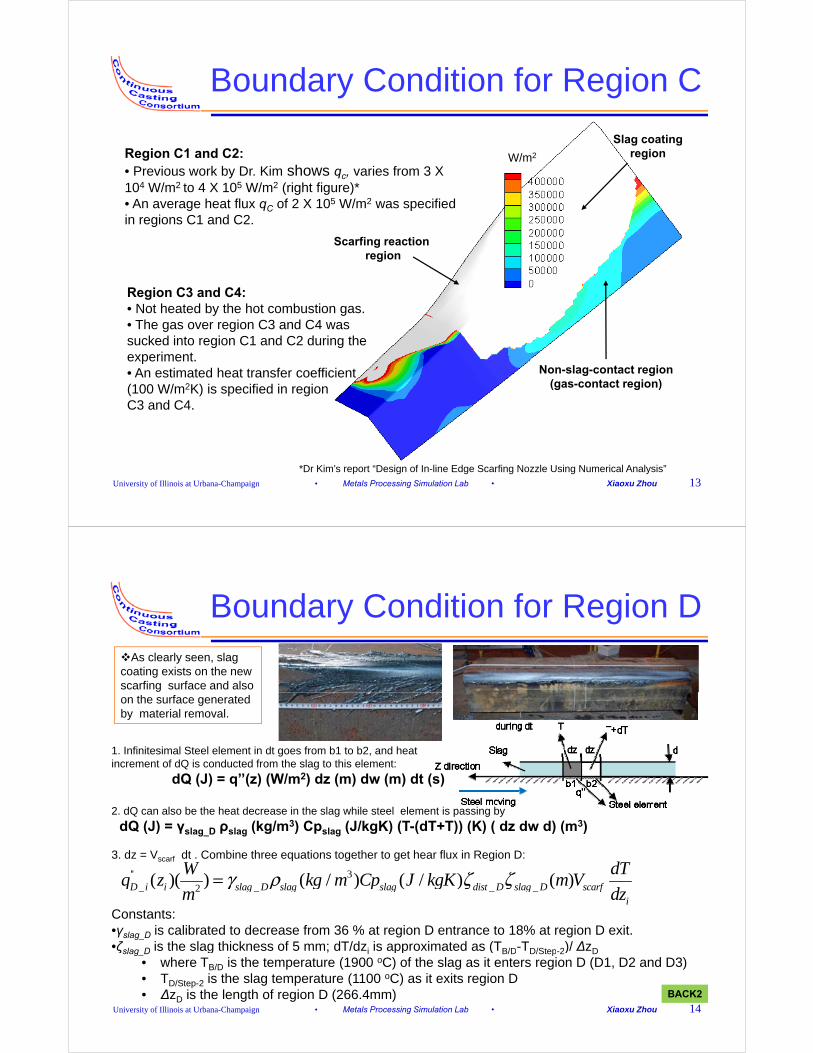
Boundary Condition for Region C
Slag coatingregionW/m2Region C1 and C2:
P i k b D Ki h i f 3 X• Previous work by Dr. Kim shows qc, varies from 3 X 10⁴ W/m2 to 4 X 10⁵ W/m2 (right figure)*• An average heat flux qC of 2 X 10⁵ W/m2 was specified in regions C1 and C2.
Scarfing reaction region
Region C3 and C4:Region C3 and C4:• Not heated by the hot combustion gas.• The gas over region C3 and C4 was sucked into region C1 and C2 during the experiment.
Non-slag-contact region(gas-contact region)
experiment.• An estimated heat transfer coefficient (100 W/m2K) is specified in region C3 and C4.
University of Illinois at Urbana-Champaign • Metals Processing Simulation Lab • Xiaoxu Zhou 13*Dr Kim’s report “Design of In-line Edge Scarfing Nozzle Using Numerical Analysis”
Boundary Condition for Region DAs clearly seen, slag coating exists on the new scarfing surface and also on the surface generatedby material removal.
1. Infinitesimal Steel element in dt goes from b1 to b2, and heatincrement of dQ is conducted from the slag to this element:
dQ (J) = q’’(z) (W/m2) dz (m) dw (m) dt (s)
2. dQ can also be the heat decrease in the slag while steel element is passing by
3. dz = Vscarf dt . Combine three equations together to get hear flux in Region D:
'' 32( )( ) ( / ) ( / ) ( )D i i slag D slag slag dist D slag D scarf
W dTq z kg m Cp J kgK m Vγ ρ ζ ζ=_ _ _ _2( )( ) ( ) ( ) ( )D i i slag D slag slag dist D slag D scarf
i
q g p gm dz
γ ρ ζ ζ
Constants:•γslag_D is calibrated to decrease from 36 % at region D entrance to 18% at region D exit.•ζslag D is the slag thickness of 5 mm; dT/dzi is approximated as (TB/D-TD/Step 2)/ ∆zD
University of Illinois at Urbana-Champaign • Metals Processing Simulation Lab • Xiaoxu Zhou 14BACK2
ζslag_D is the slag thickness of 5 mm; dT/dzi is approximated as (TB/D TD/Step-2)/ ∆zD
• where TB/D is the temperature (1900 oC) of the slag as it enters region D (D1, D2 and D3)• TD/Step-2 is the slag temperature (1100 oC) as it exits region D• ∆zD is the length of region D (266.4mm)
University of Illinois at Urbana-Champaign • Metals Processing Simulation Lab • Xiaoxu Zhou 15
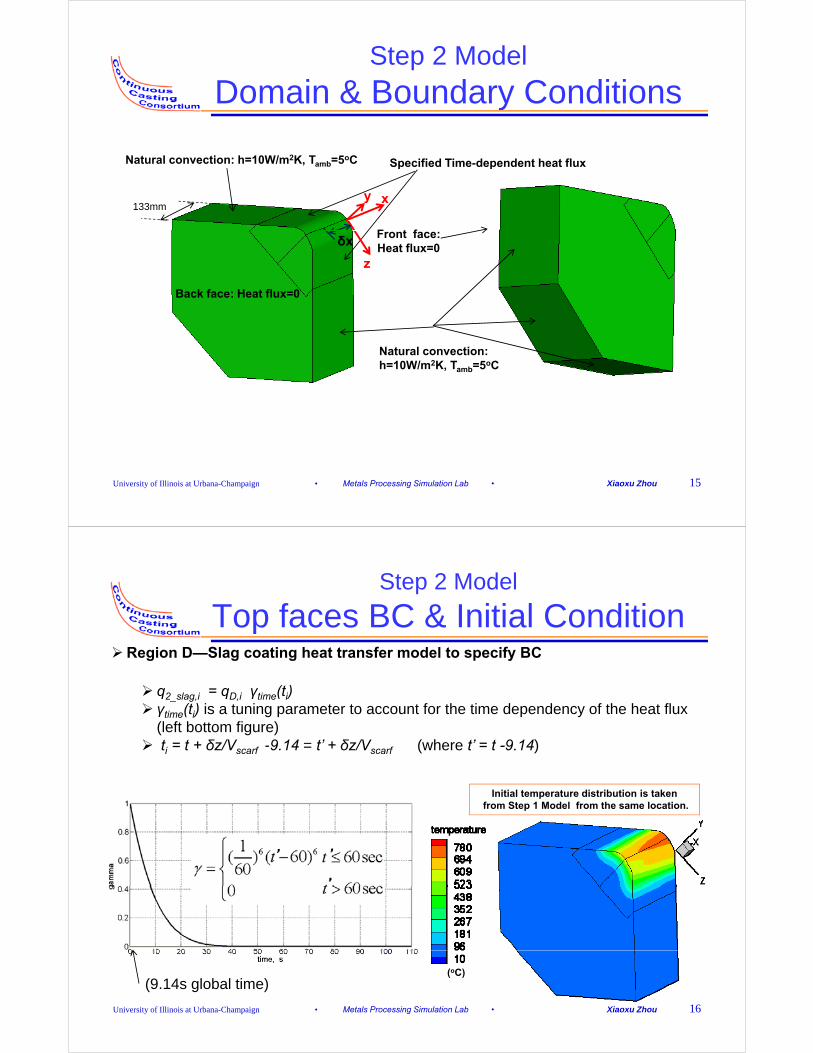
Step 2 Model
Top faces BC & Initial Conditionop aces C & a Co d oRegion D—Slag coating heat transfer model to specify BC
q = q γ (t ) q2_slag,i = qD,i γtime(ti) γtime(ti) is a tuning parameter to account for the time dependency of the heat flux
(left bottom figure) ti = t + δz/Vscarf -9.14 = t’ + δz/Vscarf (where t’ = t -9.14)
Initial temperature distribution is takenfrom Step 1 Model from the same location.
University of Illinois at Urbana-Champaign • Metals Processing Simulation Lab • Xiaoxu Zhou 16
(oC) (9.14s global time)
Time Line of Events
Time, s Events
-50.00 Start of preheating
-9.37 End of preheating
-7.74 Torch end passes the slab cornerp
-3.06 Thermocouple TC set 1 enters Step-1 model domain (front face)
-1.72 TC set 2 enters Step-1 model domain
0 00 TC t 1 B/A i t f ( t th di l li )0.00 TC set 1 passes B/A interface (at the diagonal line)
1.34 TC set 2 passes B/A interface (at the diagonal line)
3.71 TC set 1 passes region A/D interface
5.36, 6.66 Torch end passes TC sets 1, 2
9.14 Step-2 model starts (TC set1 passes back face of Step-2 model
domain and stays at back face of Step-2 model domain.)
University of Illinois at Urbana-Champaign • Metals Processing Simulation Lab • Xiaoxu Zhou 17
y p )
119.14 Simulation ends
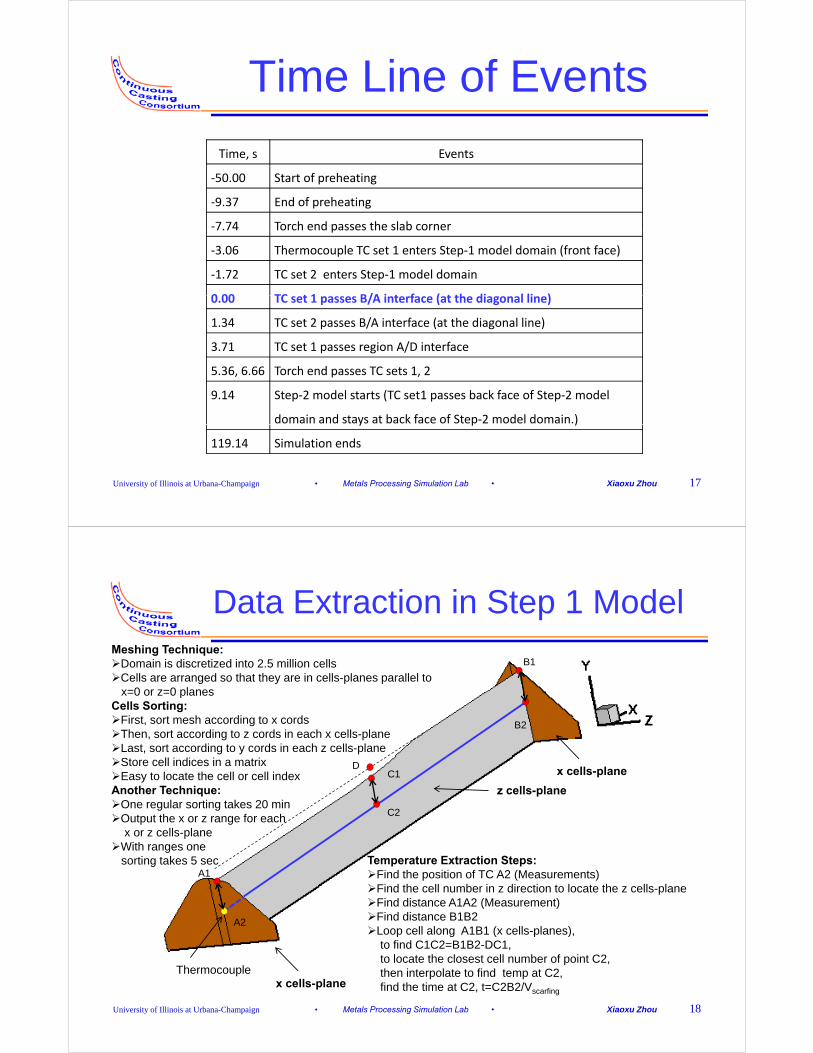
Data Extraction in Step 1 Model
B1Meshing Technique:Domain is discretized into 2.5 million cellsCells are arranged so that they are in cells-planes parallel to
x=0 or z=0 planes
B2
x=0 or z=0 planes Cells Sorting:First, sort mesh according to x cordsThen, sort according to z cords in each x cells-planeLast, sort according to y cords in each z cells-plane
C1
C2
DStore cell indices in a matrixEasy to locate the cell or cell indexAnother Technique:One regular sorting takes 20 min Output the x or z range for each
z cells-plane
x cells-plane
A1Temperature Extraction Steps:Find the position of TC A2 (Measurements)Fi d th ll b i di ti t l t th ll l
Output the x or z range for eachx or z cells-plane
With ranges onesorting takes 5 sec
A2
Find the cell number in z direction to locate the z cells-plane Find distance A1A2 (Measurement)Find distance B1B2Loop cell along A1B1 (x cells-planes),
to find C1C2=B1B2-DC1,
University of Illinois at Urbana-Champaign • Metals Processing Simulation Lab • Xiaoxu Zhou 18
to locate the closest cell number of point C2, then interpolate to find temp at C2,find the time at C2, t=C2B2/Vscarfing
Thermocouplex cells-plane
Step 1 Model Results
Temperature DistributionTemperature Distribution
(oC)
(oC)
University of Illinois at Urbana-Champaign • Metals Processing Simulation Lab • Xiaoxu Zhou 19
(oC) • Hot temperature is found at scarfing reaction region A.• Most heat is transported from upstream to downstream by simple advection of the moving slab.
Step 1 Model and Step 2 Model Results
Temperature Distributions
Tmax = 1489.6oCThe distance between Tmax
d T 1100oC i 0 5
p
and T=1100oC is ~0.5 mm.
(oC) (oC)
(oC)
University of Illinois at Urbana-Champaign • Metals Processing Simulation Lab • Xiaoxu Zhou 20
(oC) t=119.14s
TC Set1 (Shallow, 5mm in depth)
Prediction vs Measuremented c o s easu e e
Step 1 model Step 1 modelStep 1 modelStep 2 model Step 1 model
Step 2 model
Measurement
University of Illinois at Urbana-Champaign • Metals Processing Simulation Lab • Xiaoxu Zhou 21
MeasurementPredictionPrediction
TC Set1 (Shallow, 5mm in depth)
Prediction vs Measuremented c o s easu e eStep 1 model
Step 2 modelStep 1 model
Step 2 model
Step 1 model Step 2 model
TC measurement missing
Measurement
University of Illinois at Urbana-Champaign • Metals Processing Simulation Lab • Xiaoxu Zhou 22
MeasurementPredictionPrediction
TC Set2 (Deep, 10mm in depth)
Prediction vs Measuremented c o s easu e e
Step 1 model St 1 d lStep 1 modelStep 2 model Step 1 model
Step 2 model
Measurement
University of Illinois at Urbana-Champaign • Metals Processing Simulation Lab • Xiaoxu Zhou 23
MeasurementPredictionPrediction
TC Set2 (Deep, 10mm in depth)
Prediction vs Measuremented c o s easu e eStep 1 model Step 2 model Step 1 model Step 2 model
Step 1 model Step 2 model
TC measurement missing
Measurement
University of Illinois at Urbana-Champaign • Metals Processing Simulation Lab • Xiaoxu Zhou 24
MeasurementPredictionPrediction
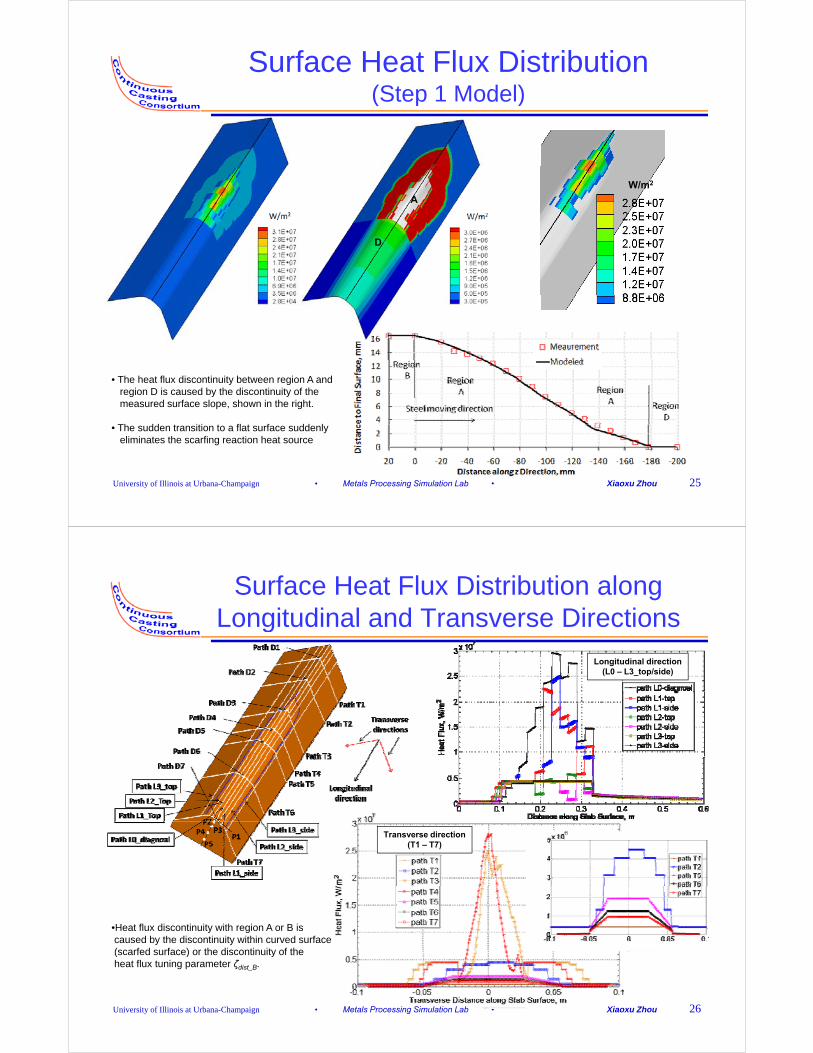
Surface Heat Flux Distribution (Step 1 Model)(Step ode )
A
W/m2
D
• The heat flux discontinuity between region A and region D is caused by the discontinuity of the measured surface slope, shown in the right.
Th dd t iti t fl t f dd l
University of Illinois at Urbana-Champaign • Metals Processing Simulation Lab • Xiaoxu Zhou 25
• The sudden transition to a flat surface suddenly eliminates the scarfing reaction heat source
Surface Heat Flux Distribution along Longitudinal and Transverse Directions g
Longitudinal direction(L0 – L3_top/side)
Transverse direction(T1 – T7)
•Heat flux discontinuity with region A or B is caused by the discontinuity within curved surface (scarfed surface) or the discontinuity of the
University of Illinois at Urbana-Champaign • Metals Processing Simulation Lab • Xiaoxu Zhou 26
(scarfed surface) or the discontinuity of the heat flux tuning parameter ζdist_B.
Surface Temperature Distribution along Longitudinal and Transverse Directionsg
Longitudinal direction(L0 – L3_top/side)
Note:Note: These paths follow the slab surface, so are not straight lines
Transverse direction(T1 – T7)• Temperature of the slab surface goes up gradually from 17 oC
to ~80 oC by combustion gas heating, then it goes up quickly inregion B.
• After region B, steel enters region A for path 0, 1 and 2 or into g , g p ,region D for the off-diagonal path 3.
• Temperature wiggles along paths in region A are caused by the discontinuity of the surface heat flux.
• Finally, all temperatures decrease slowly in region D.
University of Illinois at Urbana-Champaign • Metals Processing Simulation Lab • Xiaoxu Zhou 27
• The temperature profiles are not symmetric about the diagonal, which is due to the asymmetric shape that controls the heat generated by the scarfing reaction
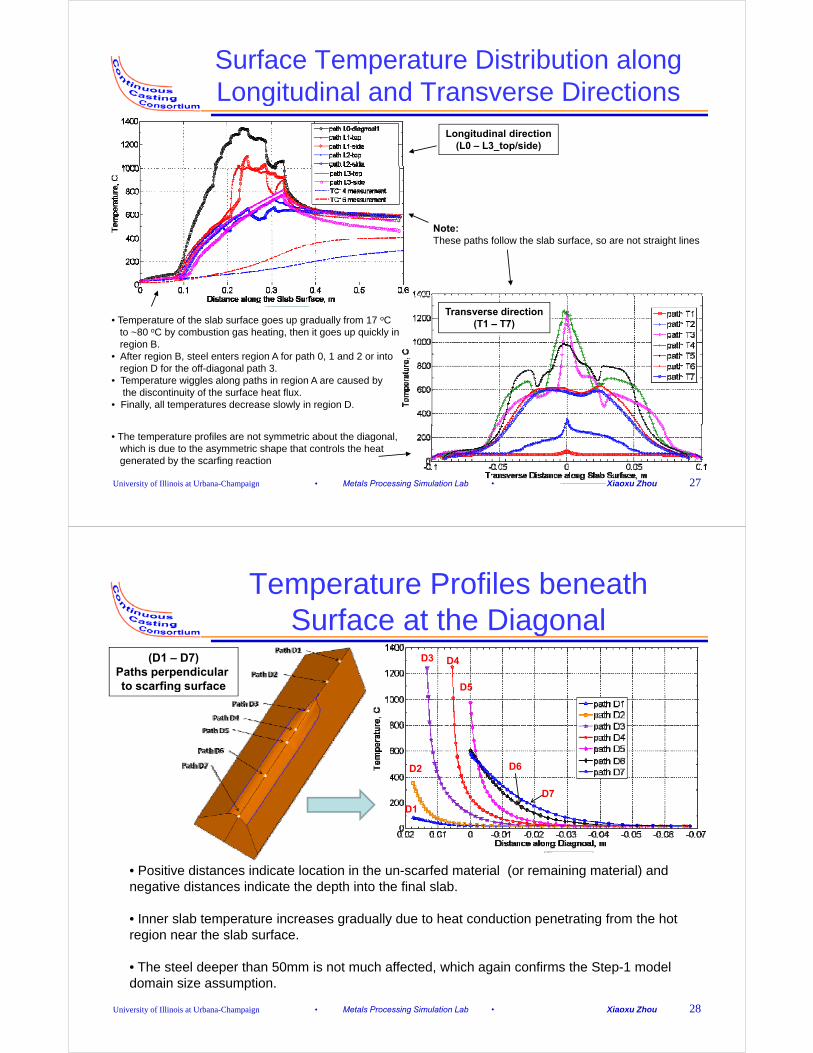
Temperature Profiles beneath Surface at the DiagonalSurface at the Diagonal
(D1 – D7)Paths perpendicular to scarfing surface
D3 D4
D5g
D1
D2 D6
D7
• Positive distances indicate location in the un-scarfed material (or remaining material) and negative distances indicate the depth into the final slabnegative distances indicate the depth into the final slab.
• Inner slab temperature increases gradually due to heat conduction penetrating from the hot region near the slab surface.
University of Illinois at Urbana-Champaign • Metals Processing Simulation Lab • Xiaoxu Zhou 28
• The steel deeper than 50mm is not much affected, which again confirms the Step-1 model domain size assumption.
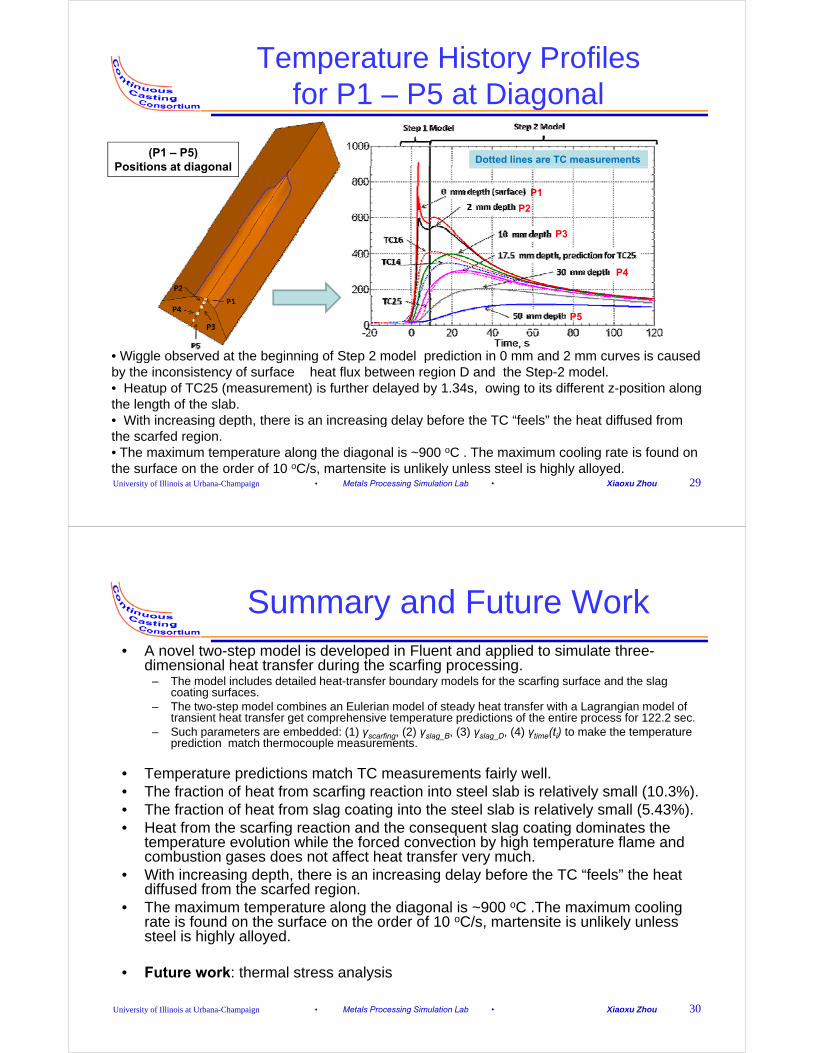
Temperature History Profiles for P1 – P5 at Diagonalfor P1 P5 at Diagonal
(P1 – P5)Positions at diagonal
Dotted lines are TC measurementsPositions at diagonal
P1
P2
P3P3
P4
• Wiggle observed at the beginning of Step 2 model prediction in 0 mm and 2 mm curves is caused
P5
Wiggle observed at the beginning of Step 2 model prediction in 0 mm and 2 mm curves is caused by the inconsistency of surface heat flux between region D and the Step-2 model. • Heatup of TC25 (measurement) is further delayed by 1.34s, owing to its different z-position along the length of the slab.• With increasing depth, there is an increasing delay before the TC “feels” the heat diffused from
University of Illinois at Urbana-Champaign • Metals Processing Simulation Lab • Xiaoxu Zhou 29
With increasing depth, there is an increasing delay before the TC feels the heat diffused from the scarfed region.• The maximum temperature along the diagonal is ~900 oC . The maximum cooling rate is found on the surface on the order of 10 oC/s, martensite is unlikely unless steel is highly alloyed.
Summary and Future Work• A novel two-step model is developed in Fluent and applied to simulate three-
dimensional heat transfer during the scarfing processing.– The model includes detailed heat-transfer boundary models for the scarfing surface and the slag
coating surfacescoating surfaces. – The two-step model combines an Eulerian model of steady heat transfer with a Lagrangian model of
transient heat transfer get comprehensive temperature predictions of the entire process for 122.2 sec. – Such parameters are embedded: (1) γscarfing, (2) γslag_B, (3) γslag_D, (4) γtime(ti) to make the temperature
prediction match thermocouple measurements.
• Temperature predictions match TC measurements fairly well.• The fraction of heat from scarfing reaction into steel slab is relatively small (10.3%).• The fraction of heat from slag coating into the steel slab is relatively small (5.43%).• Heat from the scarfing reaction and the consequent slag coating dominates the
temperature evolution while the forced convection by high temperature flame and combustion gases does not affect heat transfer very much.
• With increasing depth, there is an increasing delay before the TC “feels” the heat diff d f th f d idiffused from the scarfed region.
• The maximum temperature along the diagonal is ~900 oC .The maximum cooling rate is found on the surface on the order of 10 oC/s, martensite is unlikely unless steel is highly alloyed.
University of Illinois at Urbana-Champaign • Metals Processing Simulation Lab • Xiaoxu Zhou 30