General rights Copyright and moral rights for the publications made accessible in the public portal are retained by the authors and/or other copyright owners and it is a condition of accessing publications that users recognise and abide by the legal requirements associated with these rights. • Users may download and print one copy of any publication from the public portal for the purpose of private study or research. • You may not further distribute the material or use it for any profit-making activity or commercial gain • You may freely distribute the URL identifying the publication in the public portal If you believe that this document breaches copyright please contact us providing details, and we will remove access to the work immediately and investigate your claim. Downloaded from orbit.dtu.dk on: Jul 22, 2018 Modeling succession of key resource-harvesting traits of mixotrophic plankton Berge, Terje; Chakraborty, Subhendu; Hansen, Per Juel; Andersen, Ken Haste Published in: The I S M E Journal Link to article, DOI: 10.1038/ismej.2016.92 Publication date: 2017 Document Version Publisher's PDF, also known as Version of record Link back to DTU Orbit Citation (APA): Berge, T., Chakraborty, S., Hansen, P. J., & Andersen, K. H. (2017). Modeling succession of key resource- harvesting traits of mixotrophic plankton. The I S M E Journal, 11, 212–223. DOI: 10.1038/ismej.2016.92
Transcript
General rights Copyright and moral rights for the publications made accessible in the public portal are retained by the authors and/or other copyright owners and it is a condition of accessing publications that users recognise and abide by the legal requirements associated with these rights.
• Users may download and print one copy of any publication from the public portal for the purpose of private study or research. • You may not further distribute the material or use it for any profit-making activity or commercial gain • You may freely distribute the URL identifying the publication in the public portal
If you believe that this document breaches copyright please contact us providing details, and we will remove access to the work immediately and investigate your claim.
Downloaded from orbit.dtu.dk on: Jul 22, 2018
Modeling succession of key resource-harvesting traits of mixotrophic plankton
Berge, Terje; Chakraborty, Subhendu; Hansen, Per Juel; Andersen, Ken Haste
Published in:The I S M E Journal
Link to article, DOI:10.1038/ismej.2016.92
Publication date:2017
Document VersionPublisher's PDF, also known as Version of record
Link back to DTU Orbit
Citation (APA):Berge, T., Chakraborty, S., Hansen, P. J., & Andersen, K. H. (2017). Modeling succession of key resource-harvesting traits of mixotrophic plankton. The I S M E Journal, 11, 212–223. DOI: 10.1038/ismej.2016.92
Modeling succession of key resource-harvestingtraits of mixotrophic plankton
Terje Berge1, Subhendu Chakraborty2, Per Juel Hansen1 and Ken H Andersen2
1Department of Biology, VKR Centre for Ocean Life, Marine Biological Section, University of Copenhagen,Helsingør, Denmark and 2National Institute of Aquatic Resources, VKR Centre for Ocean Life, TechnicalUniversity of Denmark, Charlottenlund, Denmark
Unicellular eukaryotes make up the base of the ocean food web and exist as a continuum in trophicstrategy from pure heterotrophy (phagotrophic zooplankton) to pure photoautotrophy (‘phytoplank-ton’), with a dominance of mixotrophic organisms combining both strategies. Here we formulate atrait-based model for mixotrophy with three key resource-harvesting traits: photosynthesis,phagotrophy and inorganic nutrient uptake, which predicts the trophic strategy of species throughoutthe seasonal cycle. Assuming that simple carbohydrates from photosynthesis fuel respiration, andfeeding primarily provides building blocks for growth, the model reproduces the observed light-dependent ingestion rates and species-specific growth rates with and without prey from thelaboratory. The combination of traits yielding the highest growth rate suggests high investments inphotosynthesis, and inorganic nutrient uptake in the spring and increased phagotrophy during thesummer, reflecting general seasonal succession patterns of temperate waters. Our trait-based modelpresents a simple and general approach for the inclusion of mixotrophy, succession and evolution inecosystem models.The ISME Journal advance online publication, 2 August 2016; doi:10.1038/ismej.2016.92
Introduction
Photoautotrophic plankton combines photosynth-esis with uptake of dissolved nutrients to convertCO2 and minerals into the biomass that fuelshigher trophic levels in ocean food webs. Thetraditional view of planktonic ecosystems distin-guishes between photoautotrophic ‘plants’ andheterotrophic ‘animals’ that acquire all essentialresources through feeding on other organisms.However, in the microbial plankton, a mixotrophicstrategy where photoautotrophy and ingestion ofprey are combined in the same organism is wide-spread and often dominates large ecosystems(Burkholder et al., 2008; Hartmann et al., 2012;Flynn et al., 2013; Hansen et al., 2013).
Photoautotrophic plankton evolved from astrictly heterotrophic ancestor that acquiredphotosynthesis through endosymbiosis (Cavalier-Smith, 1982). Although the ecologically importantdiatoms lost their ancestral phagotrophy trait,most motile photoautotrophic plankton (or ‘phy-toplankton’) feed to different degrees (Flynn et al.,2013). Driven by recent observations of the
importance of mixotrophy in diverse aquaticecosystems, a new plankton paradigm is emerging,where the base of aquatic food webs consists oforganisms occupying the full spectrum fromphotoautotrophs to heterotrophs (Jones, 1994;Flynn et al., 2013; Mitra et al., 2014).
Despite several observations of mixotrophy sincethe 1980s, it has only recently been represented inplankton modeling studies (Thingstad et al., 1996;Stickney et al., 2000; Bruggeman, 2009; Flynn andMitra, 2009; Ward et al., 2011; Våge et al., 2013;Mitra et al., 2014). This is partly due to the relianceon functional-group type of modeling paradigms,where organisms are pre-described as ‘phytoplank-ton’ and ‘zooplankton’. Representing mixotrophy insuch models leads to increased complexity andcomputational costs. However, by disposing offunctional groups and species altogether, and focus-ing on the distribution of continuous trait values,trait-based approaches have the potential to repre-sent the full spectrum of trophic strategies and partlyovercome this complexity problem (Norberg et al.,2001; Bruggeman, 2009; Andersen et al., 2015).
Our aim is to understand which environmentalconditions favor specific key resource-harvestingtraits or trophic strategy of mixotrophic plankton.To this end, we model a general organism where thetrophic strategy is not prescribed a priori, but is anemergent property. The emergent trophic strategy isdefined by the relative investment in three traits:
Correspondence: T Berge, Department of Biology, VKR Centre forOcean Life, Marine Biological Section, University of Copenhagen,Strandpromenaden 5, Helsingør 3000, Denmark.E-mail: [email protected] 20 October 2015; revised 29 April 2016; accepted31 May 2016
A large proportion of mixotrophs, especiallythe constitutive mixotrophs that synthesize their ownchloroplasts (Mitra et al., 2016), show an obligateenergy dependence on sunlight for both phagotrophyand growth (Hansen, 2011). We assume that smallcarbohydrates from photosynthesis represent the onlysource of carbon for respiration in these mixotrophs.Phagotrophy primarily provides nutrients and carbonfor synthesis, whereas photosynthesis provides carbonfor both synthesis and respiration. We consider flowsof both carbon and nitrogen, and three resource-harvesting traits; inorganic nutrient uptake, phagotro-phy and photosynthesis. In this way we go beyondearlier trait-based approaches that only consideredeither one essential nutrient or carbon (Thingstad et al.,1996; Bruggeman, 2009; Våge et al., 2013), and thushad no ability to reproduce synergistic effects ofmixotrophs, gained through labor sharing on alter-native nutrient and carbon sources (Mitra et al., 2014).
The development and parameterization of ourmodel was guided by laboratory observations on twomixotrophic dinoflagellates of the genus Karlodinium:K. armiger and K. veneficum. The species were chosenbased on the large amount of available laboratory dataand knowledge on trait variation in this importantgroup of mixotrophs (Berge et al., 2008a, b; Li et al.,1999, 2000; Adolf et al., 2006; Calbet et al., 2011; Bergeand Hansen, 2016). The two species have approxi-mately the same investments in photosynthesis (Adolfet al., 2006; Berge and Hansen, 2016). K. armiger seemsto invest very little in the uptake of inorganic nutrients,but relies heavily on phagotrophy (Berge et al., 2008b,2012). K. veneficum has a lower affinity and maximumuptake rate for food, but higher capacity to take upinorganic nutrients and can achieve fairly high growthrates without food in standard nitrate-enriched labora-tory media (Li et al., 1999; Adolf et al., 2006). In themodel, we represent these species-specific differencesin trophic strategy as differences in trait valuesrepresenting relative investment in photosynthesis,phagotrophy and inorganic nutrient uptake.
Even though we use two species of Karlodinium as acase study, our approach represents a general systemas the fundamental parameters quantifying the trade-offs are species-independent constants. We apply themodel to examine which trait combination results inthe highest population growth rates in a givenenvironment and during a seasonal succession. Theresults support a hypothesis that the trophic strategy ofmixotrophic populations change from higher invest-ment in photosynthesis and inorganic nutrient uptakein the spring (photoautotrophy) to higher investmentsin phagotrophy during the summer conditions.
Model description
The model represents a mixotrophic cell that canacquire (1) inorganic carbon from photosynthesis,
(2) inorganic nutrients by the activity of membrane-bound uptake sites, and (3) organic carbon andnutrients by phagocytosis. The cells’ ability to takeup these resources, that is, the affinities andmaximum uptake rates, are determined by invest-ments (f) in organelles and enzymes associated witheach function, and described by the three keyresource-harvesting traits: photosynthesis fL, (forexample, pigments and enzymes for carbon fixation),phagocytosis fF (for example, the microtubule-supported peduncle, membrane material for foodvacuole formation and digestive enzymes) andenzymes for the uptake of inorganic nutrients fN
(for example, enzymes for reduction of nitrate toammonium and transporter enzymes). The modelstructure follows Bruggeman and Kooijman (2007)and Bruggeman (2009). There are some differences tothe model by Bruggeman (2009): here, we generalize tothree resource-harvesting traits, compared with onlytwo traits of Bruggemann (2009) (photosynthesis andphagotrophy). Further, he did not distinguish betweencarbon and essential nutrient flow explicitly, andconsequently nutrients (for example, nitrogen orphosphorous) were respired (lost) in his model. Weavoid this by keeping explicit track of both carbon andone essential nutrient. We consider nitrogen as theessential element in addition to carbon, and assumeonly one source of dissolved inorganic nitrogen.
Fluxes of carbon and nitrogen are described bysymbol Ji (mass flows i being food (F), carbon fromphotosynthesis (L) or nutrients (N) (see Table 1 forcentral symbols and parameters), which are com-bined to synthesize the new biomass; Figure 1).Respiratory costs of fluxes, βiJi include costs of bothuptake and mobilization for synthesis through eachpathway. Biomass synthesis rate Jtot is constrained bythe stoichiometric balance between carbon andnitrogen. We assume a constant C:N ratio of boththe mixotroph and the food. Moreover, we assumethat traits and structure have similar stoichiometryand basal maintenance costs. Finally, we assume thatcarbon for respiration is acquired from photosynth-esis only. The final assumption is needed torepresent the observed light-dependent feedingcommon among constitutive mixotrophs.
Investment in resource-harvesting traitsThe biomass of the cell is divided into four pools:cell structure V (units of gC), photosyntheticmachinery fLV, machinery for inorganic nutrientuptake fNV and machinery for phagotrophy fFV.The three traits that we consider here, fL, fN and fF,are all dimensionless quantities, representing theinvestment into organelles as a fraction of thestructural mass of the cell. The total mass of the cellis therefore (1+fL+fN+fF)V. Each investment pro-vides a benefit in terms of a higher affinity towardthe resource (light/carbon, inorganic nutrients orfood) and higher maximum uptake rate. The affinityis an increasing but saturating function of the
Modeling succession of plankton populationsT Berge et al
2
The ISME Journal
investment:
Ai ¼ Amax:iaifiV
aifiV þAmax:ið1Þ
Amax.i is the maximum affinity and αi is the amountof affinity gained per investment fi. The saturation ofthe affinity as a function of the investment representsthe packaging effect for investment in light harvest-ing (Morel and Bricaud, 1981) and diffusion limita-tion for inorganic nutrient uptake. Besides leading toa higher affinity Ai, investments also result in ahigher maximum uptake rate Jmax.i:
Jmax:i ¼ fiVMi ð2Þwhere Mi is the maximum uptake rate per invest-ment. Maximum uptake rates are not, as theaffinities, limited by physical constraints leading todiminishing returns as in Equation (1). Rather,maximum uptake rates are limited by processingmachinery (for example, chloroplasts, digestive and
transporter enzymes), whose capacity we assumescales linearly with investments fi (Figure 2).
CostsThe investments in the traits have respiratory costs JRin terms of maintenance of the organelles propor-tional to the investments fi (gC per day):
JR ¼ r0V 1þ fL þ fN þ fFð Þ ð3Þand of course the resource costs of synthesisfiV (gC).
Resource uptakes and growth ratesThe potential uptake J~i of resource Xi is governed bya standard saturating functional response:
J~i ¼ Jmax:iAiXi
AiXi þ Jmax:ið4Þ
All fluxes have a respiratory cost βi proportional tothe actual flux Ji. These costs include respiratory
Table 1 Central symbols and general parameters
Symbol Description Value and unit
Central symbolsXL Light flux in the environment μmol photons m− 2 s−1
XN Concentration of inorganic nutrients in the environment μg N L− 1
XF Concentration of food in the environment μg C L−1
AL Affinity for light μg C (μmol photons m− 2 s−1)− 1
AN Affinity for inorganic nutrients L d− 1
AF Affinity for food L d− 1
Ji Flux of assimilated substance or respiration μg C L−1 or μg N L− 1
Biomass and traitsfi Traits Variable (μgC μgC−1)V Structural mass 6.50×10− 5 μg C
Functional responsesAmax.L Maximum affinity for light 4.07×10− 6 μg C (μmol photons m−2 s− 1)−1
Amax.N Maximum affinity for inorg. nutr. 1 × 10⁻⁶ L d− 1
Amax.F Maximum affinity for food 4.65×10− 7 L d−1
αL Affinity per investment in photosynthesis 0:63 mmolphotonsm�2s�1ð Þ�1
αN Affinity per investment in inorg. nutr. upt 0.30 L d− 1 (μg C)− 1
αF Affinity per investment in phagotrophy 0.16 L d− 1 (μg C)− 1
ML Maximum uptake rate per investment in photosynthesis 5.01 L d− 1
MN Maximum uptake rate per investment in inorganic nutrient uptake 1.00 (μg N μg C− 1) d− 1
MF Maximum uptake rate per investment in phagotrophy 14.10 d− 1
CostsβL Cost of photosynthesis 0.35 μg C μg C−1
βN Cost of inorg. nutr. upt. and synthesis 3.00 μg C μg N− 1
βF Cost of food uptake and synthesis 0.50 μg C μg C−1
r0 Basal respiration rate 0.05 d−1
Synthesis and growthm Mortality 0.12 d−1
cCN C/N ratio in food and in the cell 5.68 μg C μg N− 1
Trait valuesfL Investment into light harvesting 0.45 K. armiger
0.45 K. veneficumfF Investment into phagotrophy 0.16 K. armiger
0.08 K. veneficumfN Investment into inorganic nutrient uptake 0.00 K. armiger
0.10 K. veneficum
Index i refers to light (L) measured in units of μmol photons m− 2 s− 1, inorganic nutrients (inorg. nutr.) (N) in units of μg N L− 1and food (F) in unitsof μg C L− 1. Upt. refers to uptake. All parameters are derived in the section ‘Parameters and trait values’ and in the Appendix.
Modeling succession of plankton populationsT Berge et al
3
The ISME Journal
costs of uptake and mobilization for synthesisthrough the specific trait or pathway. Therefore, thepotential uptake can only be realized if there issufficient carbon available from photosynthesis tofuel the respiratory costs of inorganic nutrient andfood uptakes. In periods of light limitation, carbontaken up by photosynthesis may be insufficient tosupport the energy needed to drive the potentialuptake of inorganic nutrients or food. Those uptakesare therefore reduced by a light-energy-dependentfactor ρ taking values between 0 and 1:
r ¼ min 1;J L � bLJ L � JR
ðcCN þ bN ÞJ~N þ bF J~F
" #ð5Þ
This relation assumes that maintenance metabo-lism is supported before remaining fixed carbon is
respired to fuel inorganic nutrient and food uptake.The actual uptakes of nutrients JN and food JF are:
JN ¼ rJ~N and J F ¼ rJ~F ð6ÞFor photosynthesis, the actual uptake is the same
as the potential uptake J L ¼ J~L.Carbon and nitrogen are combined to synthesize
new structure and investments in traits. Thiscombination should respect homeostasis (that is,constant C/N ratio). The combination of carbon andnitrogen is performed following Liebig’s law of theminima:
J tot ¼ min J F þ J L � bLJ L � bNJN � bF JF � JR; cCNJN þ J F½ �ð7Þ
Note that this implies that either some excesscarbon or nutrients are excreted and lost from the
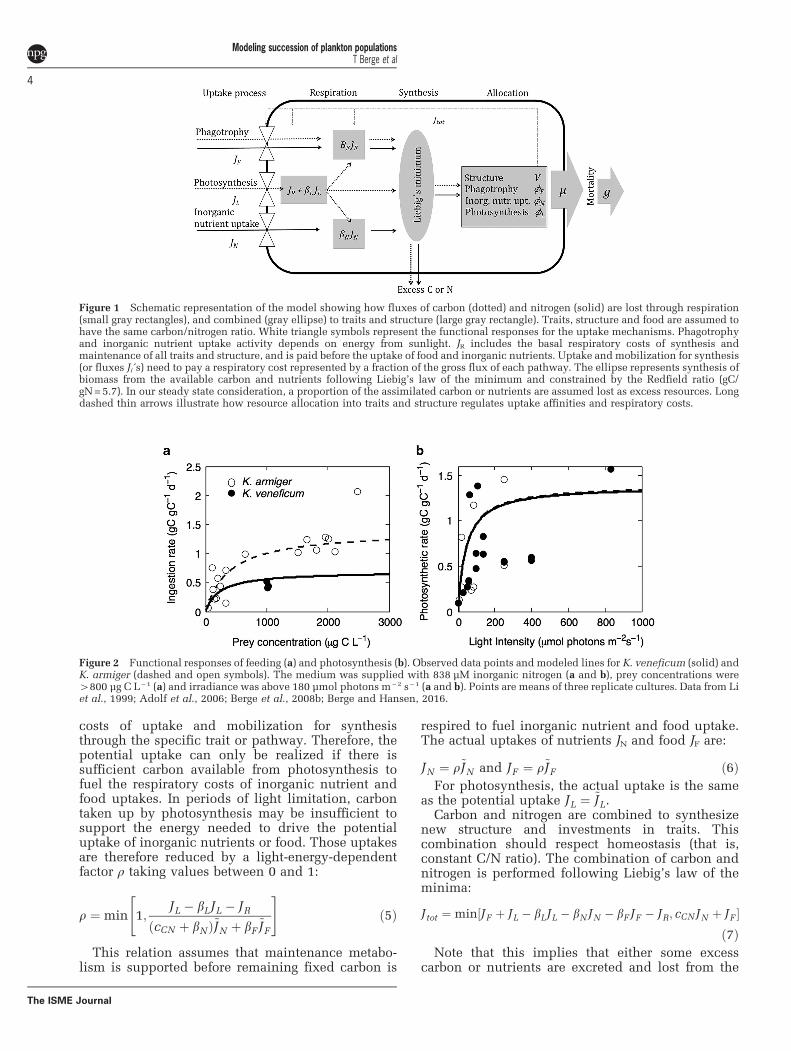
Figure 1 Schematic representation of the model showing how fluxes of carbon (dotted) and nitrogen (solid) are lost through respiration(small gray rectangles), and combined (gray ellipse) to traits and structure (large gray rectangle). Traits, structure and food are assumed tohave the same carbon/nitrogen ratio. White triangle symbols represent the functional responses for the uptake mechanisms. Phagotrophyand inorganic nutrient uptake activity depends on energy from sunlight. JR includes the basal respiratory costs of synthesis andmaintenance of all traits and structure, and is paid before the uptake of food and inorganic nutrients. Uptake and mobilization for synthesis(or fluxes Ji´s) need to pay a respiratory cost represented by a fraction of the gross flux of each pathway. The ellipse represents synthesis ofbiomass from the available carbon and nutrients following Liebig’s law of the minimum and constrained by the Redfield ratio (gC/gN=5.7). In our steady state consideration, a proportion of the assimilated carbon or nutrients are assumed lost as excess resources. Longdashed thin arrows illustrate how resource allocation into traits and structure regulates uptake affinities and respiratory costs.
Figure 2 Functional responses of feeding (a) and photosynthesis (b). Observed data points and modeled lines for K. veneficum (solid) andK. armiger (dashed and open symbols). The medium was supplied with 838 μM inorganic nitrogen (a and b), prey concentrations were4800 μg C L−1 (a) and irradiance was above 180 μmol photons m− 2 s−1 (a and b). Points are means of three replicate cultures. Data from Liet al., 1999; Adolf et al., 2006; Berge et al., 2008b; Berge and Hansen, 2016.
Modeling succession of plankton populationsT Berge et al
4
The ISME Journal
cell. The specific rate of synthesis μ then becomes
m ¼ J totV 1þ fL þ fN þ fFð Þ ð8Þ
and the final growth rate g of the cells (d− 1):
g ¼ m�m ð9Þwhere m is the natural mortality rate.
Parameters and trait valuesParameters for food uptake and photosynthesis werebased on laboratory measurements on K. veneficumand K. armiger (Figure 2). Data for potential ingestionrate as a function of prey concentration were takenfrom experiments that used the same method fordetermining steady state ingestion rates in high lightintensities (Li et al., 1999; Adolf et al., 2006; Bergeet al., 2008b; Berge and Hansen, 2016). This methodis based on the disappearance of prey determinedfrom cell counts in mixed cultures, and may over-estimate the ingestion rate due to incomplete or‘sloppy’ feeding. This is especially the case forspecies like Karlodinium that use feeding tubes topierce the prey before sucking in the cytoplasm(Berge et al., 2008a), and prey membrane materialcontaining various cell-fractions are sometimes leftbehind. We accounted for this by convertingreported ingestion rates with a feeding efficiencyfactor of 0.7 for both species. Data for photosyntheticrates were derived from measurements using 14Clight and dark incubations (Li et al., 1999; Adolfet al., 2006; Berge and Hansen, 2016). To bettercompare the laboratory data between the twospecies, which were obtained under different tem-peratures (15–20 °C), the data for K. veneficum (Liet al., 1999; Adolf et al., 2006) were normalized to15 °C using a Q10 of 2.5.
We determine the central parameters (Table 1) ofthe trade-offs related to the benefits (the affinity,Equation (1), the maximum uptake rate, Equation (2),and the respiratory costs, Equation (3)) using themeasurements of functional responses and growthrates as a function of light and food for the twoKarlodinium species (Li et al., 1999; Adolf et al.,2006; Berge et al, 2008b; Berge and Hansen, 2016).We assume that the differences between the twospecies are represented only by differences in thethree species-specific trait values fL, fF and fN
(Table 1). Guided by the arguments of Raven (1984,1997), we assume that the costs of synthesizing thephotosynthetic machinery may account for up to50%, whereas the phagotrophic machineryaccounts for o10% of the cell’s total energy,carbon and nutrients. Moreover, we assumed thatthe total investments in the three resource-harvesting traits cannot exceed the investment instructure. To find the maximum affinities gained perinvestment (Amax.i), we assume that affinity saturates atan investment of 0.9V for photosynthesis ( =0.9corresponding to 45% of total cell carbon and nutrient
resources), around 0.4V for phagotrophy and 0.2V forinorganic nutrient uptake. This information, togetherwith the observed half-saturation coefficients forphotosynthesis and food uptake make it possible toestimate the maximum affinities (Amax.L, Amax.N andAmax.F) and the affinity gained per investment forphotosynthesis and food uptake (αL, αN and αF)(Appendix A); (Figure 2).
We assume that the structural size is thesame between the two species, although laboratoryreports suggest that K. armiger is slightly larger.Investment in the photosynthetic machinery,fL, was assumed equal for the two species at 0.45(Figure 2b). Investments in phagotrophy fF wereassumed approximately two times higher inK. armiger than in K. veneficum (Figure 2a), andwere set to 0.16 and 0.08, respectively (Li et al.,1999; Adolf et al., 2006; Berge et al., 2008b; Bergeand Hansen, 2016). K. armiger (fN = 0) has avery low investment in inorganic nutrient uptake,compared with K. veneficum (fN = 0.1), as itcannot grow in nitrate-enriched laboratory media(that is, L and F/2) without food (Berge et al.,2008a, b; Berge and Hansen, 2016).
On the basis of growth efficiencies of strictlyphotoautotrophic and phagotrophic specialists(Straile, 1997; Falkowski and Raven, 2013), weassume the metabolic cost parameters of uptakeand mobilization for synthesis through the photo-synthetic pathway to be lower (βL = 0.35) thanthrough the phagotrophic pathway (βF = 0.5). Therespiratory cost of inorganic nutrient uptake andmobilization for growth (βN) was assumed to be 3 gCgN− 1, which is similar to that of nitrate acquisition(see for example, Flynn and Mitra, 2009). The basalrespiration rates of maintenance were assumed to besimilar and r0 = 0.05 d− 1 (see for example, Flynn andMitra, 2009) for both structure and the threeinvestments.
The model is used first to describe uptake andgrowth rates of the two Karlodinium species. In thispart, the set of traits take fixed values for eachspecies. Next, we analyze which combinations oftrait values {fL,fF,fN} are optimal, that is, thatmaximize population growth rate under variousenvironmental conditions. For the maximization,we enforce that the total investment cannot exceedthe structural mass: ∑fi⩽ 1.
Results
With fixed trait values fL, fF and fN, the modelreproduces fundamental observations of the twomodel species from the laboratory, including inges-tion (Figure 3) and growth rates (Figures 4a and b) asfunctions of irradiance in fed and unfed cultures(grown in high inorganic nitrogen media). Ingestionrates in high food concentrations are close to zerounder low irradiance, but increases with irradiance(Figure 3). In effect, growth rates are negative under
Modeling succession of plankton populationsT Berge et al
5
The ISME Journal
very low irradiations, even with plenty of food andinorganic nutrients.
Without food, growth increases as functions ofirradiance only in K. veneficum, whereas growth isnot possible in K. armiger, due to the low investmentin inorganic nutrient uptake (fN)); (Figures 4a and b),and the lack of prey and thus nutrient limitation. Themodeled mixotrophic growth rates of K. armigerunder high food, high inorganic nutrients and lightlevels were slightly higher than the observed growthrates (Figure 4a), whereas the growth rates under lowlight intensity were slightly underestimated.
The trait values {fL,fF,fN} that result in the highestpopulation growth rate depend on the environment(Figure 5). Optimal investment in light harvesting isgenerally high (fL, 0.45–0.90), but decreases withirradiance in an environment with limited food andhigh levels of inorganic nutrients (Figure 5a). In highlight and low food levels, optimal investment ininorganic nutrient uptake increases with nutrientconcentration, but reach a maximum at low levels. Itfurther decreases at high nutrient levels (Figure 5b).Under high light conditions, optimal investments inphagotrophy increase with prey concentration and
reach a maximum of 0.5 at intermediate preyconcentrations. At higher prey concentrations,investment in phagotrophy further declines(Figure 5c). A wide range of combinations of traitvalues yield growth rates within 95% of the optimalgrowth rate (shaded areas in Figure 5).
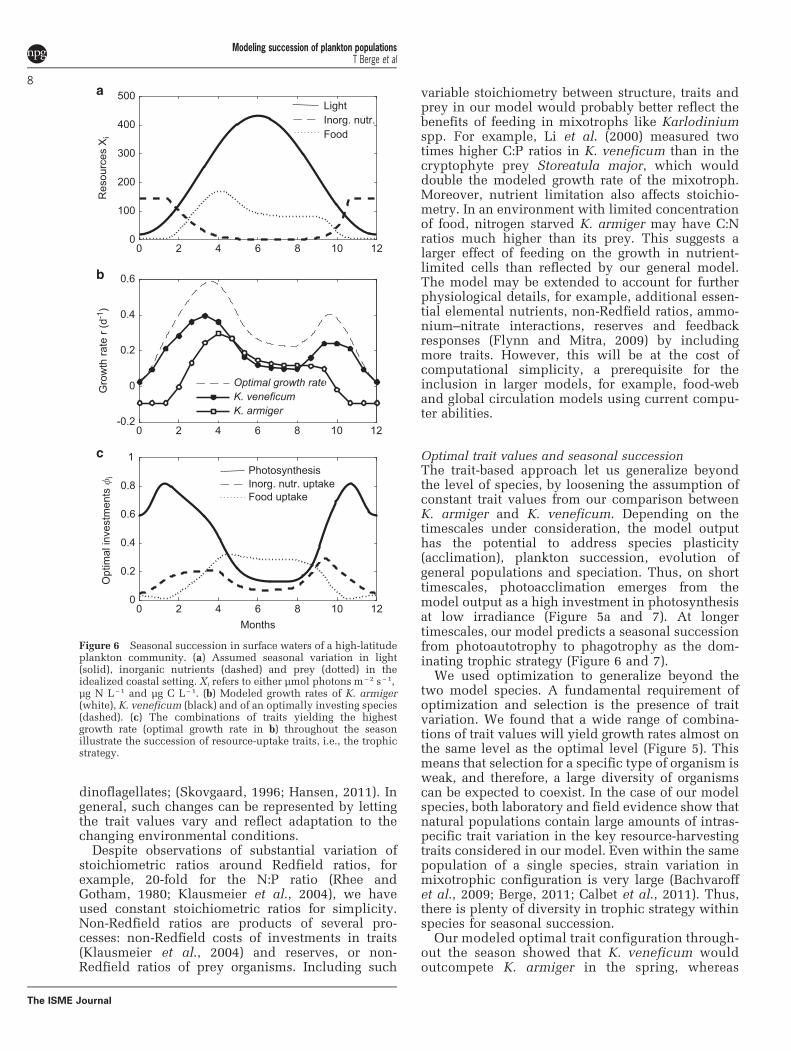
We calculated growth rates of K. armiger andK. veneficum in a constructed temperate seasonalcycle, from new production in the spring (highinorganic nutrients) to recycled production duringsummer (moderate food levels); (Figure 6a). Themodel shows that K. veneficum will outcompete K.armiger in the beginning and end of the season,whereas K. armiger attain higher competitive abil-ities later in the summer, when inorganic nutrientsare depleted and organic food levels are moderatelyhigh (Figure 6b).
The growth rate of an optimally investingspecies is positive throughout the season. Duringspring and at the end of the growing season, theoptimal trait combination is a low investment inphagotrophy, and high investment in inorganicnutrient uptake and light harvesting (Figure 6c).Investment in light harvesting is high at lowirradiance during the winter, but declines underhigh summer irradiances. Optimal investment inphagotrophy shows highest levels during thesummer and declining to very low during winter.
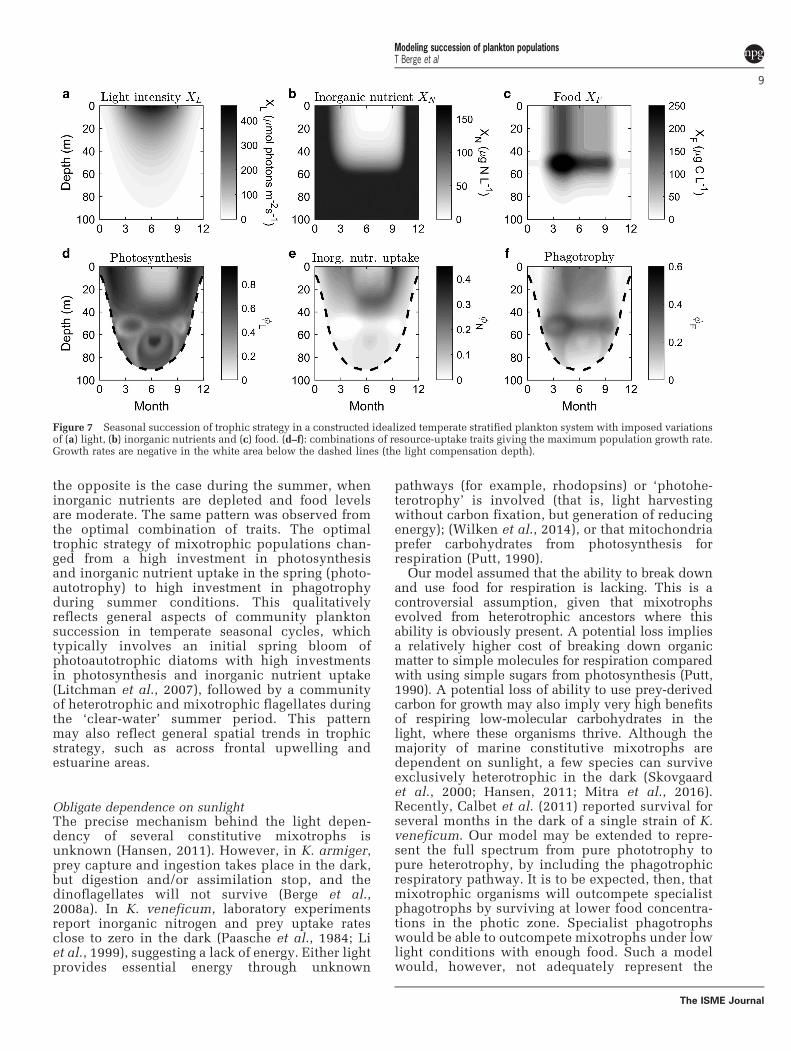
To further understand the succession of trophicstrategies in plankton communities, we modeled theoptimal investments in resource-uptake traits as afunction of depth throughout the season. We con-structed a seasonal cycle in an idealized planktonsystem with a stable pycnocline at 50m depth, and alight compensation point at 80m during the summerand a mixed water column during the winter.Surface irradiance followed the seasonal patternand penetrated water from a few meters in thewinter to the depth of 80m during the summer(Figure 7a). We assumed a constant light extinctionthroughout the season. We let the concentration ofinorganic nutrients quickly to become depleted afterthe spring bloom in the photic zone. Inorganic
Figure 3 Light-dependent steady state ingestion rates as afunction of irradiance in K. armiger (open symbols) andK. veneficum (closed symbols). Points are means of the threereplicate laboratory cultures fed saturating prey concentrations(41000 μg C L−1). Data from Li et al., 1999; Berge and Hansen,2016.
Figure 4 Growth rates in monocultures (dashed) and in fed cultures (solid) for (a) K. armiger and (b) K. veneficum as a function of lightintensity in food and inorganic nitrogen-saturated cultures. Observed growth rates in monoculture (triangles) and (circles) are means ofthree replicates. Data from Li et al., 1999; Adolf et al., 2006; Berge and Hansen, 2016.
Modeling succession of plankton populationsT Berge et al
6
The ISME Journal
nutrients increased with depth below the pycnoclineand reached highest level where light was stillpresent. In the late autumn, when the lightdecreased, inorganic nutrients returned to highwinter and spring levels (Figure 7b). A cryptophyteprey population formed a subsurface maximumthroughout the summer stratification, with typicalsummer concentrations above the pycnocline(Figure 7c). This system represents a typical tempe-rate seasonal succession in inorganic nutrients(dissolved inorganic nitrogen), food and light levelsin a coastal setting (for example, Irigoien et al., 2005).
The general relationship of decreased optimalinvestment with increased resources (Figure 5) wasreflected in the optimal trait combinations in theconstructed water column (Figures 7d–f). As lightpenetrates deeper during the course of the season, ahigh investment in photosynthesis is optimal at lowlight intensities at larger depths. A lower investmentin phagotrophy is optimal in the subsurface preypopulation, whereas a high investment in phagotro-phy and low investment in inorganic nutrient uptake(that is, similar to K. armiger) is optimal in surfacewaters during the summer. Investment in bothinorganic nutrient uptake and phagotrophy, similarto K. veneficum, is optimal at larger depths duringthe summer and in the surface during the spring andautumn (Figures 7d and f). Allocating resourcestoward phagotrophy at the expense of inorganicnutrient uptake is optimal during the summer, whenoptimal investments in photosynthesis and inorganicnutrient uptake are low (Figures 7d and f).
Discussion
We have developed a general trait-based model ofmixotrophs that is able to represent a spectrum oftrophic strategies. The model builds on existingsimple trait-based models of mixotrophy(Bruggeman, 2009; Ward et al., 2011; Våge et al.,2013), but goes beyond these by introducing three
variable traits and by explicitly resolving the flows ofcarbon and one essential nutrient (here, nitrogen).
The model reproduced the observed obligate lightdependence of phagotrophy in Karlodinium spp.(Figure 3), and growth rates under different light andfood scenarios also reproduced well with reporteddata from laboratory observations for the two modelspecies (Figure 4). This shows that a reliance ofphotosynthates for respiration may explain thetypical obligate dependence of light in constitutivemixotrophs.
Model simplificationsDespite the simplicity of the model, it was able torecreate the main differences in the functionalresponses between the two Karlodinium speciesunder steady state conditions. Therefore, most ofthe variability between the two species can becaptured by just two traits representing their differ-ence in the investments in inorganic nutrient uptakeand phagotrophy. The fits were not perfect though.Our model generally produced slightly lower growthrates under resource limitation and slightly highergrowth rates under resource saturation comparedwith laboratory observations (Figures 4a and b).These differences likely originate because we keepthe trait values constant. In reality, trait valueswould be able to change toward the optimum withinthe limits of phenotypic plasticity, in responseto varying light, inorganic nutrients and prey levels(Li et al., 2000). For example, photosyntheticplankton short-term acclimate to low irradiance byproducing more pigment, that is, investing more inphototrophy in the matter of hours to days. Forexample, in K. veneficum and K. armiger, cellularchlorophyll levels increase by a factor of three to fivetimes in light-limited compared with light-saturatedconditions (Li et al., 1999; Adolf et al., 2006; Bergeand Hansen, 2016). Nutrient limitation and foodconcentration or ingestion rate have also been foundto affect chlorophyll levels in other mixotrophic
Figure 5 The combination of traits yielding the highest growth rate as functions of light (a), inorganic nutrients (b) and preyconcentration (c) in constant environments. Dashed lines indicate the base value of resource, e.g., in (a), dashed line represents the level ofinorganic nutrients and food in panels b and c. Shaded areas represent the range of trait values giving growth rates within 95% of optimalgrowth rates, and suggest environmental states where trait values are likely to vary (e.g., genotypic plasticity or intraspecific variation).
Modeling succession of plankton populationsT Berge et al
7
The ISME Journal
dinoflagellates; (Skovgaard, 1996; Hansen, 2011). Ingeneral, such changes can be represented by lettingthe trait values vary and reflect adaptation to thechanging environmental conditions.
Despite observations of substantial variation ofstoichiometric ratios around Redfield ratios, forexample, 20-fold for the N:P ratio (Rhee andGotham, 1980; Klausmeier et al., 2004), we haveused constant stoichiometric ratios for simplicity.Non-Redfield ratios are products of several pro-cesses: non-Redfield costs of investments in traits(Klausmeier et al., 2004) and reserves, or non-Redfield ratios of prey organisms. Including such
variable stoichiometry between structure, traits andprey in our model would probably better reflect thebenefits of feeding in mixotrophs like Karlodiniumspp. For example, Li et al. (2000) measured twotimes higher C:P ratios in K. veneficum than in thecryptophyte prey Storeatula major, which woulddouble the modeled growth rate of the mixotroph.Moreover, nutrient limitation also affects stoichio-metry. In an environment with limited concentrationof food, nitrogen starved K. armiger may have C:Nratios much higher than its prey. This suggests alarger effect of feeding on the growth in nutrient-limited cells than reflected by our general model.The model may be extended to account for furtherphysiological details, for example, additional essen-tial elemental nutrients, non-Redfield ratios, ammo-nium–nitrate interactions, reserves and feedbackresponses (Flynn and Mitra, 2009) by includingmore traits. However, this will be at the cost ofcomputational simplicity, a prerequisite for theinclusion in larger models, for example, food-weband global circulation models using current compu-ter abilities.
Optimal trait values and seasonal successionThe trait-based approach let us generalize beyondthe level of species, by loosening the assumption ofconstant trait values from our comparison betweenK. armiger and K. veneficum. Depending on thetimescales under consideration, the model outputhas the potential to address species plasticity(acclimation), plankton succession, evolution ofgeneral populations and speciation. Thus, on shorttimescales, photoacclimation emerges from themodel output as a high investment in photosynthesisat low irradiance (Figure 5a and 7). At longertimescales, our model predicts a seasonal successionfrom photoautotrophy to phagotrophy as the dom-inating trophic strategy (Figure 6 and 7).
We used optimization to generalize beyond thetwo model species. A fundamental requirement ofoptimization and selection is the presence of traitvariation. We found that a wide range of combina-tions of trait values will yield growth rates almost onthe same level as the optimal level (Figure 5). Thismeans that selection for a specific type of organism isweak, and therefore, a large diversity of organismscan be expected to coexist. In the case of our modelspecies, both laboratory and field evidence show thatnatural populations contain large amounts of intras-pecific trait variation in the key resource-harvestingtraits considered in our model. Even within the samepopulation of a single species, strain variation inmixotrophic configuration is very large (Bachvaroffet al., 2009; Berge, 2011; Calbet et al., 2011). Thus,there is plenty of diversity in trophic strategy withinspecies for seasonal succession.
Our modeled optimal trait configuration through-out the season showed that K. veneficum wouldoutcompete K. armiger in the spring, whereas
0 2 4 6 8 10 120
100
200
300
400
500R
esou
rces
Xi
0 2 4 6 8 10 12-0.2
0
0.2
0.4
0.6
Gro
wth
rate
r (d
-1)
Optimal growth rateK. veneficumK. armiger
0 2 4 6 8 10 12Months
0
0.2
0.4
0.6
0.8
1
Opt
imal
inve
stm
ents
�i Photosynthesis
Inorg. nutr. uptakeFood uptake
LightInorg. nutr.Food
Figure 6 Seasonal succession in surface waters of a high-latitudeplankton community. (a) Assumed seasonal variation in light(solid), inorganic nutrients (dashed) and prey (dotted) in theidealized coastal setting. Xi refers to either μmol photons m− 2 s−1,μg N L−1 and μg C L−1. (b) Modeled growth rates of K. armiger(white), K. veneficum (black) and of an optimally investing species(dashed). (c) The combinations of traits yielding the highestgrowth rate (optimal growth rate in b) throughout the seasonillustrate the succession of resource-uptake traits, i.e., the trophicstrategy.
Modeling succession of plankton populationsT Berge et al
8
The ISME Journal
the opposite is the case during the summer, wheninorganic nutrients are depleted and food levelsare moderate. The same pattern was observed fromthe optimal combination of traits. The optimaltrophic strategy of mixotrophic populations chan-ged from a high investment in photosynthesisand inorganic nutrient uptake in the spring (photo-autotrophy) to high investment in phagotrophyduring summer conditions. This qualitativelyreflects general aspects of community planktonsuccession in temperate seasonal cycles, whichtypically involves an initial spring bloom ofphotoautotrophic diatoms with high investmentsin photosynthesis and inorganic nutrient uptake(Litchman et al., 2007), followed by a communityof heterotrophic and mixotrophic flagellates duringthe ‘clear-water’ summer period. This patternmay also reflect general spatial trends in trophicstrategy, such as across frontal upwelling andestuarine areas.
Obligate dependence on sunlightThe precise mechanism behind the light depen-dency of several constitutive mixotrophs isunknown (Hansen, 2011). However, in K. armiger,prey capture and ingestion takes place in the dark,but digestion and/or assimilation stop, and thedinoflagellates will not survive (Berge et al.,2008a). In K. veneficum, laboratory experimentsreport inorganic nitrogen and prey uptake ratesclose to zero in the dark (Paasche et al., 1984; Liet al., 1999), suggesting a lack of energy. Either lightprovides essential energy through unknown
pathways (for example, rhodopsins) or ‘photohe-terotrophy’ is involved (that is, light harvestingwithout carbon fixation, but generation of reducingenergy); (Wilken et al., 2014), or that mitochondriaprefer carbohydrates from photosynthesis forrespiration (Putt, 1990).
Our model assumed that the ability to break downand use food for respiration is lacking. This is acontroversial assumption, given that mixotrophsevolved from heterotrophic ancestors where thisability is obviously present. A potential loss impliesa relatively higher cost of breaking down organicmatter to simple molecules for respiration comparedwith using simple sugars from photosynthesis (Putt,1990). A potential loss of ability to use prey-derivedcarbon for growth may also imply very high benefitsof respiring low-molecular carbohydrates in thelight, where these organisms thrive. Although themajority of marine constitutive mixotrophs aredependent on sunlight, a few species can surviveexclusively heterotrophic in the dark (Skovgaardet al., 2000; Hansen, 2011; Mitra et al., 2016).Recently, Calbet et al. (2011) reported survival forseveral months in the dark of a single strain of K.veneficum. Our model may be extended to repre-sent the full spectrum from pure phototrophy topure heterotrophy, by including the phagotrophicrespiratory pathway. It is to be expected, then, thatmixotrophic organisms will outcompete specialistphagotrophs by surviving at lower food concentra-tions in the photic zone. Specialist phagotrophswould be able to outcompete mixotrophs under lowlight conditions with enough food. Such a modelwould, however, not adequately represent the
Figure 7 Seasonal succession of trophic strategy in a constructed idealized temperate stratified plankton system with imposed variationsof (a) light, (b) inorganic nutrients and (c) food. (d–f): combinations of resource-uptake traits giving the maximum population growth rate.Growth rates are negative in the white area below the dashed lines (the light compensation depth).
Modeling succession of plankton populationsT Berge et al
9
The ISME Journal
majority of naturally observed mixotrophic strate-gies (Stoecker, 1998; Mitra et al., 2016), and beunable to represent obligate light-dependentfeeding.
Model applicationThe simplicity of the model allows it to bedeployed easily to predict the dominating mixo-trophic strategy under given conditions or used as abasis for dynamic simulations of trait dynamics intime and space (Bruggeman, 2009). Our modelorganisms, Karlodinium spp., use toxins to immo-bilize prey before feeding and are well known assome of the most problematic species for aqua-culture in coastal areas worldwide (Sheng et al.,2010). The toxins are strong enough to allowingestion of metazoan grazers, for example, cope-pods, and Karlodinium blooms may potentiallyturn the food web upside down (Berge et al., 2012).As the model predicts when and where we mightexpect Karlodinium spp. populations to investheavily in phagotrophy, it may help us understandcritical periods for aquaculture in areas wherethese species exist.
Our study is purely bottom-up focused (that is,resource harvest), without considering trophic inter-actions and mortality losses such as predation (top-down effects). In a food-web context, strong trade-offs may exist between risk of being eaten andinvestment in phagotrophy, or the risk of virusattacks and investment in inorganic nutrient uptake(Våge et al., 2013). Unicellular organisms arecharacterized by several traits affecting mortality,for example, feeding mode (ambush vs cruising;Kiørboe, 2011), motility, toxin production or defenseagainst viruses. Thus, the implementation in a food-web model needs identification of additional ‘keytraits’ involved in biotic interactions. Traits andtrade-offs centered around mortality are more diffi-cult to quantify experimentally than resource-harvesting traits.
Conclusion
We have demonstrated how trait-based modelingtechniques can succinctly describe the main differ-ences between mixotrophic plankton by just a fewwell-chosen traits. Here, our focus has been on traitsrelated to resource uptake. A future challenge to thisapproach will be to include other traits, for example,cell size, as well as traits not directly relatedto resource harvesting, for example, defensetraits. Although the trait-based approach will notreplace current species- or functional-group-basedapproaches, it is useful for understanding the broad-scale patterns in global or seasonal changes inplankton communities.
Conflict of Interest
The authors declare no conflict of interest.
AcknowledgementsThis work is part of the ‘Centre for Ocean Life’, a VKRcenter of excellence supported by the Villum foundation.PJH was supported by a grant from the Danish ResearchCouncil for Independent Research (grant no 4181-00484).SC was supported by the HC Ørsted COFUND postdocfellowship. We wish to thank three anonymous referees fortheir suggestions.
ReferencesAdolf JE, Stoecker DK, Harding LW. (2006). The balance of
autotrophy and heterotrophy during mixotrophicgrowth of Karlodinium micrum (Dinophyceae).J Plankton Res 28: 737–751.
Bachvaroff TR, Adolf JE, Place AR. (2009). Strain variationin Karlodinium veneficum (Dinophyceae): toxinprofiles, pigments, and growth characteristics. J Phycol45: 137–153.
Berge T, Hansen PJ, Moestrup Ø. (2008a). Feedingmechanism, prey specificity and growth in light anddark of the plastidic dinoflagellate Karlodinium armi-ger. Aquat Microb Ecol 50: 279–288.
Berge T, Hansen PJ, Moestrup Ø. (2008b). Prey sizespectrum and bioenergetics of the mixotrophic dino-flagellate Karlodinium armiger. Aquat Microb Ecol 50:289–299.
Berge T. (2011). Functional diversity of marine protists:evidence from culture experiments. PhD thesis,Department of Biology. University of Copenhagen,Copenhagen, Denmark, p 113.
Berge T, Poulsen LK, Moldrup M, Hansen PJ. (2012).Marine microalgae attack and feed on metazoans. ISMEJ 6: 1926–1936.
Berge T, Hansen PJ. (2016). Role of the chloroplasts in thepredatory dinoflagellate Karlodinium armiger. MarEcol Prog Ser 549: 41–54.
Bruggeman J, Kooijman SALM. (2007). A biodiversity-inspired approach to aquatic ecosystem modeling.Limnol Oceanogr 52: 1533.
Bruggeman J. (2009). Succession in Plankton Commu-nities. The Netherlands: Vrije Universiteit Amsterdam:, pp 71–99.
Burkholder JM, Glibert PM, Skelton HM. (2008). Mixotro-phy, a major mode of nutrition for harmful algalspecies in eutrophic waters. Harmful Algae 8: 77–93.
Calbet A, Bertos M, Fuentes-Grünewald C, Alacid E,Figueroa R, Renom B et al. (2011). Intraspecificvariability in Karlodinium veneficum: growth rates,mixotrophy, and lipid composition.Harmful Algae 10:654–667.
Cavalier‐Smith T. (1982). The origins of plastids. Biol JLinn Soc 17: 289–306.
Falkowski PG, Raven J. (2013). Aquatic Photosynthesis.Princeton University Press: Princeton, NJ, USA.
Modeling succession of plankton populationsT Berge et al
10
The ISME Journal
Flynn KJ, Mitra A. (2009). Building the 'perfect beast':modelling mixotrophic plankton. J Plankton Res 31:965–992.
Flynn KJ, Stoecker DE, Mitra A, Raven JA, Glibert PM,Hansen PJ et al. (2013). Misuse of the phytoplankton –
zooplankton dichotomy: the need to assign organismsas mixotrophs within plankton functional types.J Plankton Res 35: 5–11.
Hansen PJ. (2011). The role of photosynthesis and fooduptake for the growth of marine mixotrophic dino-flagellates. J Eukaryot Microbiol 58: 203–214.
Hansen PJ, Nielsen LT, Johnson M, Berge T, Flynn KJ.(2013). Acquired phototrophy in Mesodinium andDinophysis–a review of cellular organization, preyselectivity, nutrient uptake and bioenergetics. HarmfulAlgae 28: 126–139.
Hartmann M, Grob C, Tarran GA, Martin AP, Burkill PH,Scanlan DJ et al. (2012). Mixotrophic basis of Atlanticoligotrophic ecosystems. Proc Nat Acad Sci USA 109:5756–5760.
Irigoien X, Flynn KJ, Harris RP. (2005). Phytoplanktonblooms: a ‘loophole’in microzooplankton grazingimpact? J Plankton Res 27: 313–321.
Jones RI. (1994). Mixotrophy in planktonic protists as aspectrum of nutritional strategies. Mar Microb FoodWebs 8: 87–96.
Kiørboe T. (2011). How zooplankton feed: mechanisms,traits and trade‐offs. Biol Rev Camb Philos Soc 86:311–339.
Klausmeier CA, Litchman E, Daufresne T, Levin SA.(2004). Optimal nitrogen-to-phosphorus stoichiometryof phytoplankton. Nature 429: 171–174.
Li AS, Stoecker DK, Adolf JE. (1999). Feeding, pigmenta-tion, photosynthesis and growth of the mixotrophicdinoflagellate Gyrodinium galatheanum. Aquat MicrobEcol 19: 163–176.
Li A, Stoecker DK, Coats DW. (2000). Mixotrophy inGyrodinium galatheanum (Dinophyceae): grazingresponses to light intensity and inorganic nutrients.J Phycol 36: 33–45.
Litchman E, Klausmeier CA, Schofield OM, Falkowski PG.(2007). The role of functional traits and trade‐offsin structuring phytoplankton communities: scalingfrom cellular to ecosystem level. Ecol Lett 10:1170–1181.
Mitra A, Flynn KJ, Burkholder JM, Berge T, Calbet A,Raven JA et al. (2014). The role of mixotrophic protistsin the biological carbon pump. Biogeosciences 11:995–1005.
Mitra A, Flynn KJ, Tillmann U, Raven JA, Caron D,Stoecker DK et al. (2016). Defining planktonic protistfunctional groups on mechanisms for energy andnutrient acquisition: incorporation of diverse mixo-trophic strategies. Protist 167: 106–120.
Morel A, Bricaud A. (1981). Theoretical results concerninglight absorption in a discrete medium, and applicationto specific absorption of phytoplankton. Deep Sea Res28: 1375–1981.
Norberg J, Swaney DP, Dushoff J, Lin J, Casagrandi R, LevinSA. (2001). Phenotypic diversity and ecosystem func-tioning in changing environments: a theoretical frame-work. Proc Natl Acad Sci USA 98: 11376–11381.
Paasche E, Bryceson I, Tangen K. (1984). Interspecificvariation in dark nitrogen uptake by dinoflagellates.J Phycol 20: 394–401.
Putt M. (1990). Metabolism of photosynthate in thechloroplast retaining ciliate Luboea strobila. Mar EcolProg Ser 60: 271–282.
Raven J. (1984). A cost-benefit analysis of photon absorp-tion by photosynthetic unicells. New Phytol 98:593–625.
Raven J. (1997). Phagotrophy in phototrophs. LimnolOceanogr 42: 198–205.
Sheng J, Malkiel E, Katz J, Adolf JE, Place AR. (2010).A dinoflagellate exploits toxins to immobilize preyprior to ingestion. Proc Natl Acad Sci USA 107:2082–2087.
Skovgaard A. (1996). Mixotrophy in Fragilidium subglo-bosum (Dinophyceae): growth and grazing responsesas functions of light intensity. Mar Ecolol Prog Ser 143:247–253.
Skovgaard A, Hansen PJ, Stoecker DK. (2000). Physiologyof the mixotrophic dinoflagellate Fragilidium subglo-bosum. I. Effects of phagotrophy and irradiance onphotosynthesis and carbon content. Mar Ecol Prog Ser201: 129–136.
Stickney HL, Hood RR, Stoecker DK. (2000). The impact ofmixotrophy on planktonic marine ecosystems. EcolModel 125: 203–230.
Stoecker DA. (1998). Conceptual models of mixotrophy inplanktonic protists and some ecological and evolu-tionary implications. Eur J Protistol 34: 281–290.
Straile D. (1997). Gross growth efficiencies of protozoanand metazoan zooplankton and their dependenceon food concentration, predator–prey weightratio, and taxonomic group. Limnol Oceanogr 42:1375–1385.
Thingstad TF, Havskum H, Garde K, Riemann B. (1996).On the strategy of 'Eating your competitor': a mathe-matical analysis of algal mixotrophy. Ecology 77:2108–2118.
Våge S, Castellani M, Giske J, Thingstad TF. (2013).Successful strategies in size structured mixotrophicfood webs. Aquat Ecol 47: 329–347.
Ward BA, Dutkiewicz S, Barton AD, Follows MJ. (2011).Biophysical aspects of resource acquisition and com-petition in algal mixotrophs. Am Nat 178: 98–112.
Wilken S, Schuurmans M, Matthijs HCP. (2014). Domixotrophs grow as photoheterotrophs? Photophysio-logical acclimation of the chrysophyte Ochromonasdanica after feeding. New Phytol 2044: 882–889.
This work is licensed under a CreativeCommons Attribution 4.0 International
License. The images or other third party material inthis article are included in the article’s CreativeCommons license, unless indicated otherwise in thecredit line; if the material is not included under theCreative Commons license, users will need to obtainpermission from the license holder to reproduce thematerial. To view a copy of this license, visit http://creativecommons.org/licenses/by/4.0/
Modeling succession of plankton populationsT Berge et al
Appendix AAppendix A Functional response and trait values
Figure A: Illustration of how the functionalresponse depends on the resource concentrationfor different values of the investment. The max-imum response increases linearly with the invest-ment, whereas the affinity (slope at origin) onlyincreases up to a maximum indicated by the dottedline. Parameters used in the example are forphotosynthesis (Table 1).
Calibration of parameter values for affinities andfunctional responseThe functional response contains three species-independent fundamental parameters and thetrait value fi. Two parameters concern theaffinity (Amax.i and αi), and one the maximumuptake rate (Mi). We assume that the trait value is
known and need to determine the three others.The information comes from measurements of thefunctional response, which provides two para-meters: maximum uptake rate Jmax.i and half-saturation constant Ki. The constant involved inmaximum uptake rate follows directly fromEquation (2):
Mi ¼ Jmax:i
fiV
Determining the two parameters concerning theaffinity requires one more piece of informationconcerning the level of investment,fsat.i, that leadsto saturation of the affinity (Equation (1)), that is,at which investment is the pay-off of investmentsignificantly diminished. We assume that satura-tion happens when the affinity is around 90% ofmaximum affinity, that is, when Ai = csatAmax.i,with csat = 0.9. The half-saturation constant isgiven as the ratio between the affinity and themaximum uptake rate, K = Jmax.i/Ai. Takentogether, this information provides expressionsfor the two affinity parameters:
ai ¼ Jmax:i
1� csatð ÞKVfiand Amax:i ¼ Jmax:i
csatK
For light affinities, we assume fsat.L = 0.9 and getJmax.L≈1.4V (1+fL+fN+fF) μgC per day and K≈40 μmolphotonsm− 2 s− 1 from Figure 2b. This givesML≈5.012, αL≈ 0.6265 mmol photonsm �2s�1ð Þ�1 andAmax:LE4:072 ´ 10�6mgC= mmol photons m�2s�1ð Þ.
For food uptake affinities, we assume fsat.F = 0.4and get Jmax.F≈1.4V(1+fL+fN+fF) μgC per day andK≈350 μgC l− 1 from Figure 2a. This givesMF≈14.0962 per day, αF≈0.1611 l per day per μgC,Amax.F≈4.654× 10− 7 l per day.
Modeling succession of plankton populationsT Berge et al