Page 1
Acknowledgements
i
João Tiago dos Santos Caldas de Sousa
Tese de Doutoramento Ramo de Bioquímica, especialidade de Bioquímica teórica
PhD thesis Branch of Biochemistry, speciality of Theoretical Biochemistry
Modeling the antigen and cytokine
receptors signalling processes and their
propagation to lymphocyte population
dynamics.
Faculdade de Ciências
Universidade de Lisboa 2003
Page 2
Acknowledgements
ii
Page 3
Acknowledgements
iii
Faculdade de Ciências
Universidade de Lisboa
Tese de Doutoramento Ramo de Bioquímica, especialidade de Bioquímica teórica
PhD thesis Branch of Biochemistry, speciality of Theoretical Biochemistry
João Tiago dos Santos Caldas de Sousa
Modeling the antigen and cytokine receptors
signalling processes and their propagation to
lymphocyte population dynamics
Supervisors
Doutor Jorge Carneiro Instituto Gulbenkian de Ciência
Prof. Ruy Carvalho Pinto Faculdade de Ciências, Universidade de Lisboa /
Instituto Rocha Cabral
Page 4
Acknowledgements
iv
Page 5
Acknowledgements
v
Cover: Microscope photograph showing a cluster of lymphocytes in a culture. (Courtesy of Jocelyne Demengeot.
Photograph taken using IGC’s microscope facilities at José Feijó’s lab)
Page 6
Acknowledgements
vi
Page 7
Acknowledgements
vii
i. Acknowledgements
I would like to express my deepest gratitude to the following people and institutions:
To Jorge Carneiro, for being an all-in-one supervisor, mentor, colleague and friend.
To Prof. Ruy Pinto, scientific mentor and role model since I was a student at
University.
I thank Instituto Gulbenkian de Ciência (IGC), for providing most of the scientific and
material infrastructure necessary for the realization this thesis, and Instituto Rocha Cabral
(IRC), for the support in the first months of this thesis. I also acknowledge the support of
the fellowship BD/13546/97 from Fundação para a Ciência e Tecnologia - Program Praxis
XXI.
To José Faro, for his friendship and for being always available to contribute, review
and discuss most, if not all, of the work of this thesis.
To Zvi Grossman, for discussions and suggestions in hypersensitivity, adaptation and
homeostasis, which transverse most of the work in this thesis.
To my friend Andreia Lino, for having the courage to work in the experimental
validation of parts of the TCR triggering model as part of her graduation thesis.
To Kalet Leon for his friendship, discussions, suggestions, Cuban coffee and rum.
To Jocelyne Demengeot for comments on the works of this thesis and for giving me
beautiful photographs of lymphocyte cultures for the cover. Also, I’m gratefull to the labs
of Jocelyne Demengeot and Paulo Vieira at the IGC, for being helpfull, supportive and
critic during my stay at that institution.
I thank all the people at the IGC and IRC, too many to name here.
To my friends, Isabel Abreu, Fernando Antunes, João Garcia, Rui Gardner and Rita
Lemos for their friendship, support and patience in dealing with me during the thesis.
Last, but not least, I am deeply thankful to Íris, for being wonderful and having a lot of
patience. Thank you for everything.
~ ~ I dedicate this thesis to my parents and my brother. I owe them more than I can say in
words.
Page 8
Acknowledgements
viii
Page 9
Table of contents
ix
ii. Table of contents
I. ACKNOWLEDGEMENTS............................................................................ VII
II. TABLE OF CONTENTS..................................................................................IX
III. ABBREVIATIONS AND NOTES TO THE READER ...........................XIII
IV. SUMÁRIO..................................................................................................... XV
V. SUMMARY..................................................................................................XVIII
1 GENERAL INTRODUCTION .......................................................................... 1
1.1 THE CLONAL SELECTION THEORY .................................................................... 3
1.2 T LYMPHOPOIESIS AND POPULATION DYNAMICS.............................................. 6
1.3 SIGNALS AFFECTING THE LIFE HISTORY OF T LYMPHOCYTES......................... 10
1.3.1 TCR engagement and triggering .............................................................. 11
1.3.2 Cytokine receptor engagement................................................................. 16
1.4 THE IMMUNE SYSTEM RANGES MULTIPLE ORGANISATION LEVELS................. 18
1.5 THIS THESIS. .................................................................................................. 21
1.5.1 Sharing cytokine receptor chains and their implications......................... 21
1.5.2 Mathematical analysis of TCR triggering. ............................................... 22
1.5.3 Adaptable activation thresholds and lymphocyte homeostasis. ............... 23
1.5.4 General discussion ................................................................................... 23
1.6 BIBLIOGRAPHY.............................................................................................. 24
2 IMPLICATIONS OF SHARING CYTOKINE RECEPTOR CHAINS........ 2
2.1 INTRODUCTION.............................................................................................. 41
2.2 MODELLING AND RESULTS............................................................................ 43
2.2.1 Coupling between IL-2 and IL-4 receptor signalling via the common
gamma chain ................................................................................................................ 43
2.2.2 IL-2 and IL-4 are potentially non-competitive inhibitors of each other but
the effect of IL-2 is quantitatively more important....................................................... 46
Page 10
Table of contents
x
2.2.3 Differentiation of ThP cells to committed Th2 cells — A population
dynamics model ............................................................................................................ 47
2.2.4 Inhibition of IL-4 driven differentiation by IL-2 allows for the persistence
of precursors................................................................................................................. 50
2.2.5 Modulating γc expression levels may be used to influence the extent to
which a clone is committed .......................................................................................... 54
2.3 DISCUSSION................................................................................................... 55
2.4 BIBLIOGRAPY ................................................................................................ 58
3 ANALYSIS OF TCR ENGAGEMENT, TRIGGERING AND DOWN-
MODULATION.................................................................................................................. 63
3.1 A MATHEMATICAL ANALYSIS OF TCR SERIAL TRIGGERING AND DOWN-
REGULATION...................................................................................................................... 65
3.1.1 Introduction .............................................................................................. 67
3.1.2 Results ...................................................................................................... 68
3.1.2.1 Experimental data and model variables ............................................. 68
3.1.2.2 TCR-dimerisation fails to explain the experimental data .................. 69
3.1.2.3 Non zero steady-state resulting from ligand independent TCR-
turnover 73
3.1.2.4 Insensitivity to changes in ligand density results from a transient
accumulation of a pool of triggered TCRs .......................................................... 73
3.1.2.5 TCR-triggering is ultrasensitive to ligand and TCR densities .......... 74
3.1.2.6 Two pools of membrane TCR with different triggering kinetics
explain biphasic kinetics of down-regulation...................................................... 75
3.1.3 Discussion ................................................................................................ 76
3.1.4 Methods .................................................................................................... 80
3.1.5 References ................................................................................................ 80
3.2 ON THE REQUIREMENT FOR HIGH COOPERATIVITY IN TCR TRIGGERING:
HYPOTHETICAL MECHANISMS OF TCR TRIGGERING. ......................................................... 85
3.2.1 Introduction .............................................................................................. 87
3.2.2 Results ...................................................................................................... 88
3.2.2.1 Kinetic analysis of TCR triggering.................................................... 88
3.2.2.2 Sequential oligomerization of TCR-ligand complexes...................... 89
Page 11
Table of contents
xi
3.2.2.3 The cycle of TCR triggering.............................................................. 92
3.2.3 Discussion ................................................................................................ 95
3.2.4 Methods .................................................................................................. 100
3.2.5 Appendix................................................................................................. 100
3.2.6 References .............................................................................................. 102
3.3 ACTIVATION THRESHOLDS, ADAPTATION AND TCR TRIGGERING................ 105
3.3.1 Bibliography........................................................................................... 107
3.4 TOWARDS AN ANALYSIS OF THE EXPERIMENTAL SETTINGS TO STUDY TCR
TRIGGERING BY LIGAND................................................................................................... 109
3.4.1 Bibliography........................................................................................... 111
4 ADAPTABLE ACTIVATION THRESHOLDS AND LYMPHOCYTE
HOMEOSTASIS .............................................................................................................. 113
4.1 INTRODUCTION............................................................................................ 116
4.2 RESULTS...................................................................................................... 117
4.2.1 The AAT signalling model ...................................................................... 117
4.2.1.1 Activation threshold, adaptation and refractoriness ........................ 119
4.2.1.2 AAT and frequency of the stimuli ................................................... 122
4.2.2 Dynamics of a population of lymphocytes with AAT.............................. 124
4.2.2.1 Methods for simulation of many individual cells and quasi-steady
state analysis...................................................................................................... 126
4.2.2.2 Results of simulation and quasi-steady state analysis of the AAT
population model ............................................................................................... 127
4.2.2.3 Thymic influx of refractory and responsive lymphocytes ............... 133
4.3 DISCUSSION................................................................................................. 136
4.4 BIBLIOGRAPHY............................................................................................ 139
5 GENERAL DISCUSSION.............................................................................. 143
5.1 BIBLIOGRAPHY............................................................................................ 157
Page 12
Table of contents
xii
Page 13
Abbreviations and notes to the reader
xiii
iii. Abbreviations and notes to the reader
This thesis includes four original manuscripts published or submitted in various
specialized journals, which are presented either as chapters or as sub-chapters, denoted as
sections for now on. Figures and tables are numbered sequentially within each section;
when adequate for proper reference, the section number always precedes cross-section
references. Each section contains its own bibliographic reference list.
Abbreviations and nomenclature are based in the guidelines for publication in the
European Journal of Immunology (year 2000 guidelines), together with the following
definitions that transverse all the sections of this thesis:
Abbreviation Definition
γc ........................................ Common γ Chain
AAT ................................... Adaptable Activation Threshold
Ab....................................... Antibody
Ag....................................... Antigen
APC.................................... Antigen Presenting Cell
APL.................................... Altered Peptide Ligand
BCR ................................... B Cell Receptor
BM ..................................... Bone Marrow
CLP .................................... Common Lymphocyte Precursor
DC...................................... Dendritic Cell
HSC.................................... Haematopoietic Stem Cell
IFN..................................... Interferon
Ig ........................................ Immunoglobulin
IL-2R.................................. IL-2 Receptor
IL-4R.................................. IL-4 Receptor
ITAM ................................. Immuno-receptor Tyrosine Activation Motifs
JAK .................................... Janus Kinase
MHC .................................. Major Histocompatibility Complex.
NK...................................... Natural Killer
PTK.................................... Protein Tyrosine Kinase
PTP..................................... Protein Tyrosine Phosphatase
Page 14
Abbreviations and notes to the reader
xiv
STAT ................................. Signal Transducer and Activator of Transcription
TCR.................................... T Cell Receptor
Th ....................................... Helper T cell
SAC.................................... Src-Associated Co-receptor.
EP........................................ Phosphatase
EK ....................................... Kinase
MIC.................................... Many Individual Cells
SMIC.................................. Simulation of Many Individual Cells
QSS .................................... Quasi Steady State
Page 15
Sumário
xv
iv. Sumário
A teoria da selecção clonal fundamentou a discriminação pelo sistema imune entre
antigénios próprios e antigénios estranhos (self/non self discrimination) no processo de
selecção de linfócitos com base na especificidade dos receptores para o antigénio expressos
dessas células. Após a aceitação da teoria da selecção clonal, os eventos que condicionam o
desenvolvimento linfocitário, a interacção entre linfócitos e outras células e as vias de
transdução de sinal tornaram-se da maior importância em Imunologia.
Durante os diferentes estádios de desenvolvimento de linfócitos são expressos
diferentes subconjuntos de receptores para os vários factores que determinam quais as vias
possíveis para a continuação desse desenvolvimento. Assim sendo, a dinâmica populacional
de linfócitos depende dos processos decorrentes ao nível de células individuais, como por
exemplo a regulação da expressão de receptores e a transdução de sinais. No entanto, esses
processos decorrentes em células dependem também da interacção directa ou indirecta com
outras células. Essas interacções podem ser mediadas quer por factores solúveis no meio
extracelular, quer por contacto directo com outras células. Logo os processos decorrentes a
nível celular e populacional são interdependentes.
A compreenção das interacções entre diferentes níveis de organização é fundamental
para o estudo de sistemas biológicos, para a compreensão da separação entre moléculas e
metabolismo, entre células e populações celulares, entre populações celulares e órgãos e
organismos e entre indivíduos e ecossistemas. Actualmente, as técnicas correntes em
biologia, bioquímica e biologia molecular têm uma forte componente reducionista. O
emprego dessas técnicas tem sido frutuoso na caracterização de muitos componentes e
interacções pertencentes a cada nível de organização, mas no entanto têm tido um sucesso
limitado na caracterização das interacções entre diferentes níveis de organização.
O objectivo desta tese é contribuir para a compreensão de como eventos ocorrentes ao
nível de uma única célula influenciam a dinâmica populacional dessas mesmas células. A
tese concentra-se na dinâmica populacional de linfócitos T CD4+ e nos receptores mais
importantes que condicionam o desenvolvimento linfocitário: o receptor para o antigénio
(TCR) e os receptores para as citocinas. Mais especificamente, os trabalhos aqui
apresentados estudam, recorrendo à modelação matemática, como a interferência entre
citocinas e a desensitização do TCR podem influenciar a dinâmica populacional dos
linfócitos T CD4+. A tese está dividida em três partes principais de resultados, com uma
Page 16
Sumário
xvi
discussão final.
A primeira parte da tese aborda o estudo da consequência de receptores para citocinas
diferentes partilharem exclusivamente subunidades necessárias à transdução de sinal. Para
abordar esta questão foi usado um modelo prototípico da interferência entre os receptores
IL-2R e IL-4R, estendendo depois esse modelo à dinâmica de diferenciação de linfócitos
ThP a Th2. Os resultados do modelo da interferência entre receptores indicam que no
regime de parâmetros estimados experimentalmente, quando a IL-2 é saturante o receptor
da IL-2 é capaz de sequestrar a maior parte da cadeia partilhada (γc) entre o IL-2R e o IL-
4R, o que inibe a formação do receptor da IL-4 em aproximadamente 40% (em condições
de IL-4 saturante). A citocina IL-4 é secretada por células Th2 e é um importante factor de
diferenciação de linfócitos ThP em Th2, constituindo portanto um mecanismo de feed-back
positivo na diferenciação. A citocina IL-2 é um importante factor de crescimento
linfocitário, sendo um factor de crescimento das células ThP e sendo secretado por essas
mesmas células. Usando um modelo simples de diferenciação de ThP a Th2 demonstrou-se
que em determinadas condições a inibição da formação do receptor IL-4R em 40% é
suficiente para atenuar os efeitos do feed-back positivo mediado pela IL-4, impedindo a
exaustão da população de células precursoras ThP.
A segunda parte da tese é dedicada ao estudo da dinâmica da expressão e
desensitização por internalização do TCR em linfócitos T. Foi usado um modelo
fenomenológico para determinar as propriedades do mecanismo de activação e
internalização do TCR subjacentes aos dados experimentais da cinética da internalização do
TCR. O resultado mais importante deste modelo foi a identificação da necessidade de uma
elevada cooperatividade (ou hipersensibilidade) no mecanismo de activação do TCR. Esta
elevada cooperatividade é indicativa que o processo de activação do TCR é um processo
complexo, provavelmente envolvendo vários passos reaccionais. Assim sendo,
averiguamos qual dos mecanismos propostos para a activação do TCR seria o mais capaz
de descrever esta elevada cooperatividade assim como a cinética de internalização do TCR.
Os dois principais mecanismos propostos de activação do TCR são i) a dimerização do
TCR mediada pelo ligando, MHC-péptido apresentado por uma APC; e ii) a fosforilação do
TCR mediada pelo ligando e pelo coreceptor CD4 associado a lck. Os resultados dos
modelos estudados sugerem uma conciliação de ambos os mecanismos, dependendo da
dose de ligando apresentada pela APC. A baixas doses de ligando o mecanismo dependente
do CD4 poderá ser o mais significativo, mas a altas doses de ligando ambos os mecanismos
Page 17
Sumário
xvii
de activação serão possíveis. Em aberto fica a questão se estes mecanismos transducem
sinais qualitativamente diferentes.
Finalmente, na terceira parte da tese estudou-se se a adaptação do limiar de activação
da sinalização do TCR é uma condição suficiente para a manutenção homeostática de uma
população periférica de linfócitos T auto-reactivos desensitizados. O modelo usado neste
estudo inclui dois níveis de organização: o nível de linfócitos adaptáveis com uma via de
transdução de sinal do TCR simples, com hipersensibilidade e com um limiar de activação
adaptável ao estímulo; e o nível da dinâmica da população de linfócitos adaptáveis.
Para se dividir, um linfócito necessita de receber um estímulo acima do limiar de
activação de uma APC. Um modelo simples de homeostase de linfócitos seria que o
crescimento de uma população de linfócitos é limitado pela competição desses linfócitos
por APCs. Neste modelo simples, não é possível que existam linfócitos anérgicos na
periferia, já que cada interacção com APC promove uma resposta que implica divisão
celular. Numa população de linfócitos adaptativos, a dinâmica depende não só do numero
de APCs, mas também do estado do limiar de activação de cada linfócito, que depende por
sua vez das interacções passadas com APC. Como cada linfócito tem um historial de
activação único, é necessário ter em linha de conta a contribuição de cada linfócito para a
dinâmica populacional. Neste estudo, usaram-se dois modelos para estudar a dinâmica de
linfócitos adaptáveis: Um modelo onde se simulou a população de linfócitos usando um
autómato celular; e um modelo onde se simulou a evolução de cada linfócito numa
população de linfócitos em estado estacionário. Os resultados dos modelos indicam que o
estado estacionário onde os linfócitos estão anérgicos, é instável. Pequenas perturbações em
torno desse estado estacionário podem levar a população de linfócitos a ficar cada vez
menos desensitizadas e a crescer até ficar limitada pelo número de APCs, tal como no
sistema simples sem adaptação, ou a decrescer até ao total colapso da população.
Consequentemente, a adaptação do limiar de activação do TCR não é por si só suficiente
para a manutenção homeostática de uma população periférica de linfócitos T auto-reactivos
em estado de desensitização (adaptados), no entanto é um mecanismo eficiente para a
deleção periférica dos mesmos se a população inicial for menor que o que o estado
estacionário instável onde os linfócitos estão anérgicos.
Esta tese constitui um passo inicial para a resposta à questão de como os processos
ocorrentes ao nível linfocitário se propagam até ao nível da dinâmica de populações e
influenciam o sistema imunitário. Este é um campo ainda numa fase embrionária, onde se
Page 18
Summary
xviii
antevê um forte impacto em Imunologia e biologia em geral.
v. Summary
The clonal selection theory provided a view of self/non-self discrimination based in
lymphocyte selection by the specificity of the antigen receptor expressed by the
lymphocyte. After the acceptance of this theory the characterization of lymphocytes, the
events that direct their development, the interaction with other cells and the signaling
cascades involved in the integration of signals by lymphocytes became central in
Immunology.
At different stages of lymphocyte development, different subsets of receptors for the
factors that condition lymphocyte development are expressed. This restricted expression of
receptors shapes the possible developmental paths of the lymphocyte; hence lymphocyte
population dynamics depends on the underlying molecular events, such as the regulation of
receptor expression and signal transduction, occurring in each lymphocyte. Conversely,
molecular single cell events also depend on the direct or indirect interaction with other
cells; hence single cell events depend on processes occurring at the cell population level.
The understanding of the interactions between different levels of organization is
fundamental for the study of biological systems, to understand the leaps from molecules to
metabolism, from cells to cell populations, from cell populations to an organ and organism
and from individuals to ecosystems. Current mainstream techniques in biology, molecular
biology and biochemistry rely on a prominently reductionist approach, providing plenty of
knowledge on the individual components and their interactions within the different
organization levels, but little or no information on how these components interact between
different organization levels.
The goal of this thesis is to contribute to the study of how do single cell events
influence the population dynamics of cells. We focus in CD4+ T cells and the receptors that
ultimately dictate lymphocyte fate: the antigen and the cytokine receptors. More
specifically we address, using mathematical models, the influence that molecular events at
the cell level, such as the competition between cytokines for the receptor subunits and T
cell antigen receptor desensitization, have on the dynamics of lymphocytes.
This thesis is divided in three major parts of results, with a final discussion. The first
part deals with the consequence for T cell population dynamics of cytokine receptors
sharing exclusively receptor subunits necessary for signal transduction. We study a
Page 19
Summary
xix
prototypic model of IL-2R and IL-4R interference and extend the results of this model to
the population dynamics of ThP differentiation to Th2. The results of the model showed
that although this interference is about 40% inhibition of IL-4R signaling by IL-2R, it can
be significant enough to prevent Th2-mediated exhaustion of ThP precursor cells from the
system.
The second part of the thesis addressed the process of TCR engagement, triggering and
down-modulation. We used phenomenological models together with available experimental
data, to gain insight into the underlying mechanism of TCR triggering and down-
modulation. The most important of the results of this model is the requirement for high
cooperativity (hypersensitivity) in the mechanism of TCR triggering. We then explored if
either TCR cross-linking or TCR triggering via crosslinking CD4-lck could explain this
high cooperativity. Our results suggest that at low dose of ligand presentation CD4 cross-
linking might be the preferential mechanism of TCR triggering, but at high dose of ligand
presentation both TCR crosslinking and CD4 co-receptor crosslinking mechanisms should
be possible.
Finally, in the third part we addressed the question if adaptation of activation
thresholds in TCR signaling is a sufficient condition for the maintenance of a peripheral
pool of auto-reactive lymphocytes. The model used in this study includes two
organizational levels: The adaptable lymphocyte with a simplified TCR signal transduction
pathway displaying hypersensitivity and an activation threshold adaptable to stimulus; and
the dynamics of a population of adaptable lymphocytes, which reflects the state of the
individual cells in the population, which is in turn the consequence of all the past
encounters of each lymphocyte with APC. Our modeling results indicate that although
adaptation of activation thresholds in TCR signaling is not a sufficient condition for the
maintenance of a peripheral pool of auto-reactive lymphocytes, it is nevertheless an
efficient mechanism of peripheral deletion of self-reactive clones.
This thesis is an initial effort to answer the question of how do single cell events, such
as signal transduction and regulation of receptor expression, propagate to the population
dynamics of lymphocytes and influence the immune system. We barely scratch the surface
of what appears to be a most interesting and still mostly unexplored area of modeling in
Immunology and biology in general.
Page 21
General introduction
1
1 General introduction
1
General introduction
Page 22
General introduction
2
Page 23
General introduction
3
1.1 The clonal selection theory
The clonal selection theory by Sir MacFarlane Burnet (Burnet 1957) bridged the
chasm between cellular and humoral Immunology by identifying a cell, the lymphocyte,
with a particular antigen receptor. Immunology became footed on the duality of the
specificity of antigen receptors and the life history of the cells expressing those receptors.
The properties of the immune system are the result of the individual contributions and
interactions of the cells that make it, thus under the clonal selection theory, to understand
the generation and maintenance of the immunoglobulin repertoire and immune response, it
is necessary to understand the life history traits of lymphocytes, i.e. the generation,
activation, differentiation and proliferation of lymphocytes, in addition to understanding
their interactions with other cells. Hence, the study of the events that control the transition
of lymphocytes between the various development stages became a fundamental problem in
Immunology.
The clonal selection theory proposed that during the early stages of development and
up to the neonatal period, antibody-producing cells are generated with random specificity
from a common precursor. During the development of these cells, antigen stimulation
arrests their development and causes their death (deletion). Since it is most likely the
antigen found during ontogeny originates from the host (self antigen), deletion of the
reactive cells during ontogeny selects only the cells that do not recognise self-antigen, thus
ensuring self-tolerance.
Since it's acceptance, the clonal selection theory has been extended and modified to
account for novel observations. Some of these extensions are the discovery that
haematopoiesis is a life-long process (Lederberg 1958); the positive selection of
lymphocytes (Zinkernagel and Doherty 1997); the elucidation of the molecular bases of the
generation of antigen receptor diversity (Tonegawa 1976; Brack, Hirama et al. 1978;
Tonegawa 1983; Wagner and Neuberger 1996; Fugmann, Lee et al. 2000), and the
discovery of the T helper, CTL and supressor subsets of lymphocytes. The two signals
model by Cohn and colleagues of the regulation of the immune response is a conceptual
elaboration of the clonal selection theory that incorporates these findings (Bretscher and
Cohn 1968; Langman and Cohn 1996). Briefly, the model proposes that activation of B
cells by monovalent antigens requires two signals: the antigenic signal (signal 1) and help
Page 24
General introduction
4
provided by T cells (signal 2). In the presence of only signal 1, B cells are rendered non-
responsive. Help for T cells is provided by effector T cells, whose activation also depends
on antigen (signal 1) and help from other T cells (signal 2). In the presence of only signal 1,
T cells are also rendered non-responsive. Mature T cells are also capable of becoming
helper effectors in the absence of signals 1 and 2. Self/non-self discrimination is possible if
T cell development is a slow process that ensures that self-reactive T cells capable of
delivering signal 2 do not mature or, more precisely, mature rarely.
An exception to the clonal selection theory is the existence, in normal healthy
individuals, of auto-reactive natural antibodies (Avrameas 1991) and of T cells that do not
elicit a destructive immune response (Sakaguchi, Fukuma et al. 1985; Pereira, Forni et al.
1986). This is paradoxical under the clonal selection theory, where recognition of antigen
either leads to deletion or to activation of the destructive effector function of the clone. This
phenomenon raises important questions on the regulation and organization of the immune
system. Several hypotheses have been proposed to solve this paradox, some of which are:
1. The Danger model, by Matzinger and colleagues (Matzinger 1994). The danger
hypothesis shifts the functional dependence of the immune system from self/non-self
recognition to danger/no danger recognition mediated by professional APCs. According
to this theory, the immune system reacts against danger, irrespectively of this danger
being self or non-self in origin. Danger can be many things, the spill of intracellular
contents, toxins, bacterial components, etc. The discrimination of danger and non-
danger is done at the APC, which are capable of presenting antigens with co-
stimulation, thus activating T cells and initiating the immune response (Cunningham
and Lafferty 1977).
2. The hypothesis of adaptable activation thresholds (AAT) of lymphocytes by Grossman
and colleagues (Grossman and Paul 1992; Grossman and Paul 2000; Grossman and
Paul 2001). This hypothesis postulates that the dynamics of lymphocyte activation is
akin to that of neuronal sensory systems. The main hypothesis is that lymphocytes are
only activated when the antigenic stimulus increases above a dynamic threshold that is
set by the background antigen present in the environment. Since self-antigens are (in
general) persistent and/or ubiquitous in the organism, it can be argued that self-antigen
constitutes a background stimulus. Hence, lymphocytes would adapt (tune) their
activation threshold and stop responding to the self-antigen background. The AAT
hypothesis has been used to explain some experimental phenomena (Nicholson,
Page 25
General introduction
5
Anderson et al. 2000; Smith, Seddon et al. 2001; Wong, Barton et al. 2001).
3. The hypothesis of regulatory or suppressor T cells. The clonal selection theory
postulates that tolerance is recessive, i.e. the only way to achieve tolerance is through
deletion of the clones with the potential to elicit an immune response. Experimental
evidence has been accumulated in which the acquisition of tolerance is mediated by the
adoptive transfer of a subset of cells from tolerant animals (Sakaguchi, Fukuma et al.
1985; Fowell, McKnight et al. 1991; Smith, Lou et al. 1992; Modigliani, Thomas-
Vaslin et al. 1995; Sakaguchi, Sakaguchi et al. 1995; Powrie, Mauze et al. 1997). These
“dominant tolerance” (Bandeira, Mengel et al. 1991) experiments demonstrate the
existence of a population of peripheral auto-reactive T cells, which might be important
for the regulation of the immune system. Suppressor T cells can “upgrade” the two-
signal model to a three-signal model, where the third signal is negative and suppresses
the second signal, which is provided by activator T cells; Suppressor T cells can also
extend the danger model by interfering in the APC T helper interaction. In the recent
years, the study of regulatory cells has gained considerable momentum, in the
understanding of their generation and phenotype and the mechanism of suppression
(Leon, Perez et al. 2000; Sakaguchi 2000; Leon, Perez et al. 2001; Shevach, McHugh et
al. 2001; Shevach 2002).
These hypotheses reflect the hierarchy of the organization of the immune system,
which depends on the interaction between populations of different cell types that
communicate via signals relying on the expression of receptors and respective agonists and
antagonists.
In this thesis, the focus will be on T lymphocytes, specifically in particular aspects of
T cell signalling related to life history traits of T lymphocytes, and the implications for the
population dynamics of these cells. The following introduction is therefore biased towards
T lymphocytes, making mention of B-lymphocytes sparsely and only for comparative
purposes. We introduce briefly the life history of lymphocytes, from the bone marrow
(BM) precursors to the differentiated peripheral effector classes, focusing on the
mechanisms of maintenance and differentiation of these cells. We also introduce the main
signals that influence the progression of lymphocytes through their life history, the TCR
and cytokine signalling, and introduce in more detail the AAT hypothesis, where the
history of cells influences the cell signalling apparatus.
Page 26
General introduction
6
1.2 T lymphopoiesis and population dynamics
Differentiation of lymphocytes is a spatial-temporal problem of population dynamics
bracing multiple organs, environments and specific factors. Great effort has been dedicated
to identify the receptors, master genes and patterns of expression involved in the transitions
in the developmental pathways of B (Henderson and Calame 1998; Hardy and Hayakawa
2001) and T lymphocytes (Kuo and Leiden 1999; Di Santo, Radtke et al. 2000; Murphy,
Ouyang et al. 2000; Quong, Romanow et al. 2002). In spite of all the progress made, the
molecular biology approach only provides a static picture of lymphocyte development and
differentiation. Thus little is known about the temporal and spatial components of the
dynamics of the different lymphocyte pools. What makes the regulation of the dynamics
and size of differentiating lymphocyte pools complex to understand is that each lymphocyte
clone has a unique antigen receptor (resulting from the somatic recombination of gene
fragments) and a characteristic expression profile of molecules (surface markers) at each
stage in the lymphocyte life history. These surface markers include membrane receptors,
adhesion molecules and co-receptors, and reflect the stage of development of the cell. They
can influence differentiation, migration, survival, proliferation, or death of a cell, as a
function of the surrounding environment.
All lymphocytes derive from haematopoietic stem cells (HSC), the common precursor
in haematopoietic organs. HSCs in the BM of mammals are the self-renewing precursors of
all the cells of the hematolymphoid lineages (Spangrude and Johnson 1990; Smith,
Weissman et al. 1991). One of the descendents of these pluripotent cells in the BM is the
common lymphoid progenitor (CLP) cell that can differentiate to B, T and NK cells
(Kondo, Weissman et al. 1997). Animals reconstituted with CLP cells lose cell numbers
after 4 weeks, which indicates that these cells have a limited self-renewal capacity (Kondo,
Weissman et al. 1997), in contrast to HSCs and memory peripheral lymphocytes (Tanchot
and Rocha 1995).
The thymus is where TCR genes of precursor T cells undergo somatic recombination
and selection of T cells takes place. Precursors originating from the bone marrow can
differentiate in the thymus to dendritic cells, NK cells and T cells, expressing either αβ
(CD4+ or CD8+) or γδ TCR. The T cells expressing γδ TCR represent only 1-10% of
peripheral T cells (Bank, DePinho et al. 1986). Compared to the αβ T cells, little is known
Page 27
General introduction
7
about the development and physiology of γδ T cells (reviewed in (Chien, Jores et al. 1996;
Hayday 2000)). In this thesis we focus only on αβ T cells; unless otherwise stated, we refer
to the αβ TCR simply as TCR.
The type of T cell precursors that enter the thymus from the BM is still a matter of
debate. These precursors maintain some degree of multipotency, being able to generate B,
NK and dendritic cells under appropriate conditions (reviewed in (Shortman and Wu 1996;
Di Santo, Radtke et al. 2000)). Notch1 signalling is necessary for differentiation of
precursor T cells entering the thymus and it might be required in the following stages for
αβ T cell commitment (Pui, Allman et al. 1999; Radtke, Wilson et al. 1999), reviewed in
(Di Santo, Radtke et al. 2000).
The most important feature of antigen receptors and antibodies is the variable region,
which confers the specificity of antigen recognition. The segments of the gene encoding the
Ig and TCR chains are assembled by somatic recombination of gene fragments; the V, D, J
(heavy and beta chain genes respectively in B and T cells) or the V, J (light and alpha chain
genes respectively in B and T cells) regions of the gene are recombined into an exon, which
encodes the antigen-binding domain of the molecule (Tonegawa 1976; Brack, Hirama et al.
1978; Tonegawa 1983; Wagner and Neuberger 1996; Fugmann, Lee et al. 2000). The
mechanism of somatic recombination and mutation of the Ig and TCR genes is the
molecular biology foundation of the clonal selection theory. B cells, but not T cells, can
still undergo additional stages of somatic mutation of immunoglobulin genes by single
point mutations during the germinal centre reaction (Weigert, Cesari et al. 1970; Wagner
and Neuberger 1996; Jacobs and Bross 2001).
The generation of antigen receptor gene diversity does not preclude the possibility of
generating out-of-frame rearrangements, receptors that are non-functional or have
potentially harmful specificities. The process of selection during the maturation of
lymphocytes provides a mechanism of quality control in the generation of lymphocytes,
preventing the maturation of cells bearing a non-functional or potentially harmful receptor.
T cell selection in the thymus comprehends two phases, taking place at the double
positive stage of T cell development: a positive and a negative selection stage (Sebzda,
Mariathasan et al. 1999; Hogquist 2001). During positive selection only the cells that
recognize the self-MHC complex are selected. During negative selection, the cells reacting
strongly to self-MHC complexes are deleted and the cells that do not interact with the self-
MHC complexes die from absence of survival signals.
Page 28
General introduction
8
Lymphocyte selection contributes to the high levels of apoptosis in the thymus (Surh
and Sprent 1994). Notwithstanding the high level of apoptosis, there is a fraction of auto-
reactive T cells that survive the selection process, which are then subject to mechanisms of
peripheral self-tolerance mentioned above.
T cell differentiation continues in the periphery, where T lymphocytes can acquire
different functional phenotypes, such as the Th1 and Th2 cells (O'Garra 1998), memory
cells (Dutton, Bradley et al. 1998), regulatory T cells (CD25+ (Sakaguchi, Fukuma et al.
1985) and others (Modigliani, Coutinho et al. 1996)), Th3 (Fukaura, Kent et al. 1996;
Kitani, Chua et al. 2000) and Tr1 cells (Groux, O'Garra et al. 1997).
The regulation of cell differentiation involves multiple factors, receptors and cells,
which may result in feedforward and/or feedback regulatory loops. Positive feedback loops
amplify perturbations and are characteristic of runaway processes, whereas negative
feedback loops dampen perturbations and thus are characteristic of homeostatic processes.
Cytokines, which are soluble factors that control multiple aspects of lymphocyte
physiology (Staudt and Brown 2000), are one of the main classes of factors mediating such
loops. The interaction between different cytokines and cytokine-secreting cells, which
express at different development stages different subsets of cytokine receptors, and in the
case of lymphocytes also a clone-specific antigen receptor, can conceivably be very
complex and may add to positive and negative feedback or feedforward loops. An example
of a positive feedback loop is the mutually exclusive differentiation of ThP cells to Th2 or
Th1, which is promoted respectively by Th2 and Th1 (Fishman and Perelson 1994;
Carneiro, Stewart et al. 1995; O'Garra 1998; Bergmann, van Hemmen et al. 2002). In this
thesis, we explore novel aspects of the control of Th2-dependent ThP differentiation, which
are somewhat more complex than this simple positive feedback loop.
In spite the heterogeneity of lymphocyte populations, the total number of lymphocytes
seems to be regulated by a homeostatic mechanism. Depletion of peripheral lymphocytes in
normal animals is not permanent. With some exceptions (Mackall, Granger et al. 1993;
Modigliani, Coutinho et al. 1996), lymphocytes tend to return to normal numbers via what
seems like a homeostatic regulatory mechanism, which is still not fully understood
(Tanchot, Rosado et al. 1997; Goldrath and Bevan 1999; Freitas and Rocha 2000; Almeida,
Page 29
General introduction
9
Borghans et al. 2001).
The complexity of the regulation of lymphocyte dynamics at the subpopulation level,
together with the importance of maintaining lymphocyte diversity, diminishes the
importance of classic negative feedback loops, such as the control erythrocyte numbers in
the blood mediated by erythropoietin production in response to O2 partial pressure in the
blood (Muta, Krantz et al. 1994), in the regulation of lymphocyte subpopulations.
The regulation of B and T cell numbers is independent (Kitamura, Roes et al. 1991;
Mombaerts, Clarke et al. 1992; Tanchot, Rosado et al. 1997; Bender, Mitchell et al. 1999)
and within the peripheral T cell compartment, memory and naïve cells are differentially
regulated (Tanchot and Rocha 1995; Goldrath and Bevan 1999).
Although in normal animals the CD4+/CD8+ cell ratio is maintained, in transgenic
animals there is a bias towards either CD8+ or CD4+, but even in these cases the total
population of T cells tends towards normal numbers (Rocha, Dautigny et al. 1989; Tanchot,
Rosado et al. 1997), suggesting that at least one homeostatic mechanism is counting the
total T cell population irrespective of MHC class. This mechanism is commonly referred as
“blind T cell homeostasis” because it does not depend on the MHC class of T cells
(Adleman and Wofsy 1993; Margolick, Munoz et al. 1995; Adleman and Wofsy 1996;
Mehr and Perelson 1997). Although the survival of T cells in the periphery seems to be
blind to the MHC class, it depends on MHC-TCR engagement. There is a correlation
between survival of peripheral lymphocytes and expression of self-MHC ligands (Benoist
and Mathis 1997; Freitas and Rocha 1997; Tanchot, Lemonnier et al. 1997). Conditional
knockouts of MHC class II (Witherden, van Oers et al. 2000) and of the TCRα chain
(Polic, Kunkel et al. 2001) show that in the absence of these molecules the pool of
peripheral T cells decays with time, following apparent first order kinetics, demonstrating
the need for the MHC-TCR interaction for the maintenance of peripheral T cells.
Memory T cells are less dependent on antigenic stimulation and once transferred in
various amounts to T cell deficient mice they expand by self-renewal to about the same
number, independently of the existence and number of naïve T cells (Tanchot and Rocha
1995). Naïve T cell recovery is dependent on thymic output, which indicates that these cells
are incapable or have a limited self-renewal capacity. With the increase in age, thymic
output to the periphery becomes less important (Mackall, Fleisher et al. 1995; Sempowski
and Haynes 2002), which is probably the reason why young animals recover faster from T
cell depletion than older animals (Mackall, Punt et al. 1998; Timm and Thoman 1999).
Page 30
General introduction
10
During homeostatic proliferation of naïve T cells in response to depletion, these cells bear a
partial and transient memory-like phenotype (Goldrath, Bogatzki et al. 2000). Once normal
numbers are restored, these cells regain the characteristic naïve phenotype.
A hypothesis is that homeostasis of T lymphocytes could be explained by competition
for antigenic niches in the periphery (Carneiro, Stewart et al. 1995; De Boer and Perelson
1997; Freitas and Rocha 2000). The mathematical model of De Boer & Perelson (De Boer
and Perelson 1997) presupposes that total T cell numbers expand to a fixed level (a fixed
carrying capacity), which is determined by the level of antigen presentation and the number
of APCs. According to the model, the T cell pool will expand to normal numbers whenever
lymphocytes have a sufficient cross-reactive epitopes and/or if the initial T cell population
is diverse enough (De Boer and Perelson 1997).
In summary, lymphocyte dynamics in the peripheral self-renewing T cell pool seem to
be regulated by mechanisms acting on two levels: a) At the clonal level to regulate the
generation, maintenance and extinction of a particular clone in a particular antigenic niche
(Carneiro, Stewart et al. 1995; De Boer and Perelson 1997; Freitas and Rocha 2000). b) At
the population level (blind T cell homeostasis) to regulate the total number of lymphocytes
(Rocha, Dautigny et al. 1989; Freitas and Rocha 1993; De Boer and Perelson 1997). The
dependence of the sustainability of T cell numbers in the periphery, on the TCR and MHC
(Freitas and Rocha 2000; Witherden, van Oers et al. 2000; Polic, Kunkel et al. 2001)
implies that these two levels of regulation are inter-dependent. How is this inter-
dependence mediated? It seems paradoxical how signalling via the TCR, a receptor
resulting from somatic mutation of gene fragments that can be considered specific of a
clone, mediates both T cell homeostasis and specific T cell activation and proliferation.
One of the proposed hypotheses to solve this problem is that depending on the stregth of
the agonist, T cells can be activated to effectors or engage in homeostatic proliferation
(Evavold, Sloan-Lancaster et al. 1993).
1.3 Signals affecting the life history of T lymphocytes
It is beyond the scope of this introduction to describe all the signals capable of
affecting the life history of lymphocytes. We are interested in lymphocyte homeostasis and
the regulation of lymphocyte differentiation. Hence we concentrate in the two classes of
stimuli which are more relevant for this: TCR and cytokine signalling.
Page 31
General introduction
11
1.3.1 TCR ENGAGEMENT AND TRIGGERING
TCR engagement by the MHC-peptide complex and signalling is an essential process
for T cell activation and immune response (Davis and Bjorkman 1988). The TCR is a
membrane receptor composed of two covalentely bound peptide chains of the
immunoglobulin super family, α-β for the αβTCR and γ-δ for the γδTCR and a non-
covalentely associated CD3 complex. The CD3 complex is commonly composed of six
peptide chains: γ-ε and δ-ε heterodimers, plus either a ζ-ζ homodimer or a ζ-ε heterodimer.
The αβTCR ligand is the MHC class II or class I molecule with a bound agonist
oligopetide (Katz, Hamaoka et al. 1973; Rosenthal and Shevach 1973; Zinkernagel and
Doherty 1974; Davis and Bjorkman 1988; Bennink, Peeters et al. 2001; Siemasko and
Clark 2001), generated through intracellular cleavage of proteins ((Babbitt, Allen et al.
1985; Townsend, Gotch et al. 1985), reviewed in (Bennink, Peeters et al. 2001; Siemasko
and Clark 2001)), and presented at the surface of antigen presenting cells (APCs).
The TCR lacks intracellular signal transduction domains, but the CD3 chains contain
ITAMs (immuno-receptor tyrosine activation motifs) that are phosphorylated upon TCR
engagement by the agonist MHC-peptide ligand (Reth 1989; Letourneur and Klausner
1992; Wegener, Letourneur et al. 1992) or as a consequence of cross-linking with antibody
(for example anti-CD3 antibody). The CD3ζ chains have three ITAM motifs whereas
CD3γ, CD3δ and CD3ε have one ITAM motif each. TCR trigering is the process of ITAM
phosphorylation that leads to downstream TCR signalling events.
The initial sequence of events that lead to ITAM phosphorylation is still not resolved.
Src kinases are known to be involved early in TCR triggering, but it is unknown if src
kinase recruitment to the TCR complex is indeed the first event following TCR engagement
by agonist. The activity of lck, the main src kinase implied in TCR triggering, is regulated
by CD45, a PTP expressed in haematopoietic cells, and T cells deficient in CD45 have
impaired TCR signalling, which suggests that it may have role in the initiation of TCR
triggering (Stone, Conroy et al. 1997). A proposed mechanism for the initiation of TCR
signalling is that CD45 maintains lck in a basal state in a resting T cell, but upon
engagement of the T cell by APC, CD45 is excluded from the TCR complex allowing lck
activation and ITAM phosphorylation (Thomas 1999). Co-receptor molecules CD4 and
CD8 are known to associate with the TCR-MHC-peptide complex, increasing both the
stability of the complex (Luescher, Vivier et al. 1995) and the cellular response to ligand
Page 32
General introduction
12
(Madrenas, Chau et al. 1997). These co-receptors are associated with lck, and it is probably
the complex CD4-lck (or CD8-lck) that is recruited to the TCR-ligand complex and
initiates the triggering process (Chan, Desai et al. 1994; van Oers, Killeen et al. 1996).
CD45 PTP activity on lck seems to target mainly the fraction of lck that is CD4 associated
(Biffen, McMichael-Phillips et al. 1994; Dornan, Sebestyen et al. 2002).
Phosphorylated ITAM domains recruit the Zap70 tyrosine kinase, which is then
activated by lck by phosphorylation of its activator domains (Iwashima, Irving et al. 1994;
Chan, Dalton et al. 1995). Activated Zap70 phosphorylates downstream adapter molecules,
which in turn initiate the different signalling pathways (Mege, Di Bartolo et al. 1996; Qian,
Mollenauer et al. 1996) that lead to the activation of the various responses of T cells to
antigen presentation (Germain and Stefanova 1999; Acuto and Cantrell 2000).
There is some evidence that fyn, a src PTK also expressed in T cells, can
complement, and in some conditions partially replace, lck in TCR triggering (Groves,
Smiley et al. 1996; van Oers, Lowin-Kropf et al. 1996).
The interaction of the TCR with ligand has low affinity compared to the BCR-ligand
interaction (see review (Davis, Boniface et al. 1998)). Considering that T cells are highly
specific for the antigen and respond to very low amounts of ligand presentation (Harding
and Unanue 1990; Valitutti, Muller et al. 1995), this “low affinity” seems paradoxical. To
address this paradox two non-exclusive models were proposed: the kinetic proof reading
model and the serial triggering model.
The kinetic proof reading model (McKeithan 1995) was inspired by the proof reading
mechanism of DNA transcription and replication (Hopfield 1974). The model proposes that
a high level of specificity can be obtained by coupling various intermediate steps in the
signalling pathway, all dependent on the TCR-ligand complex remaining associated. Such a
mechanism is very sensitive to changes in the dissociation rate of the TCR-ligand. High
dissociation rates cause only partial activation, since the complex only remains associated
on average time enough to activate some of the intermediate steps. Low dissociation rates
allow the activation of all the activation steps, thus producing the full response. This model
can explain the sensitivity of TCR triggering to the kinetic properties of the TCR-ligand
binding and proposes a minimum dissociation rate for the TCR-ligand complex capable of
activating the TCR. The ideas behind the kinetic proofreading model have been extended to
downstream signalling events (Germain and Stefanova 1999) and recently the model was
extended also to account for intermediate responses, which are relatively independent on
Page 33
General introduction
13
the kinetics of ligand binding (Hlavacek, Redondo et al. 2001; Liu, Haleem-Smith et al.
2001).
The serial triggering model is based on the observation that a reduced number of
MHC-peptide complexes can down-regulate many TCRs (Valitutti, Muller et al. 1995).
This model proposes that the MHC-ligand complex serially binds, triggers and dissociates
TCRs on the surface of the T cell. This model predicts a strong dependency of the
extension of TCR triggering on the dissociation rates of the TCR-ligand complex (Valitutti
and Lanzavecchia 1997). If the dissociation rate is high, then the TCR-ligand complex does
not associate for time enough for the TCR to be fully triggered. If the TCR-ligand
dissociation rate is low, then the MHC-ligand complexes will be long lasting and the
efficiency of serial TCR engagement and triggering is reduced. There is an optimal
dissociation rate that leads to an optimal yield of triggered TCRs and signal strength.
Both these hypotheses, on the dependency of signalling on the kinetic properties of the
TCR-ligand complex, are substantiated by studies of agonists, partial agonists and
antagonists of TCR, which have established a negative correlation between the TCR-ligand
dissociation constant (koff) and the agonistic properties of the ligand (Sloan-Lancaster and
Allen 1996; Bachmann, Speiser et al. 1998), independent of the TCR ligand association
constant (kon). This correlation supports the hypothesis that partial agonists do not associate
with the TCR complex long enough to allow full TCR triggering, resulting in partial ITAM
phosphorylation and signal transduction (Itoh, Hemmer et al. 1999). TCR antagonists are
able to induce negative signals to the T cell (Kersh, Kersh et al. 1999; Robertson and
Evavold 1999) and/or can merely act as decoy ligands, competing for free non-triggered
TCR (Viola, Linkert et al. 1997).
The stoichiometry of TCR-ligand binding required for the initiation of signal
transduction is controversial. Either the TCR is triggered by a homo cross-linking
mechanism, meaning that dimerization, trimerization or higher order oligomerization of
TCR-ligand are required for triggering; or a single TCR is triggered by a single ligand,
possibly with the collaboration of co-receptors (hetero cross-linking)(Figure 1). The homo
cross-linking models of TCR triggering are supported by the activation of T cells via
αCD3-mediated TCR cross-linking; by structural studies indicating that both TCR and
MHC can form dimers (Brown, Jardetzky et al. 1993; Fields, Ober et al. 1995; Garboczi,
Ghosh et al. 1996); and by several studies of the kinetics of binding (Reich, Boniface et al.
1997; Boniface, Rabinowitz et al. 1998). In favour of a monovalent mechanism of TCR
Page 34
General introduction
14
triggering, both the TCR and its ligand have monovalent binding sites, which is difficult to
conciliate with a homo cross-linking mechanism of TCR triggering similar to BCR. In
addition, there is evidence that a CD8+ T cell can elicit a response by engagement of very
few TCRs (Sykulev, Joo et al. 1996; Delon, Gregoire et al. 1998). Also, at very low ligand
densities (about 100 MHC-peptides seem to be able to activate a T cell (Valitutti, Muller et
al. 1995)) the probability of homo-dimerisation of MHC-peptide would be very low, hence
it is questionable that homo-dimers of MHC-peptide can be formed at physiological antigen
densities (Salzmann and Bachmann 1998). Bachmann et al. (Bachmann, Salzmann et al.
1998; Bachmann and Ohashi 1999) proposed a kinetic model of TCR serial triggering that
suggests the requirement of formation of TCR dimers or trimers for TCR triggering. We
have extended and generalised this model and found that it represents a particular case of
TCR triggering kinetics for high presentation of ligand on the APC (Sousa and Carneiro
2000).
Signalling
A B
APC
T-Cell TCR TCR
CD3 CD3CD3CD3
MHC-peptide MHC-peptide
Lck
CD4
TCR
CD3CD3
MHC-peptide
Lck
CD4
TCR
CD3CD3
MHC-peptide
Figure 1 – Two possible mechanisms of TCR triggering by class II MHC-peptide (also
applicble to Class I). A – TCR triggering by cross-linking of TCR complexes (homo cross-
linking); B – TCR triggering via co-receptor cross-linking (hetero cross-linking).
An additional level of complexity in TCR triggering is added by the immunological
synapse (Monks, Freiberg et al. 1998; Grakoui, Bromley et al. 1999; Anton van der Merwe,
Davis et al. 2000; Bromley, Burack et al. 2001). When the conjugate between a T cell and
an APC is formed, a complex structural re-organisation of membrane components on both
the T cell and APC takes place, forming the immunological synapse. Early on, the adhesion
molecules are mainly located in the centre of the interface with the TCRs forming a ring
outside this central area. As time passes, the TCRs migrate to the centre, exchanging
Page 35
General introduction
15
position with the adhesion molecules. This later stage was described as a “mature synapse”
and occurs in the later stages of the synapse formation (Grakoui, Bromley et al. 1999). All
these events correlate with the agonist strength of the MHC-peptide presented and are
dependent of cytoskeleton. Recently, the contribution of the T cell synapse to TCR
triggering has been questioned by evidence that TCR signalling precedes synapse formation
and maturation (Lee, Holdorf et al. 2002). Moreover, mathematical modelling suggests that
the formation of the synapse is possible simply by passive diffusion of membrane proteins
(Qi, Groves et al. 2001).
Rafts are membrane microdomains enriched in sphingolipids and cholesterol with
intense packing of lipids that are insoluble in non-ionic detergents at low temperatures
(Brown and Rose 1992). Membrane rafts compartmentalise GPI-anchored proteins, some
integral membrane proteins and alipid-cylated, cytosolically oriented, proteins (Srk kinases,
Ras kinases and heterodimeric G proteins). In a resting cell, rafts are enriched in Src
kinases (lck and fyn) (Montixi, Langlet et al. 1998; Xavier, Brennan et al. 1998; Janes, Ley
et al. 1999) and LAT (Zhang, Trible et al. 1998; Janes, Ley et al. 1999). The TCR seems to
be associated with rafts but it is easily labile by detergents (Janes, Ley et al. 1999). Upon
TCR activation by a cross-linking agent, rafts are enriched in phosphorylated CD3ζ. The
coalescence of rafts is enough to invoke signalling events mimicking TCR αCD3 cross-
linking (Janes, Ley et al. 1999; Valensin, Paccani et al. 2002).
The contribution of rafts, the immune synapse and diffusion for TCR triggering
involves modelling the spatial component of TCR engagement and triggering (see for
example (Salzmann and Bachmann 1998; Chan, George et al. 2001; Favier, Burroughs et
al. 2001; Wofsy, Coombs et al. 2001)), which was beyond the scope of this thesis, but
constitutes one of the possible extensions to the models presented here.
T cell activation is sensitive, among other factors, to the levels of TCR expressed in
the T cell (Viola and Lanzavecchia 1996). One of the responses of TCR engagement and
triggering is the down-modulation of the TCR by internalisation (Valitutti, Dessing et al.
1995). The internalised TCR is targeted to the lysosomal compartments for destruction
(Lauritsen, Christensen et al. 1998). TCR internalisation is dependent, among other factors,
on TCR engagement and therefore might depend on early events involved in TCR
triggering. Internalisation of the TCR and targeting to the lysossomes seems to be
dependent on Src kinases (D'Oro, Vacchio et al. 1997; Lauritsen, Christensen et al. 1998),
although there is some controversy regarding this observation (Cai, Kishimoto et al. 1997;
Page 36
General introduction
16
Salio, Valitutti et al. 1997). Another pathway of TCR internalisation is, at least to some
degree, PKC-dependent and leads the TCR to an internal pool where it can recycle back to
the membrane (Lauritsen, Christensen et al. 1998; Dietrich, Menne et al. 2002). The
recycling of TCR from the cytoplasmatic pool to the membrane is mediated by PKC
phosphorylation of specific residues in a leucine-based internalisation motif in the CD3γ
chain (Dietrich, Hou et al. 1994) and is important for cytokine-mediated fine-tuning of
TCR expression (Dietrich, Hou et al. 1994; Weiss and Littman 1994; Lauritsen,
Christensen et al. 1998). PKC-mediated TCR recycling does not seem to interfere with
ligand-mediated internalisation and degradation of TCRs (Salio, Valitutti et al. 1997;
Lauritsen, Christensen et al. 1998; Dietrich, Menne et al. 2002).
TCR down-modulation was used to study the kinetics of TCR engagement and T cell
responsiveness to very low ligand presentations (Valitutti, Muller et al. 1995). In this thesis,
these kinetic studies were used to gain additional insight into the mechanism of TCR
triggering and down-modulation with the aid of mathematical models. The objective is to
identify the properties of TCR triggering that will be relevant for lymphocyte physiology
and population dynamics. The models presented here for TCR triggering and down-
modulation, capture the main properties of TCR triggering and should be considered as the
first step stones towards more general and complete models of TCR engagement and
triggering.
1.3.2 CYTOKINE RECEPTOR ENGAGEMENT
If TCR engagement is the hallmark of T cell activation stimuli, the ligation of cytokine
receptors is key to the regulation of lymphocyte differentiation, proliferation and death.
Cytokines are soluble growth and differentiation factors acting in the cells of the immune
system (Kishimoto, Taga et al. 1994; Paul and Seder 1994; Schindler and Darnell 1995;
Decker and Meinke 1997).
The expression of the various cytokine receptors varies considerably during the life
span of the cells (Swain, Bradley et al. 1991; Kishimoto, Taga et al. 1994; Paul and Seder
1994; Schindler and Darnell 1995; Decker and Meinke 1997; Di Santo, Radtke et al. 2000;
Murphy, Ouyang et al. 2000). Changes in the quantity and type of cytokine receptors
usually reflect changes in cell physiology resulting from differentiation and or activation.
Cytokine receptors are multimeric transmembrane proteins compromising either two
or three receptor chains, which can be divided in two major classes (Schindler and Darnell
Page 37
General introduction
17
1995): Class I cytokine receptors includes the receptors for IL-2, IL-3, IL-4, IL-5, IL-6, IL-
7, IL-9, IL-11, IL-12, IL-15, Epo, PRL, GH, G-CSF, GM-CSF, LIF, CNTF. These
receptors share a cytosine-binding domain with a conserved WSXWS motif. Class II
cytokine receptors include the receptors for IL-10, IFN-α and IFN-β and, compared with
class I cytokine receptors; they are a more heterogeneous group from the structural point of
view. These receptor classes can be further divided into families according to structural
homology and to the receptor chains these receptors have in common.
Cytokine receptor activation requires cytokine-mediated engagement of receptor
chains and the consequent cross-linking and activation of protein tyrosine kinases. The
paradigm for cytokine receptor activation and signal transduction by the Jak-STAT
pathway was established for the IFN system (Darnell, Kerr et al. 1994; Schindler and
Darnell 1995). Jak-STAT signalling is initiated by the ligand-mediated cross-linking of the
cytokine receptor chains. Cross-linking of the receptor chains bearing intracellular Jak
kinase binding and phosphorylation domains is a sufficient condition for the onset of
receptor activation (Shuai, Ziemiecki et al. 1993; Lutticken, Wegenka et al. 1994; Stahl,
Boulton et al. 1994). More domains are present at the cytoplasmatic portions of the
receptors, which are used to initiate other signalling pathways (for example IL-2
(Sugamura, Asao et al. 1996; Gesbert, Delespine-Carmagnat et al. 1998) and IL-4 (Nelms,
Keegan et al. 1999)).
All cytokines rely on four Jak kinases and less than a dozen STAT proteins to regulate
gene transcription (Paul and Seder 1994; Schindler and Darnell 1995; Decker and Meinke
1997; Kisseleva, Bhattacharya et al. 2002). The specificity of the pathway results in the
combination of different signalling intermediates, on temporal expression of subsets of
cytokine receptors and on the kinetics of nuclear translocation. With such degree of
overlapping of signalling intermediates and receptor chains, it is not surprising that
cytokines have a high degree of functional redundancy, especially between members of the
same receptor family.
Some of the open questions in cytokine signalling are to what degree is a given
cytokine essential to a cell? Can it be compensated by other cytokines? How cytokine
signal pathways, which share signalling components, interact?
The answers to these questions might be achievable using mathematical models when
the pathways of cytokine signalling have been better described. At present there is only a
description of which STAT proteins are activated following receptor activation. Little is
Page 38
General introduction
18
known about the preferred stoichiometry of their dimerisation and the priority of nuclear
translocation (Zhang, Blenis et al. 1995). There is only incomplete data about the gene
products of the CIS family of genes that are activated early on cytokine-activated gene
expression and whose products inhibit cytokine signalling (Endo, Masuhara et al. 1997;
Naka, Narazaki et al. 1997; Starr, Willson et al. 1997). These gene products depend on
early events of STAT-activated gene expression and constitute a negative feedback loop on
cytokine signalling (Matsumoto, Masuhara et al. 1997). Cytokine receptor trafficking in the
cell membrane, in the presence or absence of ligand, is still not fully understood. There is
evidence that cytokine receptors are down regulated and degraded following activation by
cytokine engagement, but the quantitative data on receptor chain turnover is difficult to
analyse since it usually relies in radioactive markers, which lump several cellular
compartments in the same kinetics (for example (Duprez and Dautry-Varsat 1986;
Weissman, Harford et al. 1986; Gullberg 1987; Duprez, Ferrer et al. 1992; Ferrer, Hemar et
al. 1993; Hemar, Subtil et al. 1995; Subtil, Delepierre et al. 1997; Morelon and Dautry-
Varsat 1998; Friedrich, Kammer et al. 1999)).
In this thesis we approach the question of interference between cytokine receptors
sharing common signal transduction chains. To acomplish this, we study a prototypic
model of the interference between the IL-2 and IL-4 receptors (IL-2R and IL-4R) mediated
by the common gamma chain (γc), which is a signal transducing receptor chain shared
between the members of the common gamma chain cytokine receptor family. Using a
simple model, we also infer the possible implications of such interference at the level of
lymphocyte population dynamics. In this study, we explore a prototypic system of
differentiation of ThP to Th2, two T cell phenotypes with distinct cytokine receptor
expression profiles, as an example system of cytokine receptor interference via common
receptor chains.
1.4 The immune system ranges multiple organisation levels
With the clonal selection theory and the discovery of process of somatic rearrangement
of immunoglobulin genes (Brack, Hirama et al. 1978), the focus of interest in Immunology
shifted from antibody chemistry and serology to the molecular biology and biochemistry of
the antibody producing cells and related cells. Some of the emergent questions were: What
are the necessary and the sufficient conditions for lymphocyte activation that will lead to an
immune response? What are the factors and processes regulating this response? What is the
Page 39
General introduction
19
relationship and orchestration between cell biochemistry and immunity? The application of
molecular biology in Immunology has been fruitful in addressing, at least partially, these
questions by the mapping of the cell receptors and signalling pathway and by the study of
gene expression of the cells of the immune system.
The most severe limitation of the molecular approach to the study of Immunology is
the necessity of reductionism, with inherent simplifications such as assuming some degree
of independence of cells and clones, the assumption of constant conditions and the neglect
of indirectly pertinent factors.
Immunity is a phenomenon that bridges several levels of biological organisation, from
the basic molecular aspects, spawning beyond single cells to cell population dynamics, to
organ interactions and to organisms and their intractions. Four levels of organisation are
apparent: cellular and sub-cellular, cell population, organism and population of organisms.
The cellular and sub-cellular organisation level comprehends the single cell events
such as receptor activation, regulation of gene expression, signal transduction and cellular
differentiation. These events can be divided into two categories: fast and slow events. Fast
events are the signal transduction events that usually imply covalent and/or conformational
modification of proteins, which propagate throughout the signalling networks of cells.
These events occur generally in less than hours or days. The slow events comprehend the
de novo expression of proteins, which can either reinforce an already existing pool of
proteins or create a new pool, which can lead to a quantitative and/or qualitative change in
the cellular signal transduction network. These slow events compromise the expression of
new molecules and the differentiation of the cell and require, in general, more than hours or
days to take effect. Fast events usually produce functional quantitative modifications in the
cell, whilst slow events may result in functional qualitative modifications, which when
irreversible denote differentiation. Separating the fast and slow processes is, to some extent,
an artificial separation since these processes are inter-dependent.
The cell population events deal with the time evolution of populations of cells and the
interactions between cells, of the same or different type. Processes falling into this category
are the immune response, the regulation of the class of immune response the regulation of
lymphocyte differentiation, the germinal centre reaction, immune suppression and thymic
selection. Considering that each cell can be in a particular, almost unique, state defined by
the particular conditions it has encountered during it's life span, it might be misleading to
simply extrapolate the properties of a single cell, as enumerated by molecular biology, to
Page 40
General introduction
20
the properties of a population of cells. At this level, the study of the distributions of cells
and the interactions between cells is fundamental. Changes at the cell population level may
or may not reflect events occurring in the time scale of fast and slow cellular processes.
The immune system is a group of organs functionally distinct that are integrated in the
organism. Cell differentiation, selection and death, all take place at distinct specialised
locations in the body. Hence cell population dynamics becomes a problem with spatial-
oriented components. Processes like lymphocyte development and infiltration have an
important spatial component (Rossi and Zlotnik 2000). Moreover, depending on the
location of a challenge, the immune system responds differently to the same antigen
(Carvalho and Vaz 1996; Melo, Goldschmidt et al. 1996; Vaz, Faria et al. 1997). Another
problem within this organisational scope is the homeostasis of the cells of the immune
system. Very little is known about the mechanisms that regulate some pools of
lymphocytes independently and others inter-dependently. Some competition for spatial
and/or antigenic niches (Carneiro, Stewart et al. 1995; De Boer and Perelson 1997; Freitas
and Rocha 1997; Freitas and Rocha 2000) seems to be implied, but the problem is
somewhat more complex, involving the interaction between the primary and secondary
lymphoid organs. Another problem is the generation and maintenance of memory. The
generation of memory cells might be a single cell or a population level problem, but the
maintenance of memory cells should share regulatory components with the homeostasis of
the whole lymphocyte population.
At the organism level, the interactions with the environment and with other organisms
also have have consequences for immunity. Epidimiology studies the incidence of diseases
at the population level, using echology, sociology and population dynamics.
Due to the power of the techniques of molecular biology and their success in
Immunology, most of the attention of immunologists is directed towards sub-cellular and
cellular processes, which provides a limited, prominently reductionist view of immunity.
Moreover, this view is often biased by the choice of conditions that are not entirely
representative of the natural state of the organism, leading to a distorted notion of the
relevance of the object of study. Hence, simple extrapolation of molecular single cell events
to population dynamics and immunity is not trivial; the conceptual gaps between
organisational levels and the difficulties in linking and assessing the strength of their
interactions may lead to paradoxical conclusions. Perhaps the most illustrative cases are
some unexpected results from gene knockouts in mice. For example, IL-2 is an important
Page 41
General introduction
21
growth factor for lymphocytes, but IL-2 deficient animals still have lymphocyte
development and, what is striking, develop fatal immune pathology disease (Kneitz,
Herrmann et al. 1995). IL-2R-beta deficient produces a phenotype characterised by massive
lymphocyte activation, leading to death at 12 weeks of age (Suzuki, Kundig et al. 1995).
Another example is that the IL-4 and the Th2 bias in Balb/c mice does not seem to
influence the susceptibility to Leishmania major infection in those mice, as shown by IL-4
deficient Balb/c mice (Noben-Trauth, Kropf et al. 1996).
1.5 This thesis.
In this thesis, some of the interfaces separating different organisation levels in the
immune system are explored using mathematical modelling. We concentrate in what are the
main processes that determine the life history of a lymphocyte, namely cytokine and TCR
signalling. We aim to model these signalling events at a single cell level and extend these
models to the population level. The TCR is the hallmark of T cell activation (Davis and
Bjorkman 1988). It is essential for T cell development, survival, proliferation,
differentiation and the onset of effector functions (Davis and Bjorkman 1988; Germain and
Stefanova 1999). Cytokines not only influence T cell activation but also play an essential
role regulating the development, survival, proliferation and differentiation of the cells. For
simplicity, we restrict to CD4+ T cells.
This thesis is divided in four major parts:
1. Sharing cytokine receptor chains and their implications;
2. Mathematical analysis of TCR triggering;
3. Adaptable activation thresholds and lymphocyte homeostasis.
4. General discussion.
1.5.1 SHARING CYTOKINE RECEPTOR CHAINS AND THEIR IMPLICATIONS
In this part of the thesis we asked what are the functional consequences of cytokines
sharing a common receptor chain. To address this question, we used the prototypic system
of IL-2 and IL-4 receptor engagement and signalling. These two cytokines of the γc family
have been the target of intense study and although the available experimental data is still
missing some kinetic and quantitative aspects, it is nevertheless sufficient to construct and
study a model of cytokine receptor engagement that has biological relevance.
This model is divided in two parts: The first part deals with cytokine receptor binding
Page 42
General introduction
22
and the impact of sharing cytokine receptor chains in cytokine signalling. Our modelling
reached two conclusions: that at physiological or near physiological membrane densities of
cytokine receptor chains, γc is limiting for IL-2 and IL-4 signalling, and that the γc-
mediated interference between IL-2R and IL-4R is asymmetrical. IL-4R signalling is much
more sensitive to IL-2R engagement than IL-2R signalling is to IL-4R engagement.
The second part of the model addresses the possible impact of IL-2R and IL-4R
sharing γc on the dynamics of ThP differentiation to Th2. ThP depends on IL-2 for
proliferation and on IL-4 for differentiation into Th2. Our model shows that the apparent
non-competitive inhibition of IL-4 signalling by IL-2, together with the autocrine loop of
IL-2 production by ThP can explain the observed synergistic effect of IL-2 and IL-4 in Th2
differentiation. Moreover, this model illustrates how the balance between proliferation and
differentiation via autocrine loops can prevent positive feedback loops of differentiation
from depleting precursor cells.
1.5.2 MATHEMATICAL ANALYSIS OF TCR TRIGGERING.
In this part we try to answer what are the key mechanistic features of TCR engagement
and triggering by agonist MHC-peptide. This part is divided in four sections: The first
section builds a phenomenological model of TCR engagement, triggering and
internalisation by MHC-peptide using the available kinetic data on TCR down-modulation.
This model allowed us to identify the following key kinetic properties of TCR engagement,
triggering and internalisation: 1) The importance of basal TCR turnover on the membrane;
2) The existence of accumulated triggered TCRs in the surface of the T cell; 3) The
requirement for hypersensitivity in TCR triggering, which may reflect a complex reaction
process; and 4) The existence of two pools of TCR to explain the biphasic properties of the
kinetics of TCR down-modulation.
The second section takes from the phenomenological model and compares two TCR
triggering mechanisms for their ability to reproduce the high cooperativity of TCR
triggering. The two mechanisms are a generic TCR homo cross-linking model and a TCR-
CD4 cross-linking model inspired on the hypersensitive Koshland-Goldbeter mechanism.
The results of this comparison show that TCR homo cross-linking mechanisms are better at
high doses of ligand than at low doses of ligand, whereas the CD4-TCR cross-linking is
very efficient at low doses of ligand. We hypothesise that both mechanisms could be
possible at high doses of ligand, but that at low doses of ligand CD4-TCR cross-linking
Page 43
General introduction
23
should be the prominent triggering mechanism.
The third part of this section discusses the adaptation of activation thresholds of TCR
triggering and down modulation via the regulation of TCR membrane density. This part
demonstrates that TCR down modulation give the T cell an adaptable activation threshold.
The fourth part discusses the experimental setting being started to assess the
stoichiometry of TCR triggering based on the models we developed. The experimental part
is still being developed as a separate project, hence this section relates to a work in
progress.
1.5.3 ADAPTABLE ACTIVATION THRESHOLDS AND LYMPHOCYTE HOMEOSTASIS.
Tuning of activation thresholds in lymphocytes has been implied in several processes,
namely the induction of anergy and tolerance and the selection of lymphocytes (Grossman
and Paul 1992; Grossman and Paul 2000; Grossman and Paul 2001). The regulation of TCR
expression and down-modulation in T cells displays adaptation properties ((Viola and
Lanzavecchia 1996) and this thesis). Adaptation of activator signaling pathways can be
important for lymphocyte function and proliferation; hence it can have important
implications at the cell population level. In this part we asked what is the contribution of
adaptation of the TCR signal transduction pathway to the population dynamics of
lymphocytes.
We build a generic model of a adaptable lymphocyte that reproduces the qualitative
properties outlined by Grossman and colleagues, based in a minimalist TCR signal
transduction pathway. We then build a population dynamics model of adaptable
lymphocytes, which we discuss in the light of lymphocyte homeostasis in the periphery.
The results of the model suggest that AAT of lymphocytes provide a mechanism of
peripheral tolerance based in the deletion of self-reactive adapted cells. Only when the cell
numbers are brought up, possibly by external factors, are these cells able to persist in the
periphery. In the absence of those factors, the persistence of self-reactive cells is only
possible if these cells are not adapted or if there is a constant source of non-adapted cells to
the periphery.
1.5.4 GENERAL DISCUSSION
In this final part of the thesis, the results and discussions of the previous sections are
revisited and, when appropriate, reexamined under the light of new findings.
Page 44
General introduction
24
Modeling the integration between cytokine and TCR signaling pathways at the cellular
and cell population level is an ambitious goal, beyond the temporal scope of this thesis.
Starting with the work here present, this goal is now closer to be attained; hence in this final
part of the thesis, we discuss some of the possible paths and problems towards such an
integrative model.
1.6 Bibliography Acuto, O. and D. Cantrell (2000). “T cell activation and the cytoskeleton.” Annu Rev Immunol 18:
165-84.
Adleman, L. M. and D. Wofsy (1993). “T-cell homeostasis: implications in HIV infection.” J
Acquir Immune Defic Syndr 6(2): 144-52.
Adleman, L. M. and D. Wofsy (1996). “Blind T-cell homeostasis in CD4-deficient mice.” J Acquir
Immune Defic Syndr Hum Retrovirol 11(4): 334-40.
Almeida, A. R., J. A. Borghans, et al. (2001). “T cell homeostasis: thymus regeneration and
peripheral T cell restoration in mice with a reduced fraction of competent precursors.” J Exp
Med 194(5): 591-9.
Anton van der Merwe, P., S. J. Davis, et al. (2000). “Cytoskeletal polarization and redistribution of
cell-surface molecules during T cell antigen recognition.” Semin Immunol 12(1): 5-21.
Avrameas, S. (1991). “Natural autoantibodies: from 'horror autotoxicus' to 'gnothi seauton'.”
Immunol Today 12(5): 154-9.
Babbitt, B. P., P. M. Allen, et al. (1985). “Binding of immunogenic peptides to Ia histocompatibility
molecules.” Nature 317(6035): 359-61.
Bachmann, M. F. and P. S. Ohashi (1999). “The role of T-cell receptor dimerization in T-cell
activation.” Immunol Today 20(12): 568-576.
Bachmann, M. F., M. Salzmann, et al. (1998). “Formation of TCR dimers/trimers as a crucial step
for T cell activation.” Eur J Immunol 28(8): 2571-9.
Bachmann, M. F., D. E. Speiser, et al. (1998). “Inhibition of TCR triggering by a spectrum of
altered peptide ligands suggests the mechanism for TCR antagonism.” Eur J Immunol 28(10):
3110-9.
Bandeira, A., J. Mengel, et al. (1991). “Proliferative T cell anergy to MIs-1a does not correlate with
in vivo tolerance.” Int Immunol 3(9): 923-31.
Bank, I., R. A. DePinho, et al. (1986). “A functional T3 molecule associated with a novel
heterodimer on the surface of immature human thymocytes.” Nature 322(6075): 179-81.
Bender, J., T. Mitchell, et al. (1999). “CD4+ T cell division in irradiated mice requires peptides
distinct from those responsible for thymic selection.” J Exp Med 190(3): 367-74.
Page 45
General introduction
25
Bennink, R., M. Peeters, et al. (2001). “Tc-99m HMPAO white blood cell scintigraphy in the
assessment of the extent and severity of an acute exacerbation of ulcerative colitis.” Clin Nucl
Med 26(2): 99-104.
Benoist, C. and D. Mathis (1997). “Selection for survival?” Science 276(5321): 2000-1.
Bergmann, C., J. L. van Hemmen, et al. (2002). “How instruction and feedback can select the
appropriate T helper response.” Bull Math Biol 64(3): 425-46.
Biffen, M., D. McMichael-Phillips, et al. (1994). “The CD45 tyrosine phosphatase regulates
specific pools of antigen receptor-associated p59fyn and CD4-associated p56lck tyrosine in
human T-cells.” Embo J 13(8): 1920-9.
Boniface, J. J., J. D. Rabinowitz, et al. (1998). “Initiation of signal transduction through the T cell
receptor requires the multivalent engagement of peptide/MHC ligands.” Immunity 9(4): 459-
66.
Brack, C., M. Hirama, et al. (1978). “A complete immunoglobulin gene is created by somatic
recombination.” Cell 15(1): 1-14.
Bretscher, P. A. and M. Cohn (1968). “Minimal model for the mechanism of antibody induction and
paralysis by antigen.” Nature 220(166): 444-8.
Bromley, S. K., W. R. Burack, et al. (2001). “The immunological synapse.” Annu Rev Immunol 19:
375-96.
Brown, D. A. and J. K. Rose (1992). “Sorting of GPI-anchored proteins to glycolipid-enriched
membrane subdomains during transport to the apical cell surface.” Cell 68(3): 533-44.
Brown, J. H., T. S. Jardetzky, et al. (1993). “Three-dimensional structure of the human class II
histocompatibility antigen HLA-DR1.” Nature 364(6432): 33-9.
Burnet, F. (1957). “A modification of Jerne’s theory of antibody production using the concept of
clonal selection.” Aust J Sci 20: 67–69.
Cai, Z., H. Kishimoto, et al. (1997). “Requirements for peptide-induced T cell receptor
downregulation on naive CD8+ T cells.” J Exp Med 185(4): 641-51.
Carneiro, J., J. Stewart, et al. (1995). “The ontogeny of class-regulation of CD4+ T lymphocyte
populations.” Int Immunol 7(8): 1265-77.
Carvalho, C. R. and N. M. Vaz (1996). “Indirect effects are independent of the way of tolerance
induction.” Scand J Immunol 43(6): 613-8.
Chan, A. C., M. Dalton, et al. (1995). “Activation of ZAP-70 kinase activity by phosphorylation of
tyrosine 493 is required for lymphocyte antigen receptor function.” Embo J 14(11): 2499-508.
Chan, A. C., D. M. Desai, et al. (1994). “The role of protein tyrosine kinases and protein tyrosine
phosphatases in T cell antigen receptor signal transduction.” Annu Rev Immunol 12: 555-92.
Chan, C., A. J. George, et al. (2001). “Cooperative enhancement of specificity in a lattice of T cell
receptors.” Proc Natl Acad Sci U S A 98(10): 5758-63.
Page 46
General introduction
26
Chien, Y. H., R. Jores, et al. (1996). “Recognition by gamma/delta T cells.” Annu Rev Immunol 14:
511-32.
Cunningham, A. J. and K. J. Lafferty (1977). “A simple, conservative explanation of the H-2
restriction of interactions between lymphocytes.” Scand J Immunol 6(1-2): 1-6.
Darnell, J. E., Jr., I. M. Kerr, et al. (1994). “Jak-STAT pathways and transcriptional activation in
response to IFNs and other extracellular signaling proteins.” Science 264(5164): 1415-21.
Davis, M. M. and P. J. Bjorkman (1988). “T-cell antigen receptor genes and T-cell recognition.”
Nature 334(6181): 395-402.
Davis, M. M., J. J. Boniface, et al. (1998). “Ligand recognition by alpha beta T cell receptors.”
Annu Rev Immunol 16: 523-44.
De Boer, R. J. and A. S. Perelson (1997). “Competitive control of the self-renewing T cell
repertoire.” Int Immunol 9(5): 779-90.
Decker, T. and A. Meinke (1997). “Jaks, Stats and the immune system.” Immunobiology 198(1-3):
99-111.
Delon, J., C. Gregoire, et al. (1998). “CD8 expression allows T cell signaling by monomeric
peptide-MHC complexes.” Immunity 9(4): 467-73.
Di Santo, J. P., F. Radtke, et al. (2000). “To be or not to be a pro-T?” Curr Opin Immunol 12(2):
159-65.
Dietrich, J., X. Hou, et al. (1994). “CD3 gamma contains a phosphoserine-dependent di-leucine
motif involved in down-regulation of the T cell receptor.” Embo J 13(9): 2156-66.
Dietrich, J., C. Menne, et al. (2002). “Ligand-induced TCR down-regulation is not dependent on
constitutive TCR cycling.” J Immunol 168(11): 5434-40.
Dornan, S., Z. Sebestyen, et al. (2002). “Differential association of CD45 isoforms with CD4 and
CD8 regulates the actions of specific pools of p56lck tyrosine kinase in T cell antigen receptor
signal transduction.” J Biol Chem 277(3): 1912-8.
D'Oro, U., M. S. Vacchio, et al. (1997). “Activation of the Lck tyrosine kinase targets cell surface T
cell antigen receptors for lysosomal degradation.” Immunity 7(5): 619-28.
Duprez, V. and A. Dautry-Varsat (1986). “Receptor-mediated endocytosis of interleukin 2 in a
human tumor T cell line. Degradation of interleukin 2 and evidence for the absence of
recycling of interleukin receptors.” J Biol Chem 261(33): 15450-4.
Duprez, V., M. Ferrer, et al. (1992). “High-affinity interleukin 2 receptor alpha and beta chains are
internalized and remain associated inside the cells after interleukin 2 endocytosis.” J Biol
Chem 267(26): 18639-43.
Dutton, R. W., L. M. Bradley, et al. (1998). “T cell memory.” Annu Rev Immunol 16: 201-23.
Endo, T. A., M. Masuhara, et al. (1997). “A new protein containing an SH2 domain that inhibits
JAK kinases.” Nature 387(6636): 921-4.
Page 47
General introduction
27
Evavold, B. D., J. Sloan-Lancaster, et al. (1993). “Tickling the TCR: selective T-cell functions
stimulated by altered peptide ligands.” Immunol Today 14(12): 602-9.
Favier, B., N. J. Burroughs, et al. (2001). “TCR dynamics on the surface of living T cells.” Int
Immunol 13(12): 1525-32.
Ferrer, M., A. Hemar, et al. (1993). “Both the alpha and beta chains of high-affinity interleukin 2
receptors are located in intracellular vesicles when their ligand is endocytosed.” Eur J Cell
Biol 60(2): 276-82.
Fields, B. A., B. Ober, et al. (1995). “Crystal structure of the V alpha domain of a T cell antigen
receptor.” Science 270(5243): 1821-4.
Fishman, M. A. and A. S. Perelson (1994). “Th1/Th2 cross regulation.” J Theor Biol 170(1): 25-56.
Fowell, D., A. J. McKnight, et al. (1991). “Subsets of CD4+ T cells and their roles in the induction
and prevention of autoimmunity.” Immunol Rev 123: 37-64.
Freitas, A. A. and B. Rocha (1997). “Lymphocyte survival: a red queen hypothesis.” Science
277(5334): 1950.
Freitas, A. A. and B. Rocha (2000). “Population biology of lymphocytes: the flight for survival.”
Annu Rev Immunol 18: 83-111.
Freitas, A. A. and B. B. Rocha (1993). “Lymphocyte lifespans: homeostasis, selection and
competition.” Immunol Today 14(1): 25-9.
Friedrich, K., W. Kammer, et al. (1999). “The two subunits of the interleukin-4 receptor mediate
independent and distinct patterns of ligand endocytosis.” Eur J Biochem 265(1): 457-65.
Fugmann, S. D., A. I. Lee, et al. (2000). “The RAG proteins and V(D)J recombination: complexes,
ends, and transposition.” Annu Rev Immunol 18: 495-527.
Fukaura, H., S. C. Kent, et al. (1996). “Induction of circulating myelin basic protein and proteolipid
protein- specific transforming growth factor-beta1-secreting Th3 T cells by oral administration
of myelin in multiple sclerosis patients.” J Clin Invest 98(1): 70-7.
Garboczi, D. N., P. Ghosh, et al. (1996). “Structure of the complex between human T-cell receptor,
viral peptide and HLA-A2.” Nature 384(6605): 134-41.
Germain, R. N. and I. Stefanova (1999). “The dynamics of T cell receptor signaling: complex
orchestration and the key roles of tempo and cooperation.” Annu Rev Immunol 17: 467-522.
Gesbert, F., M. Delespine-Carmagnat, et al. (1998). “Recent advances in the understanding of
interleukin-2 signal transduction.” J Clin Immunol 18(5): 307-20.
Goldrath, A. W. and M. J. Bevan (1999). “Selecting and maintaining a diverse T-cell repertoire.”
Nature 402(6759): 255-62.
Goldrath, A. W., L. Y. Bogatzki, et al. (2000). “Naive T cells transiently acquire a memory-like
phenotype during homeostasis-driven proliferation.” J Exp Med 192(4): 557-64.
Page 48
General introduction
28
Grakoui, A., S. K. Bromley, et al. (1999). “The immunological synapse: a molecular machine
controlling T cell activation.” Science 285(5425): 221-7.
Grossman, Z. and W. E. Paul (1992). “Adaptive cellular interactions in the immune system: the
tunable activation threshold and the significance of subthreshold responses.” Proc Natl Acad
Sci U S A 89(21): 10365-9.
Grossman, Z. and W. E. Paul (2000). “Self-tolerance: context dependent tuning of T cell antigen
recognition.” Semin Immunol 12(3): 197-203; discussion 257-344.
Grossman, Z. and W. E. Paul (2001). “Autoreactivity, dynamic tuning and selectivity.” Curr Opin
Immunol 13(6): 687-98.
Groux, H., A. O'Garra, et al. (1997). “A CD4+ T-cell subset inhibits antigen-specific T-cell
responses and prevents colitis.” Nature 389(6652): 737-42.
Groves, T., P. Smiley, et al. (1996). “Fyn can partially substitute for Lck in T lymphocyte
development.” Immunity 5(5): 417-28.
Gullberg, M. (1987). “Analysis of dynamics and functions of high-affinity interleukin-2 receptors.”
Mol Immunol 24(12): 1365-71.
Harding, C. V. and E. R. Unanue (1990). “Quantitation of antigen-presenting cell MHC class
II/peptide complexes necessary for T-cell stimulation.” Nature 346(6284): 574-6.
Hardy, R. R. and K. Hayakawa (2001). “B cell development pathways.” Annu Rev Immunol 19:
595-621.
Hayday, A. C. (2000). “[gamma][delta] cells: a right time and a right place for a conserved third
way of protection.” Annu Rev Immunol 18: 975-1026.
Hemar, A., A. Subtil, et al. (1995). “Endocytosis of interleukin 2 receptors in human T
lymphocytes: distinct intracellular localization and fate of the receptor alpha, beta, and gamma
chains.” J Cell Biol 129(1): 55-64.
Henderson, A. and K. Calame (1998). “Transcriptional regulation during B cell development.”
Annu Rev Immunol 16: 163-200.
Hlavacek, W. S., A. Redondo, et al. (2001). “Kinetic proofreading models for cell signaling predict
ways to escape kinetic proofreading.” Proc Natl Acad Sci U S A 98(13): 7295-300.
Hogquist, K. A. (2001). “Signal strength in thymic selection and lineage commitment.” Curr Opin
Immunol 13(2): 225-31.
Hopfield, J. J. (1974). “Kinetic proofreading: a new mechanism for reducing errors in biosynthetic
processes requiring high specificity.” Proc Natl Acad Sci U S A 71(10): 4135-9.
Itoh, Y., B. Hemmer, et al. (1999). “Serial TCR engagement and down-modulation by
peptide:MHC molecule ligands: relationship to the quality of individual TCR signaling
events.” J Immunol 162(4): 2073-80. frame.html.
Page 49
General introduction
29
Iwashima, M., B. A. Irving, et al. (1994). “Sequential interactions of the TCR with two distinct
cytoplasmic tyrosine kinases.” Science 263(5150): 1136-9.
Jacobs, H. and L. Bross (2001). “Towards an understanding of somatic hypermutation.” Curr Opin
Immunol 13(2): 208-18.
Janes, P. W., S. C. Ley, et al. (1999). “Aggregation of lipid rafts accompanies signaling via the T
cell antigen receptor.” J Cell Biol 147(2): 447-61.
Katz, D. H., T. Hamaoka, et al. (1973). “Cell interactions between histoincompatible T and B
lymphocytes. II. Failure of physiologic cooperative interactions between T and B lymphocytes
from allogeneic donor strains in humoral response to hapten- protein conjugates.” J Exp Med
137(6): 1405-18.
Kersh, E. N., G. J. Kersh, et al. (1999). “Partially phosphorylated T cell receptor zeta molecules can
inhibit T cell activation.” J Exp Med 190(11): 1627-36.
Kishimoto, T., T. Taga, et al. (1994). “Cytokine signal transduction.” Cell 76(2): 253-62.
Kisseleva, T., S. Bhattacharya, et al. (2002). “Signaling through the JAK/STAT pathway, recent
advances and future challenges.” Gene 285(1-2): 1-24.
Kitamura, D., J. Roes, et al. (1991). “A B cell-deficient mouse by targeted disruption of the
membrane exon of the immunoglobulin mu chain gene.” Nature 350(6317): 423-6.
Kitani, A., K. Chua, et al. (2000). “Activated self-MHC-reactive T cells have the cytokine
phenotype of Th3/T regulatory cell 1 T cells.” J Immunol 165(2): 691-702.
Kneitz, B., T. Herrmann, et al. (1995). “Normal clonal expansion but impaired Fas-mediated cell
death and anergy induction in interleukin-2-deficient mice.” Eur J Immunol 25(9): 2572-7.
Kondo, M., I. L. Weissman, et al. (1997). “Identification of clonogenic common lymphoid
progenitors in mouse bone marrow.” Cell 91(5): 661-72.
Kuo, C. T. and J. M. Leiden (1999). “Transcriptional regulation of T lymphocyte development and
function.” Annu Rev Immunol 17: 149-87.
Langman, R. E. and M. Cohn (1996). “A short history of time and space in immune
discrimination.” Scand J Immunol 44(6): 544-8.
Lauritsen, J. P., M. D. Christensen, et al. (1998). “Two distinct pathways exist for down-regulation
of the TCR.” J Immunol 161(1): 260-7.
Lederberg, J. (1958). “Genes and Antibodies.” Science 129: 1649-53.
Lee, K. H., A. D. Holdorf, et al. (2002). “T cell receptor signaling precedes immunological synapse
formation.” Science 295(5559): 1539-42.
Leon, K., R. Perez, et al. (2000). “Modelling T-cell-mediated suppression dependent on interactions
in multicellular conjugates.” J Theor Biol 207(2): 231-54.
Leon, K., R. Perez, et al. (2001). “Three-cell interactions in T cell-mediated suppression? A
mathematical analysis of its quantitative implications.” J Immunol 166(9): 5356-65.
Page 50
General introduction
30
Letourneur, F. and R. D. Klausner (1992). “Activation of T cells by a tyrosine kinase activation
domain in the cytoplasmic tail of CD3 epsilon.” Science 255(5040): 79-82.
Liu, Z. J., H. Haleem-Smith, et al. (2001). “Unexpected signals in a system subject to kinetic
proofreading.” Proc Natl Acad Sci U S A 98(13): 7289-94.
Luescher, I. F., E. Vivier, et al. (1995). “CD8 modulation of T-cell antigen receptor-ligand
interactions on living cytotoxic T lymphocytes.” Nature 373(6512): 353-6.
Lutticken, C., U. M. Wegenka, et al. (1994). “Association of transcription factor APRF and protein
kinase Jak1 with the interleukin-6 signal transducer gp130.” Science 263(5143): 89-92.
Mackall, C. L., T. A. Fleisher, et al. (1995). “Age, thymopoiesis, and CD4+ T-lymphocyte
regeneration after intensive chemotherapy.” N Engl J Med 332(3): 143-9.
Mackall, C. L., L. Granger, et al. (1993). “T-cell regeneration after bone marrow transplantation:
differential CD45 isoform expression on thymic-derived versus thymic-independent progeny.”
Blood 82(8): 2585-94.
Mackall, C. L., J. A. Punt, et al. (1998). “Thymic function in young/old chimeras: substantial
thymic T cell regenerative capacity despite irreversible age-associated thymic involution.” Eur
J Immunol 28(6): 1886-93.
Madrenas, J., L. A. Chau, et al. (1997). “The efficiency of CD4 recruitment to ligand-engaged TCR
controls the agonist/partial agonist properties of peptide-MHC molecule ligands.” J Exp Med
185(2): 219-29.
Margolick, J. B., A. Munoz, et al. (1995). “Failure of T-cell homeostasis preceding AIDS in HIV-1
infection. The Multicenter AIDS Cohort Study.” Nat Med 1(7): 674-80.
Matsumoto, A., M. Masuhara, et al. (1997). “CIS, a cytokine inducible SH2 protein, is a target of
the JAK-STAT5 pathway and modulates STAT5 activation.” Blood 89(9): 3148-54.
Matzinger, P. (1994). “Tolerance, danger, and the extended family.” Annu Rev Immunol 12: 991-
1045.
McKeithan, T. W. (1995). “Kinetic proofreading in T-cell receptor signal transduction.” Proc Natl
Acad Sci U S A 92(11): 5042-6.
Mege, D., V. Di Bartolo, et al. (1996). “Mutation of tyrosines 492/493 in the kinase domain of
ZAP-70 affects multiple T-cell receptor signaling pathways.” J Biol Chem 271(51): 32644-52.
Mehr, R. and A. S. Perelson (1997). “Blind T-cell homeostasis and the CD4/CD8 ratio in the
thymus and peripheral blood.” J Acquir Immune Defic Syndr Hum Retrovirol 14(5): 387-98.
Melo, M. E., T. J. Goldschmidt, et al. (1996). “Immune deviation during the induction of tolerance
by way of nasal installation: nasal installation itself can induce Th-2 responses and
exacerbation of disease.” Ann N Y Acad Sci 778: 408-11.
Modigliani, Y., A. Coutinho, et al. (1996). “Establishment of tissue-specific tolerance is driven by
regulatory T cells selected by thymic epithelium.” Eur J Immunol 26(8): 1807-15.
Page 51
General introduction
31
Modigliani, Y., V. Thomas-Vaslin, et al. (1995). “Lymphocytes selected in allogeneic thymic
epithelium mediate dominant tolerance toward tissue grafts of the thymic epithelium
haplotype.” Proc Natl Acad Sci U S A 92(16): 7555-9.
Mombaerts, P., A. R. Clarke, et al. (1992). “Mutations in T-cell antigen receptor genes alpha and
beta block thymocyte development at different stages.” Nature 360(6401): 225-31.
Monks, C. R., B. A. Freiberg, et al. (1998). “Three-dimensional segregation of supramolecular
activation clusters in T cells.” Nature 395(6697): 82-6.
Montixi, C., C. Langlet, et al. (1998). “Engagement of T cell receptor triggers its recruitment to
low-density detergent-insoluble membrane domains.” Embo J 17(18): 5334-48.
Morelon, E. and A. Dautry-Varsat (1998). “Endocytosis of the common cytokine receptor gammac
chain. Identification of sequences involved in internalization and degradation.” J Biol Chem
273(34): 22044-51.
Murphy, K. M., W. Ouyang, et al. (2000). “Signaling and transcription in T helper development.”
Annu Rev Immunol 18: 451-94.
Muta, K., S. B. Krantz, et al. (1994). “Distinct roles of erythropoietin, insulin-like growth factor I,
and stem cell factor in the development of erythroid progenitor cells.” J Clin Invest 94(1): 34-
43.
Naka, T., M. Narazaki, et al. (1997). “Structure and function of a new STAT-induced STAT
inhibitor.” Nature 387(6636): 924-9.
Nelms, K., A. D. Keegan, et al. (1999). “The IL-4 receptor: signaling mechanisms and biologic
functions.” Annu Rev Immunol 17: 701-38.
Nicholson, L. B., A. C. Anderson, et al. (2000). “Tuning T cell activation threshold and effector
function with cross- reactive peptide ligands.” Int Immunol 12(2): 205-13.
Noben-Trauth, N., P. Kropf, et al. (1996). “Susceptibility to Leishmania major infection in
interleukin-4-deficient mice.” Science 271(5251): 987-90.
O'Garra, A. (1998). “Cytokines induce the development of functionally heterogeneous T helper cell
subsets.” Immunity 8(3): 275-83.
Paul, W. E. and R. A. Seder (1994). “Lymphocyte responses and cytokines.” Cell 76(2): 241-51.
Pereira, P., L. Forni, et al. (1986). “Autonomous activation of B and T cells in antigen-free mice.”
Eur J Immunol 16(6): 685-8.
Polic, B., D. Kunkel, et al. (2001). “How alpha beta T cells deal with induced TCR alpha ablation.”
Proc Natl Acad Sci U S A 98(15): 8744-9.
Powrie, F., S. Mauze, et al. (1997). “CD4+ T-cells in the regulation of inflammatory responses in
the intestine.” Res Immunol 148(8-9): 576-81.
Pui, J. C., D. Allman, et al. (1999). “Notch1 expression in early lymphopoiesis influences B versus
T lineage determination.” Immunity 11(3): 299-308.
Page 52
General introduction
32
Qi, S. Y., J. T. Groves, et al. (2001). “Synaptic pattern formation during cellular recognition.” Proc
Natl Acad Sci U S A 98(12): 6548-53.
Qian, D., M. N. Mollenauer, et al. (1996). “Dominant-negative zeta-associated protein 70 inhibits T
cell antigen receptor signaling.” J Exp Med 183(2): 611-20.
Quong, M. W., W. J. Romanow, et al. (2002). “E protein function in lymphocyte development.”
Annu Rev Immunol 20: 301-22.
Radtke, F., A. Wilson, et al. (1999). “Deficient T cell fate specification in mice with an induced
inactivation of Notch1.” Immunity 10(5): 547-58.
Reich, Z., J. J. Boniface, et al. (1997). “Ligand-specific oligomerization of T-cell receptor
molecules.” Nature 387(6633): 617-20.
Reth, M. (1989). “Antigen receptor tail clue.” Nature 338(6214): 383-4.
Robertson, J. M. and B. D. Evavold (1999). “Cutting edge: dueling TCRs: peptide antagonism of
CD4+ T cells with dual antigen specificities.” J Immunol 163(4): 1750-4.
Rocha, B., N. Dautigny, et al. (1989). “Peripheral T lymphocytes: expansion potential and
homeostatic regulation of pool sizes and CD4/CD8 ratios in vivo.” Eur J Immunol 19(5): 905-
11.
Rosenthal, A. S. and E. M. Shevach (1973). “Function of macrophages in antigen recognition by
guinea pig T lymphocytes. I. Requirement for histocompatible macrophages and
lymphocytes.” J Exp Med 138(5): 1194-212.
Rossi, D. and A. Zlotnik (2000). “The biology of chemokines and their receptors.” Annu Rev
Immunol 18: 217-42.
Sakaguchi, S. (2000). “Regulatory T cells: key controllers of immunologic self-tolerance.” Cell
101(5): 455-8.
Sakaguchi, S., K. Fukuma, et al. (1985). “Organ-specific autoimmune diseases induced in mice by
elimination of T cell subset. I. Evidence for the active participation of T cells in natural self-
tolerance; deficit of a T cell subset as a possible cause of autoimmune disease.” J Exp Med
161(1): 72-87.
Sakaguchi, S., N. Sakaguchi, et al. (1995). “Immunologic self-tolerance maintained by activated T
cells expressing IL-2 receptor alpha-chains (CD25). Breakdown of a single mechanism of self-
tolerance causes various autoimmune diseases.” J Immunol 155(3): 1151-64.
Salio, M., S. Valitutti, et al. (1997). “Agonist-induced T cell receptor down-regulation: molecular
requirements and dissociation from T cell activation.” Eur J Immunol 27(7): 1769-73.
Salzmann, M. and M. F. Bachmann (1998). “Estimation of maximal affinities between T-cell
receptors and MHC/peptide complexes.” Mol Immunol 35(2): 65-71.
Schindler, C. and J. E. Darnell, Jr. (1995). “Transcriptional responses to polypeptide ligands: the
JAK-STAT pathway.” Annu Rev Biochem 64: 621-51.
Page 53
General introduction
33
Sebzda, E., S. Mariathasan, et al. (1999). “Selection of the T cell repertoire.” Annu Rev Immunol
17: 829-74.
Sempowski, G. D. and B. F. Haynes (2002). “Immune reconstitution in patients with hiv infection.”
Annu Rev Med 53: 269-84.
Shevach, E. M. (2002). “CD4+ CD25+ suppressor T cells: more questions than answers.” Nat Rev
Immunol 2(6): 389-400.
Shevach, E. M., R. S. McHugh, et al. (2001). “Control of T-cell activation by CD4+ CD25+
suppressor T cells.” Immunol Rev 182: 58-67.
Shortman, K. and L. Wu (1996). “Early T lymphocyte progenitors.” Annu Rev Immunol 14: 29-47.
Shuai, K., A. Ziemiecki, et al. (1993). “Polypeptide signalling to the nucleus through tyrosine
phosphorylation of Jak and Stat proteins.” Nature 366(6455): 580-3.
Siemasko, K. and M. R. Clark (2001). “The control and facilitation of MHC class II antigen
processing by the BCR.” Curr Opin Immunol 13(1): 32-6.
Sloan-Lancaster, J. and P. M. Allen (1996). “Altered peptide ligand-induced partial T cell
activation: molecular mechanisms and role in T cell biology.” Annu Rev Immunol 14: 1-27.
Smith, H., Y. H. Lou, et al. (1992). “Tolerance mechanism in experimental ovarian and gastric
autoimmune diseases.” J Immunol 149(6): 2212-8.
Smith, K., B. Seddon, et al. (2001). “Sensory Adaptation in Naive Peripheral CD4 T Cells.” J Exp
Med 194(9): 1253-1262.
Smith, L. G., I. L. Weissman, et al. (1991). “Clonal analysis of hematopoietic stem-cell
differentiation in vivo.” Proc Natl Acad Sci U S A 88(7): 2788-92.
Sousa, J. and J. Carneiro (2000). “A mathematical analysis of TCR serial triggering and down-
regulation.” Eur J Immunol 30(11): 3219-27.
Spangrude, G. J. and G. R. Johnson (1990). “Resting and activated subsets of mouse multipotent
hematopoietic stem cells.” Proc Natl Acad Sci U S A 87(19): 7433-7.
Stahl, N., T. G. Boulton, et al. (1994). “Association and activation of Jak-Tyk kinases by CNTF-
LIF-OSM-IL-6 beta receptor components.” Science 263(5143): 92-5.
Starr, R., T. A. Willson, et al. (1997). “A family of cytokine-inducible inhibitors of signalling.”
Nature 387(6636): 917-21.
Staudt, L. M. and P. O. Brown (2000). “Genomic views of the immune system.” Annu Rev
Immunol 18: 829-59.
Stone, J. D., L. A. Conroy, et al. (1997). “Aberrant TCR-mediated signaling in CD45-null
thymocytes involves dysfunctional regulation of Lck, Fyn, TCR-zeta, and ZAP-70.” J
Immunol 158(12): 5773-82.
Page 54
General introduction
34
Subtil, A., M. Delepierre, et al. (1997). “An alpha-helical signal in the cytosolic domain of the
interleukin 2 receptor beta chain mediates sorting towards degradation after endocytosis.” J
Cell Biol 136(3): 583-95.
Sugamura, K., H. Asao, et al. (1996). “The interleukin-2 receptor gamma chain: its role in the
multiple cytokine receptor complexes and T cell development in XSCID.” Annu Rev Immunol
14: 179-205.
Surh, C. D. and J. Sprent (1994). “T-cell apoptosis detected in situ during positive and negative
selection in the thymus.” Nature 372(6501): 100-3.
Suzuki, H., T. M. Kundig, et al. (1995). “Deregulated T cell activation and autoimmunity in mice
lacking interleukin-2 receptor beta.” Science 268(5216): 1472-6.
Swain, S. L., L. M. Bradley, et al. (1991). “Helper T-cell subsets: phenotype, function and the role
of lymphokines in regulating their development.” Immunol Rev 123: 115-44.
Sykulev, Y., M. Joo, et al. (1996). “Evidence that a single peptide-MHC complex on a target cell
can elicit a cytolytic T cell response.” Immunity 4(6): 565-71.
Tanchot, C., F. A. Lemonnier, et al. (1997). “Differential requirements for survival and proliferation
of CD8 naive or memory T cells.” Science 276(5321): 2057-62.
Tanchot, C. and B. Rocha (1995). “The peripheral T cell repertoire: independent homeostatic
regulation of virgin and activated CD8+ T cell pools.” Eur J Immunol 25(8): 2127-36.
Tanchot, C., M. M. Rosado, et al. (1997). “Lymphocyte homeostasis.” Semin Immunol 9(6): 331-7.
Thomas, M. L. (1999). “The regulation of antigen-receptor signaling by protein tyrosine
phosphatases: a hole in the story.” Curr Opin Immunol 11(3): 270-6.
Timm, J. A. and M. L. Thoman (1999). “Maturation of CD4+ lymphocytes in the aged
microenvironment results in a memory-enriched population.” J Immunol 162(2): 711-7.
Tonegawa, S. (1976). “Reiteration frequency of immunoglobulin light chain genes: further evidence
for somatic generation of antibody diversity.” Proc Natl Acad Sci U S A 73(1): 203-7.
Tonegawa, S. (1983). “Somatic generation of antibody diversity.” Nature 302(5909): 575-81.
Townsend, A. R., F. M. Gotch, et al. (1985). “Cytotoxic T cells recognize fragments of the
influenza nucleoprotein.” Cell 42(2): 457-67.
Valensin, S., S. R. Paccani, et al. (2002). “F-actin dynamics control segregation of the TCR
signaling cascade to clustered lipid rafts.” Eur J Immunol 32(2): 435-46.
Valitutti, S., M. Dessing, et al. (1995). “Sustained signaling leading to T cell activation results from
prolonged T cell receptor occupancy. Role of T cell actin cytoskeleton.” J Exp Med 181(2):
577-84.
Valitutti, S. and A. Lanzavecchia (1997). “Serial triggering of TCRs: a basis for the sensitivity and
specificity of antigen recognition.” Immunol Today 18(6): 299-304.
Page 55
General introduction
35
Valitutti, S., S. Muller, et al. (1995). “Serial triggering of many T-cell receptors by a few peptide-
MHC complexes.” Nature 375(6527): 148-51.
van Oers, N. S., N. Killeen, et al. (1996). “Lck regulates the tyrosine phosphorylation of the T cell
receptor subunits and ZAP-70 in murine thymocytes.” J Exp Med 183(3): 1053-62.
van Oers, N. S., B. Lowin-Kropf, et al. (1996). “alpha beta T cell development is abolished in mice
lacking both Lck and Fyn protein tyrosine kinases.” Immunity 5(5): 429-36.
Vaz, N., A. M. Faria, et al. (1997). “Immaturity, ageing and oral tolerance.” Scand J Immunol
46(3): 225-9.
Viola, A. and A. Lanzavecchia (1996). “T cell activation determined by T cell receptor number and
tunable thresholds.” Science 273(5271): 104-6.
Viola, A., S. Linkert, et al. (1997). “A T cell receptor (TCR) antagonist competitively inhibits serial
TCR triggering by low-affinity ligands, but does not affect triggering by high-affinity anti-
CD3 antibodies.” Eur J Immunol 27(11): 3080-3.
Wagner, S. D. and M. S. Neuberger (1996). “Somatic hypermutation of immunoglobulin genes.”
Annu Rev Immunol 14: 441-57.
Wegener, A. M., F. Letourneur, et al. (1992). “The T cell receptor/CD3 complex is composed of at
least two autonomous transduction modules.” Cell 68(1): 83-95.
Weigert, M. G., I. M. Cesari, et al. (1970). “Variability in the lambda light chain sequences of
mouse antibody.” Nature 228(276): 1045-7.
Weiss, A. and D. R. Littman (1994). “Signal transduction by lymphocyte antigen receptors.” Cell
76(2): 263-74.
Weissman, A. M., J. B. Harford, et al. (1986). “Only high-affinity receptors for interleukin 2
mediate internalization of ligand.” Proc Natl Acad Sci U S A 83(5): 1463-6.
Witherden, D., N. van Oers, et al. (2000). “Tetracycline-controllable selection of CD4(+) T cells:
half-life and survival signals in the absence of major histocompatibility complex class II
molecules.” J Exp Med 191(2): 355-64.
Wofsy, C., D. Coombs, et al. (2001). “Calculations show substantial serial engagement of T cell
receptors.” Biophys J 80(2): 606-12.
Wong, P., G. M. Barton, et al. (2001). “Dynamic tuning of T cell reactivity by self-peptide-major
histocompatibility complex ligands.” J Exp Med 193(10): 1179-87.
Xavier, R., T. Brennan, et al. (1998). “Membrane compartmentation is required for efficient T cell
activation.” Immunity 8(6): 723-32.
Zhang, W., R. P. Trible, et al. (1998). “LAT palmitoylation: its essential role in membrane
microdomain targeting and tyrosine phosphorylation during T cell activation.” Immunity 9(2):
239-46.
Page 56
General introduction
36
Zhang, X., J. Blenis, et al. (1995). “Requirement of serine phosphorylation for formation of STAT-
promoter complexes.” Science 267(5206): 1990-4.
Zinkernagel, R. M. and P. C. Doherty (1974). “Restriction of in vitro T cell-mediated cytotoxicity
in lymphocytic choriomeningitis within a syngeneic or semiallogeneic system.” Nature
248(450): 701-2.
Zinkernagel, R. M. and P. C. Doherty (1997). “The discovery of MHC restriction.” Immunol Today
18(1): 14-7.
Page 57
Implications of sharing cytokine receptor chains
37
2 Implications of sharing cytokine receptor chains 2
Implications of sharing cytokine
receptor chains
Page 58
Implications of sharing cytokine receptor chains
38
Page 59
Implications of sharing cytokine receptor chains
39
On the role of the common gamma chain
in ensuring functional pluripotency of peripheral Th lymphocyte clones
João SOUSA1,2 & Jorge CARNEIRO1
1. Instituto Gulbenkian de Ciência, Oeiras, Portugal
2. Grupo de Bioquímica e Biologia Teóricas, Instituto de Investigação Científica Bento da Rocha Cabral, Lisboa, Portugal.
Abstract
We raise the problem of the persistence of uncommitted precursor Th cells in peripheral lymphoid
organs and its relation with the capacity of the immune system to mount different classes of responses. We
argue that the pattern of “endpoint activation” of which IL-4 driven commitment to Th2 lineage is an
example, may lead to the full commitment of lymphocyte clones to this lineage. Using mathematical models,
we address the interference between IL-2 and IL-4 cytokine receptors by sharing γc and demonstrate that
under physiological conditions IL-2 may act as an inhibitor of IL-4 signalling. We explore the consequences
of this inhibition of IL-4 responsiveness in the context of Th cell differentiation and lineage commitment. We
demonstrate that if uncommitted Th precursors cells are proliferating and secreting IL-2 then they can resist
IL-4-driven differentiation and, in spite the pressure imposed by already committed Th2 cells, the pool of
precursor ThP cells persists. The model predicts that modulation of γc may affect the ability to sustain
uncommitted precursors, suggesting novel ways of manipulating the immune system.
Acknowledgements
We are grateful to Paulo Vieira, Jocelyne Demengeot, John Stewart, Vanessa Oliveira and Iris Caramalho
for helpful discussions while doing this work and to Thiago Carvalho for reading the manuscript. This work is
supported by Program Praxis XXI of the Ministério para Ciência e Tecnologia, Portugal (grant
Praxis/P/BIA/10094/1998). JS and JC were respectively supported by fellowships BD/13546/97 and
BPD/11789/97 of Fundação para a Ciência e Tecnologia - Program Praxis XXI.
Page 60
Implications of sharing cytokine receptor chains
40
Page 61
Implications of sharing cytokine receptor chains
41
2.1 Introduction
Hematopoietic development is a lifelong process in which uncommitted precursors go
through a series of lineage commitment events as they progress through branching
differentiation pathways. Progression through the branching points is tightly regulated,
since the pool of precursors must be replenished for the system to remain pluripotent. The
balance between differentiation, proliferation and survival of precursors is determined by
cytokines acting in autocrine, paracrine or juxtacrine modes. Animals deficient in one or
several of these cytokines or their receptors display significant ablation of lymphoid or
myeloid lineages (reviewed in (1)), which emphasises the importance of population
dynamics in hematopoiesis.
The discovery that peripheral Th lymphocytes can still undergo further lineage
commitment (1-4) raises the problem of what are the mechanisms ensuring the persistence
of their clonal uncommitted precursors. This is particularly relevant considering that loss of
uncommitted precursors and commitment of an entire clone to a single lineage may be
achieved, compromising the capacity of the immune system to mount qualitatively different
effector functions. The simpler explanation for the maintenance of uncommitted Th
precursor pools is their continuous replenishment by thymic output (5), much in the same
way that thymic lymphopoiesis relies on extrathymic stem cells with self-renewal capacity.
The plausibility of this explanation is minimised, however, by several observations:
Thymic output decreases in adult life (6) and peripheral Th populations can persist in the
absence of a thymus without major disturbances of repertoire diversity or capacity to mount
different classes of responses. Moreover, the actual exhaustion of lymphocyte clones has
been demonstrated for CD8+ T cells (7), and the same is expected for Th cells.
Alternatively, uncommitted Th precursors may be regarded as “stem cells” that persist and
compensate the loss due to differentiation and lineage commitment by “homeostatic
proliferation” (8). The persistence of these precursors becomes then a question of how is
the mechanism underlying homeostasis organised.
Differentiation of precursors of non-lymphoid hematopoietic cells seems to be
regulated by negative feedback loops (9). A complex mechanism of feedback inhibition
seems to be also involved in granulopoiesis and thrombopoiesis (9), and these regulatory
loops ensure a stable persistence of precursors. Feedback mechanisms have also been
Page 62
Implications of sharing cytokine receptor chains
42
suggested in the regulation of thymocyte populations (10). In the periphery, the
differentiation of uncommitted Th precursors cells seems to involve some kind of end-point
activation, defining a positive feedback loop in which committed cells produce factors that
promote the differentiation of precursor cells to the same lineage (11,12). Gamma
interferon promotes indirectly the differentiation of precursors to the Th1 lineage by
modulating IL-12 expression by the antigen presenting cells (APCs) (13) and enhancing IL-
12R expression (14). But the most striking example of end-point activation is provided by
IL-4, the hallmark of Th2 differentiated cells (15), which is a major driver of Th2 lineage
commitment (16). Minor populations of IL-4 producing cells are capable of driving the
differentiation of Th cell precursors to the Th2 phenotype in vitro (17) and in vivo (18,19)
Since the most straightforward expectation of endpoint activation is the exhaustion of
precursors, this pattern of regulation is desteleological considering the requirements for
diversity in the immune system in terms of both specificity and class of effector function.
In this article we propose and discuss one candidate mechanism namely the
interference, at the single cell level, between the signalling cascades triggered by different
cytokines of the common gamma chain (γc) family. The receptors for IL-2, IL-4, IL-7, IL-9
and IL-15 share a chain, γc, which is strictly required for signalling (20). While γc is
constitutively expressed throughout all the stages of T lymphocyte development (20-22),
including the late peripheral stages (23), the expression pattern of the other chains changes
as lymphocytes proceed in their differentiation pathway (21,22). In broad terms, these
cytokines are proliferation and survival factors, and at least IL-4 and IL-15 are
differentiation factors acting respectively on uncommitted Th precursors (24,25) and on NK
cell precursors (26). Therefore it is reasonable to anticipate that different patterns of
expression of receptor chains for these cytokines may govern the balance between
proliferation and differentiation of lymphocytes precursors in the central hematopoietic and
peripheral organs.
Using mathematical modelling, we show that at the relative membrane concentrations
of the cytokine receptor chains, IL-2 signalling may inhibit IL-4 responsiveness in
uncommitted Th precursor, because γc is limiting as compared to IL-2R α and β chains.
Furthermore, we show that this inhibition can be sufficient to allow the persistence of
uncommitted Th precursors, preventing the full commitment of a clone to the Th2 lineage,
and ensuring clonal pluripotency.
Page 63
Implications of sharing cytokine receptor chains
43
2.2 Modelling and Results
2.2.1 COUPLING BETWEEN IL-2 AND IL-4 RECEPTOR SIGNALLING VIA THE COMMON
GAMMA CHAIN
Similarly to Whitty et al (27), we study the coupling between IL-2R and IL-4R using a
steady state model (Fig 1). The aggregation of the various receptor chains for the IL-4
receptor was taken from the model they introduced with the following simplifying
postulates:
IL- 4IL- 4
IL- 2
IL- 4
αIL- 2 IL- 2
γ
γ
γ
β+
(i) (ii)
(iii) (iv)
(v)
α α αβ β β
αα α
IL-2R
IL-4R
Figure 1 - Model of IL-2 and IL-4 receptor association. IL-2 binds to the IL-2Rαβ heterodimer (i) forming
a complex that recruits the common γ chain (ii), forming the high-affinity IL-2 receptor. Similarly, IL-4
binds to the IL-4Rα chain (iii) forming a complex that recruits the common γ chain (iv) and forms the
high-affinity IL4 receptor. The IL-2Rα and IL-2Rβ chains are assumed to be pre-associated in the
membrane (v). See text for a detailed explanation.
Postulate i – That the binding of cytokine to the receptor chains is sequential (27,28).
The affinity of IL-4 for IL-4Rα is higher than for γc, so IL-4 will bind preferentially to IL-
4Rα and the resulting complex will then recruit γc, forming the full receptor complex
(27,28). Under this assumption, the equilibrium equations for IL-4 binding are:
4
444-ILKC
LAIL
×= , 1
KγIL-4 =
C4 ×γR4
, 2
where the variables γ, A4, L4, C4 and R4 are respectively the concentrations of free γc, IL-
4Rα, IL-4, IL-4-IL-4Rα complex, and IL-4–IL-4Rαγ complex. The constants K ILIL-4 and
KγIL-4 are the IL-4 and γc dissociation constants from IL-4R.
Page 64
Implications of sharing cytokine receptor chains
44
Unlike the IL-4R, the IL-2R has three receptor chains, which makes modelling IL-2R
binding more complex. Nevertheless, the problem of IL-2R binding can be simplified by
considering the following postulates:
Postulate ii – IL2-Rα chain is in excess relative to IL2-Rβ and γc. This postulate holds
for cells that have up-regulated the levels of IL-2Rα, such as activated cells (23,29);
Postulate iii – most of the IL-2Rβ is complexed with IL-2Rα. The postulate is
supported by the finding that IL-2Rβ can bind to IL-2Rα in the absence of IL-2 (30). The
postulate holds if the affinity of IL-2Rβ and IL-2Rα binding is sufficiently high and/or IL-
2Rα is in excess relative to IL-2Rβ, which is the case for activated T cells (31,32);
Postulate iv – IL-2 binds to IL2-Rαβ rather than to IL2-Rα or IL2-Rβ. This postulate
builds on postulates ii and iii and is supported by the finding that IL-2Rαβ heterodimer has
a higher affinity for IL-2 than IL-2Rα or IL-2Rβ alone (30,33). Postulates ii and iii have
the additional consequence of allowing us to neglect the contribution of lower and
intermediate affinity receptors of IL-2. Under these simplifying postulates, IL-2 binding is a
problem formally equivalent to IL-4 binding:
K ILIL-2 =
A2 × L2
C2
, 3
KγIL-2 =
C2 ×γR2
, 4
where the variables A2, L2, C2 and R2 are the concentrations of IL-2Rαβ, IL-2, IL-2–
IL-2Rαβ complex, and IL-2–IL-2Rαβγ complex, respectively. The constants K ILIL-2 and
KγIL-2 are the IL-2 and γc dissociation constants from IL-2R. Note that according to these
equations, γc binding to IL-2R increases the stability of the receptor-ligand complex. This
increase in the stability of the receptor-ligand complex is also present in IL-4R binding and
depends on the γc dissociation constantsK ILIL-2 and K IL
IL-4 .
The model is composed of equations 1-4 together with the following conservation
relationships for total IL-4Rα (αTIL-4 ), total IL-2Rαβ (αT
IL-2 ) and total γc (γT):
4444IL
T RCA ++=−α 5
αTIL-2 = A2 + C2 + R2 6
γ T = γ + R2 + R4 . 7
For the sake of simplicity, we are neglecting the influence of other cytokine receptors
in the numbers of free γc.
Page 65
Implications of sharing cytokine receptor chains
45
Table 1 – Parameters used in modelling IL2 and IL4 binding to receptors
Parameter Value Notes
K ILIL-2 120 pM (33)
KγIL-2 171 molecules/cell See derivation in text
K ILIL-4 850 pM (34)
KγIL-4 413 molecules/cell See derivation in text
K appIL-2 10 pM (33)
K appIL-4 130 pM (34)
αβTIL-2 2500 molecules/cell See derivation in text
αTIL-4 1200 molecules/cell (34)
γT 2800 molecules/cell (34)
The parameters of the model are based on the literature (Table 1), which originate
from in vitro studies using cell lines. There is considerable variability regarding the
expression of cytokine receptor chains between different cell lines, which together with the
scarcity of quantitative assessments, lead to some uncertainty regarding the generality of
the parameters listed in table 1. Notwithstanding these limitations, since the conclusions we
draw from the model are mostly qualitative and dependent on the relative numbers of
receptor chains, we use these reference parameters to illustrate the model properties.
Kondo et al (34) reports that at saturating IL-2 concentrations, there is little free γc,
which implies that the number of IL-2–IL-2Rαβ complexes is high enough to sequester
most of the free γc in the cell. Since there are available reports indicate that the level of
expression of IL-2Rβ is similar or higher than γc (31,32,35) we will assume, under
postulates ii and iii, that the number of IL-2Rαβ complexes pre-formed in the absence of
IL-2 is enough to sequester about 90% of the free γc at saturating IL-2 concentrations, thus
we assume 2500 IL-2Rαβ complexes per cell.
The dissociation constants KγIL-4 and Kγ
IL-2 were estimated by extending the model of
Whitty et al (27) to the IL-2R under postulates i-iv. IL-2R binding, the parameter KγIL-2 was
estimated from equations 3, 4 and 6, together with the conservation relation γ T = γ + R4 ,
assuming that the binding of IL-2 to IL-2R produces an approximately linear Schatchard
plot. Binding experiments support this assumption for both IL-4 (28,34) and IL-2 (36). The
Page 66
Implications of sharing cytokine receptor chains
46
apparent affinities of IL-2R and IL-4R, K appIL-2 and K app
IL-4 , were taken from Schatchard plots
of IL-2 (36) and IL-4 (34) binding experiments, respectively. The relationship between
KγIL-2 and the apparent affinity of IL-2R for IL-2 (K app
IL-2 ) is
( )( )
( ) ( )( )1K1KKKK1KK1K
K 2-ILapp
2-ILapp
2-ILIL2
2ILT
2-ILapp
2-ILIL
2-ILapp
2-ILIL
2-ILapp2-IL
++−
−+−= −
TL γαγ 8
The parameter KγIL-4 is estimated from K app
IL-4 using the same procedure.
We will assume (Postulate v) that signalling is proportional to the concentration of
fully assembled cytokine-receptor complexes (R2 and R4). The units of the model are such
that the maximal value of both IL-2 and IL-4 signals (i.e. the limit at infinite concentrations
of IL-2 and IL-4) is one.
2.2.2 IL-2 AND IL-4 ARE POTENTIALLY NON-COMPETITIVE INHIBITORS OF EACH OTHER
BUT THE EFFECT OF IL-2 IS QUANTITATIVELY MORE IMPORTANT
The results of the numerical simulations of the model, using the parameters in table 1,
are summarised in figure 2.
Comparing figures 2-A and 2-B, it is evident that although IL-2 and IL-4 can
potentially inhibit each other, IL-2 can inhibit IL-4 up to approximately 40% (figures 2-A
and C) while IL-4 can only marginally affect IL-2 signalling (figure 2-B). The difference
between IL-2 and IL-4 is due to two factors: the number of IL-2Rαβ complexes is higher
than the IL-4Rα chain and is also in excess compared to the γc; and the dissociation
constants K ILIL-2 and Kγ
IL-2 are lower than the constants K ILIL-4 and Kγ
IL-4 , respectively. Under
these conditions, and provided that enough IL-2 is present, the formation of IL-2 receptor
can sequester up to 40% of the free γc that is required for the formation of the IL-4R and
IL-4 signalling. The extent of inhibition of IL-4 signalling by IL-2 can be modulated by the
relative expression of the γc; sequestering of γc by IL-2 can be alleviated increasing the
levels of γc (figure 2-C) expression or by reducing IL-2Rαβ (not shown).
Page 67
Implications of sharing cytokine receptor chains
47
100 101 102 103 1040
0.2
0.4
0.6
0.8
1
100 101 102 103 1040
0.2
0.4
0.6
0.8
1
[IL-2]/pM
[IL-2]/pM
IL-4
sign
alIL
-2 si
gnal
100 101 102 103 1040
0.2
0.4
0.6
0.8
1
10 1 100 101 1020
0.2
0.4
0.6
0.8
1
[IL-4]/pM
γc
IL-4
sign
alIL
-4 si
gnal
( i)( ii)( iii)( iv )A B
DC
( i)
( ii)( iii)( iv )
Figure 2 - Results of the model of IL-2 and IL-4 receptor association. The IL-2 and IL-4 signals are relative
to the IL-2 and IL-4 signals at saturating cytokine concentration. A – IL-2 signal as a function of IL-2. The
curves correspond to various concentrations of IL-4 (i: 0, ii: 50, iii: 500, iv: 10000 pM). B – IL-4 signal as
a function of IL-4. The curves correspond to various concentrations of IL-2 (i: 0, ii: 50, iii: 500, iv: 10000
pM). C – IL4 signal at a saturating IL4 concentration as a function of IL-2 concentration. D – IL-4 signal as
a function of γc at saturating concentrations of both IL-2 and IL-4. The parameters are listed in table 1
2.2.3 DIFFERENTIATION OF THP CELLS TO COMMITTED TH2 CELLS — A POPULATION
DYNAMICS MODEL
We ask whether IL-2 inhibition of IL-4 driven differentiation can have a detectable
impact on the balance between self-renewal of uncommitted Th precursors and their
differentiation to the Th2 lineage. To address this question quantitatively, we propose the
minimal model of Th precursors and Th2 cells (illustrated in fig. 3) that involves the
following postulates:
Page 68
Implications of sharing cytokine receptor chains
48
ThP Th2
IL-2 IL-4
( ii)( iv)
( i)
(v)( iii)
( v ii)( v i)
De a t h De a t h... Figure 3 - Model of ThP and Th2 proliferation and differentiation. ThP differentiation to Th2 (i) is driven
by IL-4 (ii), which is secreted by Th2 cells, and is inhibited by IL-2 (iii), which is secreted by ThP cells.
Both ThP and Th2 cell proliferation is depends on autocrine/paracrine factors secreted by ThP and Th2
cells respectively (iv and v). Both ThP and Th2 cells die with a constant per-capita rate (vi and vii). See
text for details.
Postulate vi- A clone of peripheral Th cells is composed of a subpopulation of
uncommitted precursors (ThP) and a subpopulation of Th2-committed cells. For simplicity
we are ignoring cells committed to other ThP-derived lineages such as the Th1 cell lineage.
The numbers of ThP and Th2 cells are denoted by Tp and T2, respectively.
Postulate vii- ThP and Th2 subpopulations decay with a constant death rate (37),
which we will assume is identical for the two subpopulations. The number of ThP and Th2
cells that die per unit of time is then given by δ × Tp and δ × T2 respectively, with δ the per
cell death rate constant.
Postulate viii- The death of ThP and Th2 cells is compensated by interactions with
MHC that result in activation and proliferation. We assume that the per-cell proliferation
rate is limited by a carrying capacity (τ) which is independent for both cell types (38). Also,
the proliferation rate per cell of either ThP (ΠP) and Th2 (Π2) is enhanced by
autocrine/paracrine cytokines produced by ThP and Th2 respectively, whihc results in a
positive feedback loop. The per cell proliferation rate for the ThP subpopulation (for
example), growing under autocrine/paracrine stimulation mediated by an hypothetical
cytokine IL-P, is therefore:
ΠP =ρ P
TP + τP
×LP
LP + σ P
9
where ρP is the maximum per cell proliferation rate of ThP, LP is the concentration of the
cytokine IL-P and σP is the concentration of IL-P that induces half-maximum IL-P
signalling for ThP proliferation.
Postulate ix- Production and elimination of cytokines is a fast processes compared to
cell population dynamics. This assumption allows the simplification of the model using a
Page 69
Implications of sharing cytokine receptor chains
49
quasi-steady state approximation to the cytokine concentration, resulting in the
concentration of cytokine being proportional to the number of secreting cells. Applying this
approximation in equation 9 leads, after some rearrangement:
ΠP =ρ P
TP + τP
×TP
TP +θP
10
where θP is σP× rP/sP, and rP and sP are respectively the rate constants of cytokine IL-P
degradation and production. The same construction for Th2 yields an equivalent
proliferation rate:
Π2 =ρ2
T2 +τ 2
×T2
T2 +θ2
11
where θ2 is σ2× r2/s2, and r2 and s2 are respectively the rate constants of degradation
and production of the autocrine/paracrine cytokine controlling Th2 proliferation. Equations
10 and 11 have a quadratic dependence on the number of cells, which is a consequence of
the positive feedback loop of autocrine/paracrine cytokines controlling cell proliferation.
Postulate x- Differentiation of ThP into the Th2 lineage is a saturating function of IL-4
in the medium; IL-2 acts as an inhibitor of IL-4-driven differentiation of ThP decreasing the
maximum rate of differentiation. Since differentiation of cells requires activation of ThP,
which is concomitant with up-regulation of CD25 (39) then, following the results of
previous section, we expect a significant interference of IL-2 over IL-4 signalling.
Assuming that both IL-2 and IL-4 concentrations are in a quasi-steady state, then the per-
cell differentiation rate of ThP to Th2 is:
Φ = kT2
T2 +θL4
× 1 − χTP
TP + θL2
12
where the two terms represent respectively the IL-4 saturating response and the
inhibition of IL-4 response by IL-2, because of the quasi-steady state assumption both
terms are a function of the number of cells. The constants θL4 and θL2 are the number of
Th2 and ThP cells capable of excepting half-maximum effect. These constants are defined
as θL4 = σL4 × rL4/sL4 and θL2 = σL2 × rL2/sL, where σL4 and σL2 are the affinity of ThP for IL-
4 and IL-2 respectively, and rL4/sL4 and rL2/sL2 are the ratios between the degradation and
production rate constants for IL-2 and IL-4. The parameter k is the absolute maximum
differentiation rate and χ is the amount of inhibition due to IL-2. If χ=0, then IL-2 does not
interfere with IL-4 signalling. Setting χ=0.4 reproduces the situation in which IL-2 can
inhibit IL-4 signal up to 40%.
Page 70
Implications of sharing cytokine receptor chains
50
Following the previous postulates the dynamic of the subpopulations of ThP and Th2
cells are described by the following set of differential equations:
dTP
dt= ΠP − δ TP − Φ TP
dT2
dt= Π2 − δ T2 + Φ TP
13
The model was simulated using the parameters listed in table 2. According to these
parameters, about 1% of the total cell population is renewed per day, which is comparable
to previous estimates on peripheral lymphocyte turnover (40). The unit number of cells (N)
is arbitrary for the sake of generality of the model. The affinities of the ThP cells for IL-2
and IL-4 (σL2 and σL4) were assumed to respect the ratio between the apparent affinities of
the cytokine receptors (table 1). For simplicity, the ratio between the rate of production and
degradation of IL-2 and IL-4 were assumed to be the same and therefore the ratio θL4/θL2 is
equal to K appIL-2 /K app
IL-4 = 13.
Table 2 – Parameters of the model of ThP/Th2 differentiation
Parameter Value
ρ0 0.01 day-1
ρ2 0.01 day-1
τP 0.2 N
τ2 0.2 N
θL2 0.013 N
θL4 0.17 N
δ 0.01 day-1
κ 0.005 day-1
2.2.4 INHIBITION OF IL-4 DRIVEN DIFFERENTIATION BY IL-2 ALLOWS FOR THE
PERSISTENCE OF PRECURSORS
Two prototypic situations are of interest to assess the impact of IL-2 and IL-4
interference in ThP and Th2 population dynamics: one where there is no interference
between IL-2 and IL-4 and one in which IL-2 can inhibit IL-4 signalling up to 40%
(respectively χ=0 and χ=0.4). Figure 4 represents the phase diagrams of the model without
(4-A) and with (4-B) inhibition of IL-4 signal by IL-2. The horizontal axis represent the
Page 71
Implications of sharing cytokine receptor chains
51
number of ThP cells and the vertical axis the number of Th2 cells. The lines represent states
where either Th2 or ThP do not change in time and the circles in the intersections between
these lines represent the steady states of the system. The closed circles represent stable
steady states of the model, meaning that within some particular initial conditions, the
number of cells of Th2 and ThP will always converge to those numbers. The open circles
denote unstable steady states, meaning that the smallest disturbance will make the system
converge in the direction of a stable steady state. Figure 4-A shows two stable steady states,
one in which both ThP and Th2 populations disappear and another where ThP are
extinguished and Th2 persist. The first steady state denotes a situation where the number of
founding cells is so low that they are unable to produce enough cytokines to proliferate and
persist. The later stable steady state is attained with higher numbers of initial Th2 and ThP
cells and regardless how high the number of initial cells is, the system in these conditions
will always commit completely to Th2. This is akin to clonal exhaustion, as all the
precursors differentiate to effector cells and eventually die. There are four additional steady
states that are unstable in this system. One of these four states is worth mentioning since it
shows that in the absolute absence of Th2 cells the pool of ThP could be sustained.
However, an infinitely small number of Th2 cells would suffice for the system to progress
to full Th2 commitment.
0 0.2 0.4 0.6 0.8 1 1.20
0.2
0.4
0.6
0.8
1
1.2
0 0.20.2 0.40.4 0.60.6 0.80.8 1 1.21.20
0.20.2
0.40.4
0.60.6
0.80.8
1
1.21.2
0 0.2 0.4 0.6 0.8 1 1.20
0.2
0.4
0.6
0.8
1
1.2
0 0.20.2 0.40.4 0.60.6 0.80.8 1 1.21.20
0.20.2
0.40.4
0.60.6
0.80.8
1
1.21.2A B
ThP / N ThP / N
Th2
/ N
Th2
/ N
Figure 4 - Phase planes of the model of ThP and Th2 proliferation and differentiation. A – Phase plane of
the model without IL2 inhibition (χ=0). B – Phase plane of the model with IL-2 inhibition (χ=0.4). The
lines represent the null clines of the system, i.e. conditions where either the ThP population (dashed lines)
or the Th2 population (solid lines) do not change in time. Where the null clines intersect (circles), the
system is in a steady state. Open circles denote unstable steady states and filled circles denote stable steady
states. The parameters are listed in tables 1 and 2, see text for details.
Representing the phase plane for the model with inhibition of differentiation by IL-2
Page 72
Implications of sharing cytokine receptor chains
52
(figure 4-B) reveals three stable steady states. Two are qualitatively the same as before:
extinction of both ThP and Th2 populations and persistence of Th2 and extinction of ThP
populations. The new stable steady state corresponds to the persistence of both Th2 and
ThP populations and denotes a situation where the founding number of ThP cells is
sufficiently high to produce enough IL-2 to sustain the growth of ThP and significantly
inhibit differentiation to Th2. The balance between proliferation and differentiation of ThP
cells permits the persistence of ThP in the presence of Th2 cells. This model has
additionally five unstable steady states, four in common with the model without inhibition
and new unstable steady state, which lies in the separatrix between the two stable states
denoting full Th2 commitment and coexistence Th2 and ThP.
To illustrate how inhibition of IL-4 driven differentiation by IL-2 produces the
conditions necessary for the persistence of a pool of ThP cells, we will discuss in detail the
steady state of ThP, assuming that Th2 cells are in the steady state corresponding to co-
existence of ThP and Th2. Figure 5 shows the rate of ThP proliferation and of the rates of
ThP death plus differentiation with and without inhibition of IL-4 driven differentiation by
IL-2. Without inhibition (χ=0), the rate of ThP death plus differentiation is always larger
than the rate of ThP proliferation so the pool of ThP will shrink to exhaustion. With 40% of
inhibition of IL-4 driven differentiation by IL-2 (χ=0.4), the rate of ThP death plus
differentiation intersects the rate of ThP proliferation in three points, which correspond to
three steady states. Two are stable steady states, one corresponds to exhaustion and the
other corresponds to persistence of ThP. The third steady state is unstable and is located
between the two stable states. For ThP smaller than this unstable state, the rate of ThP
proliferation is smaller than the rate of death plus differentiation, so the pool of ThP shrinks
to exhaustion. For ThP bigger than the unstable steady state, the rate of ThP proliferation is
larger the rate of ThP death plus differentiation so the ThP pool grows towards the steady
state denoting persistence of ThP.
Page 73
Implications of sharing cytokine receptor chains
53
0 0.1 0.2 0.3 0.40
0.001
0.002
0.003
0.004
0.005 ( i)
( ii) ( iii)
ThP / N
Rat
e / N
day
-1
Figure 5 - Balance of ThP proliferation and the joint effect of differentiation and death, assuming that the
pool of Th2 cells is in the steady state corresponding to co-existence of ThP and Th2 (Th2 ≈ 0.71 N). (i)
Proliferation rate of ThP cells; rate of death plus differentiation of ThP cells, without (ii) and with (iii)
inhibition of differentiation by IL-2. Whenever the growth curve (i) and the death plus differentiation
curves (ii and iii) intersect (circles) there is a steady state. Stable steady states are denoted as full circles
and unstable steady states are denoted as open circles. See text for details. The parameters are listed in
tables 1 and 2.
This model predicts a synergy of the concerted action of IL-2 and IL-4 for Th2
differentiation. Comparison of the model with and without inhibition (figure 4), shows that
the maintenance of a pool of ThP cells increases the size of the Th2 population by
approximately 20% under the parameters of Table 2. This result provides a rational for the
well-known increased yields in Th2 differentiation when precursor cells are cultured with
IL-2 and IL-4 (41,42). In our model, this increase is because ThP cells and Th2 cells have
independent carrying capacities.
These results are obviously parameter dependent. Parameter regimes exist where in the
absence of inhibition the persistence of both ThP and Th2 cell pools is possible. These
parameter regimes imply for example, a lower differentiation flux from ThP to Th2 and/or
a larger growth rate or smaller death rate for ThP. Also, for the model with inhibition,
under some parameter regimes the inhibition by IL-2 of differentiation is not sufficient to
maintain a pool of precursor ThP cells, for example, when the death rate of ThP or the
proliferation rate Th2 is large or when the proliferation of ThP or the death of Th2 is small.
Page 74
Implications of sharing cytokine receptor chains
54
2.2.5 MODULATING γC EXPRESSION LEVELS MAY BE USED TO INFLUENCE THE EXTENT TO
WHICH A CLONE IS COMMITTED
As we have seen above, the levels of expression of γc modulate the maximal inhibition
of IL-4 signalling by IL-2 (fig. 2-D), so the levels of γc expression by precursor cells can
determine whether these cells can persist, by modulating IL-2-dependent resistance to IL-4
driven differentiation. This prediction is illustrated in the bifurcation diagram for ThP
population size as a function of the parameter χ (fig. 6).The main testable prediction of the
model is that the levels of γc can control the outcome of Th2-lineage commitment
experiments. Long-term cultures of naïve T cells in the presence of Th2-driving conditions
lead to irreversible Th2-commitment. Our model would predict that the actual time required
to fully commit a population of naïve cells could be shortened by forcing ThP cells to over-
express γc. Conversely, forcing ThP cells to down-modulate the expression of γc could
delay and maybe prevent exhaustion of the ThP pool.
ThP
/ N
χ0 0.2 0.4 0.6 0.8 1
0
0.1
0.2
0.3
0.4
0.5
0.6
Figure 6 - Bifurcation diagram of the model showing the size of the ThP pool as a function of the extent of
inhibition of IL-4 driven differentiation by IL-2 (χ). The black lines represent stable steady states; the grey
lines represent unstable steady states. The parameters are listed in tables 1 and 2, see text for the details.
Page 75
Implications of sharing cytokine receptor chains
55
2.3 Discussion
We have raised the problem of persistence of uncommitted ThP cells and argued that
the pattern of “endpoint activation” of differentiation to Th2 pathway could lead to the full
commitment of lymphocyte clones to Th2 lineage. We have confirmed the plausibility of
this expectation by a quantitative analysis of a population dynamic model, but we have also
shown that exhaustion of uncommitted precursors may be avoided. The model, calling into
action cytokines whose receptors share γc, demonstrates that if uncommitted ThP cells are
proliferating and secreting IL-2 then they will resist IL-4-driven differentiation and, in spite
the pressure imposed by already committed Th2 cells, the pool of precursor ThP cells is
maintained.
In the minimal model of cytokine receptor dynamics and signalling presented here,
IL-2 interferes with IL-4 signalling by assembling a receptor complex that sequesters γc. In
reality, cytokine receptors are in constant turnover (43-45) and the engagement of cytokine
receptors increments the down-regulation and either degradation or recycling of receptor
chains (45,46). These processes were not considered in this work due to the lack of
sufficient experimental kinetic data. Nevertheless the model should be a good
approximation when the dynamic of the cytokine-receptor chains is practically in
equilibrium, which is probably the case if we consider the time scale at which the
populations of ThP and Th2 are evolving. Interestingly, IL-2-mediated down-modulation of
γc (43-45) might amplify the inhibition of IL-4 signalling, which may mean that our model
is underestimating the interference between the cytokines.
The cell population model makes also strong simplifications on cytokine signalling.
Signals leading to differentiation and proliferation were assumed to be proportional to the
amount of fully assembled receptors complexes, which should only reflect early signalling
events. A consideration of common downstream signalling components, such as Jak1 and
Jak3, homodimers and heterodimers of STAT1, STAT3 and STAT6, or the products of the
CIS and SOCS gene family (47), are expected to amplify the early effects leading to a more
pronounced interference between the cytokines.
The model only includes autocrine growth of ThP and Th2 cell populations, neglecting
for instance the effect of IL-2 on Th2 proliferation and the effect of IL-12 on the dynamic
of ThP and Th2 (1-4). IL-4 is required for the differentiation of ThP to Th2 (1-4), but it's
Page 76
Implications of sharing cytokine receptor chains
56
effects on the maintenance of the Th2 cells seems to synergize with IL-2 (48), as expected
from the model. To assess how cross-regulation would affect the results of our model we
performed simulations where growth of Th2 population is affected by both autocrine
factors and by paracrine factors produced by ThP (not shown). Only if Th2 cell
proliferation would be strictly dependent on a growth factor produced by ThP cells, would
the results change qualitatively. Under these conditions, Th2 pool persistence would be
impossible without ThP cells, and therefore precursor ThP cells would always persist
without any functional requirement for a putative inhibition by IL-2 of IL-4-driven
differentiation. These strict conditions are, however, unrealistic. IL-2 is the most obvious
candidate for a growth factor produced by ThP that affects the growth of Th2 cells,
however, this cytokine is not strictly necessary for Th2 development in vitro (49) and in
vivo (50).
In spite of the radical simplicity of our description of the inhibition of IL-4 signals by
IL-2, the model demonstrates that even a marginal effect at the level of early signalling
events, once placed in the context the non-linear population dynamics of Th differentiation,
becomes amplified to an all-or-none effect.
According to the model, precursors may persist in a situation that we interpret as
clonal pluripotency. Although there is no clearly identifiable molecular mechanism, the fact
that ThP persist in a stable steady state implies an effective “negative feedback” loop
embedded in the dynamic of ThP and Th2 populations. Hence, peripheral differentiation of
Th lymphocyte clones maybe regulated by a negative-feedback loop, functionally
analogous to those regulatory circuits that ensure the persistence of precursors for
erythrocytes and neutrophils.
Interestingly, within the multistable regime, where the population of ThP can either be
exhausted or grow to the homeostatic steady state, a perturbation could drive the system
from the state of co-existence of Th2 and ThP to the state of ThP exhaustion. This property
of the model is reasonable considering that the immune system must eliminate pathogens
and mount recall responses, and that the same pathogen may require different classes of
response depending on the context and route of its inoculation. In most sporadic challenges
it might be appropriate and sufficient to generate cohorts of Th2 cells, keeping nevertheless
precursors with capacity to produce cells of the same specificity but committed to other
lineage. In other situations, namely lifetime immunisation, it might be appropriate and
necessary to commit a clone once and for all to the Th2-lineage. In a nutshell, under some
Page 77
Implications of sharing cytokine receptor chains
57
circumstances specific clones may need to keep precursors by a functional feedback loop,
but under other circumstances this regulatory loop may be overruled, irreversibly
associating a clone with a class of effector function. Further theoretical elaboration on this
hypothesis requires defining experimentally whether or not clones remain pluripotent in
vivo and how different challenges affect the extent of clonal commitment. Populations of
naïve Th cells cultured under strong Th2 driving conditions will eventually loose
progenitors (1), which under less stringent conditions could persist longer. Analysis of Th
cell repertoire in animal models have shown the expansion of a restricted population of
cells expressing a defined Vα Vβ heterodimer which are in either a Th1 or Th2 phenotype
(51). Alternatively, several reports indicate that cells responding in vivo in Th1 or Th2
modes express different Vα or Vβ genes (52). One interpretation of these findings is that
these cells belong to different clones, which are fully committed to either Th1 or Th2
lineage, and are select under different pressures. However, this is not the only interpretation
and therefore more definitive experimental results are needed.
Mutant animals might allow assessing the realism of the hypothesis that interference
between IL-2 and IL-4 signalling contributes for clonal pluripotency. Animals lacking γc
have impaired peripheral compartments (53), making them uninformative in this context.
Animals deficient in IL-4 are unable to mount efficient Th2 responses (54) supporting a
model for IL-4 driven differentiation to the Th2 lineage but telling us little about the
quantitative interference that we have explored here. Animals lacking IL-2, IL-2Rα and IL-
2Rβ genes would be more appropriate to address our hypothesis on Th differentiation.
Interestingly, the level of γc expression level is increased in T cells from IL-2 deficient
animals (55), suggesting that continuous IL-2 signalling and IL-2 receptor down-
modulation in wild-type animals may reduce the availability of γc for other cytokines (43).
Our prediction would be that these animals should more easily loose clonal pluripotency
following Th2 stimuli. The bias towards IgG1 observed in IL-2 deficient mice (50), but not
in IL-2 × IL-4 double deficient mice (56) is in agreement with this expectation of our
model. In this context, it is tempting to speculate that the homeostatic abnormalities
observed in the three mutant animals (50,57,58) are due to loss of uncommitted Th
precursors and a subsequent inability to generate cohorts of further differentiated regulatory
Th cells involved in preventing the expansion of other cells (59).
Families of cytokines receptors share one or another chains making it possible for
dynamic coupling between the members of the same family. Here we called the attention to
Page 78
Implications of sharing cytokine receptor chains
58
a potential role of the interference between IL-2 and IL-4 in the commitment of peripheral
cells. Since the members of the γc family are involved at different stages of hematopoiesis,
both as differentiation and renewal factors, it is possible that similar mechanism may play a
role in other branching points of lymphocyte development. In other cytokines families,
quantitative interference between receptors might unfold into yet unknown functions that
deserve being investigated.
2.4 Bibliograpy 1 Murphy, E., Shibuya, K., Hosken, N., Openshaw, P., Maino, V., Davis, K., Murphy, K., and
O'Garra, A. 1996. Reversibility of T helper 1 and 2 populations is lost after long-term
stimulation. J Exp Med 183:901.
2 Szabo, S. J., Kim, S. T., Costa, G. L., Zhang, X., Fathman, C. G., and Glimcher, L. H. 2000. A
novel transcription factor, T-bet, directs Th1 lineage commitment. Cell 100:655.
3 Lee, H. J., Takemoto, N., Kurata, H., Kamogawa, Y., Miyatake, S., O'Garra, A., and Arai, N.
2000. GATA-3 induces T helper cell type 2 (Th2) cytokine expression and chromatin
remodeling in committed Th1 cells. J Exp Med 192:105.
4 Murphy, K. M., Ouyang, W., Farrar, J. D., Yang, J., Ranganath, S., Asnagli, H., Afkarian, M.,
and Murphy, T. L. 2000. Signaling and transcription in T helper development. Annu Rev
Immunol 18:451.
5 Berzins, S. P., Boyd, R. L., and Miller, J. F. 1998. The role of the thymus and recent thymic
migrants in the maintenance of the adult peripheral lymphocyte pool. J Exp Med 187:1839.
6 Thoman, M. L. 1995. The pattern of T lymphocyte differentiation is altered during thymic
involution. Mech Ageing Dev 82:155.
7 Zinkernagel, R. M., Moskophidis, D., Kundig, T., Oehen, S., Pircher, H., and Hengartner, H.
1993. Effector T-cell induction and T-cell memory versus peripheral deletion of T cells.
Immunol Rev 133:199.
8 Surh, C. D. and Sprent, J. 2000. Homeostatic T Cell Proliferation. How far can t cells be
activated to self-ligands? J Exp Med 192:F9.
9 Seymour, J. F., Lieschke, G. J., Grail, D., Quilici, C., Hodgson, G., and Dunn, A. R. 1997.
Mice lacking both granulocyte colony-stimulating factor (CSF) and granulocyte-macrophage
CSF have impaired reproductive capacity, perturbed neonatal granulopoiesis, lung disease,
amyloidosis, and reduced long-term survival. Blood 90:3037.
10 Mehr, R., Perelson, A. S., Fridkis-Hareli, M., and Globerson, A. 1997. Regulatory feedback
pathways in the thymus. Immunol Today 18:581.
Page 79
Implications of sharing cytokine receptor chains
59
11 Bix, M., Wang, Z. E., Thiel, B., Schork, N. J., and Locksley, R. M. 1998. Genetic regulation of
commitment to interleukin 4 production by a CD4(+) T cell-intrinsic mechanism. J Exp Med
188:2289.
12 Wakil, A. E., Wang, Z. E., Ryan, J. C., Fowell, D. J., and Locksley, R. M. 1998. Interferon
gamma derived from CD4(+) T cells is sufficient to mediate T helper cell type 1 development.
J Exp Med 188:1651.
13 Ma, X., Chow, J. M., Gri, G., Carra, G., Gerosa, F., Wolf, S. F., Dzialo, R., and Trinchieri, G.
1996. The interleukin 12 p40 gene promoter is primed by interferon gamma in monocytic
cells. J Exp Med 183:147.
14 Szabo, S. J., Dighe, A. S., Gubler, U., and Murphy, K. M. 1997. Regulation of the interleukin
(IL)-12R beta 2 subunit expression in developing T helper 1 (Th1) and Th2 cells. J Exp Med
185:817.
15 Mosmann, T. R. and Coffman, R. L. 1989. TH1 and TH2 cells: different patterns of
lymphokine secretion lead to different functional properties. Annu Rev Immunol 7:145.
16 Ouyang, W., Lohning, M., Gao, Z., Assenmacher, M., Ranganath, S., Radbruch, A., and
Murphy, K. M. 2000. Stat6-independent GATA-3 autoactivation directs IL-4-independent Th2
development and commitment. Immunity 12:27.
17 Gollob, K. J. and Coffman, R. L. 1994. A minority subpopulation of CD4+ T cells directs the
development of naive CD4+ T cells into IL-4-secreting cells. J Immunol 152:5180.
18 Bradley, L. M., Duncan, D. D., Tonkonogy, S., and Swain, S. L. 1991. Characterization of
antigen-specific CD4+ effector T cells in vivo: immunization results in a transient population
of MEL-14-, CD45RB- helper cells that secretes interleukin 2 (IL-2), IL-3, IL-4, and
interferon gamma. J Exp Med 174:547.
19 Launois, P., Maillard, I., Pingel, S., Swihart, K. G., Xenarios, I., Acha-Orbea, H., Diggelmann,
H., Locksley, R. M., MacDonald, H. R., and Louis, J. A. 1997. IL-4 rapidly produced by V
beta 4 V alpha 8 CD4+ T cells instructs Th2 development and susceptibility to Leishmania
major in BALB/c mice. Immunity 6:541.
20 Sugamura, K., Asao, H., Kondo, M., Tanaka, N., Ishii, N., Ohbo, K., Nakamura, M., and
Takeshita, T. 1996. The interleukin-2 receptor gamma chain: its role in the multiple cytokine
receptor complexes and T cell development in XSCID. Annu Rev Immunol 14:179.
21 Baird, A. M., Gerstein, R. M., and Berg, L. J. 1999. The role of cytokine receptor signaling in
lymphocyte development. Curr Opin Immunol 11:157.
22 Malek, T. R., Porter, B. O., and He, Y. W. 1999. Multiple gamma c-dependent cytokines
regulate T-cell development. Immunol Today 20:71.
Page 80
Implications of sharing cytokine receptor chains
60
23 Takeshita, T., Asao, H., Ohtani, K., Ishii, N., Kumaki, S., Tanaka, N., Munakata, H.,
Nakamura, M., and Sugamura, K. 1992. Cloning of the gamma chain of the human IL-2
receptor. Science 257:379.
24 Seder, R. A., Paul, W. E., Davis, M. M., and Fazekas de St Groth, B. 1992. The presence of
interleukin 4 during in vitro priming determines the lymphokine-producing potential of CD4+
T cells from T cell receptor transgenic mice. J Exp Med 176:1091.
25 Hsieh, C. S., Heimberger, A. B., Gold, J. S., O'Garra, A., and Murphy, K. M. 1992.
Differential regulation of T helper phenotype development by interleukins 4 and 10 in an alpha
beta T-cell-receptor transgenic system. Proc Natl Acad Sci U S A 89:6065.
26 Suzuki, H., Duncan, G. S., Takimoto, H., and Mak, T. W. 1997. Abnormal development of
intestinal intraepithelial lymphocytes and peripheral natural killer cells in mice lacking the IL-
2 receptor beta chain. J Exp Med 185:499.
27 Whitty, A., Raskin, N., Olson, D. L., Borysenko, C. W., Ambrose, C. M., Benjamin, C. D., and
Burkly, L. C. 1998. Interaction affinity between cytokine receptor components on the cell
surface. Proc Natl Acad Sci U S A 95:13165.
28 Russell, S. M., Keegan, A. D., Harada, N., Nakamura, Y., Noguchi, M., Leland, P.,
Friedmann, M. C., Miyajima, A., Puri, R. K., Paul, W. E., and et al. 1993. Interleukin-2
receptor gamma chain: a functional component of the interleukin-4 receptor [see comments].
Science 262:1880.
29 Minami, Y., Kono, T., Miyazaki, T., and Taniguchi, T. 1993. The IL-2 receptor complex: its
structure, function, and target genes. Annu Rev Immunol 11:245.
30 Grant, A. J., Roessler, E., Ju, G., Tsudo, M., Sugamura, K., and Waldmann, T. A. 1992. The
interleukin 2 receptor (IL-2R): the IL-2R alpha subunit alters the function of the IL-2R beta
subunit to enhance IL-2 binding and signaling by mechanisms that do not require binding of
IL-2 to IL-2R alpha subunit. Proc Natl Acad Sci U S A 89:2165.
31 Waldmann, T. A. 1989. The multi-subunit interleukin-2 receptor. Annu Rev Biochem 58:875.
32 Taniguchi, T. and Minami, Y. 1993. The IL-2/IL-2 receptor system: a current overview. Cell
73:5.
33 Roessler, E., Grant, A., Ju, G., Tsudo, M., Sugamura, K., and Waldmann, T. A. 1994.
Cooperative interactions between the interleukin 2 receptor alpha and beta chains alter the
interleukin 2-binding affinity of the receptor subunits. Proc Natl Acad Sci U S A 91:3344.
34 Kondo, M., Takeshita, T., Ishii, N., Nakamura, M., Watanabe, S., Arai, K., and Sugamura, K.
1993. Sharing of the interleukin-2 (IL-2) receptor gamma chain between receptors for IL-2 and
IL-4. Science 262:1874.
35 Damjanovich, S., Bene, L., Matko, J., Alileche, A., Goldman, C. K., Sharrow, S., and
Waldmann, T. A. 1997. Preassembly of interleukin 2 (IL-2) receptor subunits on resting Kit
Page 81
Implications of sharing cytokine receptor chains
61
225 K6 T cells and their modulation by IL-2, IL-7, and IL-15: a fluorescence resonance energy
transfer study. Proc Natl Acad Sci U S A 94:13134.
36 Robb, R. J., Greene, W. C., and Rusk, C. M. 1984. Low and high affinity cellular receptors for
interleukin 2. Implications for the level of Tac antigen. J Exp Med 160:1126.
37 Witherden, D., van Oers, N., Waltzinger, C., Weiss, A., Benoist, C., and Mathis, D. 2000.
Tetracycline-controllable selection of CD4(+) T cells: half-life and survival signals in the
absence of major histocompatibility complex class II molecules. J Exp Med 191:355.
38 Tanchot, C., Lemonnier, F. A., Perarnau, B., Freitas, A. A., and Rocha, B. 1997. Differential
requirements for survival and proliferation of CD8 naive or memory T cells. Science
276:2057.
39 Hemler, M. E., Brenner, M. B., McLean, J. M., and Strominger, J. L. 1984. Antigenic
stimulation regulates the level of expression of interleukin 2 receptor on human T cells. Proc
Natl Acad Sci U S A 81:2172.
40 Hazenberg, M. D., Stuart, J. W., Otto, S. A., Borleffs, J. C., Boucher, C. A., de Boer, R. J.,
Miedema, F., and Hamann, D. 2000. T-cell division in human immunodeficiency virus (HIV)-
1 infection is mainly due to immune activation: a longitudinal analysis in patients before and
during highly active antiretroviral therapy (HAART). Blood 95:249.
41 Morel, B. F., Burke, M. A., Kalagnanam, J., McCarthy, S. A., Tweardy, D. J., and Morel, P. A.
1996. Making sense of the combined effect of interleukin-2 and interleukin-4 on lymphocytes
using a mathematical model. Bull Math Biol 58:569.
42 Burke, M. A., Morel, B. F., Oriss, T. B., Bray, J., McCarthy, S. A., and Morel, P. A. 1997.
Modeling the proliferative response of T cells to IL-2 and IL-4. Cell Immunol 178:42.
43 Duprez, V. and Dautry-Varsat, A. 1986. Receptor-mediated endocytosis of interleukin 2 in a
human tumor T cell line. Degradation of interleukin 2 and evidence for the absence of
recycling of interleukin receptors. J Biol Chem 261:15450.
44 Duprez, V., Cornet, V., and Dautry-Varsat, A. 1988. Down-regulation of high affinity
interleukin 2 receptors in a human tumor T cell line. Interleukin 2 increases the rate of surface
receptor decay. J Biol Chem 263:12860.
45 Hemar, A., Subtil, A., Lieb, M., Morelon, E., Hellio, R., and Dautry-Varsat, A. 1995.
Endocytosis of interleukin 2 receptors in human T lymphocytes: distinct intracellular
localization and fate of the receptor alpha, beta, and gamma chains. J Cell Biol 129:55.
46 Galizzi, J. P., Zuber, C. E., Cabrillat, H., Djossou, O., and Banchereau, J. 1989. Internalization
of human interleukin 4 and transient down-regulation of its receptor in the CD23-inducible
Jijoye cells. J Biol Chem 264:6984.
Page 82
Implications of sharing cytokine receptor chains
62
47 Starr, R., Willson, T. A., Viney, E. M., Murray, L. J., Rayner, J. R., Jenkins, B. J., Gonda, T.
J., Alexander, W. S., Metcalf, D., Nicola, N. A., and Hilton, D. J. 1997. A family of cytokine-
inducible inhibitors of signalling. Nature 387:917.
48 Zamorano, J., Wang, H. Y., Wang, L. M., Pierce, J. H., and Keegan, A. D. 1996. IL-4 protects
cells from apoptosis via the insulin receptor substrate pathway and a second independent
signaling pathway. J Immunol 157:4926.
49 Santner-Nanan, B., Wagner, S., Wolf, M., Kneitz, B., Hunig, T., and Schimpl, A. 1998. In
vitro skewing of TCR transgenic CD4+ T cells from interleukin-2 deficient mice towards Th1
and Th2 in the absence of exogenous interleukin-2. Eur Cytokine Netw 9:17.
50 Schorle, H., Holtschke, T., Hunig, T., Schimpl, A., and Horak, I. 1991. Development and
function of T cells in mice rendered interleukin-2 deficient by gene targeting. Nature 352:621.
51 O'Garra, A. 1998. Cytokines induce the development of functionally heterogeneous T helper
cell subsets. Immunity 8:275.
52 Foucras, G., Gapin, L., Coureau, C., Kanellopoulos, J. M., and Guery, J. C. 2000. Interleukin
4-producing CD4 T cells arise from different precursors depending on the conditions of
antigen exposure in vivo. J Exp Med 191:683.
53 Cao, X., Shores, E. W., Hu-Li, J., Anver, M. R., Kelsall, B. L., Russell, S. M., Drago, J.,
Noguchi, M., Grinberg, A., Bloom, E. T., and et al. 1995. Defective lymphoid development in
mice lacking expression of the common cytokine receptor gamma chain. Immunity 2:223.
54 Kopf, M., Le Gros, G., Bachmann, M., Lamers, M. C., Bluethmann, H., and Kohler, G. 1993.
Disruption of the murine IL-4 gene blocks Th2 cytokine responses. Nature 362:245.
55 Li, X. C., Demirci, G., Ferrari-Lacraz, S., Groves, C., Coyle, A., Malek, T. R., and Strom, T.
B. 2001. IL-15 and IL-2: a matter of life and death for T cells in vivo. Nat Med 7:114.
56 Sadlack, B., Kuhn, R., Schorle, H., Rajewsky, K., Muller, W., and Horak, I. 1994.
Development and proliferation of lymphocytes in mice deficient for both interleukins-2 and -4.
Eur J Immunol 24:281.
57 Willerford, D. M., Chen, J., Ferry, J. A., Davidson, L., Ma, A., and Alt, F. W. 1995.
Interleukin-2 receptor alpha chain regulates the size and content of the peripheral lymphoid
compartment. Immunity 3:521.
58 Suzuki, H., Kundig, T. M., Furlonger, C., Wakeham, A., Timms, E., Matsuyama, T., Schmits,
R., Simard, J. J., Ohashi, P. S., Griesser, H., and et al. 1995. Deregulated T cell activation and
autoimmunity in mice lacking interleukin-2 receptor beta. Science 268:1472.
59 Sakaguchi, S. 2000. Regulatory T cells: key controllers of immunologic self-tolerance. Cell
101:455.
Page 83
Analysis of TCR engagement, triggering and down-modulation
63
3 Analysis of TCR engagement, triggering and down-
modulation
3
Analysis of TCR engagement,
triggering and down-modulation
Page 84
Analysis of TCR engagement, triggering and down-modulation
64
Page 85
Analysis of TCR engagement, triggering and down-modulation
65
3.1 A mathematical analysis of TCR serial triggering and down-regulation
A mathematical analysis of
TCR serial triggering and down-regulation
João SOUSA1,2 & Jorge CARNEIRO1
1. Instituto Gulbenkian de Ciência, Oeiras, Portugal
2. Grupo de Bioquímica e Biologia Teóricas, Instituto de Investigação Científica Bento da Rocha Cabral,
Lisboa, Portugal.
Summary
Despite the increasing knowledge on the pathways involved in TCR signal transduction and T cell
activation, the molecular mechanism of TCR triggering by ligand, MHC-peptide complexes, is still elusive
and controversial.
The present paper addresses the controversy on the early events of TCR engagement and triggering.
Mathematical modelling techniques are applied to experimental data to infer plausible molecular mechanisms
of TCR triggering and down-regulation. A similar approach has been followed by Bachmann et al. (Eur J
Immunol 1998, 28: 2571-9), who concluded that the TCR triggering requires the formation of MHC-TCR
dimers or trimers. We report here the failure to generalise this conclusion to the data reported by Valitutti et
al. (Nature 1995, 375: 148-51). We show that there are several kinetic features in these experimental curves
of TCR down-regulation that cannot be explained by the simple model proposed by Bachmann et al. unless
some phenomenological extensions are considered. These extensions are: 1) a ligand independent turnover of
the TCR; 2) a transient accumulation of triggered TCRs; 3) a high order of TCR triggering kinetics; and 4)
two pools of membrane TCRs in dynamic equilibrium.
Acknowledgements
The authors are indebted to Mlle. C. Brissac for many useful discussions at the beginning of this work. They
are grateful to J. Faro, K. Leon, and A. Coutinho for helpful comments and to J. Stewart for linguistic
revision of the manuscript. JC and JS are supported by Fundação para a Ciência e Tecnologia - Programa
Praxis XXI (fellowships BPD/11789/97 and BD/13546/97 respectively).
Page 86
Analysis of TCR engagement, triggering and down-modulation
66
Page 87
Analysis of TCR engagement, triggering and down-modulation
67
3.1.1 INTRODUCTION
Despite increasing knowledge of the signalling pathways involved in TCR signal
transduction and T cell activation (reviewed in [1]), the molecular mechanism of TCR
triggering by ligand is still elusive and controversial. Especially controversial is the
stoichiometry of TCR-ligand complexes that leads to TCR triggering by phosphorylation of
immunureceptor tyrosine activation motifs (ITAMs). Some authors suggest that the
formation of oligomers of TCRs (TCR cross-linking) is required for TCR phosphorylation,
while other authors suggest that TCR oligomerization is not required. Some structural
studies, in favour of TCR oligomerization, demonstrate the tendency of TCRs to associate
into clusters [2-4] and show that this association may be further stabilised upon MHC
ligation. Additionally, binding essays have shown that triggering of TCR requires dimers or
tetramers of ligand [5, 6]. Against the hypothesis of TCR oligomerization, it was shown
that a single MHC-peptide molecule of class I could trigger the TCRs on CD8+ T cells and
initiate signalling [7, 8]. Moreover, it was shown that T cells could be activated by fewer
than a hundred ligand molecules presented per APC [9-11]. For such a low density of
ligand, the formation of oligomers of TCR would be an improbable event [12] and
therefore the signal generated by TCR oligomerization would most likely be undetectable
by the cell. Another puzzling piece of evidence on TCR triggering was derived from
biophysical studies of the interaction of individual TCRs and MHC-peptide complexes.
These studies indicate that the affinities of the interaction are relatively low, namely in the
order of 10-5-10-6 M. Such low affinities are in apparent contradiction with the high
specificity and high sensitivity of T cells to low ligand presentation on APCs [9-11]. An
important contribution to understand this puzzle was provided by the model of serial
triggering of the TCR by ligand [11], which proposes that each ligand presented by an APC
is able to engage and trigger many TCRs, resulting in enough signalling events to activate a
T cell. The importance of TCR binding kinetics was further emphasised from comparative
studies of TCR agonist and altered peptide ligands, which have shown that the agonistic
properties of the ligands correlate with the affinity and off rates of binding to the TCR [13].
One of the limitations of the serial triggering model is that it neither proves nor disproves
the possible oligomerization of TCRs during the serial triggering process.
The goal of the present work is to contribute to the resolution of some of the
Page 88
Analysis of TCR engagement, triggering and down-modulation
68
controversy surrounding the molecular mechanism of TCR triggering. The main
assumption here is that the pathways leading to full T cell activation and to TCR down-
regulation share a very early set of molecular events, which bifurcate later. This assumption
is readily compatible with the observations that TCR down-regulation and full activation
are frequently correlated but that they can nevertheless be uncoupled [11, 14, 15].
Mathematical modelling techniques are used in this paper to infer plausible
mechanisms of TCR triggering and down-regulation at the molecular level, based on the
experimental data. A similar approach was used before by Bachmann et al. [12], who
concluded that TCR triggering requires the formation of MHC-TCR dimers or trimers. We
report here the failure in the attempt to generalise this conclusion to the data on TCR down-
regulation reported earlier by Valitutti et al. [11]. We show that there are several kinetic
features in these experimental curves of TCR down-regulation that cannot be explained by
the simple model proposed by Bachmann et al. [12] unless some phenomenological
extensions are considered.
3.1.2 RESULTS
3.1.2.1 Experimental data and model variables
We have modelled the experimental data of Valitutti et al. [11], which was read off
from the figures in the publication. To our knowledge this is the most complete data set
available in the literature. Briefly, the data was obtained from the following experimental
system: T cells were incubated with APCs (B cells transformed with the Epstein-Bar virus)
pulsed with two concentrations of peptide, 25 nM and 20 µM, which correspond to
approximately 76 and 8700 ligand molecules (MHC-peptide complexes) presented per
APC, respectively (extracted from fig. 3A from Valitutti et al [11]). The decrease in TCR
expression over time was measured by CD3 staining using FACS. We refer to these two
data sets as the low- and high-density kinetic data set (fig. 1A). The CD3 staining after five
hours of incubation of the T cells with APCs pulsed with different peptide concentrations
was also giving the data of fig 3B and 3A in the report of Valitutti et al. [11]. We refer to
this as the 5 hours data set (fig. 1B); together with the kinetic data sets it makes up the
complete data set to which different candidate models will be fitted.
In the following sections we will propose several mathematical models and obtain
the best fit to the complete data set (see Methods). The models are set up as a system of
Page 89
Analysis of TCR engagement, triggering and down-modulation
69
ordinary differential equations (ODE). The relative TCR and ligand densities (r.d.) are
calculated as density of molecules divided by the density of TCRs in a resting T cell. This
is appropriate because it allows a simple normalisation of the experimental data to the TCR
density at time zero. As in Bachmann et al. [12], we assumed that the TCR density per T
cell is proportional to the average intensity of the CD3 staining measured by FACS in the
population of T cells. There is more to be said about this assumption, which will be taken
up in the Discussion. For the sake of simplicity, it is assumed that the APC and the T cells
all have equal volumes and membrane areas.
3.1.2.2 TCR-dimerisation fails to explain the experimental data
Bachmann et al. [12] proposed a model for TCR down-regulation, which resulted from
an analysis of experimental curves obtained with relatively high ligand densities. Under
these conditions, when the rate of TCR down-regulation is plotted as a function of the
square of TCR density, an approximately linear relationship emerges [12]. Thus the down-
regulation of the TCR is an apparent second-order reaction. Bachmann et al. [12] derived
this second-order rate law using a simple model with mass action kinetics for the formation
of dimers of TCR-ligand complexes (TL), which upon productive dissociation would lead
to a triggered receptor (A) that would then be internalised.
T + Lkon →
koff← TL
2 TLkr → kd
← (TL)2ka→ 2 A + 2 L
A ki→
(1)
The second-order rate law was derived from this reaction scheme assuming that the
complexes of TCR and ligand are in a quasi steady state (for details see [12]). Thus, the
TCR dynamic is described by the following ordinary differential equation (ODE):
d [T]t
d t= −keff [T]t
2 L2 (2)
where [T]t is the concentration of membrane TCR at time t and keff is an aggregate rate
constant. Integration in time yields:
[T]t =[T]0
1 + t keff [L]2 [T]0 (3)
Page 90
Analysis of TCR engagement, triggering and down-modulation
70
100
50
0100
50
0100
50
0100
50
0100
50
00 100 200 300 10.001 0.01 0.1
%C
D3
Stai
ning
Time /min [ligand]
A
B
C
D
E
Figure 1 – Best fit of different models to the complete data set of Valitutti [11]. The left column shows the
kinetics of TCR down-regulation. The symbols are the experimental points obtained with low (diamonds)
and high (squares) ligand densities; the solid lines are the corresponding predictions of the model. The right
column shows the level of TCR down-regulation after 5 hours of conjugation with APC as a function of
ligand density. The symbols represent the experimental data (the diamond and square represent the last
time-point the kinetic data on the left); the lines represent the predictions of the model at five hours (solid)
and at the steady state (dashed) (only the solid line is drawn if both coincide). The models are: A –
Bachmann model [12], B – Extension showing a non-zero steady state, C – Extension showing
insensitivity to changes in ligand density, D – Extension showing ultrasensitivity in TCR triggering, E –
Extension with two TCR pools. See text for details. The parameters of the fittings are listed in Table 1.
Page 91
Anal
ysis
of T
CR
enga
gem
ent,
trig
geri
ng a
nd d
own-
mod
ulat
ion
71
Tab
le 1
– B
est f
it pa
ram
eter
s of t
he m
odel
s. Se
e th
e te
xt fo
r an
exp
lana
tion
of th
e un
its. T
he v
alue
s bet
wee
n pa
rent
hese
s ref
er to
the
conf
iden
ce in
terv
als o
f the
par
amet
ers,
estim
ated
follo
win
g th
e pr
oced
ure
expl
aine
d in
th
e m
etho
ds.
MO
DE
L A
Bac
hman
n et
al.
mod
el
[12]
MO
DE
L B
Non
-zer
o
stea
dy st
ate
MO
DE
L C
Inse
nsiti
vity
to c
hang
es in
lig
and
pres
enta
tion
MO
DE
L D
Ultr
a-se
nsiti
vity
of t
he
proc
ess o
f TC
R
trig
geri
ng
MO
DE
L E
Tw
o po
ols o
f TC
R w
ith
diffe
rent
trig
geri
ng
kin
etic
s
ka
839
r.d.-3
min
-1
4306
r.d.
-3 m
in-1
31
97 r.
d.-3
min
-1
1.4
x1012
r.d.
-9 m
in-1
1.
5 x1
012 r.
d.-9
min
-1
(2
.20×
101 —
2.02
×104 )
( 0 —
6.8
4×10
4 ) (1
.03×
103 —
1.32
×104 )
(2.9
5×10
11—
1.1
0×10
13)
(5.7
9×10
11—
4.6
8×10
12)
s /m
in-1
-
0.01
6 0.
0041
0.
0031
0.
0011
(0—
3.0
2×10
-1)
(1.8
6×10
-3—
6.5
4×10
-3)
(1.5
1×10
-3—
4.8
2×10
-3)
(3.3
7×10
-4—
1.9
2×10
-3)
k i /m
in-1
-
- 0.
043
0.03
6 0.
094
(2
.85×
10-2
— 7
.56×
10-2
) (2
.64×
10-2
— 5
.48×
10-2
) (5
.74×
10-2
— 2
.49×
10-1
)
h -
- -
5 5
( > 4
.7)
( > 4
.8)
φ /m
in-1
-
- -
- 0.
0055
(4
.14×
10-3
— 7
.80×
10-3
)
θ -
- -
- 61
%
(5
7%—
66%
)
χ2
2.11
1.
67
0.25
0 0.
142
0.04
4
Page 92
Analysis of TCR engagement, triggering and down-modulation
72
The first question we ask here is whether this simple model is also able to fit the data
of Valitutti et al. [11], assuming that the TCR density ([T]t) is equal to the percentage of
CD3 ([T]t≡%CD3). The model can be appropriately fitted to the kinetics of down-
regulation induced by high ligand density, supporting the previous suggestion of Bachmann
et al. [12]. However, the attempt to describe the complete data set revealed two
shortcomings of the model (fig.1A and fig. 2). First, the apparent linear dependence of the
rate of TCR down-regulation on the square of the TCR density does not hold for the low
ligand density (fig. 2). The non-linearity emerges from the simple fact that the TCR down-
regulation stops before all the TCRs have been internalised (this can be inferred from fig. 2,
but also in fig. 1.A from [16]). This observation is in clear opposition with eqn. 2, which
predicts that for any positive ligand density, the down-regulation stops only when all the
TCRs have been internalised.
0.06
0.04
0.02
00 25 50 75 100
(%CD3)2 Figure 2 – Bachmann plot of the data of Valitutti et al [11]. The rate of TCR down-regulation, as a function
of the square of TCR density, is linear for the higher dose (squares) but not for the lower dose (diamonds)
of ligand. The solid and dashed lines are respectively the derivatives of the best fit kinetics of the
Bachmann model (fig.1A-left) and the last extension (fig.1E-left).
The second shortcoming of the model is that it predicts that the rate of TCR down-
regulation is proportional to the square of ligand density. This is in clear contrast with the
initial rates of approximately -0.01 and -0.03 r.d. min-1 observed for low and high ligand
densities, respectively.
We tried to identify features of TCR dynamics that will overcome these limitations. In
the following sections we derive and discuss four extension to this model.
Page 93
Analysis of TCR engagement, triggering and down-modulation
73
3.1.2.3 Non zero steady-state resulting from ligand independent TCR- turnover
The T cell maintains a dynamic pool of membrane TCRs, by continuous de novo
expression and random internalisation and degradation. Mathematically, this can be
expressed as a simple turnover:
d [T]t
d t= s 1− [T]t( ) (4)
where s is the relative number of new TCRs expressed on the cell membrane per minute,
i.e. turnover rate. Adding the right hand side of eqn. 4 to the right hand side of eqn.2 we
obtain our first extension of the model of Bachmann et al. [12]
d [T]t
d t= s 1− [T]t( )− keff [L]2 [T]t
2 (5)
This model predicts a non-zero steady state TCR density in the presence of ligand.
Equation 5 was integrated numerically and fitted to the individual kinetic curves of TCR
down-regulation. However, because eqn. 5 still predicts a dependence of the rate of TCR
down-regulation with the square of ligand density, it still fails to fit the complete data set
(fig.1B). Nevertheless, this extension was sufficient to permit the model to fit the 5 hours
data set alone (data not shown).
3.1.2.4 Insensitivity to changes in ligand density results from a transient
accumulation of a pool of triggered TCRs
The second-order rate of TCR down-regulation results from assuming that triggered TCRs
are immediately internalised [12]. Our second modification to the model of Bachmann et
al. [12] results from relaxing this assumption. The process of internalisation of triggered
TCRs is now treated independently and not lumped together with the dimerisation and
triggering processes. This gives rise to a pool of triggered TCRs with dynamic described
by:
d [A]t
d t= keff [L]2 [T]t
2 − ki[A]t (6)
where [A]t is the concentration of triggered TCR at time t and ki is the internalisation rate
constant. The down-regulation of TCR is represented by the second term in eqn. 6, −ki[A]t .
The same reaction diagram is now translated into a system of two ODEs, composed of eqn.
5 and eqn. 6. The dynamic of total CD3 staining is represented by the sum of the two TCR
pools (obtained by adding eqns. 5 and 6), i.e. %CD3 ≡ [T]t + [A]t.
By the inclusion of a pool of triggered TCRs, the rate of TCR down-regulation will be
Page 94
Analysis of TCR engagement, triggering and down-modulation
74
distinct from the rate of TCR triggering. The rate of TCR down-regulation will no longer be
proportional to [L]2. Under some parameter regimes in which it is limited by the rate of
internalisation, which can not exceed ki [T]0.
The fitting of this model to the complete data set (Fig 1C) is better than the previous
models. The fitting parameters (Table 1) are such that the rate of down-regulation is much
slower than the rate of triggering and consequently a significant pool of triggered TCRs
accumulates transiently in the cell membrane. For the high ligand density practically all the
available TCRs are triggered within a few minutes.
3.1.2.5 TCR-triggering is ultrasensitive to ligand and TCR densities
The kinetics of TCR triggering can be generalised by substituting the second-order kinetics
in both receptor and ligand densities with an analogous term with a kinetic order h.
d [T]t
dt= s (1 − [T]t) − keff [T]t
h[L]h (7)
d [A]t
d t= keff [T]t
h [L]h − ki[A]t (8)
The fitting of the model to the experimental curves progressively improves as the
kinetic order increases and is most noticeable in the initial phase of the kinetics, i.e. within
the first 50 minutes. The “best fit” is obtained with a rate law of kinetic order h equal or
greater than 5 (fig.1D); higher values do not cause a noticeable qualitative improvement in
the fitting. Also the greater the value of h the greater the value of keff, following the relation
keff ∝ kh, with k constant.
The sensitivity of the model to receptor and ligand densities increases as the kinetic
order of TCR triggering increases. Small changes in either ligand or receptor will lead to
large changes in the rate of triggering. Mathematically,
∂ log keff Lh [T]t
h( )∂ log X( )
= h With X = L,[T]t (9)
This logarithmic sensitivity to L or T means that increasing the ligand presentation in,
for example, 10% with a co-operativity of 4 will lead to an increase in the rate of TCR
triggering of 10000 %.The effect of this ultra-sensitivity of TCR triggering on the overall
rate of TCR down-regulation is most marked for low ligand densities, since for high ligand
densities the internalisation rate of triggered TCRs will mask it.
Close examination of the experimental data indicates that the rate of TCR down-
regulation is biphasic. Initially fast and dependent on MHC, the rate slows down after 50
Page 95
Analysis of TCR engagement, triggering and down-modulation
75
minutes of incubation. In the slower phase the curves for high and low densities appear as
two parallel lines, suggesting that the later is virtually independent of MHC-density. The
second phase is not captured by any of the models we have presented so far, and has
prompted yet another extension to the model of Bachmann et al. [12].
3.1.2.6 Two pools of membrane TCR with different triggering kinetics explain
biphasic kinetics of down-regulation
A reasonable interpretation of the two phases in TCR down-regulation is that at the surface
of the T cell there are two pools of TCR. Only one of these pools, which we call the
‘interface’ pool, has access to the ligand. The second pool, which we call the ‘spare’ pool,
has no access to the ligand but is in dynamic equilibrium with the interface pool. The model
equations are:
d [S]t
dt= −λϕ [S]t − [T]t( )+ s(1− [S]t)
d [T]t
dt= ϕ [S]t − [T]t( )+ s(1 − [T]t) − keff [T]t
h [L]h
(10)
d [A]t
d t= keff [T]t
h [L]h − ki [A]t
where [T]t and [S]t are the densities of TCR in the interface pool and in the spare pool,
respectively; ϕ is the exchange rate constant and λ is a ratio between the areas of the
interface over the spare pool. The variables are now mapped to the experimental
measurements by %CD3 ≡ [S]t / (λ+1) + ([T]t +[A]t) λ/(λ+1).
The best fit to the complete data set obtained with this model is the only one that
explains both initial and late kinetics of TCR down-regulation (fig. 1E). The parameters
(Table 1) indicate that the exchange rate of TCRs between the interface and the spare pools
is slower than the TCR triggering and internalisation reactions. The rate of TCR turnover is
the slowest of the reactions, and is consistent with the observation by Valitutti et al. ([11];
Valitutti, personal communication) that the recovery of normal TCR levels takes several
days after the T cells are separated from APCs.
The biphasic characteristics of the kinetics of TCR down-regulation can be better
understood using two approximations to the model. In the first approximation we set to
zero the exchange rate φ obtaining results comparable to the previous model. In the second
approximation we assume that reactions in the interface are in quasi-steady state, setting
d[A]t/dt=0 and d[T]t/dt=0 in eqn. 10 and solving these equations numerically. In this case,
Page 96
Analysis of TCR engagement, triggering and down-modulation
76
the internalisation of TCR is limited by the TCR exchange rate, and only the slow rate of
TCR down-regulation is present. These two limit conditions of the model actually
correspond to the asymptotic kinetics of down regulation (fig. 3).
100
50
00 100 200 300
Time /min
a
a
b
b
Figure 3 – Distribution of TCR molecules between interface and spare pools explains two phases in the
kinetics of TCR down-regulation (see text for details). Curves a assume that the exchange rate constant is
zero. Curves b assume that the all the reactions except the exchange of TCRs are in quasi-steady state. The
solid line is the same as in fig.1D-left.
3.1.3 DISCUSSION
The kinetics of TCR down regulation is complex and requires the formulation of complex
kinetic models to reproduce the experimental results. As was shown by Bachmann et al.
[12] a simple mass action kinetic model, without cross-linking of TCRs, cannot reproduce
the kinetics of TCR down-regulation. These authors proposed instead a simple TCR cross-
linking model that can explain their experimental data of TCR down-regulation.
Comparison of the results of the TCR cross-linking model with the experimental data of
Valitutti et al. [11], who measured TCR down-regulation using a broader interval of ligand
presentation, revealed some shortcomings of this model. The most important problem is the
prediction that the rate of TCR down-regulation is proportional to [T]2 and to [L]2, which is
not supported by the experimental data by Valitutti et al. [11]. Our attempts to resolve this
limitation lead us to introduce a series of phenomenologic extensions to the simple model
of Bachmann et al.
Although the four extensions were presented in order, they are almost independent in
respect to the contribution of each to the fitting of the data. This means that adding just a
subset of these extensions, for example hypersensitivity, to the original model of Bachmann
Page 97
Analysis of TCR engagement, triggering and down-modulation
77
et al. does not produce a good fit to the experimental data. Several alternate extensions or
mechanisms were tested but the results were not satisfactory, thus we believe that this set of
extensions is the only one that is able to fit all the experimental data and is biologically
reasonable. The major criticism to this conclusion is the robustness of the experimental
data, which consists in few sparse points.. This problem may be minimised considering that
the kinetics of TCR triggering have been reproduced qualitatively in a number of different
experimental systems (see for example [16-19]).
The biology underlying the four assumptions, the fitting parameters and the
implications of the final comprehensive model deserves further discussion. T cells have a
basal turnover of membrane TCR that was modelled with a simple ligand independent term.
This is a simplification of the biological processes regulating TCR levels on T cells, the
most important of which is probably the phosphorylation by PKC of a leucine-based
internalisation motif in the CD3γ chain [20]. Although PKC can be activated following
TCR triggering [21], it does not seem to interfere with the extent of ligand-dependent TCR
down-regulation [22], so it was neglected in the models.
Contrary to Bachmann et al. [12], we did not assume that the rate of TCR
internalisation is practically instantaneous (i.e. much faster than the rate of TCR triggering).
According to the parameters of the final model E, in Table 1, the internalisation of triggered
TCRs has rate constants that imply a half-life of about 7 minutes. This result is supported
by the report that membrane TCRs in T cells constitutively expressing active lck (thus
presumably having constitutive triggering of the TCR) have an approximate half-life of 5-
10 minutes [23]. This constitutes evidence that triggered TCRs may accumulate transiently
in the membrane of T cells conjugated with APC. Interestingly, the model predicts that
triggered TCRs accumulate as a pool for about 50 min, providing a time window for
activation of down-stream signal transduction pathways.
Two pools of TCR with different access to ligand explain the two phases in the
kinetics of TCR down-regulation. The most straightforward interpretation for these pools
would be to assume that the interface pool contains the TCRs located in the contact area
between the T cell and the APC and the spare pool contains the remaining TCRs. If it were
assumed that the exchange of TCRs is simple passive diffusion then, according to our
results, more than 60% of the T cell membrane would be in contact with the APC, which is
an overestimate of the reported contact area of 20-30%. This discrepancy might be due to
the complexity of the dynamic of TCRs in the membrane, which involves cytoskeleton-
Page 98
Analysis of TCR engagement, triggering and down-modulation
78
dependent active transport [24, 25]. It is possible that there is an area (greater than the
contact area between APC and T cell) that acts as a sink for TCRs being actively
transported to the contact area. This would be coherent with the recent study of the
“immunological synapse” [24] that shows that T cells are able to concentrate up to 100 fold
the ligand on the contact area.
Another interpretation of the interface and spare pools involves membrane rafts. Rafts
are stable membrane micro-domains containing co-receptor molecules and signal
transduction components [26]. Thus it is possible that the TCRs triggered and down
regulated in the first phase are already integrated in the rafts [27]. The second phase of the
kinetics of down-regulation would correspond to either diffusion or transport of the
remaining TCRs into rafts [27, 28]. Therefore, in T cells such as the ones used in Valitutti
et al., more than 60% of the membrane TCRs would be in rafts.
Direct comparison of the kon and affinities predicted by the model with the
experimental data in the literature is not possible. In the model, the binding of the TCR to
the ligand occurs between two molecules bound to two membranes, whereas in the binding
experiments, the binding reaction occurs in a liquid-solid interface. The importance of kon
to the triggering of the TCR is, however, minimised by the fact that agonist properties of
peptides are mainly defined by the koff [13].
The koff predicted by the model (100 min-1, Table 2) , which can be directly compared
to experimental measurements, is higher than the reported values of about 2-4 min-1 [13,
29]. This discrepancy may be due to steric constraints inherent to the APC-T cell contact
gap. The ligand and the TCR are relatively short compared with adhesion molecules and
thus it is conceivable that the stability of the complex is reduced [30]. Another, perhaps
more simple, justification for an overestimation of the koff by the models is that during TCR
triggering and down-regulation there might be some bystander down-regulation of non-
triggered TCRs [31].
For comparison between the model and the experimental results we assumed that TCR
density is proportional to the intensity of CD3 staining. However, several groups have
published data of TCR down-regulation as a function of measured ligand density [11, 15,
16]. In some of these reports, the amount of TCR down regulated after a fixed period of
time seems to be a linear function of the logarithm of ligand density [11, 15]. In other cases
this linearity is not observed [11, 16] and the curves are similar to the ones in fig. 1. This
may therefore represent a weakness of the models since none of them shows this linearity.
Page 99
Analysis of TCR engagement, triggering and down-modulation
79
Clearly further investigation into this matter is required.
The requirement for a high kinetic order, or high co-operativity, that leads to ultra-
sensitivity in the TCR triggering process indicates that it might be a complex mechanism
involving several steps. The most straightforward candidate for this complex mechanism is
the formation of high-order TCR-ligand oligomers. Under certain conditions, namely the
ones where the oligomer concentration are in quasi-steady state, it is possible to map the
kinetic order of TCR triggering to the stoichiometry of receptor-ligand oligomers (not
shown). A general difficulty inherent to oligomerization mechanisms is that the formation
of the final triggering complex requires the several intermediates which introduces a delay.
As the lateral diffusion of complexes imposes an upper limit to the rate constants of
oligomerization [32], the delay in the formation of the oligomers must be lower bounded.
Thus, oligomerization may be incompatible with our result that most of the TCRs in the
interface are triggered within the first minutes after APC-T cell conjugation.
Oligomerization is not the only mechanism that could explain the ultra-sensitivity of
TCR triggering. The TCR is triggered by a complex mechanism that involves kinases and
phosphatases acting on the same substrate [1]. Interestingly, Koshland and Goldbetter [33]
have proposed a generic mechanism that can explain very high sensitivities in kinase-
phosphatase cycles. Several such cycles have been identified in early TCR signalling.
Examples are the phosphorylation/dephosphorylation of ITAMs in CD3 chains by lck and
possibly CD45 [34, 35] or are the regulation of Zap-70 by lck and a phosphatase [36, 37],
possibly SHP-1 [38]. Similarly to oligomerization mechanisms, kinase/phosphatase cycles
also imply several reaction steps that could introduce delays. However, at variance with
TCR oligomerization that requires lateral diffusion of the TCR-ligand complexes, these
reaction steps may be some kind of “intramolecular reactions” between signalling
molecules pre-assembled with the right stoichiometry in rafts. Eventually, oligomerization
and kinase/phosphatase cycles predict different kinetic properties of TCR triggering which
may be confronted with experimental data using a similar methodology to the one
employed here. We address this issue elsewhere (submitted) showing that the requirement
for high-order oligomers in TCR triggering is unrealistic at least for the lower densities of
ligand presentation.
In conclusion, the detailed kinetics of TCR down-regulation as a function of ligand
density impose tight constraints on any hypothetical mechanisms for the early events of
TCR signalling. These constraints provide an excellent source of information to test, and
Page 100
Analysis of TCR engagement, triggering and down-modulation
80
eventually reject, alternative hypotheses. In this sense, the most promising quantitative
feature of TCR triggering revealed by our analysis is that the early events of ligand-
dependent triggering of the TCR are very fast and ultra-sensitive to changes in both the
densities of TCR and ligand at the interface between the co-operating cells. Candidate
models of TCR triggering should be confronted with these findings.
3.1.4 METHODS
Mathematical models are set up as systems of ODE. The ODE systems are integrated
numerically using the program Mathematica (R), except for a few particular cases that have
analytical solutions and were identified.
The different models were fitted to the complete experimental data set, containing both
the kinetic data and 5 hours data. The parameter space was explored using the routine
amoeba.c, described in Press et al. [39]. Numerical integration of the ODE systems for
the fits was done with the implicit Bulirsch-Stoer method using the routine bsstep.c,
described in Press et al. [39]. The criterion for optimisation of the parameters of the models
was the minimisation of χ2. All the data points in the complete experimental data set were
given equal weight in the fits. Many starting parameter sets were tested for each model to
avoid local minima.
There are no proper statistical procedures to estimate confidence intervals of
parameters in non-linear models. To estimate the confidence intervals of the fitting
parameters we adopted, pragmatically, the standard procedure for linear models. Let P be
the number of parameters in the model, N the number of experimental points, ρi is the best
fit value of this parameter. The 95% confidence interval defined by [ρi-∆-, ρi+∆+] fulfils the
following conditions:
F(0.05, N − P−1, N− P) =χρi +∆ +
2
χmin2 and F(0.05, N − P−1, N− P) =
χρi −∆ −
2
χmin2 (10)
Where F is the F distribution. We solve numerically equations 10 for ∆+ and ∆- for
each parameter (all others remaining fixed).
3.1.5 REFERENCES
1 Germain, R. N. and Stefanova, I., The dynamics of T cell receptor signaling: complex
orchestration and the key roles of tempo and cooperation. Annu Rev Immunol,1999. 17: 467-
522.
Page 101
Analysis of TCR engagement, triggering and down-modulation
81
2 Brown, J. H., Jardetzky, T. S., Gorga, J. C., Stern, L. J., Urban, R. G., Strominger, J. L.
and Wiley, D. C., Three-dimensional structure of the human class II histocompatibility
antigen HLA-DR1. Nature,1993. 364: 33-9.
3 Garboczi, D. N., Ghosh, P., Utz, U., Fan, Q. R., Biddison, W. E. and Wiley, D. C.,
Structure of the complex between human T-cell receptor, viral peptide and HLA-A2.
Nature,1996. 384: 134-41.
4 Fields, B. A., Ober, B., Malchiodi, E. L., Lebedeva, M. I., Braden, B. C., Ysern, X., Kim,
J. K., Shao, X., Ward, E. S. and Mariuzza, R. A., Crystal structure of the V alpha domain of
a T cell antigen receptor. Science,1995. 270: 1821-4.
5 Boniface, J. J., Rabinowitz, J. D., Wulfing, C., Hampl, J., Reich, Z., Altman, J. D.,
Kantor, R. M., Beeson, C., McConnell, H. M. and Davis, M. M., Initiation of signal
transduction through the T cell receptor requires the multivalent engagement of peptide/MHC
ligands. Immunity,1998. 9: 459-66.
6 Reich, Z., Boniface, J. J., Lyons, D. S., Borochov, N., Wachtel, E. J. and Davis, M. M.,
Ligand-specific oligomerization of T-cell receptor molecules. Nature,1997. 387: 617-20.
7 Delon, J., Gregoire, C., Malissen, B., Darche, S., Lemaitre, F., Kourilsky, P., Abastado, J.
P. and Trautmann, A., CD8 expression allows T cell signaling by monomeric peptide-MHC
complexes. Immunity,1998. 9: 467-73.
8 Sykulev, Y., Joo, M., Vturina, I., Tsomides, T. J. and Eisen, H. N., Evidence that a single
peptide-MHC complex on a target cell can elicit a cytolytic T cell response. Immunity,1996. 4:
565-71.
9 Demotz, S., Grey, H. M. and Sette, A., The minimal number of class II MHC-antigen
complexes needed for T cell activation. Science,1990. 249: 1028-30.
10 Harding, C. V. and Unanue, E. R., Quantitation of antigen-presenting cell MHC class
II/peptide complexes necessary for T-cell stimulation. Nature,1990. 346: 574-6.
11 Valitutti, S., Muller, S., Cella, M., Padovan, E. and Lanzavecchia, A., Serial triggering of
many T-cell receptors by a few peptide-MHC complexes. Nature,1995. 375: 148-51.
12 Bachmann, M. F., Salzmann, M., Oxenius, A. and Ohashi, P. S., Formation of TCR
dimers/trimers as a crucial step for T cell activation. Eur J Immunol,1998. 28: 2571-9.
13 Kersh, G. J., Kersh, E. N., Fremont, D. H. and Allen, P. M., High- and low-potency ligands
with similar affinities for the TCR: the importance of kinetics in TCR signaling.
Immunity,1998. 9: 817-26.
14 Salio, M., Valitutti, S. and Lanzavecchia, A., Agonist-induced T cell receptor down-
regulation: molecular requirements and dissociation from T cell activation. Eur J
Immunol,1997. 27: 1769-73.
Page 102
Analysis of TCR engagement, triggering and down-modulation
82
15 Viola, A. and Lanzavecchia, A., T cell activation determined by T cell receptor number and
tunable thresholds. Science,1996. 273: 104-6.
16 Itoh, Y., Hemmer, B., Martin, R. and Germain, R. N., Serial TCR engagement and down-
modulation by peptide:MHC molecule ligands: relationship to the quality of individual TCR
signaling events. J Immunol,1999. 162: 2073-80.
17 Viola, A., Salio, M., Tuosto, L., Linkert, S., Acuto, O. and Lanzavecchia, A., Quantitative
contribution of CD4 and CD8 to T cell antigen receptor serial triggering. J Exp Med,1997.
186: 1775-9.
18 Valitutti, S., Muller, S., Salio, M. and Lanzavecchia, A., Degradation of T cell receptor
(TCR)-CD3-zeta complexes after antigenic stimulation [see comments]. J Exp Med,1997. 185:
1859-64.
19 Stotz, S. H., Bolliger, L., Carbone, F. R. and Palmer, E., T cell receptor (TCR) antagonism
without a negative signal: evidence from T cell hybridomas expressing two independent TCRs.
J Exp Med,1999. 189: 253-64.
20 Dietrich, J., Hou, X., Wegener, A. M. and Geisler, C., CD3 gamma contains a
phosphoserine-dependent di-leucine motif involved in down-regulation of the T cell receptor.
Embo J,1994. 13: 2156-66.
21 Weiss, A. and Littman, D. R., Signal transduction by lymphocyte antigen receptors.
Cell,1994. 76: 263-74.
22 Lauritsen, J. P., Christensen, M. D., Dietrich, J., Kastrup, J., Odum, N. and Geisler, C.,
Two distinct pathways exist for down-regulation of the TCR. J Immunol,1998. 161: 260-7.
23 D'Oro, U., Vacchio, M. S., Weissman, A. M. and Ashwell, J. D., Activation of the Lck
tyrosine kinase targets cell surface T cell antigen receptors for lysosomal degradation.
Immunity,1997. 7: 619-28.
24 Grakoui, A., Bromley, S. K., Sumen, C., Davis, M. M., Shaw, A. S., Allen, P. M. and
Dustin, M. L., The immunological synapse: a molecular machine controlling T cell activation.
Science,1999. 285: 221-7.
25 Valitutti, S., Dessing, M., Aktories, K., Gallati, H. and Lanzavecchia, A., Sustained
signaling leading to T cell activation results from prolonged T cell receptor occupancy. Role of
T cell actin cytoskeleton. J Exp Med,1995. 181: 577-84.
26 Xavier, R. and Seed, B., Membrane compartmentation and the response to antigen. Curr Opin
Immunol,1999. 11: 265-9.
27 Moran, M. and Miceli, M. C., Engagement of GPI-linked CD48 contributes to TCR signals
and cytoskeletal reorganization: a role for lipid rafts in T cell activation. Immunity,1998. 9:
787-96.
Page 103
Analysis of TCR engagement, triggering and down-modulation
83
28 Xavier, R., Brennan, T., Li, Q., McCormack, C. and Seed, B., Membrane
compartmentation is required for efficient T cell activation. Immunity,1998. 8: 723-32.
29 Corr, M., Slanetz, A. E., Boyd, L. F., Jelonek, M. T., Khilko, S., al-Ramadi, B. K., Kim,
Y. S., Maher, S. E., Bothwell, A. L. and Margulies, D. H., T cell receptor-MHC class I
peptide interactions: affinity, kinetics, and specificity. Science,1994. 265: 946-9.
30 Shaw, A. S. and Dustin, M. L., Making the T cell receptor go the distance: a topological view
of T cell activation. Immunity,1997. 6: 361-9.
31 San Jose, E., Borroto, A., Niedergang, F., Alcover, A. and Alarcon, B., Triggering the TCR
complex causes the downregulation of nonengaged receptors by a signal transduction-
dependent mechanism. Immunity,2000. 12: 161-70.
32 Salzmann, M. and Bachmann, M. F., Estimation of maximal affinities between T-cell
receptors and MHC/peptide complexes. Mol Immunol,1998. 35: 65-71.
33 Koshland, D. E., Jr., Goldbeter, A. and Stock, J. B., Amplification and adaptation in
regulatory and sensory systems. Science,1982. 217: 220-5.
34 Furukawa, T., Itoh, M., Krueger, N. X., Streuli, M. and Saito, H., Specific interaction of
the CD45 protein-tyrosine phosphatase with tyrosine-phosphorylated CD3 zeta chain. Proc
Natl Acad Sci U S A,1994. 91: 10928-32.
35 Hegedus, Z., Chitu, V., Toth, G. K., Finta, C., Varadi, G., Ando, I. and Monostori, E.,
Contribution of kinases and the CD45 phosphatase to the generation of tyrosine
phosphorylation patterns in the T-cell receptor complex zeta chain. Immunol Lett,1999. 67: 31-
9.
36 Scharenberg, A. M., Lin, S., Cuenod, B., Yamamura, H. and Kinet, J. P., Reconstitution
of interactions between tyrosine kinases and the high affinity IgE receptor which are controlled
by receptor clustering. Embo J,1995. 14: 3385-94.
37 Mege, D., Di Bartolo, V., Germain, V., Tuosto, L., Michel, F. and Acuto, O., Mutation of
tyrosines 492/493 in the kinase domain of ZAP-70 affects multiple T-cell receptor signaling
pathways. J Biol Chem,1996. 271: 32644-52.
38 Brockdorff, J., Williams, S., Couture, C. and Mustelin, T., Dephosphorylation of ZAP-70
and inhibition of T cell activation by activated SHP1. Eur J Immunol,1999. 29: 2539-50.
39 Press, W. H., Teukolsky, S. A., Vetterling, W. T. and Flannery, B. P., Numerical Recepies
in C: the art of scientific computing, 2 Edn., Cambrige University Press 1997.
Page 104
Analysis of TCR engagement, triggering and down-modulation
84
Page 105
Analysis of TCR engagement, triggering and down-modulation
85
3.2 On the requirement for high cooperativity in TCR triggering:
hypothetical mechanisms of TCR triggering.
Modeling the hypersensitivity of TCR triggering:
Coordination of alternate Triggering mechanisms.
João SOUSA1,2 & Jorge CARNEIRO1 1. Instituto Gulbenkian de Ciência, Oeiras, Portugal
2. Grupo de Bioquímica e Biologia Teóricas, Instituto de Investigação Científica Bento da Rocha Cabral,
Lisboa, Portugal.
Summary
Despite the increasing knowledge on the pathways involved in TCR signal transduction and T cell
activation, the molecular mechanism of TCR triggering by ligand, MHC-peptide complexes, is still elusive
and controversial. Central in this controversy is the stoichiometry of TCR-ligand complexes required for TCR
triggering. Using mathematical modeling we explore the qualitative and quantitative consequences for TCR
down modulation of some of the possible mechanisms of TCR triggering. We propose that both TCR
triggering by homo crosslinking of TCR-ligand complexes and TCR triggering by TCR-ligand crosslinking
with on co-receptor molecules are possible, albeit with different antigen dose dependences.
Acknowledgements:
José Faro for discussion and manuscript revision and Zvi Grossman for discussion of the work.
Page 106
Analysis of TCR engagement, triggering and down-modulation
86
Page 107
Analysis of TCR engagement, triggering and down-modulation
87
3.2.1 INTRODUCTION
The most important aspect of the activation of T cells is the recognition by the T cell
antigen receptor (TCR) of its ligand, the MHC-peptide complexes on the membrane of the
antigen-presenting cell (APC). Considerable progress has been made in the study of the
signalling events downstream of TCR triggering and engagement [1] but the mechanism of
TCR triggering still remains elusive and controversial. Central in the controversy is the
question if dimerisation (or formation of higher order complexes) is a necessary condition
for TCR triggering.
Indirect evidence in favour of the necessity of TCR oligomerization for triggering
came from structural studies suggesting the propensity of MHC molecules to dimerize [2-
4], from binding assays [5, 6] and from mathematical modelling [7, 8]. But the
interpretation of these observations is controversial [9], and ligand-dependent TCR
oligomerization is difficult to reconcile with the observations that T cells respond to very
low densities of their natural ligands (estimates range from 1 peptide per APCs for CD8 T
cells [10, 11] and 50-100 peptides for CD4 T cells [12, 13]), since under these conditions
multimolecular encounters should be highly disfavoured [14].
Elucidation of the initial events of TCR triggering has failed to resolve this
controversy. The earliest events identified in TCR triggering are ITAM phosphorylation by
Src kinases [15]. The Src kinases activity on the TCR complex might be the consequence of
the recruitment of these enzymes to eventual binding domains formed upon TCR
oligomerization, of the exposure of phosphorylation sites by ligand-induced conformational
change [16], of the exclusion of CD45 from the vicinity of TCR complexes [17], or of the
recruitment of CD4 or CD8 co-receptors [18-20] pre-associated with lck [21]. These later
hypotheses suggest that TCR oligomerization may be sufficient but not being necessary for
TCR triggering.
Mathematical analysis of the kinetics of TCR triggering and down-modulation as a
function of ligand presentation allowed the identification of a number of kinetic constraints
on the mechanism of TCR triggering [22]. The most salient of these constraints is the
requirement for hypersensitivity of TCR triggering to both receptor and ligand densities. In
this report we address the question if TCR oligomerization is a necessary condition to
describe these kinetic properties of TCR triggering by comparing a simple TCR-ligand
oligomerization model with a model of TCR triggering based in CD4-lck crosslinking with
Page 108
Analysis of TCR engagement, triggering and down-modulation
88
single TCR-ligand complexes (the TCR-SAC crosslinking model).
3.2.2 RESULTS
3.2.2.1 Kinetic analysis of TCR triggering
A previous analysis of the kinetics of TCR down modulation [22] indicated that TCR
triggering is a highly co-operative process, a consequence of the ligand dose dependence
and sensitivity to low ligand presentations of TCR down-modulation [12, 13]. The
requirement for high cooperativity is indicative that TCR triggering is a complex
mechanism, possibly with several inter-playing factors and intermediates. The model was
formulated using several extensions to the simple Bachmann et al. model of TCR
engagement and down modulation [7]. The TCR in the surface of the T cell is free to
circulate between two pools in the cell membrane but only in one of those pools the TCR is
able to engage the ligand. Once engaged by the ligand the TCR can either dissociate non-
productively or be triggered. Triggered TCRs are then internalised and degraded. The
model includes a basal TCR production and loss from the cell membrane, which maintains
the resting levels of TCR expression in the cell. The model dynamic are:
TS →←φ 1
LALT trigr +→+ 2
→ ikA 3
→→ ss T 4
Where S is the density of TCR in a cell that is not directly accessible to ligand, T is the
density of TCRs directly accessible to ligand, and A is the density of triggered TCRs. All
densities in the model are relative to the TCR density of a resting cell (relative density –
r.d.), which was estimated by FACS as approximately 3×10⁵ TCRs per T cell [13]. The
parameters in the model are λ, the ratio between the size of the compartments of the S and
T pools; φ, the per-capita rate of transport between the S and T pools; s, the per-capita rate
of TCR turnover in the membrane; koff is the per-capita dissociation rate of the TCR and
ligand; kon is the per-capita rate of TCR-ligand binding; rtrig is the rate of TCR triggering; h
is the kinetic order of TCR triggering and ki is the per-capita internalisation rate of
triggered TCRs.
The model assumes that TCR engagement is in a quasi steady state; hence the rate
Page 109
Analysis of TCR engagement, triggering and down-modulation
89
of TCR triggering becomes a function of free TCR and MHC, which depends on the kon,
koff and ka (see appendix). One of the results of this model was that the rate of TCR
triggering (rtrigg) must be highly cooperative for the model to describe the experimental
data: hh
efftrig tLtTkr )()(= 5
Where keff is a constant dependent on kon, koff and ka and h is a hill coefficient (cooperativity
index). The minimal value of h required for the model to describe the kinetics of TCR
trigging is 4-5, which is relatively high. In the following sections, we will compare two
mechanisms of TCR triggering in their ability to describe the cooperativity of TCR
triggering and the kinetics of TCR down-modulation. One model is based on sequential
TCR homo-dimerization and the other on the interplay between a kinase and phosphatase
acting on the same substrate.
3.2.2.2 Sequential oligomerization of TCR-ligand complexes
Crosslinking mechanisms may, under particular circumstances, present
cooperativity of the type suggested for TCR triggering. Crosslinking models can be
relatively complicated and diverse due to the many combinatorial possibilities that yield
high order TCR-ligand complexes. One of the simplest models of TCR-ligand crosslinking
is the formation of a large TCR-ligand complex, with n TCR-ligand complexes, by
sequential addition of TCR-ligand monomers, following the mechanism:
on
off
k
k
T L TL→
+←
2
2
2( )TL TL TLγ
ρ
→+
←
3
3
2 3( ) ( )TL TL TLγ
ρ
→+
← 6
...
1( ) ( )n
a
n
kn nTL TL TL n A
γ
ρ−
→+ →
←
that replaces reaction 2 in the TCR triggering model. The parameter γ is the per-capita
rate of binding of an oligomer with a TCR-MHC-peptide monomer and ρ is the per-capita
rate of dissociation of that oligomer.
The kinetics of the model can be simplified assuming that each crosslinking step is
in equilibrium and that the product of each step can be neglected when compared to the one
Page 110
Analysis of TCR engagement, triggering and down-modulation
90
of the reactants, i.e. that as the size of the oligomer increases, each additional
oligomerization step becomes less probable (ρj >> γj+1). Under this simplification, the rate
of TCR triggering (rtrig) by formation of an oligomer of TCR-ligand complexes of
stoichiometry n is approximated as: nn
efftrig tLtTkr )()('= 7
with keff’ a constant (see appendix). This equation shows a direct mapping of the
kinetic order of TCR triggering to the molecularity of the oligomer required for TCR
triggering. Increasing the size of the oligomer required for TCR triggering causes an
increase in the kinetic order of the triggering reaction. Considering the results of the
previous paper [22], it is trivial to prove that this quasi steady state model can fit the
experimental data for n greater than 5. Exploration of the parameter of the oligomerization
model, without assuming the equilibrium in the oligomerization steps, shows that as the
size of the oligomer increases from 2 to 4 (figure 1) the forward rate constants of
crosslinking increase (table 1) and the ability the model has to describe the experimental
data improves.
Figure 1 – Optimisation of the parameters of the homo-cross linking models. The models were fitted, as
described in methods, to the whole experimental data. Right column, the kinetics of TCR down-modulation
for two doses of ligand. Left column, TCR down-modulated for various ligand densities on the APC after 5
h incubation. The crosses in the right panel denote the 5h CD3 staining from the curves of the left panel. A:
Dimerisation model; B: Trimerisation model; C: tetramerisation model. The parameters used are in table 1.
Page 111
Analysis of TCR engagement, triggering and down-modulation
91
Table 1: Parameters of the model of TCR triggering by
sequential dimerization of TCR-MHC complexes.
Model:
Parameter
Dimerization Trimerization Tetramerization
s / min-1 1.25×10⁻⁴ 1.91×10⁻⁴ 3.00×10⁻⁴
θ 1.79 2.06 1.78
φ / min-1 2.96×10⁻³ 2.22×10⁻³ 2.94×10⁻³
kon / r.d.-1 min-1 2.35×101 5.77×101 6.37×101
koff / min-1 2.48×10² 2.50×10² 2.50×10²
γ1 / r.d.-1 min-1 1.42×10⁵ 8.38×10⁴ 4.45×10⁴
ρ1 / min-1 1.63×10⁻³ 4.39×10⁻¹ 1.28×10⁻¹
γ2 / r.d.-1 min-1 - 1.63×10⁶ 1.17×10⁶
ρ2 / min-1 - 1.93×10⁻¹ 6.29×10⁻¹
γ3 / r.d.-1 min-1 - - 1.90×10⁶
ρ3 / min-1 - - 1.05×10⁻¹
ka / min-1 4.92×10² 4.91×10² 9.30×10²
ki / min-1 9.38×10⁻² 4.19×10⁻¹ 9.80×10⁻²
χ2 0.23 0.16 0.15
Each crosslinking step adds a small delay to the kinetics of TCR triggering that
causes a loss of the sensitivity to low densities of ligand. To compensate the delays, the
forward reactions of crosslinking must be faster and irreversible as the size of the final
TCR-ligand oligomer increases (table 1). In these conditions the steady-state approximation
calculated above is no longer valid because the parameter sets required for the model to
describe the experimental data imply that 1−<< jj γρ . So the simple correspondence
between cooperativity and stoichiometry is lost. Moreover, the increase of the number of
intermediates implies a greater amount of MHC-peptide locked in the intermediate
oligomers, causing a decrease in the efficiency of serial triggering, which can be minimised
by fast rates of oligomerization and triggering. Forcing smaller crosslinking rate constants
of the oligomerization models yields increasingly poorer results for the low ligand dose
Page 112
Analysis of TCR engagement, triggering and down-modulation
92
kinetics (figure 2) with little loss for the high dose of ligand presentation. Some slight
attenuation of these problems can also be achieved by other mechanisms of TCR homo
crosslinking, with fewer intermediate steps.
figure 2 - Effects of adjusting the crosslinking rate constant of the dimezation model, showing the
requirement of high crosslinking rates to reproduce the kinetics of low density of ligand presentation. Full
lines represent the model using the optimised parameter set in table 1. Dashed lines represent the model
using a crosslinking rate constant of 1×10⁴; Dotted lines represent the model using a crosslinking rate
constant of 1×10³.
3.2.2.3 The cycle of TCR triggering
Oligomerization is not the only mechanism that could explain the ultra-sensitivity of
TCR triggering. The triggering of TCR is a complex mechanism that involves kinases and
phosphatases acting on the same substrate [1] so it is possible that the ultra-sensitive nature
of TCR triggering is a consequence of a particular combination of activities of kinases and
phosphatases. Koshland and Goldbetter have proposed a mechanism, the zeroth-order ultra-
sensitive mechanism [23] that can explain very high sensitivities in biological systems that
have two enzymes operating with reverse activities as is the case of kinase-phosphatase
cycles.
We assume that the triggering of the TCR is dependent on the activity of two
enzymes, a kinase and a phosphatase. Enzyme EK, the CD4-associated src kinase, is
responsible for triggering of the TCR bound to ligand. Enzyme EP, the phosphatase, is
responsible for deactivation of the TCR once it dissociates from ligand. Both EK and EP
were assumed to follow simple Michaelis-Menten kinetics. Since the validity a quasi-steady
state approximation for the kinetics of EK and EP implies an instant conversion of substrates
into products, we relaxed this assumption by modelling explicitly the kinetics of enzyme
catalysis and binding and dissociation of substrate. The TCR engagement and triggering
Page 113
Analysis of TCR engagement, triggering and down-modulation
93
mechanism is thus:
TLLToff
on
k
k
←→+
LAALCTLon
offaEK
offEK
KonEK
k
kk
Kk
Ek
+←→ → ←
→ ×
8
TCA aEP
offEP
PonEPk
Pk
Ek
→ ← → ×
where CK and CP are the complexes of TCR with enzymes EK and EP, respectively,
konEK, koffEK and kaEK, are respectively the enzyme EK TCR binding and dissociation and
TCR triggering by EK rate constants. The parameters konEP, koffEP and kaEP are respectively
the enzyme EP TCR binding and dissociation and TCR triggering by EP rate constants. The
rest of the parameters and variables are the same as in the crosslinking model.
This model capable of describing the experimental data (figure 3, table 2) provided
that EP is saturated even for the lower dose of ligand. Contrary to EP, EK does not need to be
saturated, and can be assumed as a first order reaction if the rate of TCR internalisation is
sufficiently low. The fastest reactions in the model are the enzyme binding reactions and
TCR phosphorylation and dephosphorylation. These reaction rate constants are
considerably slower than the crosslinking reactions of the previous model. The binding of T
and A to EK and EP can be assumed irreversible and the dissociation rate constants for the
enzymes have little contribution to the kinetics of the model provided they are small
enough.
The parameters of the model indicate that the TCR triggering cycle has properties
similar to the Koshland-Goldbeter mechanism [23], displaying hypersensitivity to low
ligand presentations. The model has a threshold near which a slight increase in the amount
of ligand density induces a strong response from the system (figure 4). As the ligand
density increases, the system becomes less sensitive to changes.
Page 114
Analysis of TCR engagement, triggering and down-modulation
94
Figure 3 - Optimisation of the parameters of the TCR-SAC crosslinking model. The model was fitted, as
described in methods, to the whole experimental data. The parameters are listed in table 2. Right column,
the kinetics of TCR down-modulation for two doses of ligand. Left column, TCR down-modulated for
various ligand densities on the APC after 5 h incubation. The crosses in the right panel denote the 5h CD3
staining from the curves of the left panel.
Figure 4 - Sensitivity of TCR down-modulation to ligand presentation, measured by the average rate of
TCR down-modulation over the first 50 minutes of incubation. There is a threshold near 0.001, which is
equivalent to approximately 100 MHC-peptides. The rate of TCR down-modulation is most sensitive to
changes in ligand presentation between the threshold and 0.01, which are approximately 1000 ligand
molecules. The parameters of the model are presented in table 2.
Page 115
Analysis of TCR engagement, triggering and down-modulation
95
Table 2: Parameters of the model of the cycle of TCR triggering
Parameter Estimated value
s / min-1 8.65×10⁻⁴
θ 1.62
φ / min-1 5.69×10⁻³
kon / r.d.-1 min-1 8.09×101
koff / min-1 2.99×10²
konEK / r.d.-1 min-1 1.24×10²
koffEK / min-1 1.46×10⁻⁸
kaEK / min-1 1.16×10³
konEP / r.d.-1 min-1 4.55×10³
koffEP / min-1 1.00×10⁻⁸
kaEP / min-1 1.37×100
ki / min-1 1.03×10⁻¹
EK / r.d.-1 2.56×100
EP / r.d.-1 2.63×10⁻²
χ2 0.044
The model displays different parameter sensitivities for the two doses of ligands.
TCR down-regulation for the higher dose of ligand is mainly dependent on the turnover of
TCR, the TCR exchange rate constant, the activity of EK, the internalisation constant, and
the on and off rates of TCR-ligand binding. The down-regulation of TCR for the lower dose
of ligand is mainly dependent on the activities of EK and EP and on the on and off rates of
TCR-ligand binding. These results hold even is assuming a quasi-steady state for EK and EP.
3.2.3 DISCUSSION
A previous mathematical analysis of the kinetics of TCR down-regulation has
suggested that TCR triggering rate is hypersensitive to changes in both ligand and receptor
densities [22]. In the present work, we addressed if oligomerization of TCR-ligand
complexes is necessary to describe these kinetics properties of TCR triggering. To answer
this question, two candidate mechanisms were compared: an oligomerization mechanism
based on sequential crosslinking of TCR-ligand; and a mechanism based in the interplay
between a phosphatase and a co-receptor associated kinase, which was based on the
Koshland-Golbeter hypersensitive mechanism. The results show that both these models
Page 116
Analysis of TCR engagement, triggering and down-modulation
96
describe the experimental data, albeit with different parameter requirements.
The limited size of the experimental data set used in this study, compared to the
number of parameters in the models, is very small and constitutes a weakness of this
analysis. As the complexity of the models and the number of parameters increase, the
significance of parameter estimation and model comparison decrease. For this reason, in the
this work the analysis and comparison of the more complex models of TCR crosslinking
and TCR oligomerization were kept strictly in a qualitative basis, using optimisation
techniques solely to explore the possible parameter regimes of the models. It is noteworthy,
however, that the fitting is based on very precise estimations of the variables. Hence, the
variables in the models are the average densities of different TCR species on the cell
membrane. The fittings minimize the difference between the sum of these variables as
predicted by the model and the average relative TCR density measured experimentally.
This average is based on the individual observations of the fluorescence intensity of
thousands of cells. Its value should be close to that of the true average value of TCR
density, according to the law of large numbers.
The most straightforward candidate for explaining hypersensitivity is the formation of
high-order TCR-ligand oligomers ([7], reviewed in [24]). For these crosslinking models to
describe all the kinetic data, they require high crosslinking rates, to minimise the delays, to
maximize the serial triggering efficiency and to compensate for the low density of TCR-
ligand complexes at low doses of ligand. This requirement violates the quasi steady state
assumption, invalidating the straightforward correspondence between the TCR oligomer
stoichiometry and the kinetic order. Another problem with crosslinking models of TCR
triggering is that diffusion of TCR-ligand oligomers in the interface between the two cells
is mostly likely limited. Lateral mobility of high order oligomers should be impaired by
their size and by the fact that they are made of several integral membrane proteins anchored
in the two cell membranes. If it is assumed that the formation of the first dimer of ligand-
TCR complexes is already diffusion limited (the theoretical result by Salzmann et al. [14]),
then the formation of the trimer or the tetramer, which are larger complexes with lower
diffusion rates, cannot be possible with a higher rate constant. In that case, diffusion
imposes an upper limit to the rate of formation of oligomers and therefore would limit the
rate of TCR triggering and down-regulation. These difficulties of the crosslinking
mechanism are more evident at the low ligand and TCR densities than at high densities.
The crosslinking model can easily describe the high dose of ligand with low crosslinking
Page 117
Analysis of TCR engagement, triggering and down-modulation
97
rate constants; the requirement for non-realistic high crosslinking rate constants is imposed
by the kinetics of the low dose of ligand.
The model of the cycle of TCR triggering is based on a pair of enzymes with reverse
activity. This model also requires high binding rate constants with the enzymes EK and EP
with the TCR, which are nevertheless lower than the crosslinking rate constants of the
homo crosslinking models. The early events in TCR signal transduction are
phosphorylation of the TCR ITAMs and of enzymes such as src-family kinase lck, also
implied in TCR down-regulation [25, 26], and syk-family kinase ZAP-70. So it is possible
that the activity of EK might reflect the activity of lck or fyn on TCR ITAMs or on ZAP-70.
The phosphatase with reverse activity must act on the same substrate, also in early stages of
signalling. Possible candidates for this phosphatase are CD45 and/or SHP-1. CD45 is a
positive regulator of lck activity and was shown to dephosphorylate ITAMs of TCR-
complexes[27, 28]. SHP-1 is a negative regulator of TCR signalling that seems to target
preferentially ZAP-70 and syk [29]. The activity of ZAP-70 was demonstrated to be
dependent on the balance between phosphorylation by lck [30, 31] and dephosphorylation
by a phosphatase [31]. Simply by perturbing the balance between kinase and phosphatase
activity, Zap70 could be activated. This kind of regulation might be extensible to lck and
CD45, supporting the model of the cycle of TCR triggering presented here. The model only
makes predictions on the kinetics for EK and EP. EK or EP may be one kinase or phosphatase
or the combined activity of two or more kinases and phosphatases. Overall, we favour the
dependence of TCR down-regulation on CD45 and CD4-associated lck activity, both by the
regulation of lck activity by CD45 and by ITAM phosphorylation by lck and
dephosphorylation, possibly by CD45 [27, 28]. From the biological point of view, enzymes
EK and EP might be located in rafts, or closely associated with the TCR complex. The
preferential location of EK and EP in rafts would reduce the dependence of the triggering of
the TCR on the lateral diffusion of EK and EP in the membrane; therefore, it would facilitate
a finer regulation of TCR triggering.
The structure of TCR signalling complexes may support different triggering
mechanism that would operate under different conditions. Our results show that the TCR-
SAC crosslinking explains better the low dose curve of TCR down-regulation, whereas
both TCR-SAC crosslinking or TCR oligomerization models explain well the high dose
TCR down-regulation curve. TCR-SAC crosslinking could be very efficient at low ligand
densities, in conditions where diffusion would limit the rate of TCR oligomer formation,
Page 118
Analysis of TCR engagement, triggering and down-modulation
98
and therefore it might be the favoured TCR triggering mechanism. At higher ligand
densities TCR oligomers may form and also trigger the TCR, which may or may not
interfere with triggering by TCR-SAC crosslinking. Moreover, since these two TCR-
triggers are different supramolecular complexes they could activate partially overlapping
downstream pathways. This possibility is not unlikely. Both anti-CD3 antibodies and
soluble MHC-dimers bearing agonist peptide can trigger the TCR, albeit eliciting different
T cell response patterns [32]. These different patterns could be partly explained by the fact
that anti-CD3 can trigger TCR oligomers only, whereas soluble MHC-dimers can elicit
both TCR dimmerization and TCR-SAC crosslinking. T cell responses to peptide
presentation is qualitatively affected by the presence or absence of CD4 co-receptor
molecules, and this qualitative effect is more evident in the response to partial agonists than
in the response to full agonists [33]. This difference can be interpreted if the affinity of
TCR for the full agonist, but not that of the partial agonist, is high enough to form TCR-
ligand complexes that reach densities at which TCR oligomers can be effectively triggered.
Under these conditions, the full agonist would be able to activate the cell by TCR-
oligomerization in the presence or absence of coreceptor, while the partial agonist would
predominantly activate the cell by TCR-SAC crosslinking, i.e. in the presence of the co-
receptor.
Depending on the steric hindrance of CD4-lck association with TCR oligomers, the
TCR triggering mechanisms could be or not mutually exclusive. Moreover the downstream
signals could also be qualitatively or quantitatively different. For simplicity, let us consider
that the triggering mechanisms are not mutually exclusive and that the formation of the
TCR triggers are independent. Several downstream signals could, conceptually, originate in
these conditions. Figure 5 shows the hypothetical ligand concentration range of response by
TCR-SAC crosslinking (RA) and TCR oligomer (RB) triggering mechanisms operating in a
nonexclusive manner. Some of the possible scenarios of the downstream responses for the
two mechanisms are: (i) If both RA and RB yield qualitatively the same downstream
response, then RA and RB could synergise (Figure 5-C) yielding together a greater response
than either one alone. (ii) If RB and RA are qualitatively different and do not interfere, then
at high ligand density, both responses would be present (Figure 5-D). (iii) If RA is inhibited
by RB, then at high ligand doses, RB inhibition would result in a bell-shaped response of RA
(Figure 5-E). (iv) If RA inhibits RB, then in the presence of signalling by TCR-SAC cross-
linking, RB would not be detectable (Figures 5-F). Scenario iii could explain, for example,
Page 119
Analysis of TCR engagement, triggering and down-modulation
99
the regulation immune deviation [34, 35], where RA could favour Th2 differentiation and
RB, Th1 differentiation. Scenarios iii could also explain, for example, the postulated
responses of cells to antigen dose during negative selection [36-41], with the assumption
that RA promotes survival of negative selection and RB induces deletion or inhibits survival
signals.
Res
pons
e
Ligand dose
RA+ RB
RBRA
RA
RB
RA
RB
A
B
C
D
E
F
RARB
Figure 5 - Representation of the antigen dose-response curves possible with TCR crosslinking and TCR-co-
receptor crosslinking. A and B – Response to signalling via the TCR-SAC crosslinking (RA) and homo
crosslinking (RB) mechanisms, respectively. In the presence of both triggering mechanisms, some of the
possible scenarios are: C – Signals RA and RB are qualitatively the same and synergyse; D – Signals RA and
RB are qualitatively different and do not interfere; E – Signal RB inhibits RA; and F – Signal RA inhibits RB.
In conclusion, the mechanistic complexity of the TCR signalling cascades is such that
may allow the concurrence of alternative triggering processes. We suggest here that either
TCR oligomerisation or TCR-SAC crosslinking are sufficient to trigger at least some T cell
response, and thus neither of these mechanisms alone would be strictly necessary to explain
any observed T cell response. According to this view, the protocol the experimentalist uses
to induce activation of signalling cascades and score the response of the T cell may reveal
Page 120
Analysis of TCR engagement, triggering and down-modulation
100
different aspects of this mechanistic complexity. This may be the source of controversy
surrounding the stoichiometry of the TCR triggering complexes and the role of co-receptors
in TCR triggering.
3.2.4 METHODS
The ordinary differential equations of the model were integrated numerically using the
implicit numerical method of Burlish Stöer [42]. The optimisation of the model parameters
was done using the amoeba method [42] combined with the Burlish Stoer integration
method. All parameter optimisations were performed using simultaneously the complete
data set: the data of the time course of TCR down modulation and the data of 5 h down
modulation of TCR for various ligand presentations. Confidence intervals were not
estimated because of the lack of adequate methods for complex non-linear models, such as
the ones presented here. Another reason is the small number of degrees of freedom
resulting from such a short sample of experimental points.
3.2.5 APPENDIX
The models presented are based in the previously published model of TCR
engagement and triggering, with equations:
( ) ))(1()()()( tSstTtS
tdtSd
−+−−= λϕ 9
( ) hh
eff L(t)tTktTstTtStdtTd )())(1()()()(
−−+−= ϕ 10
)()()( tAkL(t)tTk
tdtdA
ihh
eff −= 11
Where keff is defined as keff = ka (kon/koff)h, resulting from the assumption of a quasi
steady state for the conjugation of TCR with MHC.
For the sequential oligomerization model, the TCR triggering mechanism is expanded
as a sequence of crosslinking reaction steps. Consider Tj the oligomer complex of j TCR-
ligand complexes; the kinetics of formation and degradation of the jth oligomer are:
)1()()(
+−= jjdt
tdT j ωω 12
With )()()()( 11 tTtTtTj jjjj ργω −= − , where γ is the per-capita rate of binding of an
Page 121
Analysis of TCR engagement, triggering and down-modulation
101
oligomer with a TCR-MHC-peptide monomer and ρ is the per-capita rate of dissociation of
that oligomer. The full model is thus:
( ) ))(1()()()( tSstTtS
tdtSd
−+−−= λϕ
( ) )()())(1()()()( tTLkL(t)tTktTstTtS
tdtTd
offon +−−+−= ϕ
∑
=
−+−=n
joffon jtTLktt)LTk
tdtTLd
2)()()(()( ω
1...2),1()(
)()(−=+−= njjj
tdtTLd j ωω
13
)()()()()( tTLkj
tdtTLd
nan −= ω
)()()()( tAktTLkn
tdtAd
ina −×=
∑
=
−=n
jj
Total tTLLtL1
)()()(
Assuming a quasi steady-state in the TCR crosslinking steps, together with
assuming that ρj >> γj+1, then the rate of formation of triggered TCRs via an oligomer of
TCR-ligand complexes of stoichiometry n is approximated as
nneff
nnn
j j
jnoff
non
a tLtTktLtTkkkn
dttdA )()(')()()(
2
=
××= ∏
= ργ
, 14
which maps the number of crosslinking steps to the cooperativity of TCR crosslinking.
The TCR triggering cycle is based in the interplay between a kinase and a
phosphatase, acting on the TCR. The model equations are:
( ) ))(1()()()( tSstTtS
tdtSd
−+−−= λϕ
( ) )()()())(1()()()( tCktTLkL(t)tTktTstTtS
tdtTd
PaEPoffon ++−−+−= ϕ
)()()()()(()( tCktEtTLktTLktt)LTk
tdtTLd
KoffEKKonEKoffon +−+−=
)()()()()( tCktCktEtTLk
tdtCd
KaEKKoffEKKonEKK −−=
15
Page 122
Analysis of TCR engagement, triggering and down-modulation
102
)()()(()( tCktALktt)LAk
tdtALd
KaEKoffon ++−=
)()()(()()(()( tAktCktt)EAktALktt)LAk
tdtdA
iPoffEPPonEPoffon −+−+−=
)()()()()( tCktCktEtAk
tdtCd
PaEPPoffEPPonEPP −−=
)()()()( 2 tTtCtTLLtL KTotal −−−=
)()( tCEtE KTotalKK −=
)()( tCEtE PTotalPP −=
3.2.6 REFERENCES
1 Germain, R. N. and Stefanova, I., Annu Rev Immunol 1999. 17: 467.
2 Brown, J. H., Jardetzky, T. S., Gorga, J. C., Stern, L. J., Urban, R. G., Strominger, J. L. and
Wiley, D. C., Nature 1993. 364: 33.
3 Garboczi, D. N., Ghosh, P., Utz, U., Fan, Q. R., Biddison, W. E. and Wiley, D. C., Nature
1996. 384: 134.
4 Fields, B. A., Ober, B., Malchiodi, E. L., Lebedeva, M. I., Braden, B. C., Ysern, X., Kim, J.
K., Shao, X., Ward, E. S. and Mariuzza, R. A., Science 1995. 270: 1821.
5 Reich, Z., Boniface, J. J., Lyons, D. S., Borochov, N., Wachtel, E. J. and Davis, M. M., Nature
1997. 387: 617.
6 Boniface, J. J., Rabinowitz, J. D., Wulfing, C., Hampl, J., Reich, Z., Altman, J. D., Kantor, R.
M., Beeson, C., McConnell, H. M. and Davis, M. M., Immunity 1998. 9: 459.
7 Bachmann, M. F., Salzmann, M., Oxenius, A. and Ohashi, P. S., Eur J Immunol 1998. 28:
2571.
8 Stone, J. D., Cochran, J. R. and Stern, L. J., Biophys J 2001. 81: 2547.
9 Baker, B. M. and Wiley, D. C., Immunity 2001. 14: 681.
10 Sykulev, Y., Joo, M., Vturina, I., Tsomides, T. J. and Eisen, H. N., Immunity 1996. 4: 565.
11 Delon, J., Gregoire, C., Malissen, B., Darche, S., Lemaitre, F., Kourilsky, P., Abastado, J. P.
and Trautmann, A., Immunity 1998. 9: 467.
12 Harding, C. V. and Unanue, E. R., Nature 1990. 346: 574.
13 Valitutti, S., Muller, S., Cella, M., Padovan, E. and Lanzavecchia, A., Nature 1995. 375: 148.
14 Salzmann, M. and Bachmann, M. F., Mol Immunol 1998. 35: 65.
15 van Oers, N. S., Killeen, N. and Weiss, A., J Exp Med 1996. 183: 1053.
Page 123
Analysis of TCR engagement, triggering and down-modulation
103
16 Gil, D., Schamel, W. W., Montoya, M., Sanchez-Madrid, F. and Alarcon, B., Cell 2002. 109:
901.
17 Thomas, M. L., Curr Opin Immunol 1999. 11: 270.
18 Doyle, C. and Strominger, J. L., Nature 1987. 330: 256.
19 Norment, A. M., Salter, R. D., Parham, P., Engelhard, V. H. and Littman, D. R., Nature 1988.
336: 79.
20 Janeway, C. A., Jr., Semin Immunol 1991. 3: 153.
21 Veillette, A., Bookman, M. A., Horak, E. M. and Bolen, J. B., Cell 1988. 55: 301.
22 Sousa, J. and Carneiro, J., Eur J Immunol 2000. 30: 3219.
23 Koshland, D. E., Jr., Goldbeter, A. and Stock, J. B., Science 1982. 217: 220.
24 Davis, M. M., Boniface, J. J., Reich, Z., Lyons, D., Hampl, J., Arden, B. and Chien, Y., Annu
Rev Immunol 1998. 16: 523.
25 Lauritsen, J. P., Christensen, M. D., Dietrich, J., Kastrup, J., Odum, N. and Geisler, C., J
Immunol 1998. 161: 260.
26 D'Oro, U., Vacchio, M. S., Weissman, A. M. and Ashwell, J. D., Immunity 1997. 7: 619.
27 Furukawa, T., Itoh, M., Krueger, N. X., Streuli, M. and Saito, H., Proc Natl Acad Sci U S A
1994. 91: 10928.
28 Hegedus, Z., Chitu, V., Toth, G. K., Finta, C., Varadi, G., Ando, I. and Monostori, E., Immunol
Lett 1999. 67: 31.
29 Brockdorff, J., Williams, S., Couture, C. and Mustelin, T., Eur J Immunol 1999. 29: 2539.
30 Scharenberg, A. M., Lin, S., Cuenod, B., Yamamura, H. and Kinet, J. P., Embo J 1995. 14:
3385.
31 Mege, D., Di Bartolo, V., Germain, V., Tuosto, L., Michel, F. and Acuto, O., J Biol Chem
1996. 271: 32644.
32 Appel, H., Seth, N. P., Gauthier, L. and Wucherpfennig, K. W., J Immunol 2001. 166: 5279.
33 Vidal, K., Daniel, C., Hill, M., Littman, D. R. and Allen, P. M., J Immunol 1999. 163: 4811.
34 Hosken, N. A., Shibuya, K., Heath, A. W., Murphy, K. M. and O'Garra, A., J Exp Med 1995.
182: 1579.
35 Constant, S., Pfeiffer, C., Woodard, A., Pasqualini, T. and Bottomly, K., J Exp Med 1995. 182:
1591.
36 Liu, G. Y., Fairchild, P. J., Smith, R. M., Prowle, J. R., Kioussis, D. and Wraith, D. C.,
Immunity 1995. 3: 407.
37 Homer, R. J., Mamalaki, C., Kioussis, D. and Flavell, R. A., Int Immunol 1993. 5: 1495.
38 Auphan, N., Schonrich, G., Malissen, M., Barad, M., Hammerling, G., Arnold, B., Malissen,
B. and Schmitt-Verhulst, A. M., Int Immunol 1992. 4: 541.
Page 124
Analysis of TCR engagement, triggering and down-modulation
104
39 Alam, S. M., Travers, P. J., Wung, J. L., Nasholds, W., Redpath, S., Jameson, S. C. and
Gascoigne, N. R., Nature 1996. 381: 616.
40 Ashton-Rickardt, P. G., Bandeira, A., Delaney, J. R., Van Kaer, L., Pircher, H. P., Zinkernagel,
R. M. and Tonegawa, S., Cell 1994. 76: 651.
41 Bouneaud, C., Kourilsky, P. and Bousso, P., Immunity 2000. 13: 829.
42 Press, W. H., Teukolsky, S. A., Vetterling, W. T. and Flannery, B. P., Numerical Recepies in
C: the art of scientific computing, 2 Edn., Cambrige University Press 1997.
Page 125
Analysis of TCR engagement, triggering and down-modulation
105
3.3 Activation thresholds, adaptation and TCR triggering
An experiment by Valitutti et al. (Valitutti, Muller et al. 1996) shows how TCR down-
modulation and TCR levels can give T cells adaptable activation thresholds of the type
discussed by Grossman and colleagues (Grossman and Paul 1992; Grossman and Paul
2000; Grossman and Paul 2001). T cells were incubated with three cultures of APCs, two
where APCs were pulsed with a high dose of peptide and another where APCs were pulsed
with low doses of peptide. At a given time, one of the low dose of the T cultures with APCs
pulsed with low dose of peptide was washed of APCs and cultured with APCs pulsed with
the higher dose of peptide. The results show that these T cells undergo additional TCR
down-modulation; reaching TCR levels close to the cells cultured with APCs pulsed with a
high dose of peptide. Our mathematical model of TCR triggering is capable of fitting these
results and allows us to estimate the concentration of triggered TCRs in the surface of T
cells. A quantity not easily determined experimentally that is crucial for T cell activation
and signaling. The results of the model are summarized in figure 2.
0 100 200 3000
50
100
0
50
100
Time/min
%C
D3
stai
ning
Low
Low+high
High
A
B
Low
Low+high
High
Figure 1 – Prediction of the model together with data from (Valitutti, Muller et al. 1996). Briefly, the
experiment has the same setup as (Valitutti, Muller et al. 1995), hence all parameters and procedure in
(Sousa and Carneiro 2000) were used in these plots. T cells were incubated with APCs having either ~78
MHC-peptide complexes per APC (Low); with ~5282 MHC-peptide complexes per APC (High); or
initially with APCs having Low followed by APCs having High doses of MHC-peptide at 120 minutes of
incubation (Low+high). A – Predicted TCR down modulation in response to antigen presented by APC
measured by CD3 staining. B – Predicted density of triggered TCRs (measured by CD3 staining) in
response to antigen presented by APC.
Page 126
Analysis of TCR engagement, triggering and down-modulation
106
For each addition of ligand presentation by APCs, the T cells respond accordingly by
triggering and down modulating more TCRs, and consequently activated TCRs accumulate
in the membrane and also (hypothetically) in intracellular compartments. For the sake of
simplicity we neglect in the following discussion the contribution of triggered TCRs in
intracellular compartments for signaling, based on the assumption that they reflect
qualitatively the dynamic of the triggered TCRs in the membrane.
How can the cell count the number of triggered TCRs? Looking at the kinetics of
triggered TCRs predicted by the model, it seems plausible that it reflects the requirement to
sustain signaling for at least 50 minutes, probably the time window necessary to accumulate
down-stream signaling intermediates. The peaks of triggered TCRs result from the balance
between the rate of TCR triggering and the internalisation and degradation of TCRs.
If sustaining triggered TCRs at the surface of the T cell is necessary for T cell
activation, then TCR signaling has an adaptable activation threshold resulting from the
regulation of the levels of TCR in T cells. A cell which has responded to a given ligand
density has consequently down-regulated a given number of TCRs. If TCR levels are not
allowed to recover, then the T cell will be unable to respond to the same density of ligands.
The cell will only be capable of responding to a higher ligand density, and will only be
activated if it has enough TCRs to sustain signaling for 50 minutes and if the ligand density
is high enough to allow this. Hence, the conjugation of TCR triggering and TCR down-
modulation gives T cells an adaptable activation threshold in accordance to the propositions
of Grossman and colleagues (Grossman and Paul 1992; Grossman and Paul 2000;
Grossman and Paul 2001). The significance of this adaptation mechanism for the
physiology of the T cell remains to be assessed.
The avidity model of thymocyte selection states that the primary selective pressure on
the lymphocytes is the avidity of their interaction with thymic APCs. Avidity is a broad
quality, which encompasses not only TCR-ligand interaction, but also other factors
conditioning T cell activation, such as co-receptor expression, kinase levels and adhesion
molecule expression. Hence, avidity depends on the affinity of the TCR to the ligand
presented on the APC, on TCR and ligand densities and on the general metabolic state of
the thymocyte and APC. All other things being considered equal, avidity in thymocytes at a
given differentiation stage can be assumed to be mainly a function of the net TCR-ligand
engagement and signaling. An adaptation mechanism that relies on the level of TCR
expression and controls the signal intensity might have important consequences for the
Page 127
Analysis of TCR engagement, triggering and down-modulation
107
selection of thymocytes, as discussed by Grossman & Singer (Grossman and Singer 1996).
The TCR levels in thymocytes at a given stage would reflect the number of APCs engaged
per unit of time, giving the thymocyte a memory of previous stimulatory events. As
discussed later in this thesis, in the context of the maintenance of peripheral lymphocytes,
such a mechanism would act as a filter where cells that are easily and/or repetitively
stimulated are rendered unresponsive.
3.3.1 BIBLIOGRAPHY
Grossman, Z. and W. E. Paul (1992). “Adaptive cellular interactions in the immune system: the
tunable activation threshold and the significance of subthreshold responses.” Proc Natl Acad
Sci U S A 89(21): 10365-9.
Grossman, Z. and W. E. Paul (2000). “Self-tolerance: context dependent tuning of T cell antigen
recognition.” Semin Immunol 12(3): 197-203; discussion 257-344.
Grossman, Z. and W. E. Paul (2001). “Autoreactivity, dynamic tuning and selectivity.” Curr Opin
Immunol 13(6): 687-98.
Grossman, Z. and A. Singer (1996). “Tuning of activation thresholds explains flexibility in the
selection and development of T cells in the thymus.” Proc Natl Acad Sci U S A 93(25): 14747-
52.
Sousa, J. and J. Carneiro (2000). “A mathematical analysis of TCR serial triggering and down-
regulation.” Eur J Immunol 30(11): 3219-27.
Valitutti, S., S. Muller, et al. (1995). “Serial triggering of many T-cell receptors by a few peptide-
MHC complexes.” Nature 375(6527): 148-51.
Valitutti, S., S. Muller, et al. (1996). “Signal extinction and T cell repolarization in T helper cell-
antigen- presenting cell conjugates.” Eur J Immunol 26(9): 2012-6.
Page 128
Analysis of TCR engagement, triggering and down-modulation
108
Page 129
Analysis of TCR engagement, triggering and down-modulation
109
3.4 Towards an analysis of the experimental settings to study TCR triggering by ligand
The Bachmann model (Bachman, Salzmann et al. 1998) is a very good approximation
to the TCR down-regulation kinetics with high dose of ligand, capturing only the most
significant aspects of the mechanism: TCR triggering and down-modulation. Our final
model is more complex, but approximates well the TCR down-regulation kinetics for both
the high and low doses of ligand. The model we propose can be seen as the unfolding of the
quasi-steady state approximation of the Bachmann model, increasing the domain of the
model to a larger set of experimental data. Fitting all the data published by Valitutti et al
(Valitutti, Dessing et al. 1995) is what uncovers the need for a high cooperativity in TCR
triggering.
These models are only approximations to the underlying mechanism of TCR
triggering. The criteria used to assess the validity, quality and scope of the models is the
ability to describe the experimental data and the biological correctness of the model
assumptions and properties. The ability to describe the data was assessed by fitting the
model using χ2 optimising techniques. The error in the χ2 fit was loosely used as a criterion
on how well the model was able to describe the experimental data. To complement this
quantitative analysis, the models also had to be biologically coherent. Models, which
clearly went against or did not reproduce what is known about the TCR down-regulation
mechanism, were discarded.
The most frequent criticism to our models relate to the robustness of the experimental
data used to compare the different models. The use of fittings to seven experimental data
points per kinetic curve and five data points for the five hours down-regulation seems, at
first sight, too feeble to attain a reliable comparison between the various models. The error
structure of the experimental data set is nevertheless peculiar. Each experiment has
associated a systematic error resulting from the initial set up of the cell culture, in addition
to the error associated with the measurement of time.
Typically each FACS data point is the average of thousands of single cell events.
Hence, each one of the 19 data points comprehends a large number of observations, which
means a very high precision in the estimated CD3 expression average. Classical statistics
are not adequate to characterize this data set, in which each data point is dynamically
Page 130
Analysis of TCR engagement, triggering and down-modulation
110
related to the previous one. In light of this limitation, we compared the models using both
quantitative aspects provided by the statistics of the fittings and qualitative criteria based on
the biological aspects of TCR triggering. Clearly, robust methods to determine how many
experimental data points are necessary to determine the robustness of these models is
lacking.
The validity results and conclusions of our models depend on the precise estimation of
the amount of ligand presented on the APC. Valitutti et al (Valitutti, Muller et al. 1995)
show a linear relationship in the logarithms of peptide concentration and peptide loaded
(figure 1). A slope of about 0.7 indicates that peptide loading in that system resembles a
simple saturation curve; hence it should produce a fairly linear Schatchard plot. This linear
dependence might not be valid for different peptide ranges and experimental settings. Some
experimental studies of T cell activation and TCR triggering and down-modulation rely on
the assumption that there is a linear relationship between peptide in solution and peptide
presentation by the APC, which might not be entirely valid. The ligand presented to the
APC depends not only on the peptide in solution but also in the affinity of the MHC for the
peptide. Thus the peptide dose dependence of T cell activation cannot be correctly
interpreted without a study of peptide loading by the APCs.
Peptide concentration/µΜ
MH
C-p
eptid
e
100 1000 10000
100
1000
10000
y = m x + bm = 0.7b = 0.9r2=0.97
Figure 1 – Linear correlation (in log x log space) between peptide in solution and peptide presentation in
MHC context (data from (Valitutti, Muller et al. 1995)).
Another aspect pertinent to the conclusions of the model is the kinetics of T cell and
APC conjugation. Some results suggest that for a class II T cell to be activated, a minimum
conjugation time of about 6-12 hours is required (Dustin, Allen et al. 2001). Another
Page 131
Analysis of TCR engagement, triggering and down-modulation
111
possibility is that T cells can be serially conjugated by different APCs (Friedl and Gunzer
2001). Hence, we cannot exclude that the kinetics studied by Valitutti et al (Valitutti,
Muller et al. 1995) are the result of both APC “serial” conjugation and TCR serial
engagement. The central limit theorem states that on average, both APC serial conjugation
and APC conjugation for 6 hours produce the same results. Therefore, our models cannot
be used to distinguish the APC engagement mechanism. To address this question we need
to model explicitly the distribution of peptide-loaded APCs and T cells, their conjugation
kinetics and the TCR kinetics. This would be a model compromising two organizational
levels: the molecular level with the fast kinetics of TCR down-modulation, and the cellular
level, with the slow kinetics of T cell and APC conjugation.
3.4.1 BIBLIOGRAPHY
Bachmann, M. F., M. Salzmann, et al. (1998). “Formation of TCR dimers/trimers as a crucial step
for T cell activation.” Eur J Immunol 28(8): 2571-9.
Dustin, M. L., P. M. Allen, et al. (2001). “Environmental control of immunological synapse
formation and duration.” Trends Immunol 22(4): 192-4.
Friedl, P. and M. Gunzer (2001). “Interaction of T cells with APCs: the serial encounter model.”
Trends Immunol 22(4): 187-91.
Valitutti, S., M. Dessing, et al. (1995). “Sustained signaling leading to T cell activation results from
prolonged T cell receptor occupancy. Role of T cell actin cytoskeleton.” J Exp Med 181(2):
577-84.
Valitutti, S., S. Muller, et al. (1995). “Serial triggering of many T-cell receptors by a few peptide-
MHC complexes.” Nature 375(6527): 148-51.
Page 132
Analysis of TCR engagement, triggering and down-modulation
112
Page 133
Adaptable activation thresholds and lymphocyte homeostasis
113
4 Adaptable activation thresholds and lymphocyte
homeostasis
4
Adaptable activation thresholds and
lymphocyte homeostasis
Page 134
Adaptable activation thresholds and lymphocyte homeostasis
114
Page 135
Adaptable activation thresholds and lymphocyte homeostasis
115
Adaptable activation thresholds and homeostasis of lymphocytes
João SOUSA1,2, José FARO1,3, Zvi GROSSMAN1,4,5 and Jorge CARNEIRO1 1. Instituto Gulbenkian de Ciência, Apartado 14 P-2781 Oeiras Codex, Portugal.
2. Grupo de Bioquímica e Biologia Teóricas, Instituto de Investigação Científica Bento da Rocha Cabral,
Lisboa, Portugal. 3. Departamento de Fisica Aplicada, Universidad de Salamanca, 37008. Salamanca, Spain.
4. Laboratory of Immunology, National Institute of Allergy and Infectious Diseases,
National Institutes of Health, Bethesda, MD 20892.
This mauscript is still under discussion for publication and was not reviewd by all collaborators.
Hence, this manuscript does not represent the consensus of all collaborators mentioned above.
Summary
Adaptation of activation thresholds is a possible explanation for the persistence of significant numbers
of auto-reactive T cells in the periphery of normal individuals in the absence of autoimmune disease. We
build a simple mathematical model of adaptable T cells and explore the implications of adaptation of
activation thresholds for homeostasis of auto-reactive lymphocytes. We study how the activation threshold
and homeostatic responses of autoreactive T cells depends on the frequency of interactions with APCs. We
show that a critical population size exists, bellow which, the cells are unresponsive and are prevented from
making appropriate homeostatic responses or from undergoing clonal expansion. Above this critical size the
population of autoreactive cells will grow until it is limited by APC availability. As long as T cell homeostatic
proliferation and T cell activation are dependent on the same factors and are adaptable, adaptation of
activation thresholds cannot explain per se the persistence of auto-reactive lymphocytes. Instead it offers a
means by which the immune system may purge autoreactive cells from the peripheral repertoire as long as
their production is relatively small.
Acknowledgements:
This work was supported by Program Praxis XXI of the Ministério para Ciência e Tecnologia, Portugal
(grant Praxis/P/BIA/10094/1998). JS, JC, JF and ZG were respectively supported by fellowships
BD/13546/97, BPD/11789/97, BCC/18972/98 and BCC/16442/98 from Fundação para a Ciência e
Tecnologia - Program Praxis XXI.
Page 136
Adaptable activation thresholds and lymphocyte homeostasis
116
4.1 Introduction The main tenet of Clonal Selection Theory is that self-reactive lymphocytes must be
prevented from mounting deleterious autoimmune responses [1]. According to Burnet’s
original proposal this would be achieved by a putative mechanism that would delete auto-
reactive lymphocytes once and for all during embryonic development. The fact that the
generation of lymphocytes is a life long process in mammals invalidated this possibility.
After an early suggestion by Lederberg [2], deletion of potentially harmful specificities was
reformulated as a process of lymphopoiesis. Hence, following random rearrangement of
antigen-receptor genes lymphocytes that express an auto-reactive receptor would be deleted
at an immature stage of their development, before they could trigger destructive effector
functions. This hypothesis was later substantiated by observations in animals expressing
endogenous superantigens (reviewed in [3]) or expressing transgenic TCRs [4].
Intriguingly, absence of deletion has never been formally correlated with autoimmunity, in
contrast with some surprising reports that deletion of particular lymphocyte specificities
can actually enhance immune responses (eg. [5, 6]).
The major shortcoming of deletion models of self-tolerance is the well-documented
presence of autoreactive cells in normal healthy animals [7, 8]. Adoptive transfers into
syngeneic recipients reveal the potential for these autoreactive cells to cause autoimmunity
(reviewed in [9]). These observations raise the question of how the presence of these cells
is harmless in healthy individuals. Several hypotheses have been evoked notably that
regulatory cells control the responses of potentially harmful cells [8] or that autoreactive
cells become unresponsive or anergic [10]. While these two hypotheses are not mutually
exclusive [11, 12], the second hypothesis could offer a very simple cell-based explanation
for self-tolerance, if supported by a convincing mechanism for the generation of antigen-
specific unresponsiveness in peripheral cells. Among the possible explanations for
unresponsiveness or anergy in peripheral autoreactive cells, perhaps the simplest is the
hypothesis that lymphocytes adapt their activation thresholds to continuous stimuli [13-15].
According to this hypothesis autoreactive lymphocytes would become unresponsive by up-
regulation of their activation threshold because of continuous stimulation by peripheral
self-antigens. This hypothesis is supported by recent findings that the sensitivity of T cell
activation and TCR-signaling can be modulated in T-lymphocytes [16-19], that the
Page 137
Adaptable activation thresholds and lymphocyte homeostasis
117
persistence of peripheral T-lymphocytes requires continuous TCR stimulation by self-MHC
ligands [20-23] (which may even be non-classical MHC ligands in the case of memory cells
[24, 25]), and that tolerance to peripheral tissues requires their continuous presence [26].
In this article we investigate the plausibility of the hypothesis that continuous
stimulation by self-antigens would be responsible for the persistence of a significant
number of auto-reactive T-lymphocytes, which become unresponsive following up-
regulation of their activation thresholds. We first propose a minimal model describing the
adaptation of activation thresholds (AAT) by single T-cells. Using this model we show that
T-cells could be more or less sensitive depending on the frequency of conjugation events
with APCs carrying TCR-ligands. We then place this single cell model in the context of a
population dynamics of interacting T-cells and APCs. In these ideal cells, the TCR signals
during conjugation with APC are responsible for activation, survival, proliferation and
adaptation of activation thresholds.
4.2 Results
4.2.1 THE AAT SIGNALLING MODEL
T-cell activation requires conjugation with an APC, expressing on its surface MHC-
peptide complexes able to ligate and trigger the TCR. The signal transduction processes
triggering T cell activation are complex and not yet fully understood [27, 28]. They involve
the interplay of intermediate molecules, such as Zap-70, lck, CD45, LAT, etc. [27, 29, 30].
The activation state of these signaling intermediates results from a dynamic balance
between positive signals and negative signals. Usually the positive signals reflect kinase
activities and the negative signals reflect phosphatase activities, as indicated by studies in
which T cells are more prone to activation by targeting phosphatase activities with
inhibitors [31-33].
In the present work, we try to capture these features of signal transduction cascades of
T cell activation dependent on TCR engagement and triggering, using the minimal model
illustrated in fig.1. This model describes a pathway of four molecular components: TCRs
bound by MHC-peptides which constitute the stimulus (S); two downstream enzymes, a
kinase (K) and phosphatase (P); and an adapter molecule that can be inactive (W) or active
(W*), acting as a molecular switch of T cell activation. The concentration of these
molecules in time will be measured as S(t), K(t), P(t), W(t) and W*(t) respectively.
Page 138
Adaptable activation thresholds and lymphocyte homeostasis
118
W
W*
K P
RR
LL APC
T cell
+ +
Figure 1 - A minimal model of TCR signal transduction.
Upon TCR engagement by the specific ligand (L) (MHC-
peptide expressed in the APC membrane) the TCR is
activated. Activated TCR promotes the build-up of
intracellular kinase (K) and phosphatase (P), which regulate
the activation state of an adapter molecule (W). Depending
on the relative activities of K and P, the adapter is either
inactive or active. The later state leading to T cell activation
and proliferation.
We assume that the kinase and phosphatase (the main actors in our model) are in
constant turnover with a steady state dependent on the level of TCR binding. The basal
rates of kinase and phosphatase production in the absence of TCR binding are respectively
pk and pp. TCR binding accelerates the production rates of the two enzymes, being the
relative increase proportional to the amount of bound TCRs, with proportionality constant a
assumed to be identical for both enzymes for the sake of simplicity. Irrespective of the state
of TCR binding the kinase and the phosphatase are degraded with constant rates per
molecule dk and dp, respectively. The dynamic of these enzymes are therefore described by
the following differential equations:
( ) )()(1)( tKdtSapdt
tdKKK −⋅+= (1)
( ) )()(1)( tPdtSapdt
tdPPP −⋅+= (2)
The amount of bound TCRs is treated as an input variable in this model. Thus, the
concentration of bound TCRs is described as an arbitrary function of time. Heretofore we
will refer to the concentration of bound TCR as the stimulus. As to the adapter molecule,
we postulate that total concentration of the adapter is constant, and that the fraction of
activated molecules is in quasi-steady state, being a step function of the ratio between K(t)
and P(t):
<≥=
+=
1)(/)(01)(/)(1)(*
)(*)(
0
0
tPtKiftPtKif
WtW
tWtWW (3)
The adapter behaves as a molecular switch for T cell activation. Hence, the T cell will
be activated when the adapter is active and will rest when the adapter is inactive. This set-
Page 139
Adaptable activation thresholds and lymphocyte homeostasis
119
up was inspired in the Koshland-Golbeter mechanism [34], which relies on the interplay in
the activities of a kinase and phosphatase, and can lead to ultra-sensitive molecular
response. From the point of modelling, other mechanisms could as well be responsible for
the hypersensitive activation of W as a function of K(t) and P(t) but the postulate of this
step function has the advantage of simplicity, without compromising the generality of the
qualitative results.
The model is rendered non-dimensional for the concentration variables by redefining
them as:
( )KK dptKt
/)()( =κ , ( )KK dp
tPt/
)()( =π , )()( tSat ×=σ and 0
)(*)(W
tWtw = (4)
where pK/dK is the basal steady-state of the kinase. In this way, the model simplifies to:
( )[ ])()(1)( ttdt
td κσφκ−+= (5)
( )[ ])()(1)( ttdt
td πσζλφπ−+= (6)
where φ ≡ dk is the relative turnover rate of the kinase, λ is the ratio between the basal
turnover rates of the phosphatase and kinase (dP/dK) and ζ is the ratio between the steady
state concentrations of the phosphatase and the kinase (pp/dp)/(pk/dk). Note that because we
assumed that the enhancement of the production rates of kinase and phosphatase due to the
stimulus is identical, the ratio between the steady states of the phosphatase and the kinase is
always constant irrespective of the value S(t) of the stimulus. The original variables, non-
dimensional variables and parameters are listed in Table 1.
4.2.1.1 Activation threshold, adaptation and refractoriness
According to the adaptation of activation threshold hypothesis, a cell under constant
chronic stimulus should not be activated. This property can be encoded in the model by
fixing the steady state of phosphatase above the steady state of kinase
1>ζ (7)
This means that at constant stimulus a steady state is ultimately reached in which the
adapter molecules are always switched off. Following a change in the magnitude of the
stimulus, the cell adjusts the levels of kinase and phosphatase to a new steady state. In order
to switch on the adapter in response to a change in stimulus, κ(t) must transiently be greater
than π(t), while the cell progresses to the new steady state. Whether the adapter will be
Page 140
Adaptable activation thresholds and lymphocyte homeostasis
120
switched on depends both on the maximal intensity and rate of increase of the stimulus
changes.
Table 1 – Variables and parameters of the minimal model of TCR signal transduction
Variable Meaning Units Non-dimensional variable
K(t) Concentration of the kinase M κ
P(t) Concentration of the phosphatase M π
S(t) Concentration of ligated TCR / stimulus
M σ
W*(t) Fraction of activated
Adapter molecule
Non-dimensional -
Parameters Meaning Units Value
pk Production rate of kinase M s-1 -
dk Relative catabolic rate of kinase s-1 -
pp Production rate of phosphatase s-1 -
dp Relative catabolic rate of phosphatase
s-1 -
φ Baseline turnover rate of kinase (dk) s-1 0.025
λ Ratio between the baseline turnover rates of the phosphatase and the
kinase (dp/dk)
Non-dimensional 0.05
ζ Ratio between the baseline concentrations of the phosphatase
and the kinase (pp/dp)/(pk/dk)
Non-dimensional 2
Simulations of the AAT model with the reference parameters values listed in Table 1
are presented on fig. 2. Upon T cell conjugation with stimulatory APCs, a stimulus is
generated and one of two types of response are possible: either the stimulus is large enough
to lead to a super-threshold stimulation (κ(t)/π(t) ≥ 1) and switch the adaptor to the active
state (fig 2-left); or the stimulus is insufficient, resulting in a sub-threshold stimulation
(κ(t)/π(t) < 1) such that the adaptor remains inactive (fig 2-right). Both super- and sub-
threshold interactions change the kinase and phosphatase state of the T-cells and therefore
modify the activation threshold of the cell.
Page 141
Adaptable activation thresholds and lymphocyte homeostasis
121
Time / mins0 500 0 500
0
0
0
0
1
3
15
11
W*/W0
κ/π
κπ
σ
κ
π
A
B
C
D
κ
π
Ι ΙΙ ΙΙΙ
Ι ΙΙ ΙΙΙ
Ι ΙΙ ΙΙΙ
Ι ΙΙ ΙΙΙ
Figure 2 - Dynamic of the minimal model of TCR signal transduction. The left panel shows a super-
threshold stimulation and the right panel a sub-threshold stimulation. A - Ligand concentration; B - Kinase
(solid lines) and phosphatase (broken lines) concentration in response to ligand; C - Ratio between the
kinase and phosphatase activities; D - Activation state of the adapter molecule (W*). The three phases that
characterise the κ and π response are: I – The response to an increase in stimulus from a basal level; II –
The cell begins to adapt to the increased level of stimulus; and III – The refractory phase, when the
stimulus decreases to basal levels and the threshold is augmented. See text for details.
The response of a cell to a super-threshold stimulus is triphasic (fig 2-B,C). There is an
initial phase (response phase - I) where the kinase grows and overshoots the concentration
of phosphatase, leading to the activation of the adapter if the kinase overshoots the
phosphatase. The second phase (adaptation phase - II) initiates after the concentrations of
kinase and phosphatase reach a maximum. In this phase, the cell becomes adapted to the
stimulus and the ratio between the kinase and phosphatase concentrations converge to the
basal level. The third and final phase (refractory phase - III) starts when the stimulus
decreases or disappears. During this phase the threshold for switching on the adapter is
augmented relative to the adaptation phase (phase II) because the kinase decreases faster
Page 142
Adaptable activation thresholds and lymphocyte homeostasis
122
than the phosphatase, so a stimulus larger than the original one is necessary for the kinase
to overshoot the phosphatase. After the refractory phase, the cell returns to the initial state.
The memory a cell has of the previous encounters with antigen lasts for the duration of the
refractory phase.
4.2.1.2 AAT and frequency of the stimuli
The physiology of a T cell is such that it will have periods of conjugation with an
APC, which is loaded with stimulatory peptide and periods in which the T cell is detached
from APCs, receiving no stimulation. To simplify we will neglect interaction with APCs
that are not expressing the specific MHC-peptide. In order to have an analytic insight into
the behaviour the model in such conditions, lets assume that the cell is periodically
switching from receiving a stimulus σ(t)=σmax for an interval of time τs and receiving no
stimulus σ(t)=0 for an interval of time τ0. Under these conditions, a periodic oscillatory
state is attained where the kinase and phosphatase concentrations vary within a range that
depends on the intervals τ0 and τs, and the magnitude of the stimulus σmax. An analytic
solution for the orbit of the system can be obtained by piece-wise integration of equations 5
and 6.
Consider the nth period of stimulation and non-stimulation starting at instant tn =
n(τs+τ0). For an interval τS, the stimulus is positive (σ = σmax) and the analytical solution of
the system is:
( )
( ) ( )( )
+−+=+
+−−+=++−+
+−
)()(
)(
11)()(
)(11)(tt
maxtt
nn
ttmaxnmaxn
nn
n
eettt
etttφλφλ
φ
σζππ
σκσκ (8)
where κ(tn) and π(tn) are the concentrations of the kinase and phosphatase at the
beginning of the nth period (t = tn). After the interval τS, the stimulus ceases (σ = 0) for an
interval of time τ0 and the solution of the system is then:
( )
( )( )
−++=++
+−−=++++−++
++−
)()(
)(
1)()(
)(11)(tttt
snsn
ttsnsn
snsn
sn
eettt
etttτφλτφλ
τφ
ζτπτπ
τκτκ (9)
where κ(tn+τS) and π(tn+τS) are the values of κ(t) and π(t) when the stimulation ceases.
Because the system is periodic, the values of κ(tn), π(tn), κ(tn+τS) and π(tn+τS) are the same
for any nth period. Applying this condition, we obtain:
( )
( )
−−
−+=+ ++
++
sns
sns
n
n
ns een τττφ
τττφ
σττκ )(2
)(
max 1111))(( (10)
Page 143
Adaptable activation thresholds and lymphocyte homeostasis
123
( )
( )
−−
−+=+ ++
++
sns
sns
n
n
ns een τττφλ
τττφλ
σζττπ )(2
)(
max 1111))(( (11)
( )sns
ns
n
n
sns een τττφ
ττφ
στττκ ++
+
−−
+=++ )(2
)(
max 111))(( (12)
( ) ,...2,1,0)(2
)(
max 1
111))(( =++
+
∀
−
−−+=++ nn
n
sns sns
ns
een τττφλ
ττφλ
σζτττπ (13)
With these solutions for the initial values of each stimulatory and relaxing period
together with equations 8 and 9, we fully define the time evolution of the cascade leading to
switching on or off the T cell activation. Additionally, we need an assumption that
determines whether a cell will be activated when it detaches from the APC and the
stimulatory interval τs ceases. We will assume, for the sake of simplicity, that the T cell
will be activated if the adapter is switched on when it detaches from the APC. The T cell
will not be activated if the adapter is inactivated when the cell detaches from the APC, even
if during the conjugation the adapter was transiently switched on.
The behaviour of the model in response to such a periodic stimulation schedule is
illustrated in fig. 3, for the particular case where τs=τ0. At low frequency stimulus (left)
there is little overlap between the refractory period and the period of stimulation, so the
system responds to each rise in the stimulus. For frequent enough stimulus (right) the
refractory period is longer than the interval when there is no stimulus, and the cells are still
refractory when the stimulus becomes positive again. The cell is adapted and recurrent
increases in the stimulus do not result in switching on the adapter molecule.
Due to the threshold of activation and to the adaptation, for each set of parameters,
there is an optimal duration of the stimulus τs for switching on the adapter and leading to
activation (fig. 3-bottom). There may be no activation if the period of the stimulus is too
brief, such that there is not enough time for the kinase to supersede the phosphatase. In the
other extreme, the duration of the stimulus may be too long such that adaptation occurs and
W is switched off after a transient activation.
In summary, the AAT model predicts that at low frequency of encounters between a T
cell and a stimulatory APC the T cell remains responsive. In contrast, when the frequency
encounters with a stimulatory APC is high enough the cell may become refractory and
unresponsive.
Page 144
Adaptable activation thresholds and lymphocyte homeostasis
124
Time / mins
0 4000 0
0
0
0
0
1
2
100
55
4000
κ
π
κ
π
A
B
C
D
W*/W0
κ/π
κπ
σ
Figure 3 - Periodic stimulation of the minimal TCR signal transduction pathway. The left panel shows a
low frequency stimulation unable to fully adapt the system and capable of producing periodic super-
threshold stimulations. The right panel shows a high frequency stimulation, which is capable of inducing
adaptation in the system. A - ligand concentration; B - Kinase (solid lines) and phosphatase (broken lines)
concentration; C - Ratio between the kinase and phosphatase activities; D - Activation state of the adapter
molecule (W*).
4.2.2 DYNAMICS OF A POPULATION OF LYMPHOCYTES WITH AAT
De Boer and Perelson [35] have proposed previously a model for T cell population
dynamics, where activation, proliferation and survival of the cells are dependent on
conjugation with an APC site. Using this model they have shown that homeostatic
regulation of cell population sizes is a natural expectation from the density-dependent
proliferation/survival response that follows from competition among T cells for APC
Page 145
Adaptable activation thresholds and lymphocyte homeostasis
125
accessibility. In this section, we use our AAT model to ask how a putative adaptation of the
homeostatic response threshold would change this model T cell population dynamics. The
postulated processes are illustrated in the following diagram:
*)1(
TCAT d
d
c
ff → ←
→+ ⋅
−
α
α
(14a)
TT p 2* → (15b)
→mfT (16c)
Here it is assumed that the T cells and APCs are homogeneously distributed in space
and that the APCs are all providing the same stimulus (σ). The total number of APC sites is
constant and denoted A. The numbers of free APC sites, free T cells, conjugated T cells and
total T cells change as a function of time and are denoted as Af(t), Tf(t), C(t), and T(t),
respectively. Free T cells form conjugates with free APCs with rate that is proportional to
their respective numbers, with rate constant c. Conjugated T cells detach from the APCs
with rate constant d. The probability that a T cell deconjugated from with super threshold
stimulation is denoted by α. Activated T cells (T*) divide with a rate constant p. Resting T
cells die with a death rate constant m, an assumption that is supported by observations in a
class II conditional knockout [20]. Since only resting T cells die, conjugation with APCs
and activation rescues cells from death.
In the De Boer & Perelson model [35] the probability that a cell gets a suprathreshold
signal is the same for all the cells, which means that the fraction of cells that are activated
during conjugation is a simple constant:
adef=α (17)
Embedding the AAT signalling model within these population dynamics framework
amounts to define α as a function of the history of stimuli received by the cells. If we keep
track of the kinase and the phosphatase values in each individual cell i respectively κi(t) and
πi(t), we can define α as:
)()1( drrfrdef
⋅⋅−= ∫θα with )()( ttr πκ= (18)
where θ is a step function returning 0 when the argument is negative and 1 otherwise,
and f(κ(t)/π(t)) is the frequency distribution of the ratio between kinase and phosphatase
activities in the population of T cells at instant t.
Despite being conceptually straightforward, the AAT population dynamics model,
Page 146
Adaptable activation thresholds and lymphocyte homeostasis
126
formulated in this way, has an infinite state space that is not analytically tractable. To gain
insight into the properties and behaviour of this system, we followed to complementary
approaches. First, we simulated a population containing many individual T cells that realise
the Poisson processes above (model of Many Individual Cells – MIC model); second, we
derived a simpler quasi-steady state model (QSS model) describing the dynamic of the size
of the total T cell population. This quasi-steady state model uses simulation to obtain a
stationary frequency distribution of κ / π values and the corresponding value of α. The two
methods and their results are presented bellow. These results were obtained assuming, for
the sake of simplicity, that the rate of T cell proliferation is instantaneous (p = Infinity). We
also studied those cases where p is positive as well as implementations of the model where
the process of proliferation was described by an explicit delay, instead of a simple Poisson
process. The qualitative results presented bellow were systematically obtained with all
these versions and thus we believe they are general. Under these conditions we opted to
present only the results of the simplest case.
4.2.2.1 Methods for simulation of many individual cells and quasi-steady state
analysis
The simulations (see Appendix) follow the values of κi, πi and σi in a variable number
T of individual cells indexed i. A cell i has σi = 0 when it is free and σi = 1 when it is
conjugated with an APC, and the dynamic of κi and πi, followed according to eqns. 5 and 6.
The processes described in equations 14a-b take place at small discrete time steps τ. A free
cell has a constant probability τ × m of dying (being removed from simulation) and a
variable probability τ × c × Af of conjugating with any one of the Af free APCs. At the
instant of conjugation, we decrement by one the number of free sites Af. A conjugated cell
has a probability of dissociating from the APC and becoming a free cell of τ × c, per
iteration. When a cell i is released from the APC we reset the value σi = 0 and increment the
number of free sites Af. If, at the instant of T cell-APC detachment, κi / πi ≥ 1, then we
substitute the cell by two daughter cells which inherit the properties of its parent, i.e. they
have the same values of κ, π and σ. To simulate the case in which there is no adaptation,
we reset the values of κi and πi of each cell i at the instant a T cell-APC deconjugation.
To get better insight into this simulation we made a quasi-steady analysis of the
system. Following De Boer & Perelson [35] and Leon et al. [36] we write the dynamic of
Page 147
Adaptable activation thresholds and lymphocyte homeostasis
127
the number of T cells T(t) as:
( )CTmCddt
tTd ˆˆˆ)(−×−××= α (19)
Note that the term Cd ˆˆ ××α corresponds to the assumption that the process of cell
division is practically instantaneous, where α is the quasi-steady state fraction of cells
being activated following deconjugation from the APCs and C is the quasi-steady state
number of conjugates obtained as:
( ) ( )( )
cdATccTAdATc
ATC2
4),(ˆ
22 +++⋅⋅⋅−++≅ (20)
The problem we face is to specify this value of α as a function of the value of T(t)
when cells adapt their AAT. To solve this we tabled this function using Monte-Carlo
simulation as follows. We produce chains of conjugation periods with APC τ0 and free
periods τs, representing the history of individual cells in a population of lymphocytes cells
at a quasi-steady state, by drawing them from the corresponding distributions:
0)( 0ττ ddef −= (21)
( )( ) ( )( ) sATCAcs eATCAcg ττ ,ˆ,ˆ)( −−−= (22)
We solved the AAT signalling model for each chain of free and conjugation intervals
setting σ respectively to 0 and 1, and obtained the value of the ratio κ / π in the last
conjugation. Iterating until we obtained a stationary distribution f(κ / π), from which we
obtain α according to eqn. 18. Having tabled α and T values we obtained a cubic-spline
interpolation function that was used for numerical integration of eqn. 19. The constant
value of α = a for the case of non-adaptable lymphocytes simply as:
s
t
td dea d
u
s ττ
⋅= ∫⋅−
1
(23)
Where τu and τd are the time where κ(t) and π(t) are identical, i.e. they limit the
interval of time where κ(t) > π(t).
4.2.2.2 Results of simulation and quasi-steady state analysis of the AAT population
model
The results of the MIC and QSS models are co-plotted in fig. 4a. The reference
parameter set (Tables 1 and 2) was chosen to illustrate that the kinetic of the two solutions
can differ significantly, but that the steady states obtained by the two approaches are the
Page 148
Adaptable activation thresholds and lymphocyte homeostasis
128
same. With the MIC model it is possible to infer the presence of unstable steady states but
we cannot measure them (fig. 4A). Using the QSS model, it is easy to obtain phase spaces
and the bifurcation diagram of the model (fig 4B).
Figure 4 - Results of model simulations. A – Comparison between population growth with out adaptation
using the QSS model (black line) and the SMIC model (grey lines). B – Simulations of the QSS (dashed
lines) and SMIC models (full lines) with adaptation, which show that both predict the same steady states.
C & D – Predicted steady states, using the QSS model, without (C) and with (D) adaptation. Strong lines
denote proliferation rates and light lines death rates. Stable fixed points are denoted as closed circles
whereas unstable fixed points are denoted with open circles.
The population of non-adaptable lymphocytes shows logistic growth kinetics, reaching
a nontrivial steady state whenever the proliferation rate constant (α × d × (A - C)) is greater
Page 149
Adaptable activation thresholds and lymphocyte homeostasis
129
than the death rate (m). Otherwise the population will always go extinct. The number of T
cells in the persistent steady state is a linear function of the number of APCs sites, which
reflects that the size of the T cell population is the actual limitation in the number of APCs
sites A. Table 2 – Variables and parameters of the model of a popula tion of adaptable lymphocytes
Variable Meaning Units
T Total number of T cells Cells
TF Number of non-conjugated T cells Cells
AF Number of non-conjugated APCs Cells
C Number of conjugates between APCs and T cells Conjugates
Parameters Meaning Units Value
A Total number of APCs cell 5000
σAPC Antigen stimulus provided by APCs Non dimensional 1100
c APC-T cell conjugation rate constant cell-1 hour-1 0.001
d APC-T cell deconjugation rate constant hour-1 1
m Death rate constant of T cells hour-1 0.002
We then asked how the dynamic of the AAT lymphocyte population differs from the
prototypic dynamic of a non-adaptable lymphocyte population. Both the MIC and the QSS
solutions reveal that for the reference parameters there are two possible stable steady states
(fig. 4A). Analysis of the phase-diagram of the QSS model indicates that there is an
additional saddle point (fig. 4B). this saddle point, most of the cess dissociating from
APCs are mostly adapted, whereas above this saddle point there is a significant fraction of
these cells in a responsive state (Fig 5).
The nature of this saddle point brought into existence by AAT is better understood by
the bifurcations introduced by changing the parameter that controls the rate of change of the
intracellular AAT signalling molecules, φ (fig 6A). As φ increases to values higher then the
reference the cells tend to relax faster to baseline κ and π values after deconjugation. Thus,
the behaviour of adaptable cell population tends asymptotically to that of the non-adaptable
population, and the saddle point tends to extinction steady state until it disappears and
extinction become unstable. As φ decreases to lower values than the reference the cells
relax slower becoming more and more unresponsive. Accordingly, the population size in
the stable steady state decreases progressively. The persistence stable state and the saddle
point eventually fuse and disappear, while the extinction steady state becomes stable.
Page 150
Adaptable activation thresholds and lymphocyte homeostasis
130
Figure 5 - Frequency distributions of k/p values in cells after deconjugation according to the QSS model
for total T cell numbers bellow (100 cells, grey) and above (3000 cells, black) the saddle point. The
parameters are the same as in fig.4D.
The bifurcation diagram as a function of the number of APCs around the reference
parameters shows (fig 6B), by comparison with the diagram for non-adaptable
lymphocytes, that the contribution of AAT is the appearance of the saddle point that
stabilizes the baseline steady state. In the presence of AAT the stable state representing
persistence continues to increase linearly with the number of APC sites (fig. 6B), which
indicate that the size of the population is also limited by APC availability.
Figure 7 shows bifurcation diagrams for the remaining parameters that control
adaptation of the signalling pathway, λ and ζ. There is a maximum value of that allows the
kinase to overcome the phosphatase transiently, yielding two stable states in the AAT
lymphocyte dynamics (fig. 7A). In the bifurcation diagram of (fig. 7B), two bifurcation
points are apparent; the first originates a saddle from the steady state denoting the collapse
of the population, leading to the stabilization of this steady state. The second bifurcation
occurs when this saddle meets the stable state representing persistence of T cells, leading to
the existence of a single stable steady state denoting the collapse of the population. These
two bifurcation points limit the interval of where is sufficiently high for adaptation to
become significant, but sufficiently low to allow the activation of the cells for division.
Figure 7C shows the regions of the plane where the AAT cell population dynamics have
either a single stable steady state denoting the collapse of the population; a stable and an
Page 151
Adaptable activation thresholds and lymphocyte homeostasis
131
unstable steady states, denoting persistence of the population unadapted; and two stable and
one unstable steady states, denoting either the persistence of lymphocytes in an unadapted
or the collapse of lymphocytes due to adaptation.
figure 6 - Bifurcation diagram of the cell population model as a function of the numbers of APCs A (A)
and the rate of the AAT signalling model φ (Β). The solid lines represent stable steady states and the
dashed lines represent unstable steady states as predicted by the QSS model. The dots represent average
solutions using the SMIC model. The remaining parameters are set to the reference values.
Page 152
Adap
tabl
e ac
tivat
ion
thre
shol
ds a
nd ly
mph
ocyt
e ho
meo
stas
is
13
2
λ10
-410
-210
0
ζ
110
C
λ
10-6
10-4
10-2
100
0
2000
4000
Number of cells
ζ
0
2000
4000
Number of cells
110A B
λ
10-6
10-4
10-2
100
0
2000
4000
Number of cells
ζ
0
2000
4000
Number of cells
110A B
I II
III
Figu
re 7
- B
ifurc
atio
n di
agra
ms
of th
e ce
ll po
pula
tion
QSS
mod
el a
s a
func
tion
of ζ
(A),
λ (B
) and
ζ a
nd λ
(C).
A a
nd B
– S
olid
line
s re
pres
ent s
tabl
e st
eady
sta
tes
and
dash
ed li
nes
repr
esen
t uns
tabl
e st
eady
sta
tes.
C –
Reg
ions
I, II
and
III l
imit
ζ an
d λ
para
met
er v
alue
s w
here
the
mod
el h
as a
sin
gle
glob
ally
sta
ble
stea
dy s
tate
den
otin
g
the
colla
pse
of th
e po
pula
tion;
is in
a b
ista
ble
regi
me,
den
otin
g ei
ther
the
colla
pse
of th
e po
pula
tion
or th
e pe
rsis
tenc
e of
cel
ls; o
r has
a si
ngle
glo
bally
stab
le st
eady
stat
e,
resp
ectiv
ely.
The
solid
line
s rep
rese
nt th
e λ
and
ζ va
lues
in A
and
B.
Page 153
Adaptable activation thresholds and lymphocyte homeostasis
133
The appearance of a saddle point under the AAT model is easily amenable to
qualitative interpretation. In a non-adaptable lymphocyte population, as the cell density
increases the average duration of the period the cells remain without interacting with the
APC τ0 increases (eqn 22). The frequency of stimulatory interactions with the APC
decreases and the death rate increases accordingly. This creates the negative feedback loop
responsible for the stability of the steady state. Adaptation of activator thresholds brings
into existence a positive feedback loop and the corresponding saddle point. As the average
period individual lymphocytes remain without interacting with the APC increases with
lymphocyte density, there is more time to reset the activator threshold. In other words, as
lymphocyte density increases the individual cells become, on average, less refractory to
activator signals. Reciprocally, the lymphocytes become increasingly more refractory as the
cell density decreases. Hence, the survival / proliverative responsiveness of adaptable
lymphocytes is the inverse of what would be expected from an homeostatic regulatory
mechanism, in contrast with competition for available APCs.
In conclusion, the embedding of an AAT signalling model within the dynamics of a
population of lymphocytes that respond to APCs with increased survival and proliferation,
indicates that adaptation brings in a positive feedback loop and a critical value. Bellow this
critical value the population becomes increasingly refractory and ultimately goes extinct if
not supplemented by an external source. Above this critical value the lymphocytes become
increasingly more responsive until they reach a steady state limited by external factors,
such as the availability of APCs as studied in the present case.
4.2.2.3 Thymic influx of refractory and responsive lymphocytes
The conclusion of the previous section was that according to the AAT population
model, sufficiently small populations of autoreactive T cells will be prevented from
expanding and will eventually go extinct. Hence, the model offers a mechanism for
preventing autoimmune disease. In this section we ask how robust is this mechanism of
tolerance concerning the magnitude of thymic influx.
We performed simulations of the MIC model which start with zero cells and allow for
a constant influx of new cells at a constant rate of s cells per unit of time (fig. 8A). We
explored two extreme situations, one in which the cells come out of the thymus adapted and
Page 154
Adaptable activation thresholds and lymphocyte homeostasis
134
refractory to peripheral stimuli or fully responsive. In the first case, for sufficiently small
influx rates a non-zero steady state in which most cells are refractory/unresponsive to the
stimuli is reached. This baseline steady state corresponds to the extinction observed in the
absence of an influx. The number of cells in this steady state increases linearly with the
influx rate until a critical influx rate is reached (fig.8B). At influx rates higher than this
critical value the population of cells systematically grows to the steady state in which most
cells are responsive and the size of the populations is limited by APC accessibility (fig.8A
and 8B). This autonomous persistence state is the same as before as long as the influx is not
significant (~ 3535 cells). The critical influx rate corresponds to the saddle point created by
AAT, and thus is affected by the parameters that determine adaptation and refractoriness.
Cell refractoriness changes monotonously with the value of φ around the reference
parameters. When the influx is zero the saddle point converges monotonously to the
extinction state as φ increases and to the autonomous persistence state as φ decreases (fig.
4D). The value of the critical influx that determines that the system will switch from
baseline to autonomous persistence steady states changes inversely with that of φ (fig. 8C).
In the case all cells produced by the thymus are fully responsive the system will
systematically attain the autonomous persistence steady state in which most cells are not
refractory and in which the population size is limited by APC accessibility (fig. 8B-white
dots).
In conclusion, the implementation of AAT population indicates that the adaptation of
stimulatory thresholds by recurrent interactions with self-antigens in the periphery offers a
filter to delete self-reactive T cells produced by the thymus, i.e. to prevent clonal expansion
in response to self-antigens. However, this filter is only efficient if recent thymic emigrants
would be pre-adapted to self-antigens in the thymus, and if the contribution of the thymus
to the size of the periphery is relatively minor.
Page 155
Adap
tabl
e ac
tivat
ion
thre
shol
ds a
nd ly
mph
ocyt
e ho
meo
stas
is
135
Figu
re 8
– Im
pact
of t
hym
ic in
flux
on th
e A
AT
popu
latio
n dy
nam
ics.
A. K
inet
ics o
f the
size
of t
he p
opul
atio
n fo
r the
indi
cate
d va
lues
of i
nflu
x of
refr
acto
ry c
ells
(s=1
).
B- S
tead
y st
ate
popu
latio
n si
ze a
s a fu
nctio
n of
thym
ic in
flux
of c
ells
that
are
fully
resp
onsi
ve (e
mpt
y ci
rcle
s) o
r ful
ly a
dapt
ed/re
frac
tory
cel
ls (b
lack
circ
les)
. The
arr
ow
indi
cate
s the
crit
ical
val
ue a
t whi
ch th
e ba
selin
e po
pula
tion
size
bec
omes
uns
tabl
e . C
- The
crit
ical
val
ue a
s a fu
nctio
n of
the
valu
e of
φ. T
he v
alue
s are
the
corr
espo
ndin
g
thym
ic in
flux
s of f
ully
refr
acto
ry c
ells
. A
ll th
e re
sults
wer
e ob
tain
ed ru
nnin
g th
e SM
IC m
odel
usi
ng th
e re
fere
nce
para
met
er v
alue
s.
Page 156
Adaptable activation thresholds and lymphocyte homeostasis
136
4.3 Discussion
Recently, adaptation of activation thresholds has been discussed in the context of
peripheral tolerance and homeostasis [17-19]. We show here that a mechanism of
adaptation of activation thresholds once placed in the context of population dynamics of T
lymphocytes dependent on recurrent interactions with APCs results in the “deletion” of
cells by ignorance rather than in persistence of unresponsive anergic cells. In our model
lymphocytes that adapted to chronic stimulus by raising their activation threshold will fail
to respond appropriately to homeostatic challenges and thus are unable to persist.
Adaptation leads to proliferative responses of T cells that are inverse of those required by
homeostatic feedback control. This theoretical result shows a shortcoming of taking a
simple reductionist view of adaptation of cell responsiveness. On the other hand, it gives
clues for a comprehensive model of peripheral tolerance, where adaptation of cells to
chronic stimuli might be coordinated with other mechanisms controlling cell numbers.
Grossman & Paul [15] posited that a signalling pathway displaying adaptation of
activation thresholds requires at least two processes with different time scales. A fast
process, responsible for a positive activator signal, and a slower process producing a
negative signal, which ultimately brings the cell back to quiescence in the presence of
continuous stimulus. We engineered a model that shows these features. The parameters
were chosen such the kinase (positive signal) responds faster to stimulus than the
phosphatase (negative signal) but at the steady state the activity of the phosphatase always
supersedes that of the kinase. To our knowledge this is the simplest model featuring all the
properties postulated by Grossman & Paul.
The design of the TCR signalling cascade in our model was inspired in the regulation
of the activity of Zap 70, a protein tyrosine kinase downstream of the TCR. The balance
between the active and inactive forms of Zap70 influences the sensitivity of T cell
activation [37]. Zap70 is activated by lck phosphorylation [37, 38] and inactivated by a
tyrosine phosphatase, possibly SHP-1 [39]. Notwithstanding the similarities, the model is
too simple to be adequately identified with a particular molecular mechanism. However,
since it imposes particular relationships between the duration of adaptation and refractory
period and the duration of conjugation and relaxing periods of the cells, it may guide in the
choice of what could be the positive and negative process involved in adaptation of
Page 157
Adaptable activation thresholds and lymphocyte homeostasis
137
lymphocytes. Thus, the plausibility of Zap70 being the adaptable switch of T cell activation
will critically depend on the dynamics of the regulation of its expression or the regulation
of its activation states in vivo, for which we have no kinetic data. Accessory molecules such
as CD4 [17] and CD5 [18, 19] can modify the sensitivity of T cells to antigen-mediated
activation in a lasting way and are thus also good candidates for adaptation mechanisms.
The down-modulation of TCR by specific ligand [40] is also a candidate mechanism for the
adaptation of the T cell signalling thresholds [16]. The refractory period in TCR down-
regulation corresponds to the recovery of normal levels of TCR in the T cell. The recovery
of normal levels of TCR expression may take about a week [21, 40, 41], which is in
agreement with the refractory periods in the simple signalling model of the AAT
lymphocyte.
Cell cycle has been shown to affect the expression or activity of several proteins [42-
44]. We assumed here that the daughter cells will display the same configuration of the
kinase-phosphatase cascade as their progenitor cell. This is a simplifying assumption and a
reflection of the absence of information on how cell division affects the adaptation state of
cells. Obviously, if the cell cycle induces a reset of the adaptation state of the cells, or if the
duration of the refractory period is shorter than the duration of cellular division, it would be
difficult to envisage the relevance of adaptation for T cell population dynamics.
As we have shown here, unresponsive cells will not be maintained if the homeostatic
response to T cell depletion is dependent on the availability of APC [35, 45, 46] and is
adaptable [13-15]. This shortcoming can be circumvented by complementary or alternative
assumptions that are worth discussing.
The trivial solution is that adaptation of activation thresholds has no impact in T cell
population dynamics because the later is independent of TCR signalling and interactions
with APCs. This is however difficult to reconcile with the observations that sudden ablation
of TCR or MHC expression results in loss of T cells [20, 21, 47].
In our model the signalling cascades leading to homeostatic responses of T cells are
downstream the TCR and display the same threshold as those responses leading to
activation to effector function. If the homeostatic response signals are not adaptable but
those for full activation are adaptable, then we could easily foresee a situation in which a
homeostatic feedback is responsible for an independent set point. In this homeostatic set
point the average frequency of conjugation with APC could be sufficiently high to maintain
a significant fraction of cells that are refractory to full activation. However, if the
Page 158
Adaptable activation thresholds and lymphocyte homeostasis
138
homeostatic response curve is adaptable to recurrent interactions with the APC the problem
we pinpointed here is unavoidable.
Grossman et al. [13-15] have also proposed that adapted unresponsive T cells could
raise the thresholds of naïve cells in their neighbourhood. This mechanism offers a control
of T cell responses that is appropriate for homeostatic mechanisms. The more T cells the
more frequent are the interactions leading to adaptation and unresponsiveness, i.e. the more
T cells the lower the proliferation per cell. A population dynamic model in which a subset
of cells are irreversibly unresponsive and make naive cells become unresponsive has been
proposed and studied by Leon et al [36], who have shown that depending on parameter
values this can lead to homeostasis in a situation in which the loss of unresponsive cells is
compensated by a continuous source from naïve cells. However, in other regimes the
unresponsive cells may simply be lost. An explicit model in which naïve cells become
reversibly unresponsive by recurrent interactions with APCs or by interactions with other
unresponsive cells may not be trivial and remains to be done.
Despite the fact that our AAT population model cannot explain simultaneously both
the persistence and unresponsiveness of autoreactive T cells it offers nevertheless a means
by which recent autoreactive thymic immigrants could be prevented from undergoing
peripheral expansion and causing autoimmunity. Our results indicate that this mechanism
of peripheral tolerance is not absolutely efficient and would depend critically on the daily
production of new cells by the thymus. Only if autoreactive cells come out of the thymus in
a refractory state and their daily production is relatively minor, will peripheral expansion be
prevented. Otherwise, this mechanism of peripheral tolerance becomes unreliable.
Unresponsiveness of cells following expansion in adoptively transferred recipients has
been interpreted as the emergence of refractoriness in cell populations induced by recurrent
interactions with stimulating APCs [48]. The proliferative response curves in these
experiments comply well with a homeostatic mechanism since unresponsiveness increases
with cell numbers. However, our AAT population model predicts the opposite relationship
between cellular responsiveness and population size. Our theoretical analysis indicates that
caution should be taken when interpreting the former experiments since the formal
implication of AAT in these observations is not straightforward and might be unwarranted.
Indeed, in many of these adoptive transfer experiments, changes in whole population
responsiveness can alternatively be explained by changes in the composition of cell
populations [17-19].
Page 159
Adaptable activation thresholds and lymphocyte homeostasis
139
Often simple molecular mechanisms offer parsimonious explanations to the behaviour
of a biological system. We have followed the implications of a molecular mechanism of T
cell activation into the domain of cell population dynamics. According to our model, based
on reasonable assumptions, adaptation of activation thresholds following recurrent
interactions with APCs leads to peripheral deletion in conditions where tuning is pertinent
to T cell population dynamics. We conclude that postulating adaptation of peripheral cells
to chronic stimulus by self-antigens is not enough to explain the persistence of a significant
pool of auto reactive T cells in the absence of autoimmunity. A convincing mechanism
explaining peripheral tolerance requires additional postulates about cell population
dynamics and will depend critically on those postulates.
4.4 Bibliography 1. Burnet, F., A modification of Jerne’s theory of antibody production using the concept of clonal
selection. Aust J Sci, 1957. 20: p. 67–69.
2. Lederberg, J., Genes and Antibodies. Science, 1958. 129: p. 1649-53.
3. Acha-Orbea, H. and H.R. MacDonald, Superantigens of mouse mammary tumor virus. Annu
Rev Immunol, 1995. 13: p. 459-86.
4. Kisielow, P., et al., Tolerance in T-cell-receptor transgenic mice involves deletion of
nonmature CD4+8+ thymocytes. Nature, 1988. 333(6175): p. 742-6.
5. Nanda, N.K. and E. Sercarz, A truncated T cell receptor repertoire reveals underlying
immunogenicity of an antigenic determinant. J Exp Med, 1996. 184(3): p. 1037-43.
6. Julia, V., M. Rassoulzadegan, and N. Glaichenhaus, Resistance to Leishmania major induced
by tolerance to a single antigen. Science, 1996. 274(5286): p. 421-3.
7. Pereira, P., et al., Autonomous activation of B and T cells in antigen-free mice. Eur J
Immunol, 1986. 16(6): p. 685-8.
8. Sakaguchi, S., et al., Organ-specific autoimmune diseases induced in mice by elimination of T
cell subset. I. Evidence for the active participation of T cells in natural self-tolerance; deficit of
a T cell subset as a possible cause of autoimmune disease. J Exp Med, 1985. 161(1): p. 72-87.
9. Sakaguchi, S., Animal models of autoimmunity and their relevance to human diseases. Curr
Opin Immunol, 2000. 12(6): p. 684-90.
10. Hammerling, G.J., et al., Non-deletional mechanisms of peripheral and central tolerance:
studies with transgenic mice with tissue-specific expression of a foreign MHC class I antigen.
Immunol Rev, 1991. 122: p. 47-67.
11. Taams, L.S., et al., Anergic T cells actively suppress T cell responses via the antigen-
presenting cell. Eur J Immunol, 1998. 28(9): p. 2902-12.
Page 160
Adaptable activation thresholds and lymphocyte homeostasis
140
12. Lombardi, G., et al., Anergic T cells as suppressor cells in vitro. Science, 1994. 264(5165): p.
1587-9.
13. Grossman, Z. and W.E. Paul, Adaptive cellular interactions in the immune system: the tunable
activation threshold and the significance of subthreshold responses. Proc Natl Acad Sci U S A,
1992. 89(21): p. 10365-9.
14. Grossman, Z. and W.E. Paul, Self-tolerance: context dependent tuning of T cell antigen
recognition. Semin Immunol, 2000. 12(3): p. 197-203; discussion 257-344.
15. Grossman, Z. and W.E. Paul, Autoreactivity, dynamic tuning and selectivity. Curr Opin
Immunol, 2001. 13(6): p. 687-98.
16. Viola, A. and A. Lanzavecchia, T cell activation determined by T cell receptor number and
tunable thresholds. Science, 1996. 273(5271): p. 104-6.
17. Nicholson, L.B., A.C. Anderson, and V.K. Kuchroo, Tuning T cell activation threshold and
effector function with cross- reactive peptide ligands. Int Immunol, 2000. 12(2): p. 205-13.
18. Smith, K., et al., Sensory Adaptation in Naive Peripheral CD4 T Cells. J Exp Med, 2001.
194(9): p. 1253-1262.
19. Wong, P., et al., Dynamic tuning of T cell reactivity by self-peptide-major histocompatibility
complex ligands. J Exp Med, 2001. 193(10): p. 1179-87.
20. Witherden, D., et al., Tetracycline-controllable selection of CD4(+) T cells: half-life and
survival signals in the absence of major histocompatibility complex class II molecules. J Exp
Med, 2000. 191(2): p. 355-64.
21. Polic, B., et al., How alpha beta T cells deal with induced TCR alpha ablation. Proc Natl Acad
Sci U S A, 2001. 98(15): p. 8744-9.
22. Freitas, A.A. and B. Rocha, Population biology of lymphocytes: the flight for survival. Annu
Rev Immunol, 2000. 18: p. 83-111.
23. Marrack, P., et al., Homeostasis of alpha beta TCR+ T cells. Nat Immunol, 2000. 1(2): p. 107-
11.
24. Cardell, S., et al., CD1-restricted CD4+ T cells in major histocompatibility complex class II-
deficient mice. J Exp Med, 1995. 182(4): p. 993-1004.
25. Tanchot, C., et al., Differential requirements for survival and proliferation of CD8 naive or
memory T cells. Science, 1997. 276(5321): p. 2057-62.
26. Seddon, B. and D. Mason, Peripheral autoantigen induces regulatory T cells that prevent
autoimmunity. J Exp Med, 1999. 189(5): p. 877-82.
27. Germain, R.N. and I. Stefanova, The dynamics of T cell receptor signaling: complex
orchestration and the key roles of tempo and cooperation. Annu Rev Immunol, 1999. 17: p.
467-522.
28. van der Merwe, P.A., The TCR triggering puzzle. Immunity, 2001. 14(6): p. 665-8.
Page 161
Adaptable activation thresholds and lymphocyte homeostasis
141
29. Cantrell, D., T cell antigen receptor signal transduction pathways. Annu Rev Immunol, 1996.
14: p. 259-74.
30. Clements, J.L., et al., Integration of T cell receptor-dependent signaling pathways by adapter
proteins. Annu Rev Immunol, 1999. 17: p. 89-108.
31. O'Shea, J.J., et al., Activation of human peripheral blood T lymphocytes by pharmacological
induction of protein-tyrosine phosphorylation. Proc Natl Acad Sci U S A, 1992. 89(21): p.
10306-10.
32. Secrist, J.P., et al., Stimulatory effects of the protein tyrosine phosphatase inhibitor,
pervanadate, on T-cell activation events. J Biol Chem, 1993. 268(8): p. 5886-93.
33. Mustelin, T., et al., Lymphocyte activation: the coming of the protein tyrosine phosphatases.
Front Biosci, 1998. 3: p. D1060-96.
34. Koshland, D.E., Jr., A. Goldbeter, and J.B. Stock, Amplification and adaptation in regulatory
and sensory systems. Science, 1982. 217(4556): p. 220-5.
35. De Boer, R.J. and A.S. Perelson, Competitive control of the self-renewing T cell repertoire. Int
Immunol, 1997. 9(5): p. 779-90.
36. Leon, K., et al., Modelling T-cell-mediated suppression dependent on interactions in
multicellular conjugates. J Theor Biol, 2000. 207(2): p. 231-54.
37. Mege, D., et al., Mutation of tyrosines 492/493 in the kinase domain of ZAP-70 affects
multiple T-cell receptor signaling pathways. J Biol Chem, 1996. 271(51): p. 32644-52.
38. Scharenberg, A.M., et al., Reconstitution of interactions between tyrosine kinases and the high
affinity IgE receptor which are controlled by receptor clustering. Embo J, 1995. 14(14): p.
3385-94.
39. Brockdorff, J., et al., Dephosphorylation of ZAP-70 and inhibition of T cell activation by
activated SHP1. Eur J Immunol, 1999. 29(8): p. 2539-50.
40. Valitutti, S., et al., Sustained signaling leading to T cell activation results from prolonged T
cell receptor occupancy. Role of T cell actin cytoskeleton. J Exp Med, 1995. 181(2): p. 577-
84.
41. Sousa, J. and J. Carneiro, A mathematical analysis of TCR serial triggering and down-
regulation. Eur J Immunol, 2000. 30(11): p. 3219-27.
42. Richter, A., M. Lohning, and A. Radbruch, Instruction for cytokine expression in T helper
lymphocytes in relation to proliferation and cell cycle progression. J Exp Med, 1999. 190(10):
p. 1439-50.
43. Bird, J.J., et al., Helper T cell differentiation is controlled by the cell cycle. Immunity, 1998.
9(2): p. 229-37.
44. Weintraub, H., et al., The generation and propagation of variegated chromosome structures.
Cold Spring Harb Symp Quant Biol, 1978. 42(Pt 1): p. 401-7.
Page 162
Adaptable activation thresholds and lymphocyte homeostasis
142
45. Cho, B.K., et al., Homeostasis-stimulated Proliferation Drives Naive T Cells to Differentiate
Directly into Memory T Cells. J Exp Med, 2000. 192(4): p. 549-556.
46. Goldrath, A.W., L.Y. Bogatzki, and M.J. Bevan, Naive T cells transiently acquire a memory-
like phenotype during homeostasis-driven proliferation. J Exp Med, 2000. 192(4): p. 557-64.
47. Labrecque, N., et al., How much TCR does a T cell need? Immunity, 2001. 15(1): p. 71-82.
48. Tanchot, C., et al., Adaptive tolerance of CD4+ T cells in vivo: multiple thresholds in response
to a constant level of antigen presentation. J Immunol, 2001. 167(4): p. 2030-9.
Page 163
General discussion
143
5 General discussion
5
General Discussion
Page 164
General discussion
144
Page 165
General discussion
145
Lymphocyte fate is determined by the intersection between the set of receptors
expressed in the cell and the set of stimuli present in the environment. Hence, the study of
the signalling pathways, the integration of signals and the interference between the
signalling pathways becomes crucial to understand lymphocyte population dynamics. The
coordination of the dynamics of signalling pathways and lymphocyte population spans both
temporal and physical scales. The models presented here deal with the problem of the
contribution of cellular processes to population dynamics processes. As part of this
ambitious goal, we built mathematical models focusing on T lymphocyte dynamics as a
function of underlying molecular processes.
To address what are the consequences of sharing cytokine receptor chains between
cytokine receptors, we built and studied a prototypic model of cytokine receptor
engagement and cross-linking. This model describes the engagement and cross-linking of
IL-2 and IL-4 cytokine receptors, which are members of the γc cytokine receptor family
that share the common gamma chain (Sugamura, Asao et al. 1996; Gesbert, Delespine-
Carmagnat et al. 1998; Nelms, Keegan et al. 1999). Using a steady state simplification of
the receptor engagement mechanism by IL-2 and IL-4, together with available experimental
data, we demonstrated that these two cytokines could interfere at the level of the receptor
via the common gamma chain. Such γc-mediated interference has already been suggested in
the IL-13 receptor system (Kuznetsov and Puri 1999). Our results suggested consequences
for the population dynamics of cells that rely on IL-2 and IL-4 for differentiation and
proliferation. Thus, the case of ThP and Th2 population dynamics was studied as a
prototypic model of the influence of cytokine receptor interference on cell population
dynamics. The results of the model show that IL-2 inhibition of IL-4 signalling can account
for the synergistic properties of IL-2 and IL-4 in Th2 generation (Morel, Burke et al. 1996;
Burke, Morel et al. 1997) and in addition, predict that the IL-2-dependent precursors for
Th2 are able to resist the pressure to differentiate the whole precursor pool to Th2. These
results can be summarized as a) competition for common cytokine receptor chains can have
an impact at the population dynamics level; and b) that positive feedback regulation loops,
like the kind that regulate lymphocyte differentiation, when combined with proliferation of
precursors and resistance to differentiation, leads to the preservation of precursors and to a
synergism in the number of differentiated cells.
Page 166
General discussion
146
The IL-4R and IL-2R engagement model allowed us to derive the dose response curve
for IL-2 and IL-4, as well as the γc-mediated interference between IL-2R and IL-4R. The
experimental estimates of γc concentration are in a range where it is limiting (Kondo,
Takeshita et al. 1993); hence in the presence of high enough concentrations of IL-4 and IL-
2, the IL-2R and IL-4R will compete for available γc. Due to the respective concentrations
and affinities of the IL-2 and IL-4 receptor chains (this thesis, (Kondo, Takeshita et al.
1993; Roessler, Grant et al. 1994)), the IL-2R has a more prominent interference with IL-
4R than vice-versa; IL-4 interference with IL-2 can even be considered negligible.
Assuming that the concentrations of receptor chains are in a quasi steady state and that
cytokine signalling is proportional to the amount of fully assembled receptor-ligand
complex, it was possible to derive that IL-2 can inhibit IL-4 signalling. The model allowed
us to build adequate dose-response curves for combined IL-2 and IL-4 signalling, based on
parameters estimated experimentally (Robb, Greene et al. 1984; Kondo, Takeshita et al.
1993).
The model relies in strong assumptions of the mechanism of receptor-ligand
complexes, motivated both by the need of simplicity and the absence of enough quantitative
data. These approximations impair the quantitative interpretation of the results of the
model; hence only qualitative relationships such as the assymetry in the interference
between IL-2 and IL-4 under the relative scarcity of γc should be considered.
Different cells may express different levels of cytokine receptor chains as a result of
their differentiation status or of past stimulations. Unfortunately there is not enough
experimental data to provide a measure of such variability, thus the concentrations used in
the model should be considered only indicative of the possible concentration of these
receptor chains in the cells. Taking into consideration that receptor chains are internalised
and degraded (Duprez and Dautry-Varsat 1986; Duprez, Cornet et al. 1988; Galizzi, Zuber
et al. 1989; Hemar, Lieb et al. 1994; Hemar, Subtil et al. 1995), that shared cytoplasmatic
signal components might also be limiting (Decker and Meinke 1997; Leonard and O'Shea
1998), and that the γc might be used by other cytokine receptors (Sugamura, Asao et al.
1996), it can be argued that the model is minimizing the interference of signals by IL-2 and
IL-4. Further exploration on this issue as well as on the possible importance of the low
affinity IL-2 receptor is required to assess to which extent these arguments may be relevant.
The population dynamics model of cytokine receptor interference takes from our
finding that IL-2 can inhibit IL-4 signalling, and explores the possible consequences at the
Page 167
General discussion
147
level of regulation of ThP differentiation to Th2. This population model is based in a mean
field description of both populations. The differentiation of cells requires several division
rounds (Hodgkin, Lee et al. 1996; Gett and Hodgkin 1998), producing a heterogenous
population of cells at various differentiated stages and/or in different stages of the cell
cycle. These assumptions allow us to use the mean field formalism to describe the cell
population dynamics of ThP and Th2 with relative simplicity. The model does not consider
the effect of ThP depletion by alternative differentiation pathways (O'Garra 1998) nor the
effect of cytokines secreted by other populations (such as Th1 cells, dendritic cells and
macrophages) on both ThP and Th2 population dynamics (Ma, Chow et al. 1996; Murphy,
Shibuya et al. 1996; Szabo, Dighe et al. 1997; O'Garra 1998). Considering these pathways
implies modelling the cells and cytokines involved (Fishman and Perelson 1994; Carneiro,
Stewart et al. 1995; O'Garra 1998; Bergmann, van Hemmen et al. 2002), which would taint
the relative simplicity of this model. Such an extension should nevertheless be added to this
model in the future, together with modelling further events downstream of the cytokine
receptor engagement.
The interference of IL-2 and IL-4 signalling might not be restricted to sharing γc. It is
not uncommon that different cytokines depend on the same Jak kinases and some of the
STATs (Decker and Meinke 1997; Leonard and O'Shea 1998). Interestingly, in the case of
IL-4 and IL-2, although Jak-STAT signalling depends on the same Jak kinases, it relies on
a different set of STATs (Leonard and O'Shea 1998). Other cytokine receptor systems of
the γc and other families also rely on overlapping elements of the Jak-STAT pathway, see
for example the reviews on signalling via the γc (Sugamura, Asao et al. 1996; Malek, Porter
et al. 1999), gp130 (Hirano 1998) and βc (Scott and Begley 1999) common cytokine
receptor chains.
A hypothesis is that sharing cytokine receptor chains is a means to organize the
hierarchy of cell responses to cytokines. IL-7 is a candidate cytokine for the regulation of T
cell homeostasis (reviewed in (Fry and Mackall 2001)). For example, in the same way as
IL-2 can inhibit IL-4-mediated differentiation, IL-2 could inhibit IL-7-mediated
homeostatic proliferation, shifting cell proliferation from a homeostatic mode to an immune
response mode.
An interesting possibility that this model illustrates is the existence of dynamic
mechanisms for self-preservation of peripheral naïve lymphocyte precursors. These
mechanisms might be clone specific, being important for the differentiation of effector
Page 168
General discussion
148
classes, or clone unspecific, being important the preservation of self-regenerating precursor
cells. Figure 1 shows conceptually how such mechanisms could help preserve the
intermediate pools of differentiating cells, giving the immune system the ability to trace
back on lymphocyte differentiation (Bergmann, van Hemmen et al. 2002), channelling the
flow of differentiating cells to specific goals.
-
+
A
+
-
+
B
+
+
B
+
Figure 1 – Hypothetic differentiation pathway of lymphocytes illustrating how the maintenance of
precursors by balancing differentiation and proliferation can maintain open alternate differentiation
pathways. A – By balancing proliferation and differentiation the precursor cells at the differentiation
crossroad are maintained, hence the lymphocyte clone/population keeps multipotent. B – Without
balancing proliferation and differentiation, the drive to differentiation is such that the precursor at the
crossroad is extinguished leaving the clone/population completely committed to a single pathway.
This simplistic ThP and Th2 model illustrates how subtle differences at the level of
signalling can have important dynamic consequences at the cell population level. This type
of regulation of cell differentiation is often neglected from experiments of cell
differentiation since it dwells in the quantitative aspects of cell differentiation, which is
always more difficult to assess when compared with the possibility of clear-cut results
provided by the molecular biology approach. By using mathematical models it was possible
to assert the conditions that favour interference and assess the extension of the interference
between cytokine receptors sharing common chains. This is a very simple prototypic model
on interference between multi-chain membrane receptors sharing common chains, which
can be extended to other cytokine receptors and cytokine receptor families.
Cytokine receptors are important in modulating the activation and directing
differentiation of T cells, but the TCR is the crucial receptor controlling T cell activation
(Davis and Bjorkman 1988). The importance of the TCR reflects on the effort that has been
spent in the study of this receptor and of its downstream signalling pathways. In spite these
efforts, the stoichiometry of TCR-ligand engagement and the mechanism of activation of
Page 169
General discussion
149
the earliest events of TCR triggering have been difficult to clarify experimentally. These
studies require quantification of molecular events occurring at the single cell level, which
are difficult to attain even with current state of the art techniques such as plasmon
resonance and flow cytometry. Mathematical models have been used to address some of the
questions in TCR engagement stoichiometry and internalisation (for example (Bachmann,
Salzmann et al. 1998; Bachmann and Ohashi 1999; Wofsy, Coombs et al. 2001)); in TCR
membrane dynamics and triggering (for example (Salzmann and Bachmann 1998; Chan,
George et al. 2001)); and in the early events of TCR signalling (for example (McKeithan
1995; Kaufman, Andris et al. 1999; Lord, Lechler et al. 1999; Hlavacek, Redondo et al.
2001)). The models presented here complement and extend some of these models.
In this thesis, we studied a series of phenomenological mathematical models, based on
TCR serial triggering (Valitutti, Muller et al. 1995; Bachmann, Salzmann et al. 1998)
mechanism, which were elaborated using available experimental data on TCR down-
modulation (Valitutti, Muller et al. 1995) to gain insight into the mechanism of TCR down
modulation. These models permitted the formulation of new hypothesis for the mechanism
of TCR triggering demonstrating how mathematical modelling techniques can be used
together with quantitative experimental data to gain insight into the underlying
mechanisms.
The TCR triggering models are based on a mean field phenomenological description
of the available experimental data on TCR triggering kinetics, hence they are representative
of the mean of a population of lymphocytes and peptide loaded APCs. Since the
experimental data uses a single population of T cells and peptide-loaded APCs, this
approach is valid.
The most important of the properties uncovered by the models is the requirement that
TCR triggering is a highly cooperative process, which stems from the sensitivity of TCR
activation to low concentration of MHC-peptide ligands. Although ultra sensitivity in the
kinetics of TCR down modulation and the sensitivity of TCR triggering to low doses of
ligand are tied in the model, they are distinct properties. Ultra sensitivity results from the
slope of the dose-response curves; it means that slight changes in ligand presentation
induce dramatic changes in the number of triggered TCRs. The sensitivity of TCR
triggering for low doses of ligand means that the most sensitive part of the dose response is
for low density of ligands, ranging from 100 to 1000 ligands, i.e. between 0.3% and 3% of
total MHC occupancy (estimated from (Valitutti, Dessing et al. 1995)). It is easy to
Page 170
General discussion
150
speculate that in vivo the T cells are responding somewhere within this range of
concentrations since it is where the distinction between the quality and quantity of the
antigen, in the context of TCR triggering, is clearer.
In search for a possible mechanism to explain ultra-sensitivity of TCR triggering, two
candidate mechanisms were studied: Simple TCR cross-linking mechanisms (Bachmann,
Salzmann et al. 1998; Bachmann and Ohashi 1999) (homo cross-linking mechanisms) and
the TCR triggering cycle, which relies in the recruitment to the TCR complex of CD4 or
CD8 co-receptors associated with src kinases (hetero cross-linking mechanism). Our results
show that both mechanisms can reproduce the ultra-sensitivity of TCR triggering, but the
parameter regime required for the homo cross-linking mechanisms to describe all the
kinetics of TCR triggering requires very high cross-linking rate constants. Thus homo
cross-linking seems less robust from the biological point of view compared to the
parameter regime of the hetero cross-linking model. If only the kinetics of the high doses
of ligand is used, then the homo cross-linking model easily describes the data with a more
robust parameter set.
These qualitative results of the models suggested the hypothesis that both mechanisms
can mediate TCR triggering and internalisation. Hence, far from deepening the chasm
between the different hypotheses regarding TCR triggering stoichiometry, we propose a
conciliation of oligomerization models with co-receptor hetero cross-linking models by
proposing that both mechanisms are possible but have different ligand dose dependence. At
low density of ligand, TCR hetero cross-linking with CD4-lck or CD8-lck should be the
prevailing TCR triggering mechanism, whereas at high doses of ligand, both mechanisms
should be possible. The determination of dose-response curves for TCR triggering, together
with the assessment of which are the PTKs, co-receptors and adaptor molecules
phosphorylated for each dose would be valuable to determine the validity of this dual mode
hypothesis of TCR triggering. Some of the aspects of the present hypothesis are being
explored experimentally (Andreia Lino, Personal communication). It would also be
interesting to determine experimentally the influence of TCR antagonists and partial
agonists, since TCR antagonists and partial agonists usually require higher concentrations
to induce TCR signalling. The finding that week and partial agonists are more dependent on
CD4 for TCR triggering than agonists (Vidal, Daniel et al. 1999) supports the hypothesis
above.
Our analysis is based on TCR down modulation being dependent on TCR engagement
Page 171
General discussion
151
and triggering, which seems to be the case for some experimental systems such as the
system on which we based the model (Valitutti, Dessing et al. 1995) but not in others,
where the extent of non-specific down-modulation is significant (San Jose, Borroto et al.
2000). The model also makes strong simplifications of the cycling of TCR/CD3 between
cytoplasmatic and membrane compartments (Liu, Rhodes et al. 2000). The possibility of
internal pools of TCR was modelled, but it was not significant for the kinetics of TCR
down modulation (not shown).
The duration of APC stimulation required for T cell activation seems to be between of
6-12 hours (Dustin, Allen et al. 2001), but in some conditions it can be much shorter (Lee,
Pasos et al. 2002). If the duration of T cell-APC engagement is shorter, then much like the
revised kinetic proof reading model (Hlavacek, Redondo et al. 2001), the T cell might elicit
different responses depending on the time it is conjugated with the APC. Perhaps a study of
conjugation times using partial agonists or non-agonists might be a fundamental experiment
to link the quantity and quality of signal transduction of the TCR with the duration of cell-
cell interactions.
One of the principal limitations of the models is that they do not include the spatial
component of the membrane dynamics of the T cell and APC. The interface between an
APC and T cell is structurally complex. Not only does it involve binding of numerous
molecules on the surface of both cells, it is also a dimensionally restricted space that may
condition both diffusion and reactivity of membrane molecules (Shaw and Dustin 1997).
The immune synapse is a complex structural pattern formed in the contact between an APC
and a T cell (Monks, Freiberg et al. 1998; Grakoui, Bromley et al. 1999; Anton van der
Merwe, Davis et al. 2000). The role of the immune synapse in TCR triggering and T cell
signalling is a matter of debate. The agonistic properties of the MHC-peptide correlate with
the extension and duration of the immune synapse and the formation of the immune
synapse have been implied in CD45 exclusion, a possible mechanism for lck activation.
Recently, some doubts were raised on the role of the immune synapse in TCR triggering
(Lee, Holdorf et al. 2002). Staining, using phospho-specific antibodies, of lck and Zap70
has shown that TCR triggering occurs mostly during the early 30 minutes of conjugation,
before the mature synapse has been formed, thus casting doubt that the immune synapse is
necessary for the initiation of TCR signalling (Lee, Holdorf et al. 2002). Still, immune
synapses may still play be significant for other responses (Revy, Sospedra et al. 2001; Lee,
Holdorf et al. 2002).
Page 172
General discussion
152
One of the possible implications of membrane rafts is that the signalling molecules
associated with a raft might act as a single supramolecular signal transduction unit
(signalosome (Werlen and Palmer 2002)). Thus lipid rafts might play a function similar to
scaffold proteins, increasing the specificity and efficiency of interaction of the signal
components. The aggregation of membrane rafts can mimic an activation signal for the T
cell (Janes, Ley et al. 1999). This observation, together with raft heterogeneity regarding
the composition of signalling molecules (Gomez-Mouton, Abad et al. 2001; Schade and
Levine 2002) adds a larger complexity to the possible mechanisms of TCR triggering. It
seems that TCR triggering and signalling can be initiated by a number of experimental
protocols, but of all the triggering possibilities, the most likely to occur in vivo is still
controversial.
Our results indicated that TCR triggering is a mechanism with a threshold and very
steep response to agonists resulting from the hypersensitivity. We have also shown that
TCR down-modulation can confer adaptable activation thresholds to T cells, which means
that right at the early stage of TCR signalling by the cell, there are mechanisms capable of
filtering environmental noise from the TCR triggering, thus allowing the cells to perform
quality control on the stimulus received. How does the adaptation of TCR levels to APC
stimulation together with the hypersensivity of TCR triggering condition the physiology of
a population of lymphocytes?
The theory of adaptable activation thresholds of lymphocytes has been used to explain
immune phenomena based in the dynamics of signalling pathways of individual cells
(Grossman and Paul 1992; Grossman and Singer 1996; Grossman and Paul 2000;
Grossman and Paul 2001). This theory also provides an attractive conceptual framework to
explore the consequences of single cell events, such as the regulation of the activation
threshold of lymphocytes, at the cell population level. The work presented here constitutes
the first study of the implications of adaptable activation thresholds of lymphocytes in the
dynamics of populations of lymphocytes. We studied the adaptation of activation
thresholds at a single cell level and the population dynamics of adaptable cells using a
homeostatic model of T cell population dynamics. Each cell in the model has a particular
state, which depends on the particular history of antigen encounters particular to that cell.
In spite the unique structure of this model, it is simple enough to allow characterization of
its properties. This model constitutes a simple approach in dealing with the scaling problem
in biological systems. This model constitutes a step forward compared with standard mean
Page 173
General discussion
153
field models of cell population dynamics, such as the ThP and Th2 model presented here.
The AAT model is based on an idealized simple TCR signal transduction pathway,
inspired in TCR hypersensitivity and on the model of TCR hetero cross-linking triggering,
capable of reproducing the qualitative traits that are the foundation of the lymphocyte AAT
hypothesis (Grossman and Paul 1992; Grossman and Singer 1996; Grossman and Paul
2000; Grossman and Paul 2001). The model couples T cell-APC conjugation kinetics with
the cellular TCR signalling pathway of a single cell. For the sake of simplicity, we
neglected the contribution of signalling in the kinetics of T cell conjugation with the APC.
Using this simple AAT model, the dynamic properties of a population of such
adaptable lymphocytes were explored from the point of view of homeostasis. Our results
showed that the maintenance of a peripheral pool of totally unresponsive lymphocytes is
not possible under the postulates of the AAT hypothesis. The stable steady states of the
population, in the absence of a source term, are either the collapse of the population
(peripheral deletion of the clone due to full adaptation and unresponsiveness), or a steady
state where most of the cells are responsive (low adaptation of the population).
Two factors determine the outcome of the population of adaptable lymphocytes in the
periphery: the initial number of cells (clone size) and the adaptation state of the cells. Low
numbers of cells together with high levels of adaptation favour the collapse of the
population whereas high numbers of cells with low levels of adaptation favour expansion to
the low-adapted state. Also important is the direction of evolution of the system. Since
adaptable lymphocytes have a memory of previous events, the same number of
lymphocytes might be expanding or collapsing depending on the current adaptation state of
individual cells. For a recent thymic emigrant, its persistence in the periphery is thus
dependent on its adaptation state, the size of the clone and the level of antigen in the
periphery. The clone will only be able to persist if peripheral stimulation and clone size is
high enough to allow the clone to expand above a critical population size.
AATs set a threshold on the ratio between the size of the clone and antigen for the
persistence of the clone. Hence, AATs may act as a filter, eliminating some clones that
would otherwise be able to persist on self-antigen stimulation.
If lymphocyte survival depends on TCR and MHC (Witherden, van Oers et al. 2000;
Polic, Kunkel et al. 2001) and TCR signal transduction is adaptable, then AATs cause the
deletion of the desensitised cells from the periphery. The results of our model show that
AATs alone cannot explain the persistence of lymphocytes fully desensitised to self-
Page 174
General discussion
154
antigens in the periphery, but rather provide a simple mechanism of attaining peripheral
tolerance by deletion of a clone.
If TCR signalling is a necessary condition for T cell survival, it is difficult to imagine
that the organism produces a single survival factor, specific for each clone. Cells might rely
on self-MHC ligands and/or partial agonists as the means to transduce survival signals, but
not activator signals, via the TCR. This partial activation of the TCR signalling cascade by
specific ligands has been termed “TCR tickling” mechanism (Evavold, Sloan-Lancaster et
al. 1993). As far as the model presented here goes, promoting a simple linear increase of T
cell survival by “TCR tickling” would not change the qualitative properties of the model.
However, the results of the model indicate that the effect of such survival signals would
have to be non-linear to stabilize the persistence of unresponsive cells, i.e. the proliferation
and death curves in figure 4 of section 4 (page 128) would have to be such that a stable
steady state of desensitised cells is possible. The nature and existence of such an effect in
lymphocyte survival is completely speculative. Further modelling would have to be
performed to gain additional insight into the biological significance of the dynamic
constraints of such modification of the survival of lymphocytes.
These results do not diminish the possible importance of AATs in lymphocyte
physiology, or its possible importance in a more general mechanism of lymphocyte
homeostasis. The results simply state that AATs are not a sufficient condition, remaining to
be proved if AATs are or not involved in the persistence of peripheral auto-reactive
lymphocytes and also if they are necessary for the unresponsiveness.
Thinking of adaptable activation thresholds simply in terms of the TCR signal pathway
is too restrictive. The state of a lymphocyte and its response to stimulation is the result of a
combination of multiple signalling pathways. The adaptation of these pathways allows
lymphocytes to integrate and respond to stimuli, based on the past experiences. Adaptable
activation thresholds give lymphocytes memory of the last events experienced, casting on
the single cell cognitive properties. Looking at the similarities between lymphocytes and
neurons under the light of the AAT hypothesis and the myriad of receptors and ligands,
which regulate the physiology of lymphocytes and the dynamics of lymphocyte
populations, a parallelism between the cognitive characteristics of the nervous system and
the neuron and the immune system and the lymphocyte is unavoidable. The analogy can
even be pushed further if assuming that cytokines act primarily between interacting cells,
propagating information between the different cells in a manner akin to a neuronal network.
Page 175
General discussion
155
The complexity of the cell-cell contacts, as is evident in studies of the immune synapse, and
the intricacies of cytokine signalling attest in favour of such cellular networks, even if for
no other reason than that there is place for such networks in the complex regulation of the
immune system.
Both the AAT and the ThP/Th2 models have states of stable collapse and persistence
of clones separated by a threshold that depends on the number of cells. Apparently these
models contrast. The ThP/Th2 model provides a mechanism for the persistence of cells
whereas the AAT model provides a mechanism for the elimination of cells. The models
deal with different aspects of lymphocyte population dynamics and depend on different
signalling pathways: the ThP/Th2 model relates to the regulation of lymphocyte
differentiation mediated by cytokines, whereas the AAT model relates to the persistence of
the whole clone, dependent on TCR signalling.
Integration of both models is missing in this thesis. At the single cell, the TCR and
cytokine pathways interfere and this interference should propagate to the cytokine and
antigen dependent population dynamics of lymphocytes. Extending the model of ThP/Th2
dynamics with AATs in cytokine and TCR signalling is not trivial. If only the TCR is
adaptable, then it is possible that the relationships within the ThP/Th2 model will still hold,
since both proliferation and differentiation of Th2 and ThP have an implicit dependence on
TCR signalling. If cytokine signalling is also adaptable, a plausible assumption considering
the complex regulation of cytokine receptor expression, then the dynamics of the ThP/Th2
model become non-trivial. Does IL-2 and IL-4 signalling adapt with the same dynamics as
the TCR? To which extent is adaptation dependent on the interference between the TCR,
IL-2 and IL-4 signalling pathways? How would adaptation influence the balance between
proliferation and differentiation of ThPs? How could antigen dose, which plays a role in the
polarization of helper T cells (O'Garra and Murphy 1994; O'Garra 1998), and adaptation
direct cells into alternative differentiation pathways? These are questions to which it is even
difficult to hypothesise answers with the current state of our models and knowledge.
This thesis addressed, respectively, the relationship between the regulation of receptor
expression and the effects of this regulation at the cell population dynamics.
Many open questions still remain in this work. The model of IL-2R and IL-4R barely
scratches the surface of the extent to which the signalling pathways interfere. The same for
the ThP and Th2 population dynamics model, which falls short of including other cell
Page 176
General discussion
156
phenotypes and their differentiation and proliferation factors. Unfortunately, more detailed
models would still be limited by the available quantitative experimental data.
TCR triggering is a very complex phenomenon that spans from the molecular to the
cellular level. The models presented here mostly deal with the molecular aspects of TCR
engagement, triggering and down modulation. Modelling TCR downstream signalling as
well as adding a spatial component to the dynamics of the TC-MHC-co-receptor
interactions also remain to be explored.
The main problems faced with the AAT model were the inexistence of a formalism to
deal adequately with a population of heterogeneous lymphocytes with memory of past
stimulatory events. The model as it is now is open to extend to more detailed TCR-APC
dynamics. Remaining questions include the dependency of APC binding on the intensity of
stimulation of T cells, the competition between lymphocyte clones for APCs and/or
antigen, the inclusion of a more detailed TCR engagement and triggering model, and the
effect of compartmentalization of lymphocytes.
The broad aim of this thesis was to contribute to the study of the how do single cell
events influence the population dynamics of cells. Throughout this thesis, we presented
models that try to bridge the chasm between molecular events and the population dynamics
of lymphocytes. In spite the strong simplifications and abstractions used in the models
presented here, it is striking the complexity of the population dynamics of CD4+ T
lymphocytes when molecular events, such as the cytokine and TCR receptors expression
and signaling, are taken into consideration. A common and somewhat fair criticism to
these models is that they are too simplified, too abstract or omitting some (hypothetical)
important aspect. The disconcerting truth is that in spite of all the abstractions and
simplifications these models are non-linear, complex and difficult to understand, with some
of the results being non-intuitive at least to the collective intuition and understanding of the
researchers that were involved in this thesis. This complexity is not intentional, rather it
reflects the intricacies of the propagation of events between organization levels that
immunologists, biologists and biochemists try to understand relying (generally speaking)
solely in personal intuition and a few working examples.
Modeling the interface between organization levels is still in its infancy and hence an
open field, not only in immunology but also in biology in general. This thesis contributes
towards the goal of understanding how population dynamics properties arise from single
Page 177
General discussion
157
cell events.
5.1 Bibliography Anton van der Merwe, P., S. J. Davis, et al. (2000). “Cytoskeletal polarization and redistribution of
cell-surface molecules during T cell antigen recognition.” Semin Immunol 12(1): 5-21.
Bachmann, M. F. and P. S. Ohashi (1999). “The role of T-cell receptor dimerization in T-cell
activation.” Immunol Today 20(12): 568-576.
Bachmann, M. F., M. Salzmann, et al. (1998). “Formation of TCR dimers/trimers as a crucial step
for T cell activation.” Eur J Immunol 28(8): 2571-9.
Bergmann, C., J. L. van Hemmen, et al. (2002). “How instruction and feedback can select the
appropriate T helper response.” Bull Math Biol 64(3): 425-46.
Burke, M. A., B. F. Morel, et al. (1997). “Modeling the proliferative response of T cells to IL-2 and
IL-4.” Cell Immunol 178(1): 42-52.
Carneiro, J., J. Stewart, et al. (1995). “The ontogeny of class-regulation of CD4+ T lymphocyte
populations.” Int Immunol 7(8): 1265-77.
Chan, C., A. J. George, et al. (2001). “Cooperative enhancement of specificity in a lattice of T cell
receptors.” Proc Natl Acad Sci U S A 98(10): 5758-63.
Davis, M. M. and P. J. Bjorkman (1988). “T-cell antigen receptor genes and T-cell recognition.”
Nature 334(6181): 395-402.
Decker, T. and A. Meinke (1997). “Jaks, Stats and the immune system.” Immunobiology 198(1-3):
99-111.
Duprez, V., V. Cornet, et al. (1988). “Down-regulation of high affinity interleukin 2 receptors in a
human tumor T cell line. Interleukin 2 increases the rate of surface receptor decay.” J Biol
Chem 263(26): 12860-5.
Duprez, V. and A. Dautry-Varsat (1986). “Receptor-mediated endocytosis of interleukin 2 in a
human tumor T cell line. Degradation of interleukin 2 and evidence for the absence of
recycling of interleukin receptors.” J Biol Chem 261(33): 15450-4.
Dustin, M. L., P. M. Allen, et al. (2001). “Environmental control of immunological synapse
formation and duration.” Trends Immunol 22(4): 192-4.
Evavold, B. D., J. Sloan-Lancaster, et al. (1993). “Tickling the TCR: selective T-cell functions
stimulated by altered peptide ligands.” Immunol Today 14(12): 602-9.
Fishman, M. A. and A. S. Perelson (1994). “Th1/Th2 cross regulation.” J Theor Biol 170(1): 25-56.
Fry, T. J. and C. L. Mackall (2001). “Interleukin-7: master regulator of peripheral T-cell
homeostasis?” Trends Immunol 22(10): 564-71.
Page 178
General discussion
158
Galizzi, J. P., C. E. Zuber, et al. (1989). “Internalization of human interleukin 4 and transient down-
regulation of its receptor in the CD23-inducible Jijoye cells.” J Biol Chem 264(12): 6984-9.
Gesbert, F., M. Delespine-Carmagnat, et al. (1998). “Recent advances in the understanding of
interleukin-2 signal transduction.” J Clin Immunol 18(5): 307-20.
Gett, A. V. and P. D. Hodgkin (1998). “Cell division regulates the T cell cytokine repertoire,
revealing a mechanism underlying immune class regulation.” Proc Natl Acad Sci U S A
95(16): 9488-93.
Gomez-Mouton, C., J. L. Abad, et al. (2001). “Segregation of leading-edge and uropod components
into specific lipid rafts during T cell polarization.” Proc Natl Acad Sci U S A 98(17): 9642-7.
Grakoui, A., S. K. Bromley, et al. (1999). “The immunological synapse: a molecular machine
controlling T cell activation.” Science 285(5425): 221-7.
Grossman, Z. and W. E. Paul (1992). “Adaptive cellular interactions in the immune system: the
tunable activation threshold and the significance of subthreshold responses.” Proc Natl Acad
Sci U S A 89(21): 10365-9.
Grossman, Z. and W. E. Paul (2000). “Self-tolerance: context dependent tuning of T cell antigen
recognition.” Semin Immunol 12(3): 197-203; discussion 257-344.
Grossman, Z. and W. E. Paul (2001). “Autoreactivity, dynamic tuning and selectivity.” Curr Opin
Immunol 13(6): 687-98.
Grossman, Z. and A. Singer (1996). “Tuning of activation thresholds explains flexibility in the
selection and development of T cells in the thymus.” Proc Natl Acad Sci U S A 93(25): 14747-
52.
Hemar, A., M. Lieb, et al. (1994). “Endocytosis of the beta chain of interleukin-2 receptor requires
neither interleukin-2 nor the gamma chain.” Eur J Immunol 24(9): 1951-5.
Hemar, A., A. Subtil, et al. (1995). “Endocytosis of interleukin 2 receptors in human T
lymphocytes: distinct intracellular localization and fate of the receptor alpha, beta, and gamma
chains.” J Cell Biol 129(1): 55-64.
Hirano, T. (1998). “Interleukin 6 and its receptor: ten years later.” Int Rev Immunol 16(3-4): 249-
84.
Hlavacek, W. S., A. Redondo, et al. (2001). “Kinetic proofreading models for cell signaling predict
ways to escape kinetic proofreading.” Proc Natl Acad Sci U S A 98(13): 7295-300.
Hodgkin, P. D., J. H. Lee, et al. (1996). “B cell differentiation and isotype switching is related to
division cycle number.” J Exp Med 184(1): 277-81.
Janes, P. W., S. C. Ley, et al. (1999). “Aggregation of lipid rafts accompanies signaling via the T
cell antigen receptor.” J Cell Biol 147(2): 447-61.
Kaufman, M., F. Andris, et al. (1999). “A logical analysis of T cell activation and anergy.” Proc
Natl Acad Sci U S A 96(7): 3894-9.
Page 179
General discussion
159
Kondo, M., T. Takeshita, et al. (1993). “Sharing of the interleukin-2 (IL-2) receptor gamma chain
between receptors for IL-2 and IL-4.” Science 262(5141): 1874-7.
Kuznetsov, V. A. and R. K. Puri (1999). “Kinetic analysis of high affinity forms of interleukin (IL)-
13 receptors: suppression of IL-13 binding by IL-2 receptor gamma chain.” Biophys J 77(1):
154-72.
Lee, K. H., A. D. Holdorf, et al. (2002). “T cell receptor signaling precedes immunological synapse
formation.” Science 295(5559): 1539-42.
Lee, W. T., G. Pasos, et al. (2002). “Continued antigen stimulation is not required during CD4(+) T
cell clonal expansion.” J Immunol 168(4): 1682-9.
Leonard, W. J. and J. J. O'Shea (1998). “Jaks and STATs: biological implications.” Annu Rev
Immunol 16: 293-322.
Liu, H., M. Rhodes, et al. (2000). “On the dynamics of TCR:CD3 complex cell surface expression
and downmodulation.” Immunity 13(5): 665-75.
Lord, G. M., R. I. Lechler, et al. (1999). “A kinetic differentiation model for the action of altered
TCR ligands.” Immunol Today 20(1): 33-9.
Ma, X., J. M. Chow, et al. (1996). “The interleukin 12 p40 gene promoter is primed by interferon
gamma in monocytic cells.” J Exp Med 183(1): 147-57.
Malek, T. R., B. O. Porter, et al. (1999). “Multiple gamma c-dependent cytokines regulate T-cell
development.” Immunol Today 20(2): 71-6.
McKeithan, T. W. (1995). “Kinetic proofreading in T-cell receptor signal transduction.” Proc Natl
Acad Sci U S A 92(11): 5042-6.
Monks, C. R., B. A. Freiberg, et al. (1998). “Three-dimensional segregation of supramolecular
activation clusters in T cells.” Nature 395(6697): 82-6.
Morel, B. F., M. A. Burke, et al. (1996). “Making sense of the combined effect of interleukin-2 and
interleukin-4 on lymphocytes using a mathematical model.” Bull Math Biol 58(3): 569-94.
Murphy, E., K. Shibuya, et al. (1996). “Reversibility of T helper 1 and 2 populations is lost after
long-term stimulation.” J Exp Med 183(3): 901-13.
Nelms, K., A. D. Keegan, et al. (1999). “The IL-4 receptor: signaling mechanisms and biologic
functions.” Annu Rev Immunol 17: 701-38.
O'Garra, A. (1998). “Cytokines induce the development of functionally heterogeneous T helper cell
subsets.” Immunity 8(3): 275-83.
O'Garra, A. and K. Murphy (1994). “Role of cytokines in determining T-lymphocyte function.”
Curr Opin Immunol 6(3): 458-66.
Polic, B., D. Kunkel, et al. (2001). “How alpha beta T cells deal with induced TCR alpha ablation.”
Proc Natl Acad Sci U S A 98(15): 8744-9.
Page 180
General discussion
160
Revy, P., M. Sospedra, et al. (2001). “Functional antigen-independent synapses formed between T
cells and dendritic cells.” Nat Immunol 2(10): 925-31.
Robb, R. J., W. C. Greene, et al. (1984). “Low and high affinity cellular receptors for interleukin 2.
Implications for the level of Tac antigen.” J Exp Med 160(4): 1126-46.
Roessler, E., A. Grant, et al. (1994). “Cooperative interactions between the interleukin 2 receptor
alpha and beta chains alter the interleukin 2-binding affinity of the receptor subunits.” Proc
Natl Acad Sci U S A 91(8): 3344-7.
Salzmann, M. and M. F. Bachmann (1998). “Estimation of maximal affinities between T-cell
receptors and MHC/peptide complexes.” Mol Immunol 35(2): 65-71.
San Jose, E., A. Borroto, et al. (2000). “Triggering the TCR complex causes the downregulation of
nonengaged receptors by a signal transduction-dependent mechanism.” Immunity 12(2): 161-
70.
Schade, A. E. and A. D. Levine (2002). “Lipid raft heterogeneity in human peripheral blood T
lymphoblasts: a mechanism for regulating the initiation of TCR signal transduction.” J
Immunol 168(5): 2233-9.
Scott, C. L. and C. G. Begley (1999). “The beta common chain (beta c) of the granulocyte
macrophage-colony stimulating factor, interleukin-3 and interleukin-5 receptors.” Int J
Biochem Cell Biol 31(10): 1011-5.
Shaw, A. S. and M. L. Dustin (1997). “Making the T cell receptor go the distance: a topological
view of T cell activation.” Immunity 6(4): 361-9.
Sugamura, K., H. Asao, et al. (1996). “The interleukin-2 receptor gamma chain: its role in the
multiple cytokine receptor complexes and T cell development in XSCID.” Annu Rev Immunol
14: 179-205.
Szabo, S. J., A. S. Dighe, et al. (1997). “Regulation of the interleukin (IL)-12R beta 2 subunit
expression in developing T helper 1 (Th1) and Th2 cells.” J Exp Med 185(5): 817-24.
Valitutti, S., M. Dessing, et al. (1995). “Sustained signaling leading to T cell activation results from
prolonged T cell receptor occupancy. Role of T cell actin cytoskeleton.” J Exp Med 181(2):
577-84.
Valitutti, S., S. Muller, et al. (1995). “Serial triggering of many T-cell receptors by a few peptide-
MHC complexes.” Nature 375(6527): 148-51.
Vidal, K., C. Daniel, et al. (1999). “Differential requirements for CD4 in TCR-ligand interactions.”
J Immunol 163(9): 4811-8.
Werlen, G. and E. Palmer (2002). “The T-cell receptor signalosome: a dynamic structure with
expanding complexity.” Curr Opin Immunol 14(3): 299-305.
Page 181
General discussion
161
Witherden, D., N. van Oers, et al. (2000). “Tetracycline-controllable selection of CD4(+) T cells:
half-life and survival signals in the absence of major histocompatibility complex class II
molecules.” J Exp Med 191(2): 355-64.
Wofsy, C., D. Coombs, et al. (2001). “Calculations show substantial serial engagement of T cell
receptors.” Biophys J 80(2): 606-12.
Page 182
General discussion
162
Page 183
General discussion
163
Page 184
General discussion
164


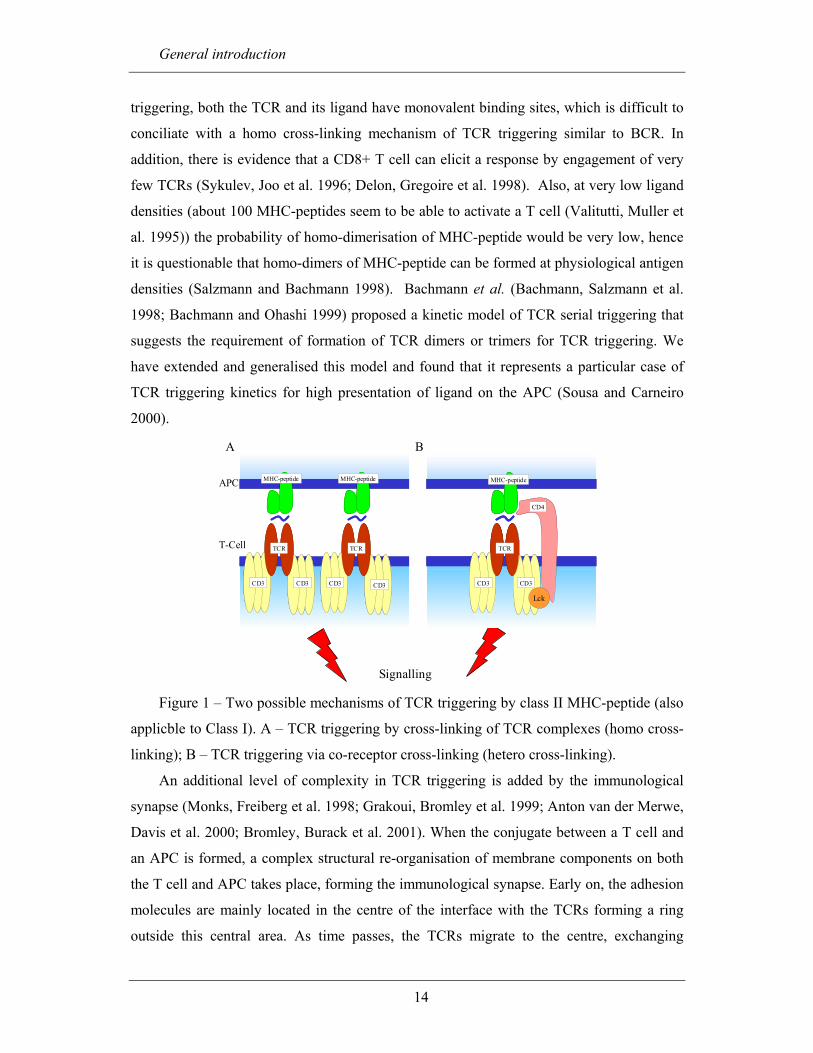


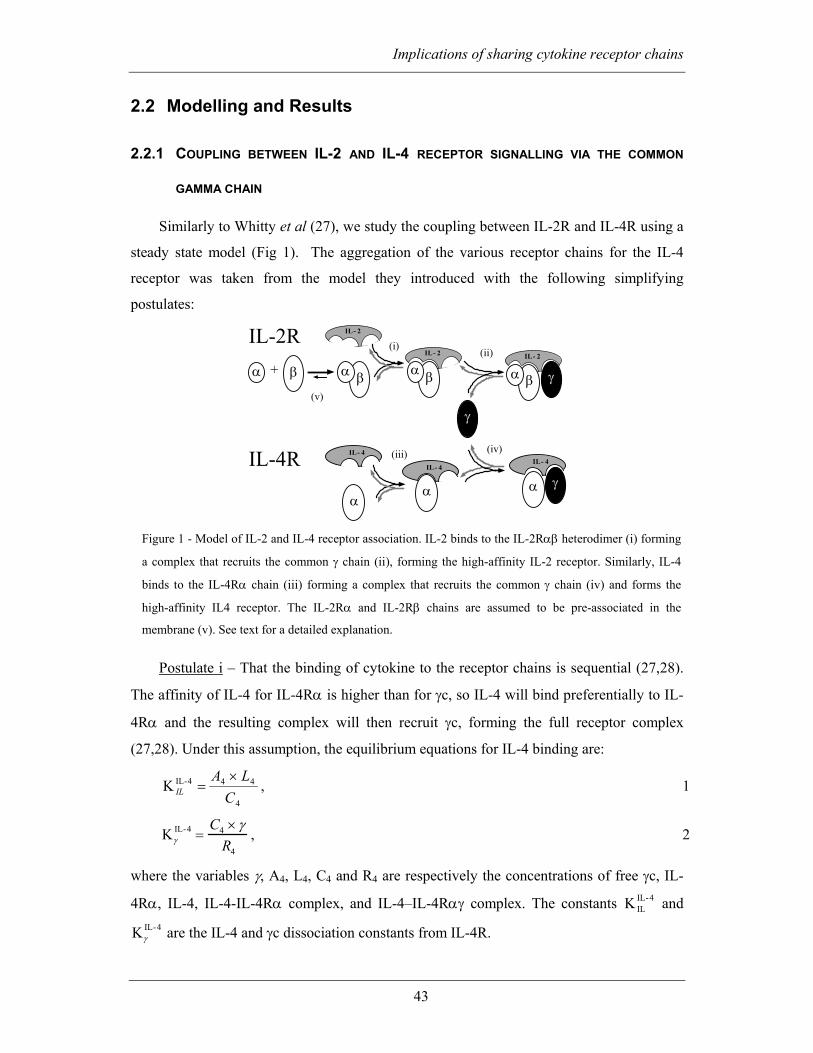
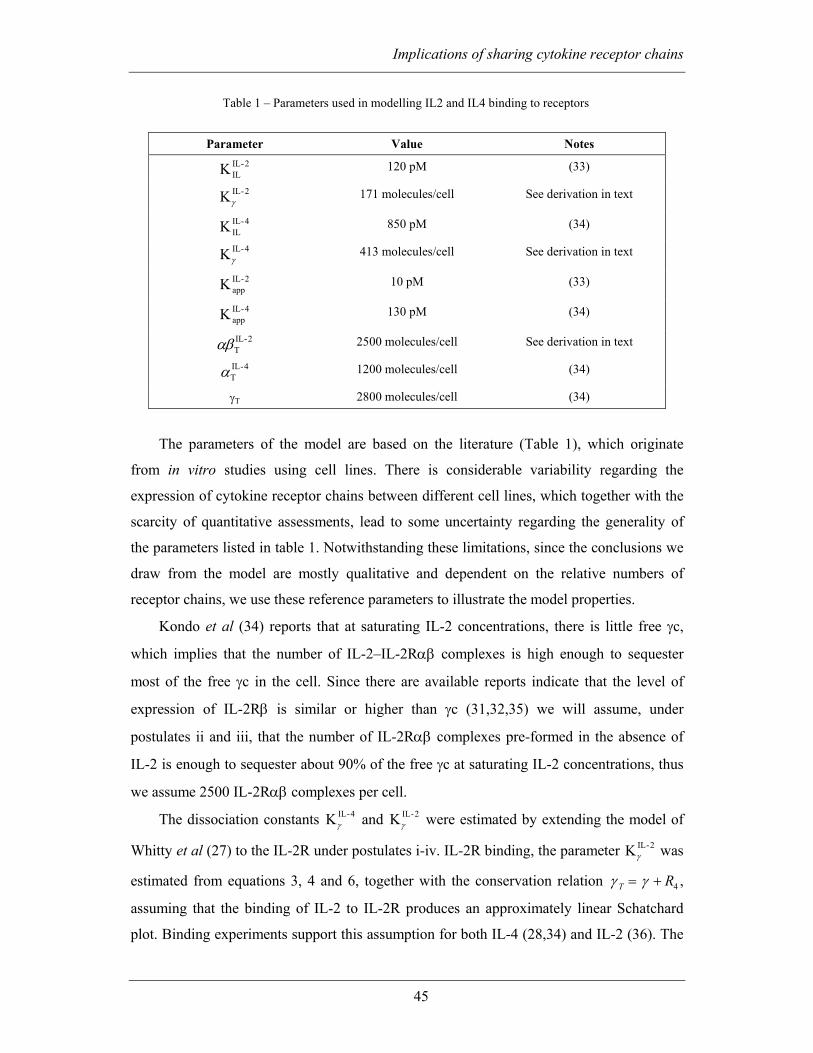
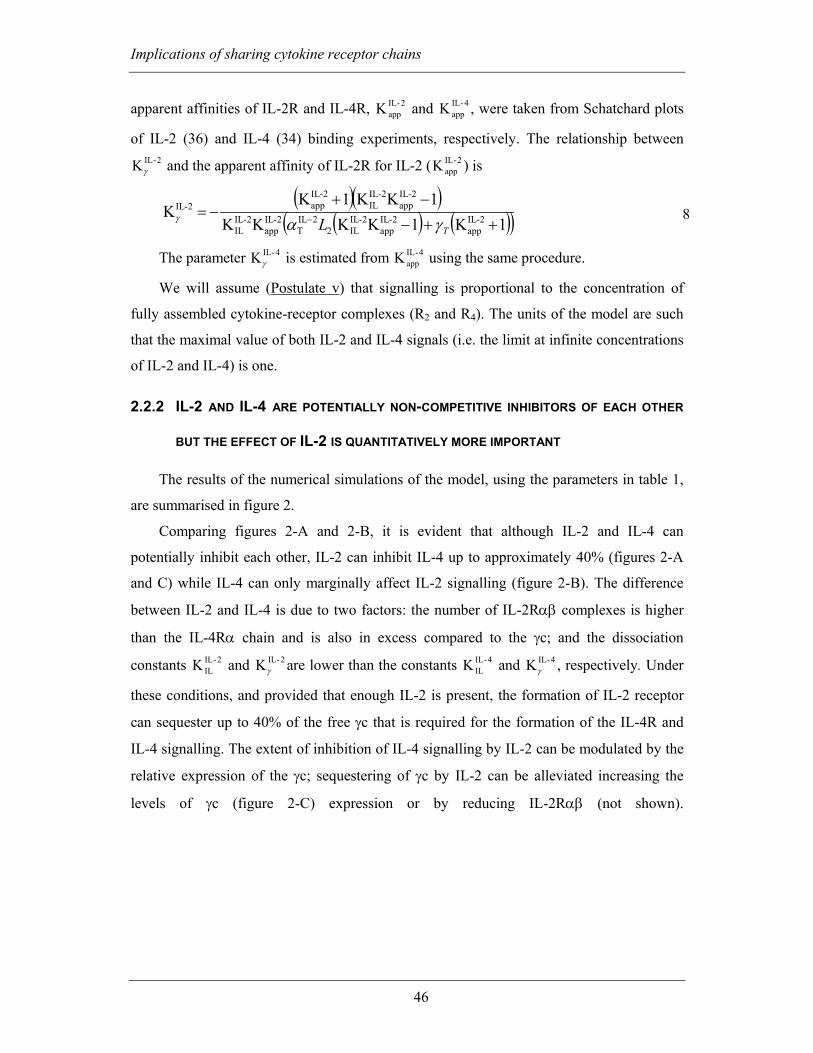
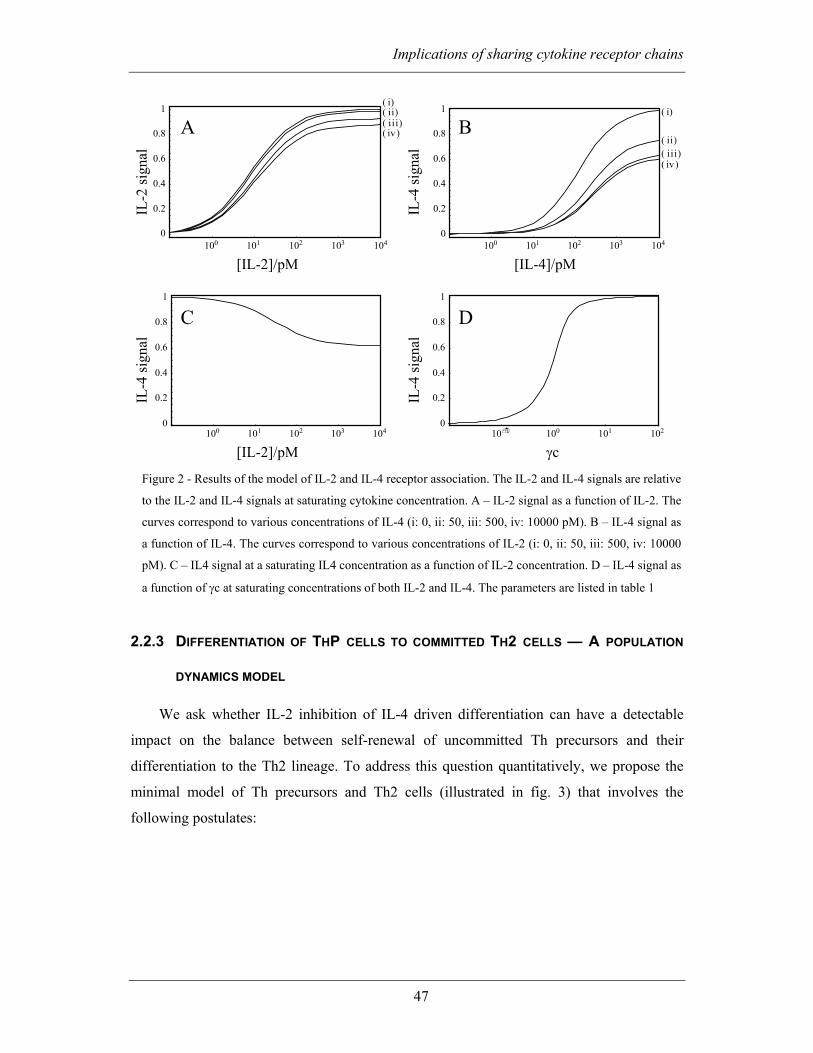
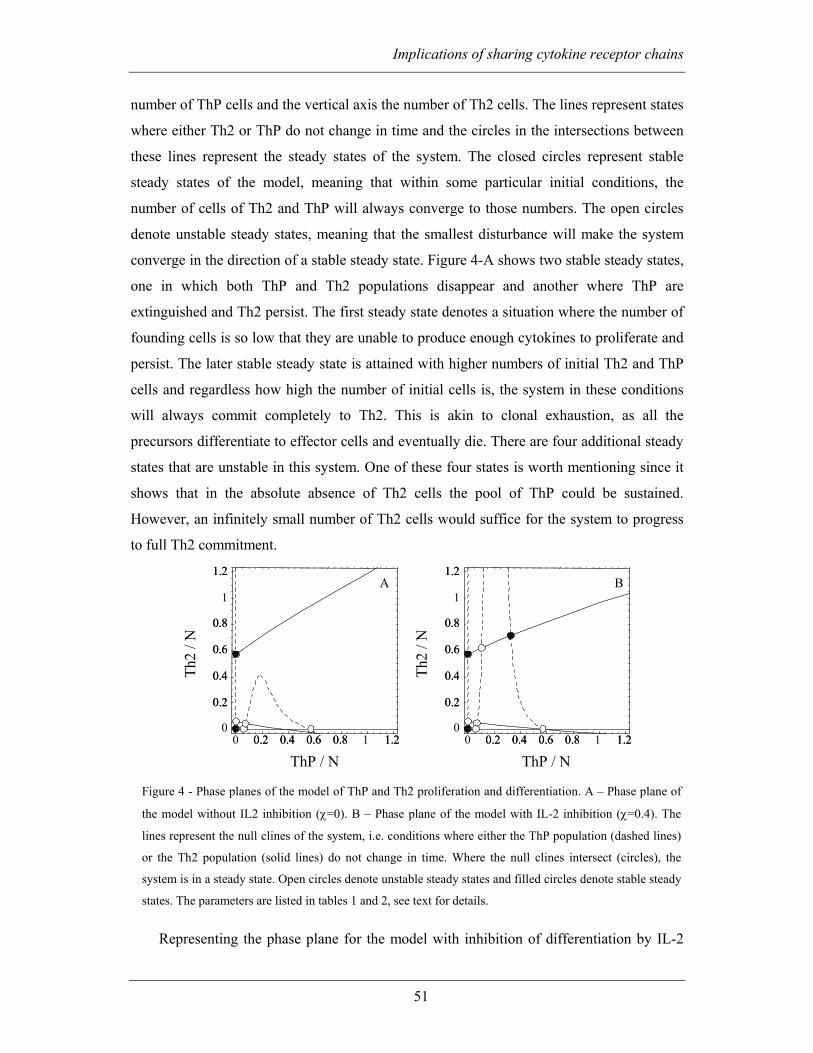
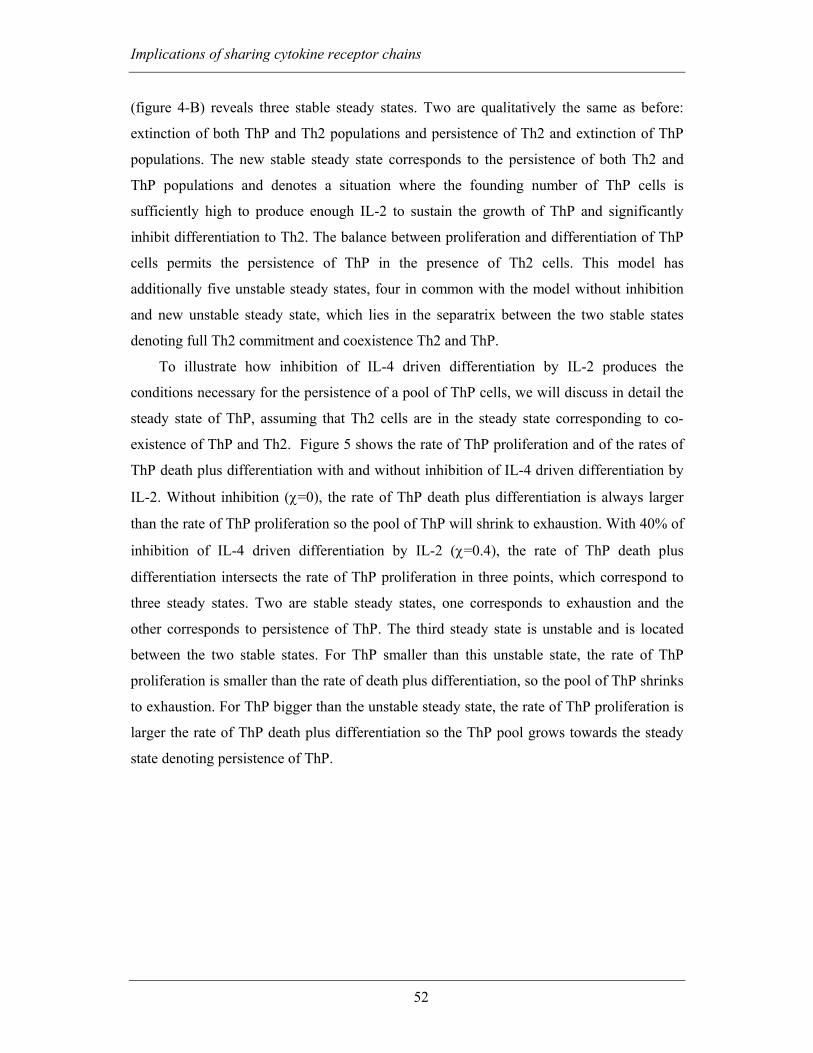
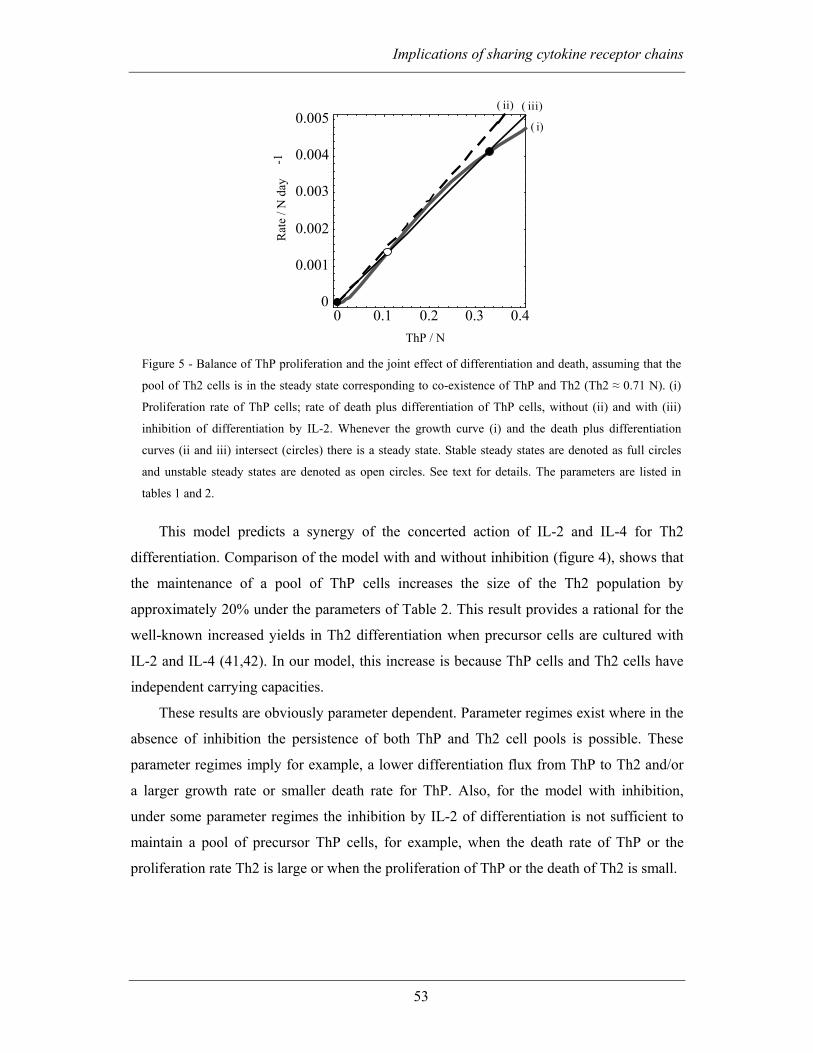
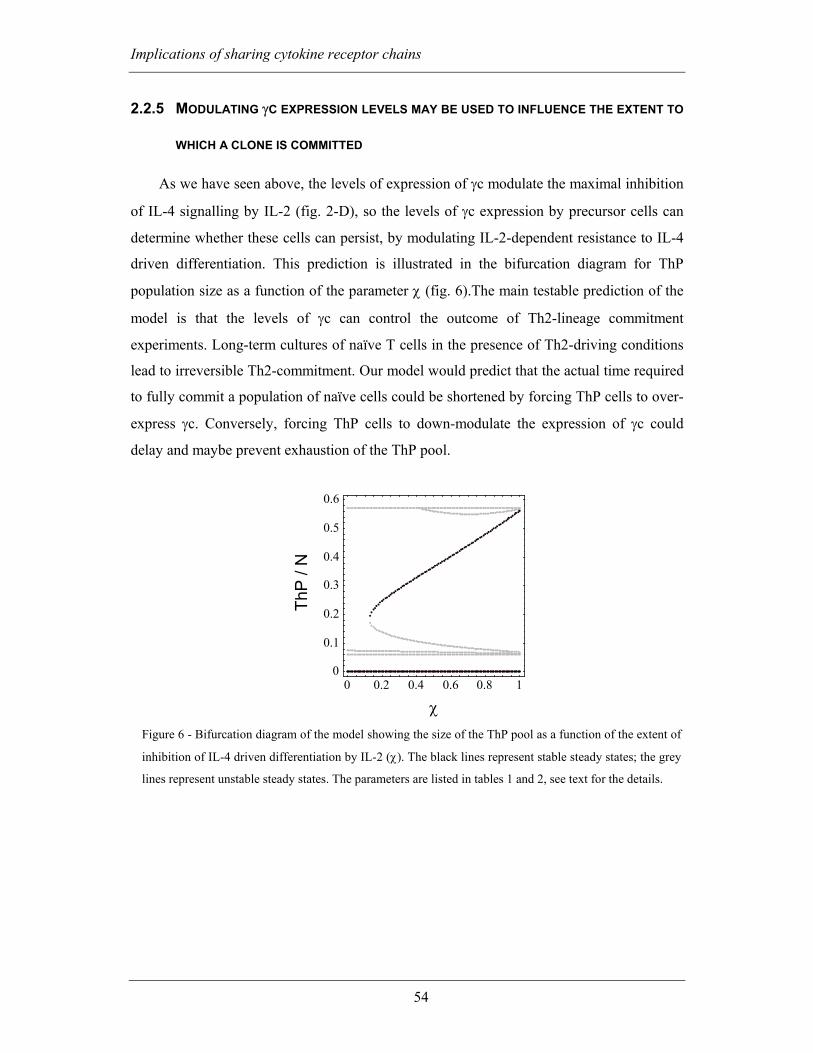


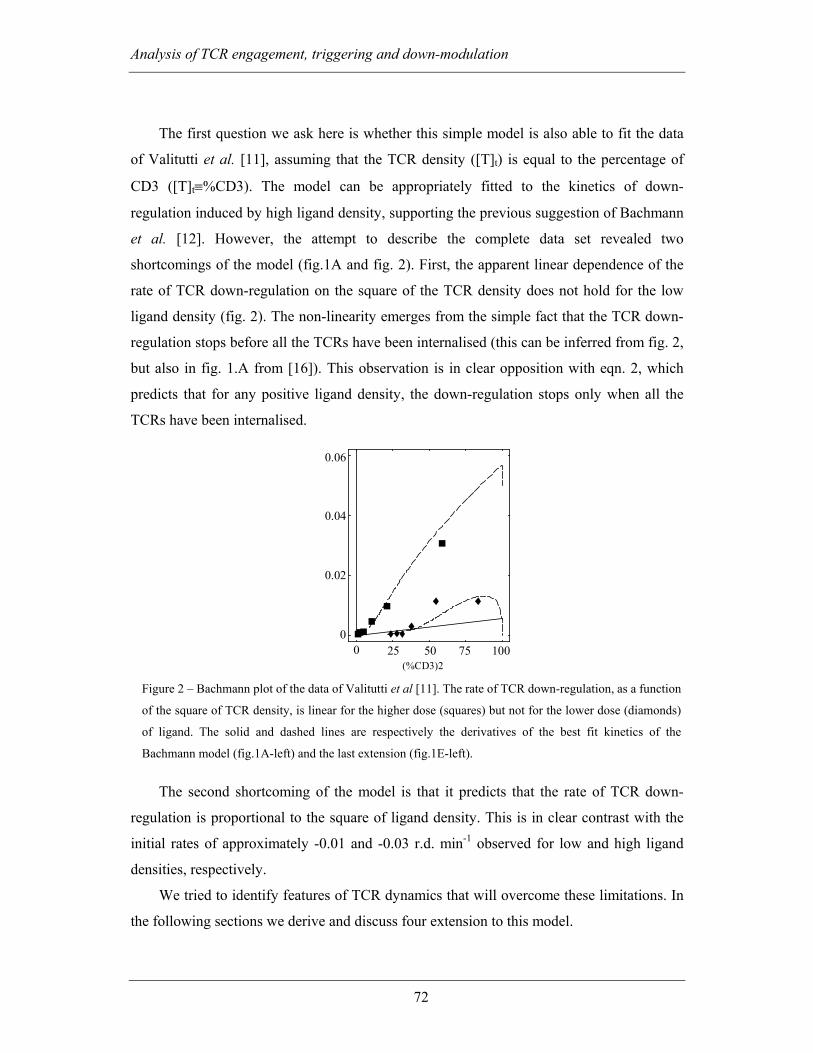
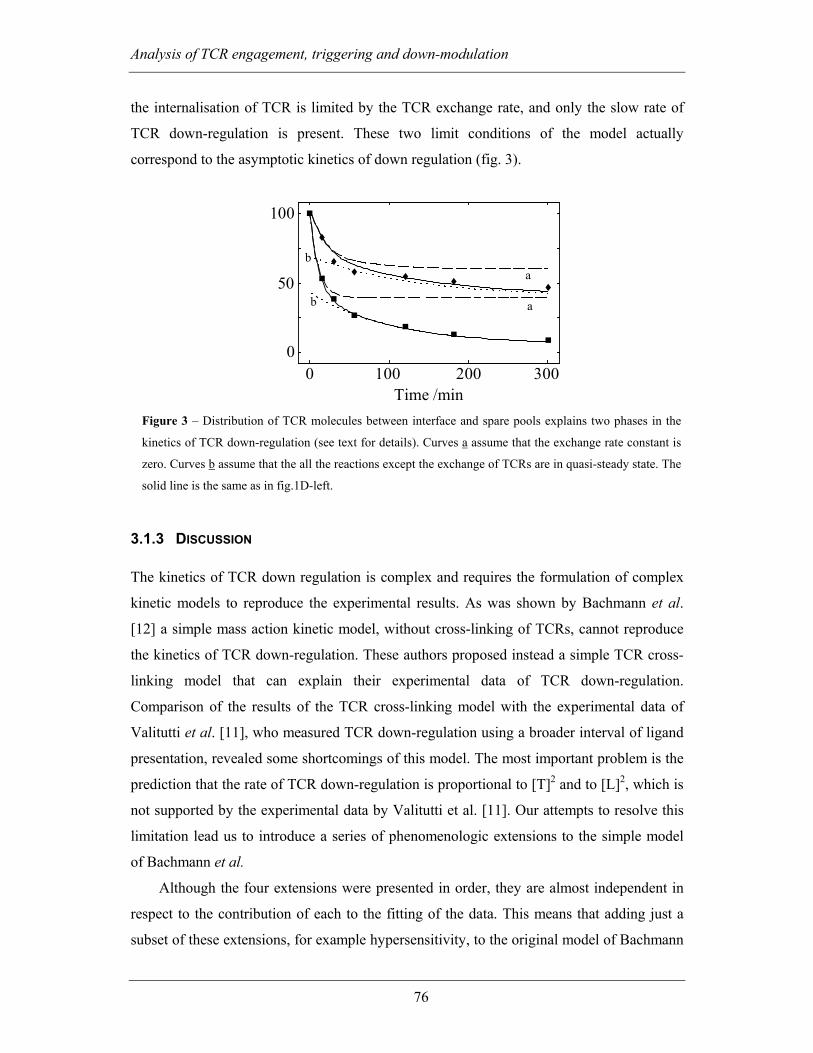


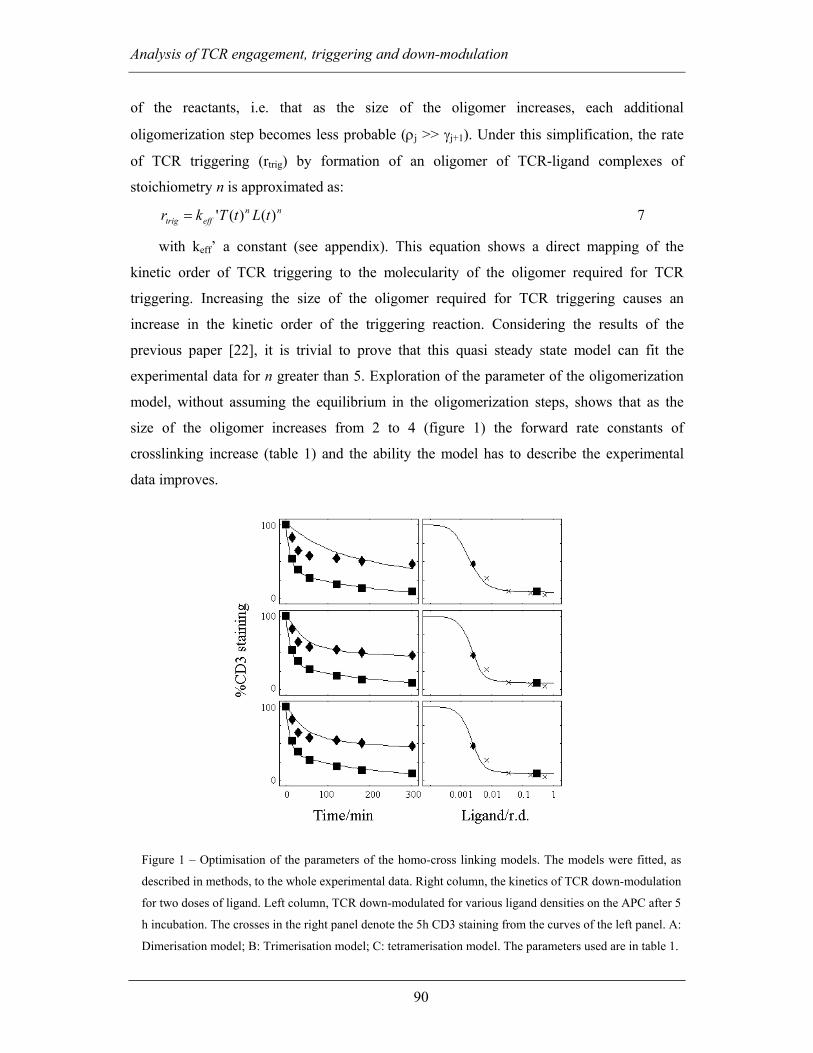
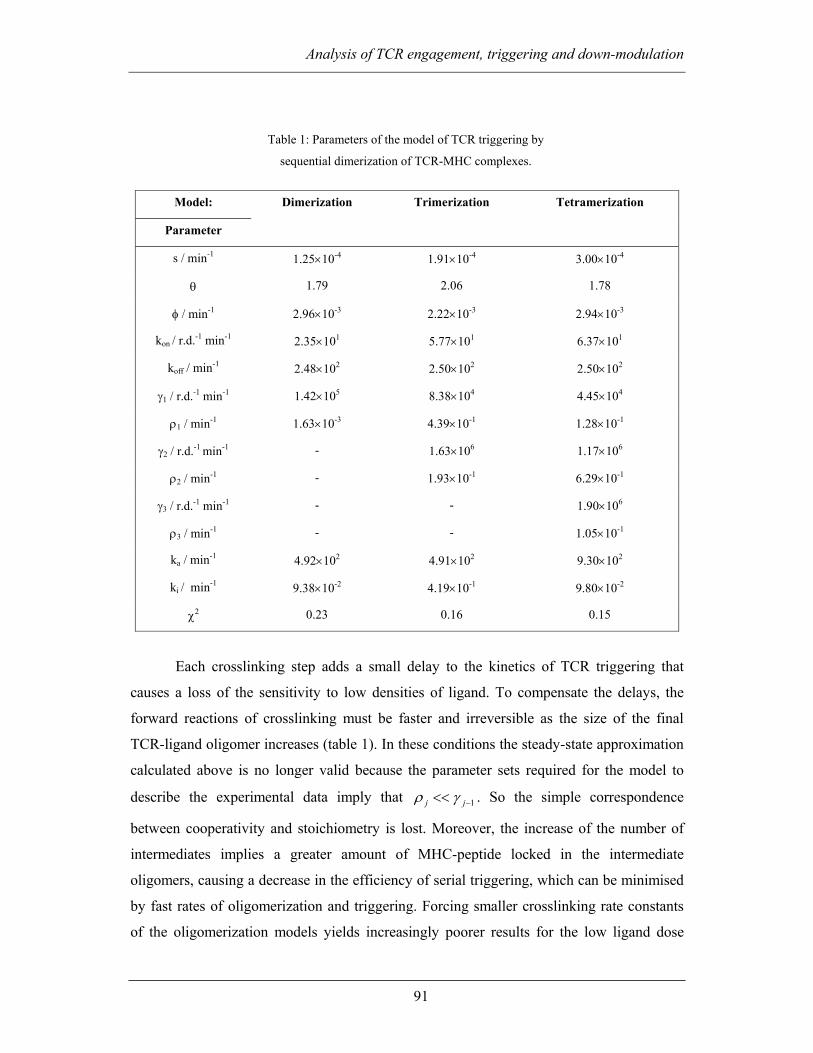
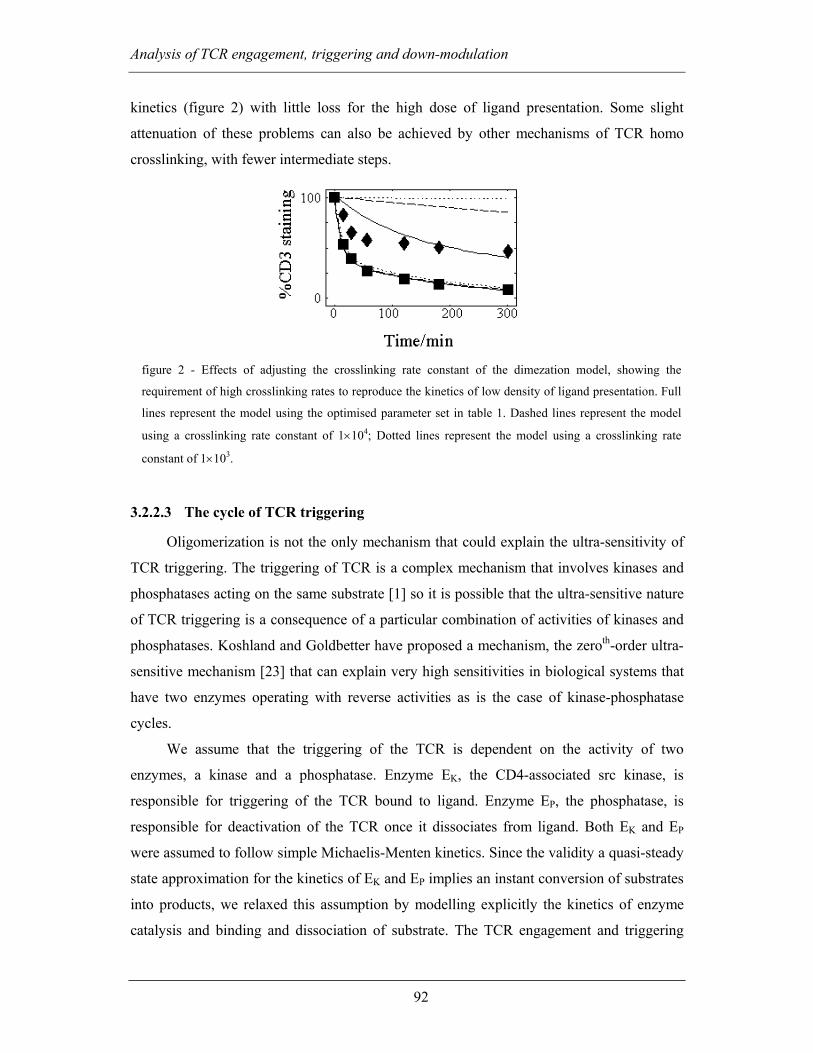

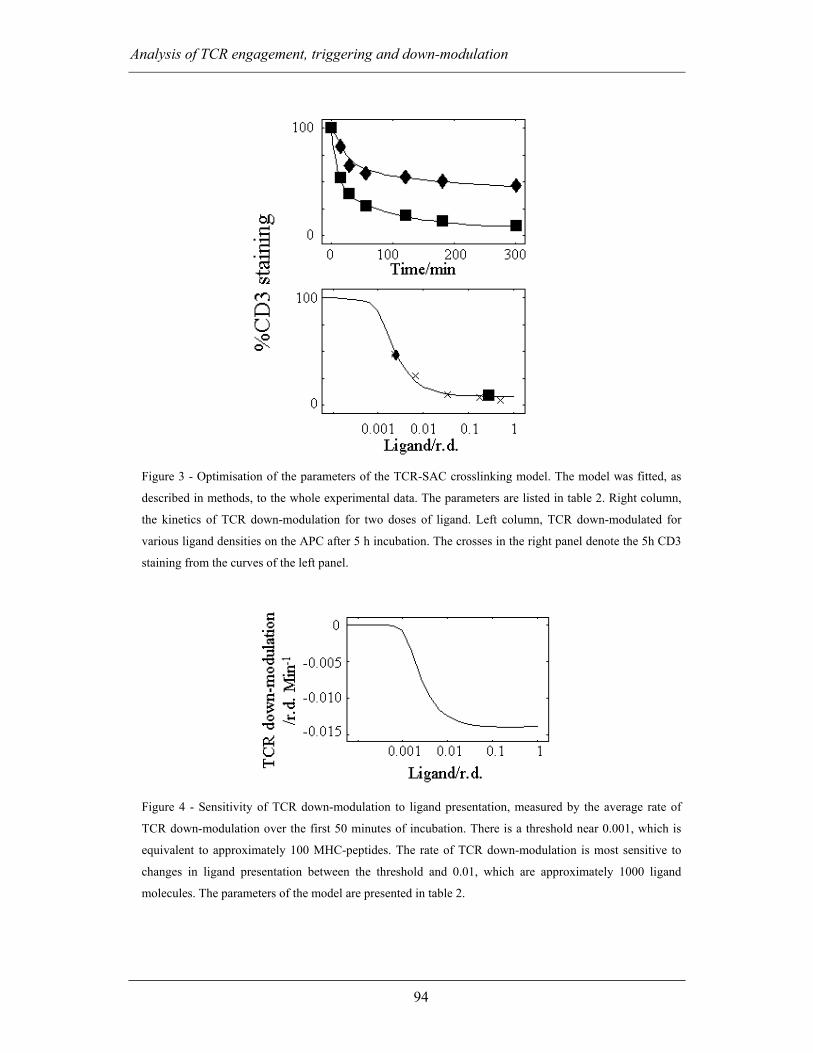
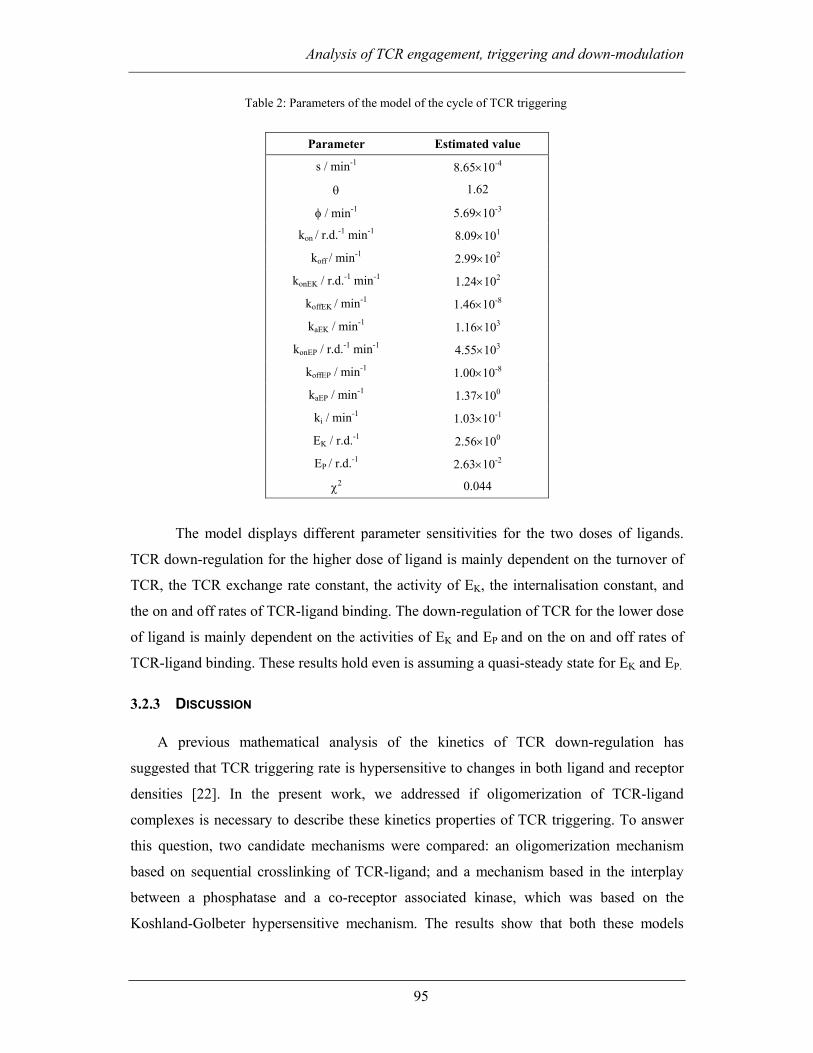
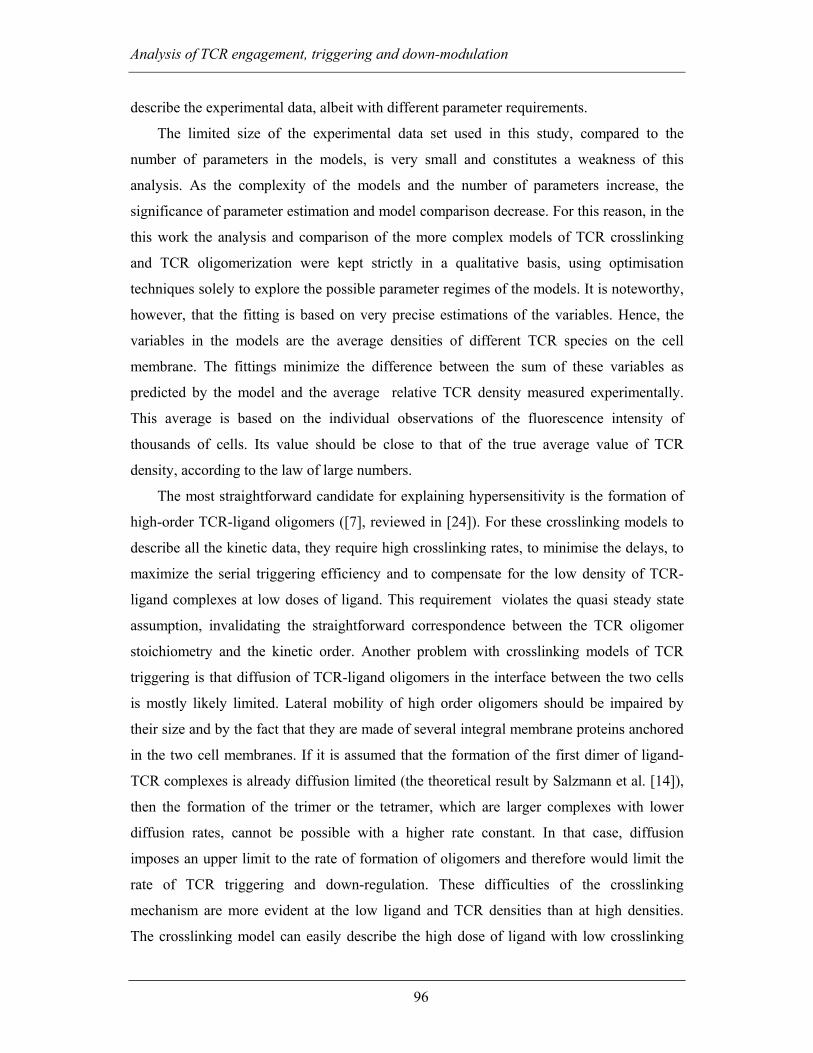
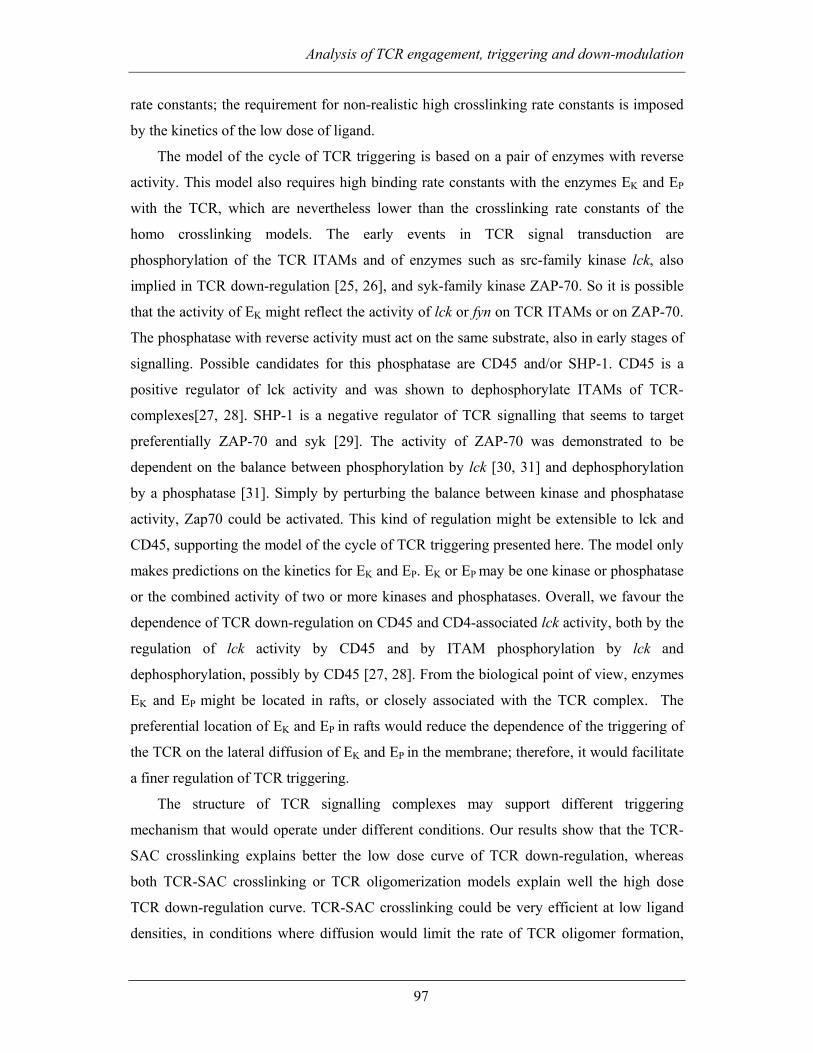
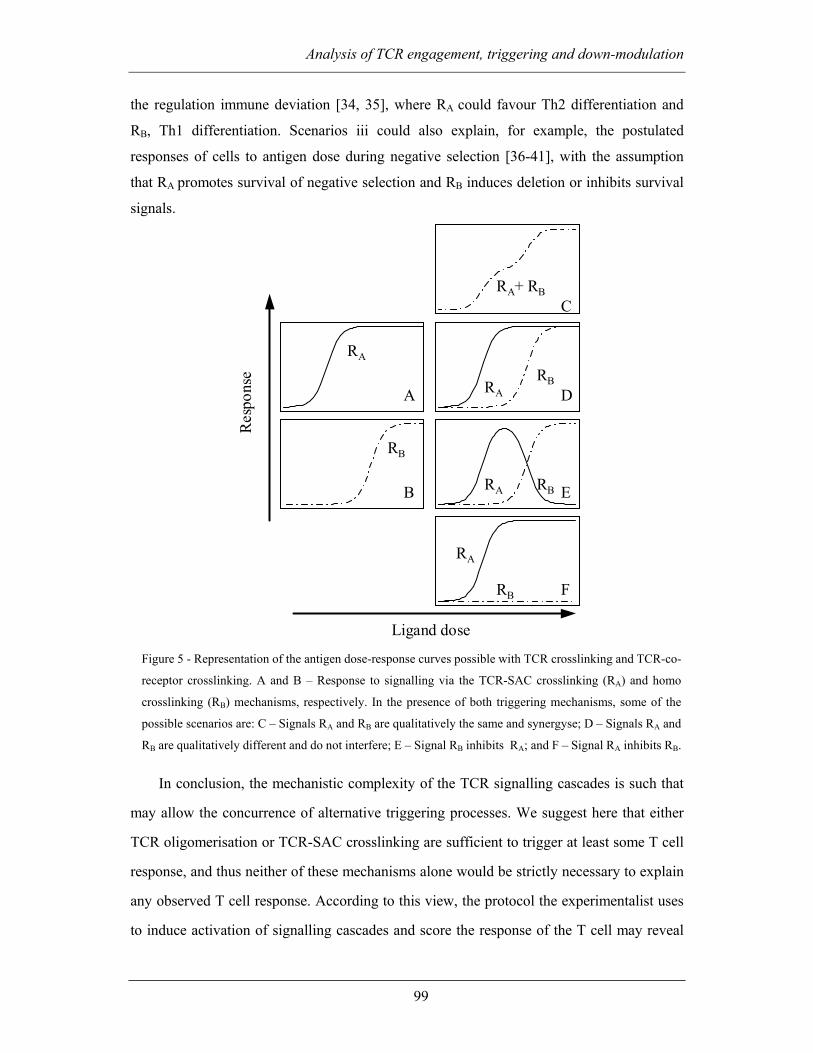
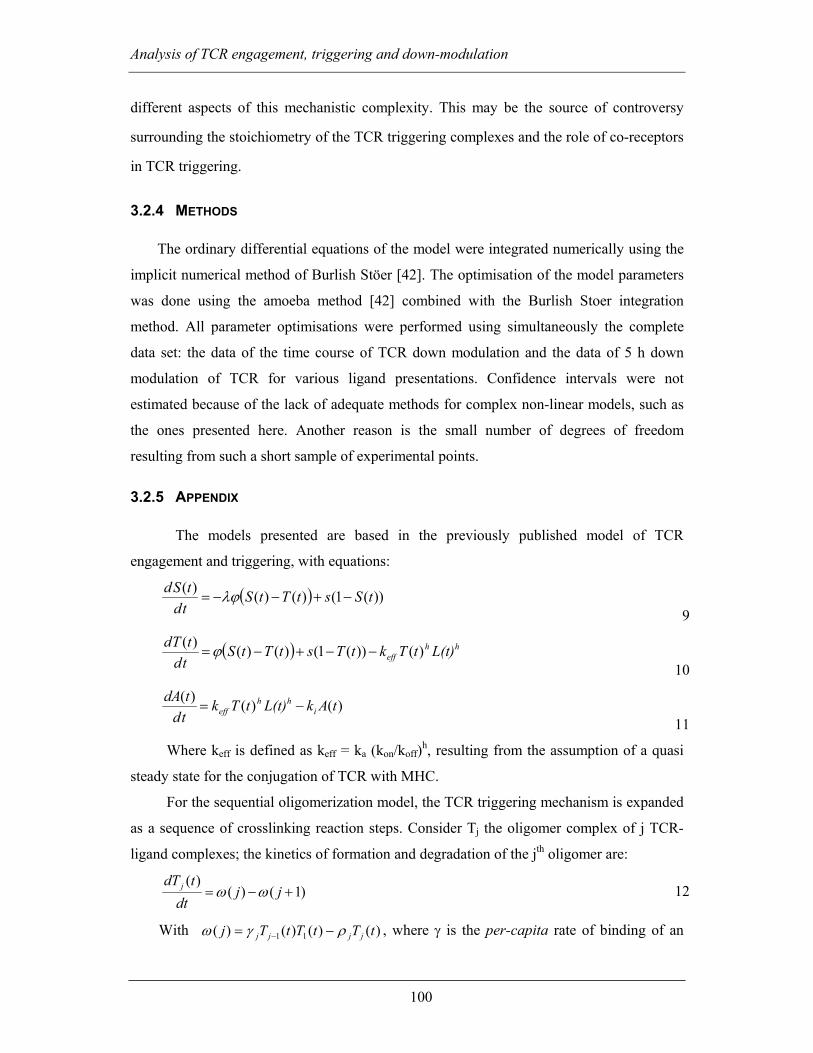
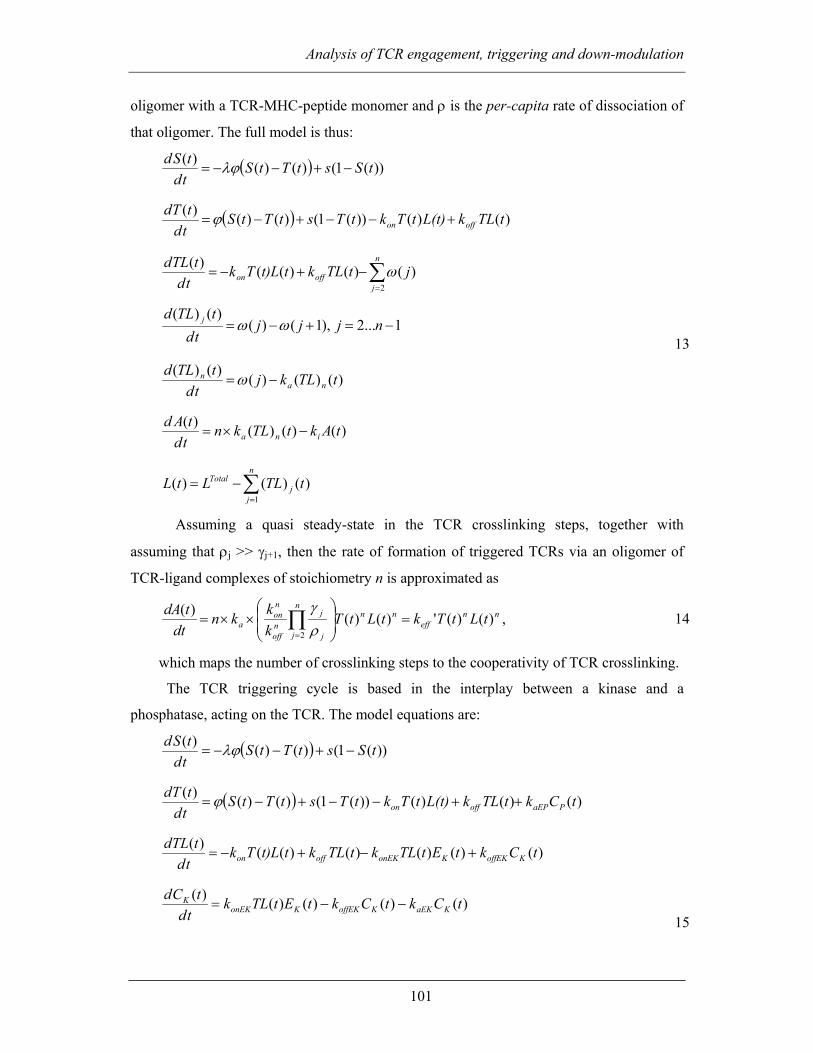
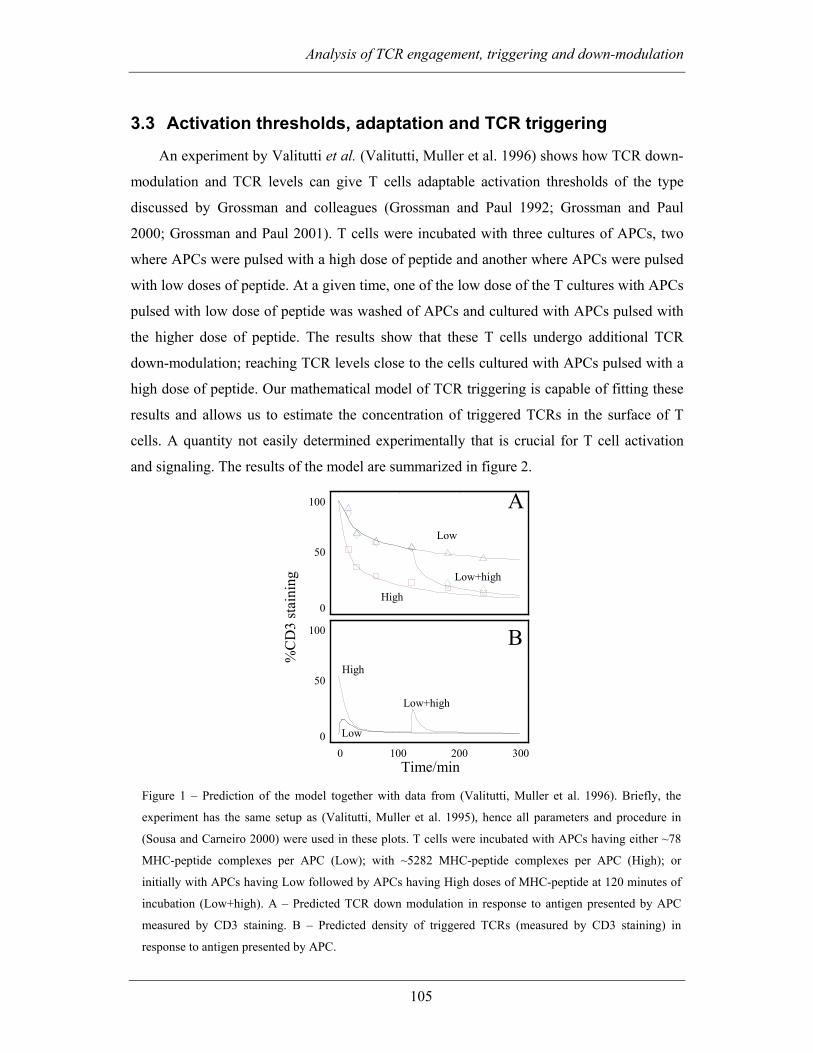


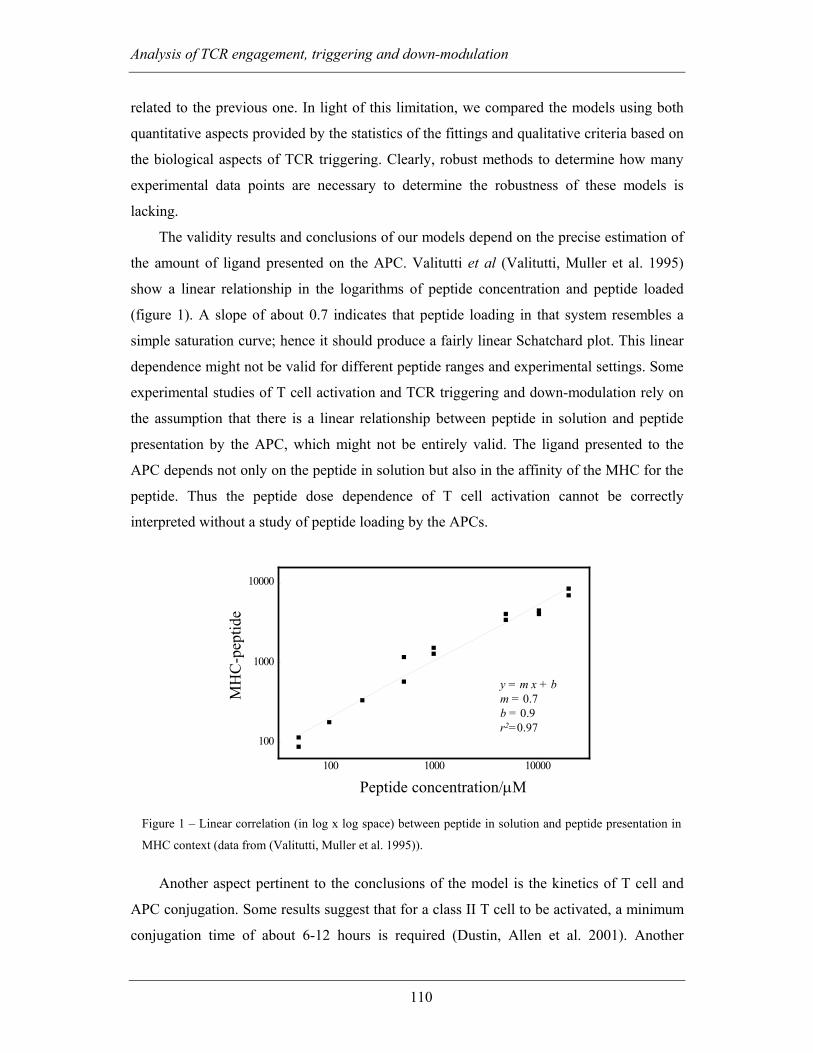


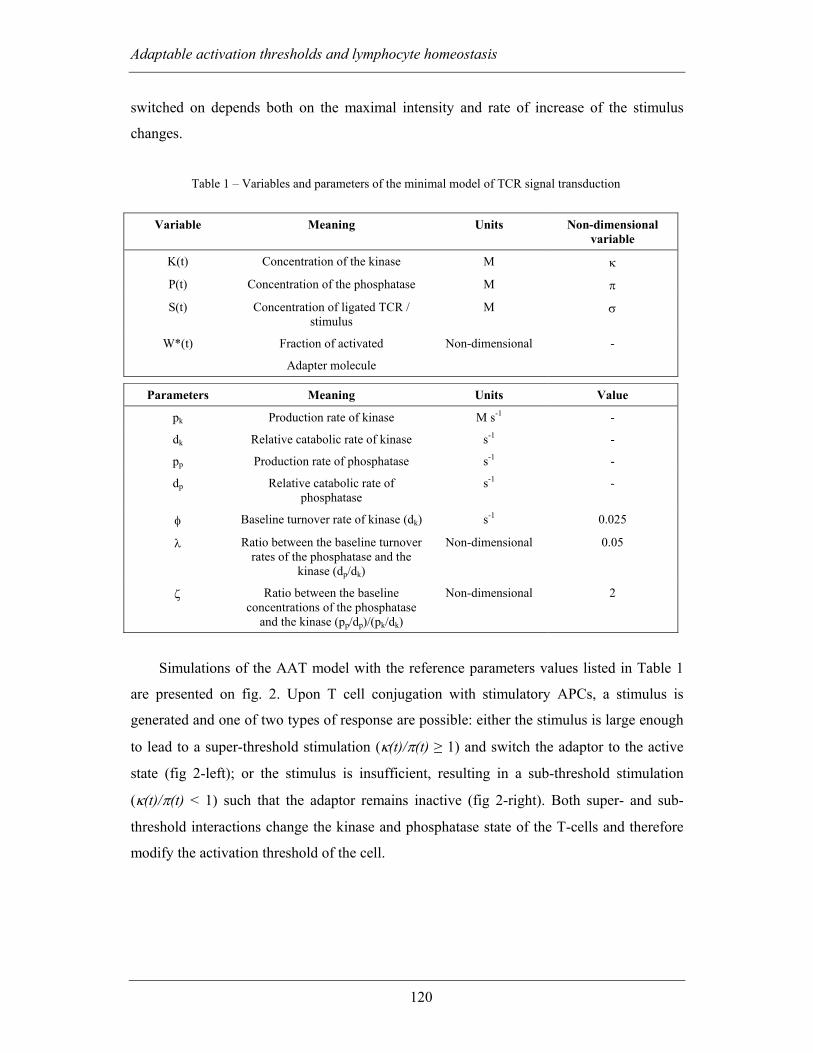
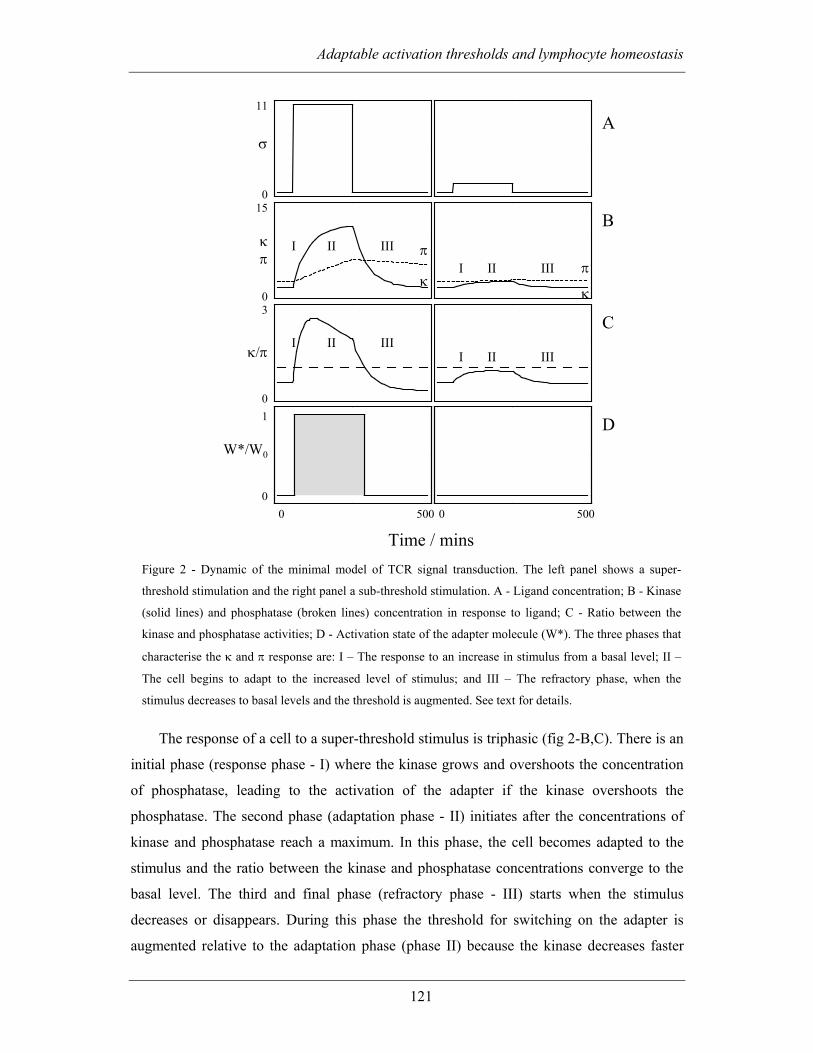
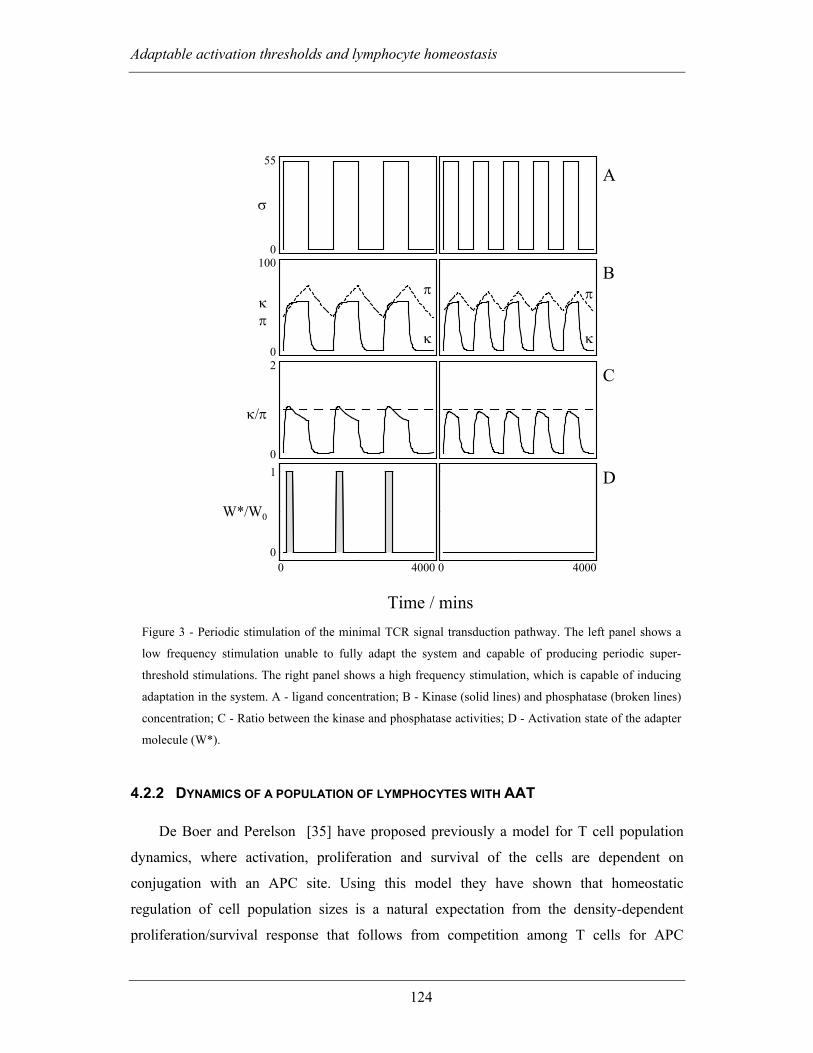
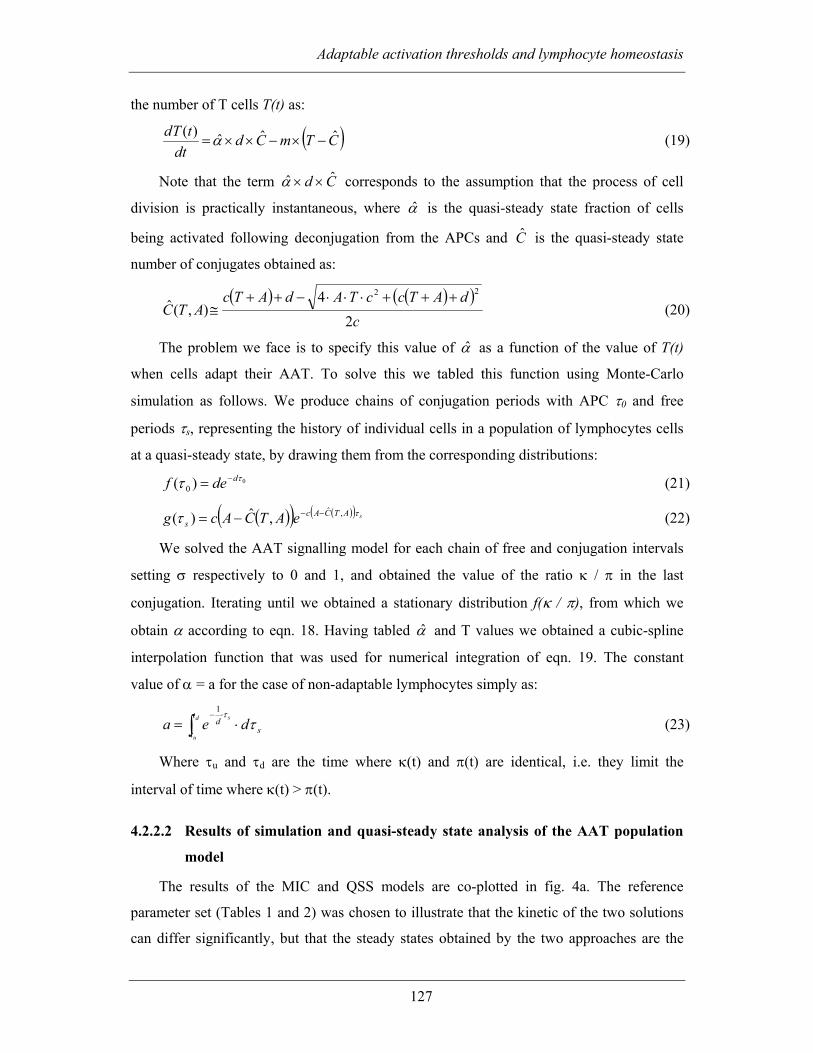
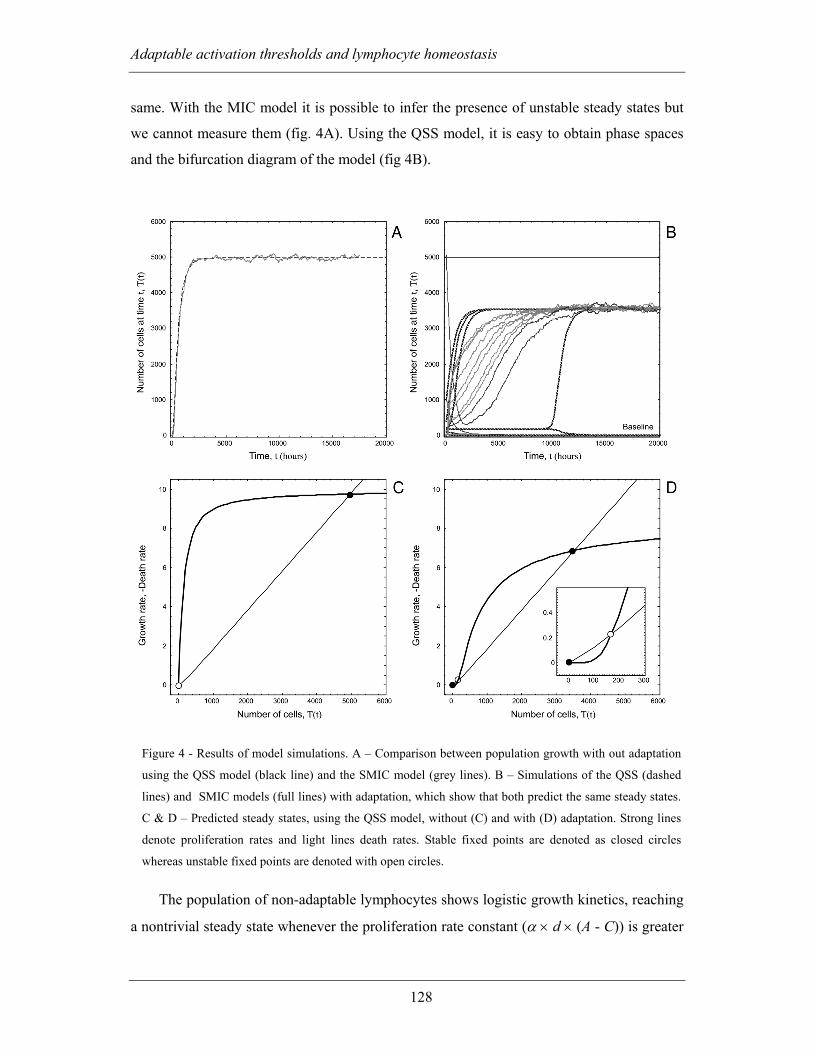
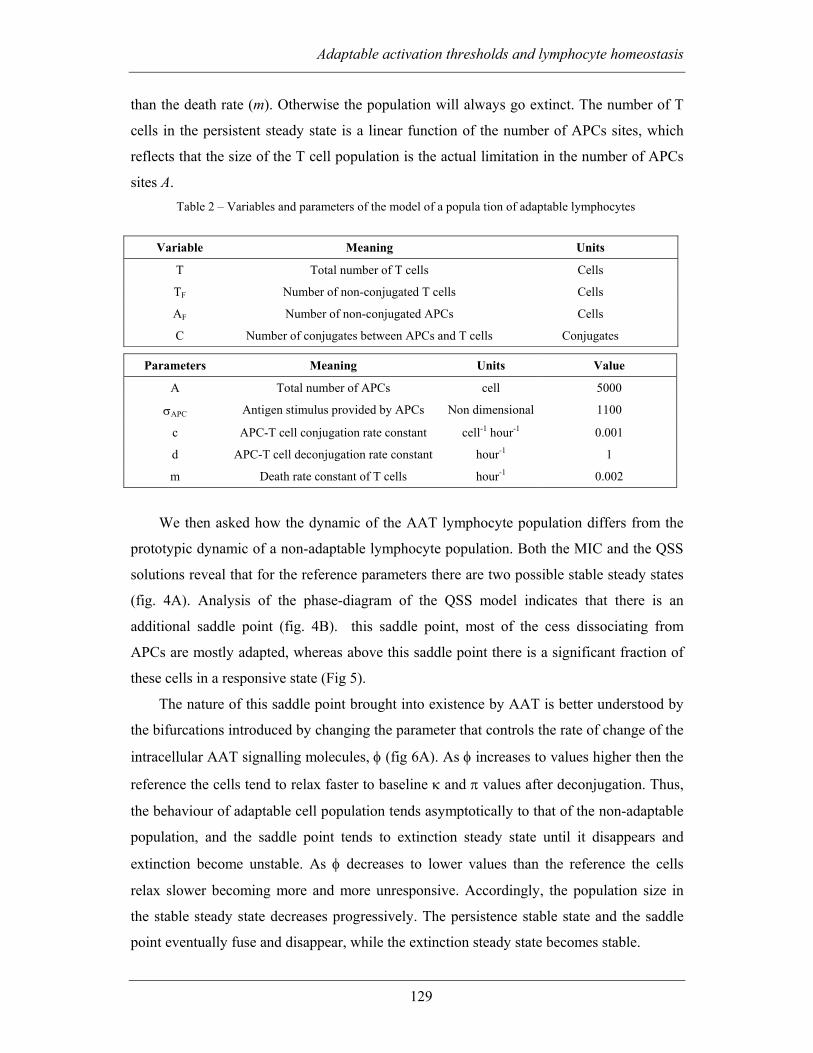
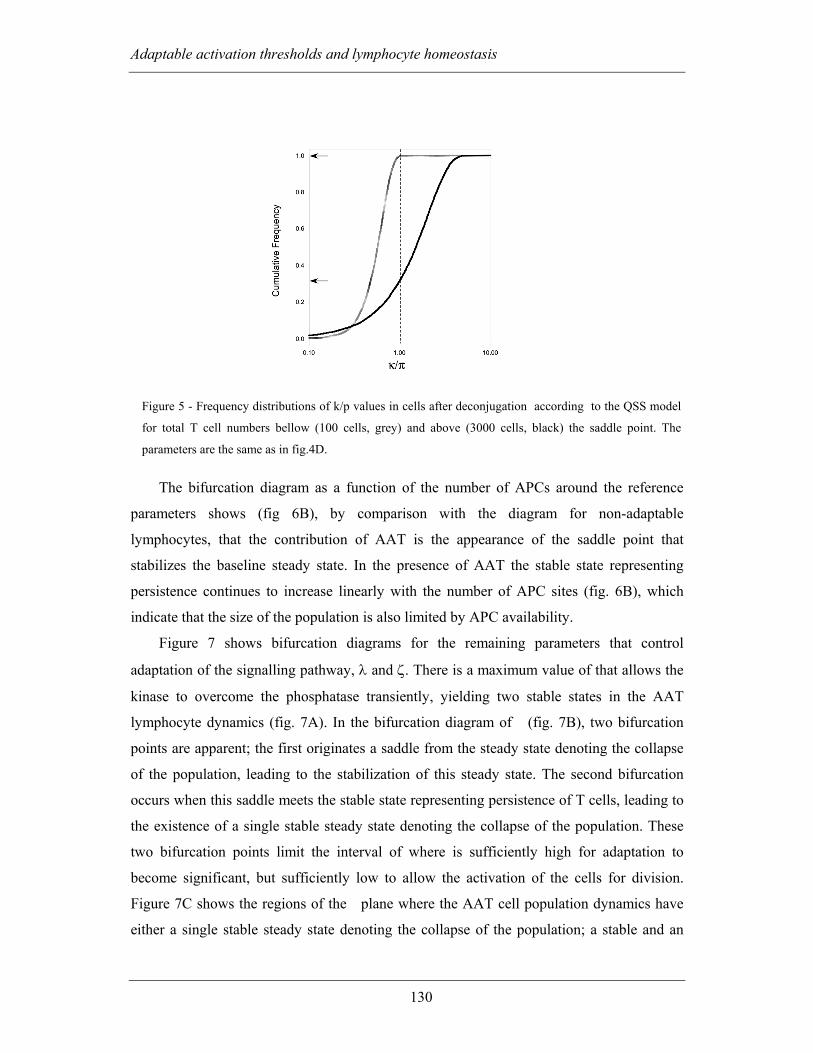
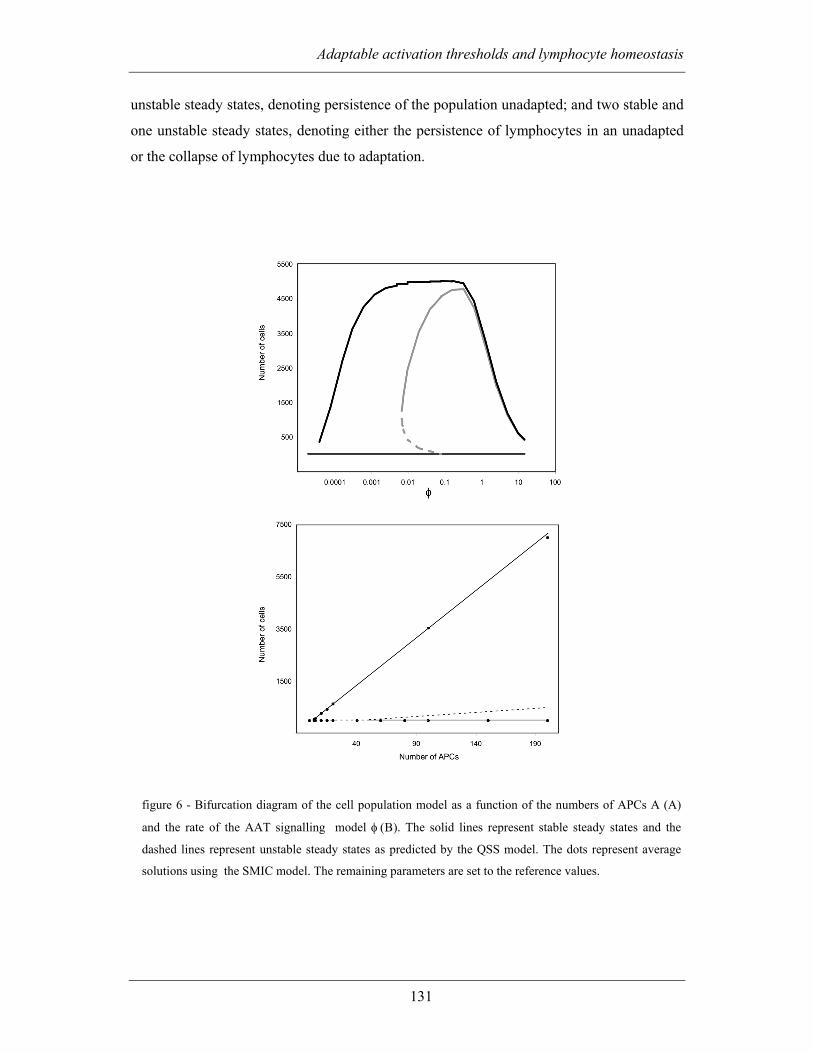
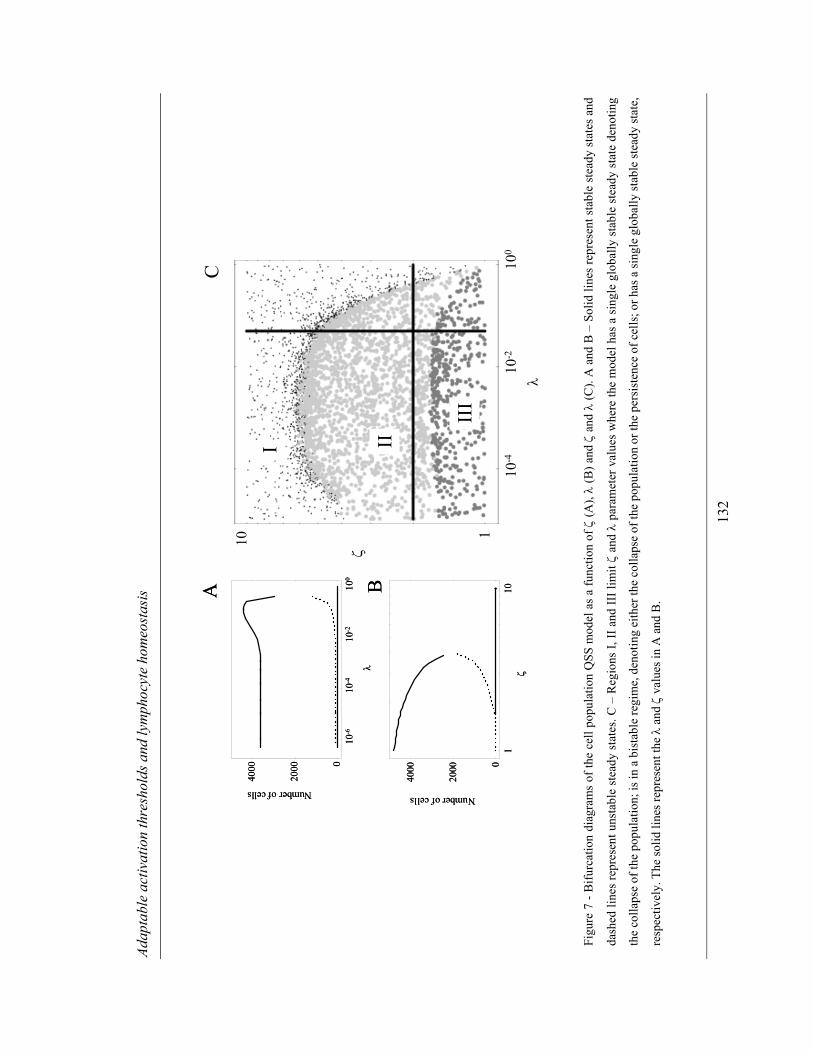


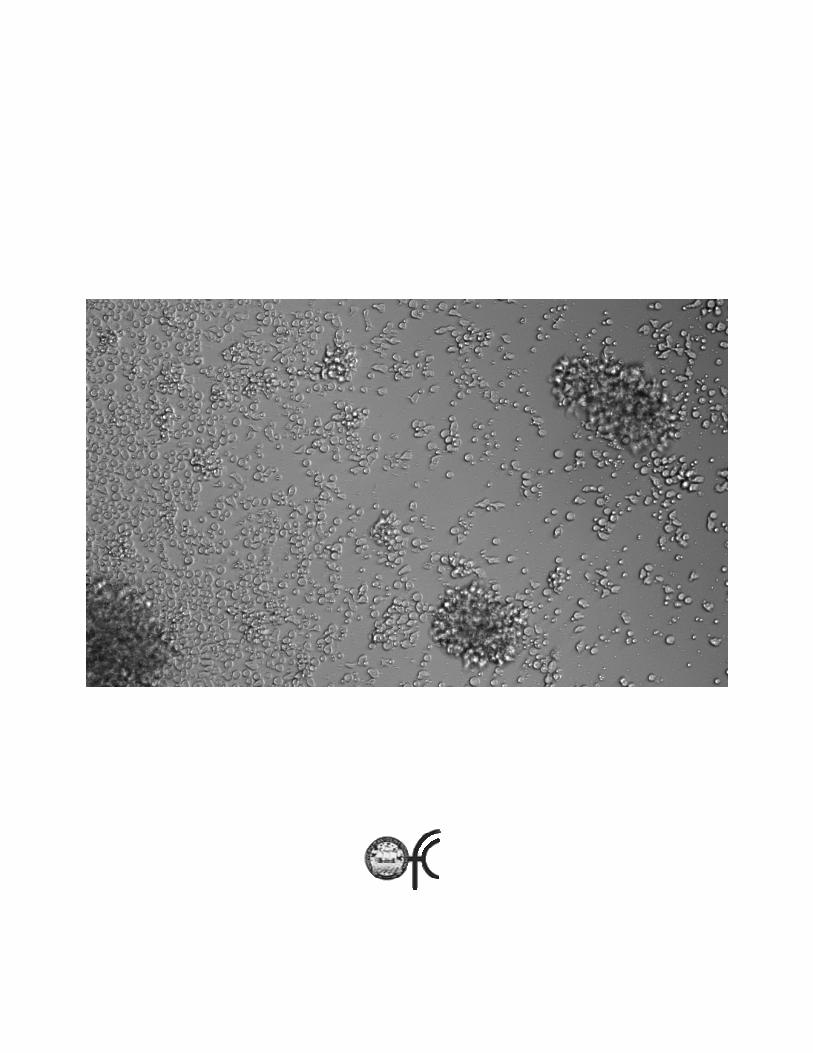


![IMMUNOGLOBULINE E T CELL RECEPTOR T. Strachan e A.P. … · B cell antigen receptor tetramero [ IgH 2 + IgL 2 (Ig oppure Ig )] T cell receptor (TCR) eterodimero TCR /TCR TCR /TCR](https://static.documents.pub/doc/80x56/5c017b5c09d3f26f1e8cc6a0/immunoglobuline-e-t-cell-receptor-t-strachan-e-ap-b-cell-antigen-receptor.jpg)


