12. S. A. Burns, R. Tumbar, A. E. Elsner, D. Ferguson, and D. X. Hammer, “Large-field-of-view, modular,
stabilized, adaptive-optics-based scanning laser ophthalmoscope,” J. Opt. Soc. Am. A 24(5), 1313–1326 (2007).
13. W. Zou, X. Qi, and S. A. Burns, “Wavefront-aberration sorting and correction for a dual-deformable-mirror
adaptive-optics system,” Opt. Lett. 33(22), 2602–2604 (2008).
#133434 - $15.00 USD Received 17 Aug 2010; revised 13 Oct 2010; accepted 22 Oct 2010; published 15 Nov 2010(C) 2010 OSA 22 November 2010 / Vol. 18, No. 24 / OPTICS EXPRESS 24902
14. J. I. Morgan, A. Dubra, R. Wolfe, W. H. Merigan, and D. R. Williams, “In vivo autofluorescence imaging of the
human and macaque retinal pigment epithelial cell mosaic,” Invest. Ophthalmol. Vis. Sci. 50(3), 1350–1359
(2008).
15. G. L. Walls, The vertebrate eye and its adaptive radiation (Cranbrook Institute of Science, Bloomfield Hills, MI,
1942), Chap. 3,8.
16. J. E. Dowling, The retina: an approachable part of the brain (Harvard University Press, Cambridge, MA, 1987),
Chap. 2.
17. M. Schultze, “The retina,” in Manual of human and comparative histology, S. Stricker, ed. (New Sydenham
Society, London, 1873).
18. K. Y. Li, P. Tiruveedhula, and A. Roorda, “Inter-subject variability of foveal cone photoreceptor density in
relation to eye length,” Invest. Ophthalmol. Vis. Sci. (Accepted).
19. N. M. Putnam, H. J. Hofer, N. Doble, L. Chen, J. Carroll, and D. R. Williams, “The locus of fixation and the
foveal cone mosaic,” J. Vis. 5(7), 632–639 (2005).
20. Y. Zhang, S. Poonja, and A. Roorda, “AOSLO: from Benchtop to Clinic,” Proc. SPIE 6306, 63060V (2006).
21. A. M. Laties, and B. Burnside, “The maintenance of photoreceptor orientation,” in Motility and Cell Function:
Proceedings of the First John M. Marshall Symposium in Cell Biology, F. Pepe, V. Nachmias and J.W. Sanger,
eds. (Academic Press, New York, 1978).
22. A. Roorda, and D. R. Williams, “Optical fiber properties of individual human cones,” J. Vis. 2(5), 404–412
(2002).
23. W. Gao, R. S. Jonnal, B. Cense, O. P. Kocaoglu, Q. Wang, and D. T. Miller, “Measuring directionality of the
retinal reflection with a Shack-Hartmann wavefront sensor,” Opt. Express 17(25), 23085–23097 (2009),
40. D. R. Williams, “Visual consequences of the foveal pit,” Invest. Ophthalmol. Vis. Sci. 19(6), 653–667 (1980).
41. P. Bedggood, M. Daaboul, R. Ashman, G. Smith, and A. Metha, “Characteristics of the human isoplanatic patch
and implications for adaptive optics retinal imaging,” J. Biomed. Opt. 13(2), 024008 (2008).
1. Introduction
Adaptive optics scanning laser ophthalmoscopy (AOSLO) has been used for nearly a decade
to produce high-resolution images of microscopic retinal structures in the living eye [1].
#133434 - $15.00 USD Received 17 Aug 2010; revised 13 Oct 2010; accepted 22 Oct 2010; published 15 Nov 2010(C) 2010 OSA 22 November 2010 / Vol. 18, No. 24 / OPTICS EXPRESS 24903
AOSLO imaging has a number of features which make it an appealing choice for both clinical
and basic science applications, including the ability to axially section retinal layers, the
capability to encode dynamic stimuli directly in the imaging beam, and the ability to study
fixation, acuity, sensitivity, or other metrics of visual performance at video-rate while
simultaneously visualizing retinal cells [2–8].
AOSLO is the method of choice for the study and characterization of the normal
functioning retina, specifically the central foveola with its critical role in normal dynamic
visual tasks such as reading. Questions regarding the structure and function of the foveal
center could be better answered with the use of real-time microscopic imaging with AOSLO.
Previous AOSLO studies, for example, characterized the retinal locations targeted by
different eye movement systems by identifying and comparing the preferred retinal locus for
pursuit eye movement tasks, saccadic eye movement tasks, and for steady fixation [7].
Interestingly, they found that preferred retinal loci for these tasks were not necessarily in the
same location. A limitation to these studies, however, was the lack of resolution of the
smallest cones in the central fovea, resulting in the inability to relate these loci to the peak
cone density position. The ability to characterize the anatomy, resolve the smallest foveal
cones, and compare these to functional measures such as detection and acuity will aid our
understanding of the capabilities and limitations of the functioning fovea.
Despite steady improvement in AOSLO systems over the years [9–14], the difficulty of
resolving all the cones in the central fovea remains. This is mainly due to their small size and
dense packing but also, as we will describe in this paper, as a result of their unique anatomical
structure, which is said to be more rod-like compared with more peripheral cones [15–17]. In
the past year, we‟ve reported a few cases where the entire cone mosaic in a healthy normal
retina has been resolved with AOSLO [18], but typically the smallest cones within the central
~0.1 degree remain difficult to resolve even under the best conditions.
In non-scanning, flood illumination CCD-based systems that use incoherent light, it seems
that the entire foveal cone mosaic can be imaged more routinely, as evidenced by reports
from the AO Ophthalmoscope at the University of Rochester [19]. Both systems are designed
to have similar theoretical resolution limits, which led us to implicate additional limits to
AOSLO resolution resulting from the partial coherence of the light source. In fact, we‟ve
already reported that the fidelity of AOSLO images improved greatly when we used a low
coherent light source [20].
In order to better understand and devise ways to overcome the factors limiting
performance in AOSLO imaging, we developed an accurate model of foveal cone imaging
that considers basic optical factors such as wavelength, pupil size, and the formation of an
image with a scanning laser system. The model focuses primarily, however, on the impact of
source coherence, a factor that is specific to the AOSLO imaging modality.
2. Methods
The following sections outline the development of a model of foveal cone imaging that will
ultimately lead to simulated AOSLO images of the photoreceptor mosaic. We first consider
where the light originates in an AOSLO image of a cone and measure the relative magnitude
of the contributions. Second, we develop a model of how neighboring cones interact when
illuminated with coherent light. Third, we define a cone mosaic, drawing from existing
anatomical measures. Finally, we describe how to construct images point-by-point through
raster scanning or conventional imaging using light sources with different degrees of spatial
and temporal coherence.
2.1. Where does the light come from in an AOSLO image of a cone?
We expect that en face AO images of photoreceptors, including those taken with AOSLO, are
best resolved when the optical focus is at the anterior tips of the inner segments, consistent
with the location of the external limiting membrane (ELM). This is because this corresponds
#133434 - $15.00 USD Received 17 Aug 2010; revised 13 Oct 2010; accepted 22 Oct 2010; published 15 Nov 2010(C) 2010 OSA 22 November 2010 / Vol. 18, No. 24 / OPTICS EXPRESS 24904
to the anatomic axial position where light emerges from the fiber-optic portion of the
photoreceptor [21]. The light emerging from this aperture originates from two primary
reflections that occur within the optical fiber component of the photoreceptor, the first from
the inner-segment/outer-segment (IS/OS) junction and the second at the posterior end of the
OS. These sources are readily seen in OCT B-scan images whose imaging mechanism is
designed to reveal the relative optical path lengths of light returning from the retina. We know
that these sources of reflections within cones contribute to AOSLO cone images because:
1) AOSLO and flood-illuminated AO images of the cone mosaic exhibit the same
waveguiding properties as the IS/OS and OS layers in OCT [22,23];
2) The magnitude of light measured from AOSLO and flood-illuminated AO images of
cones is affected by visual pigments that reside in the outer segment of the cone [24];
and
3) There is apparent interference between the two primary sources of reflection in flood-
illuminated AO retinal images (provided that the right type of light source is used)
[25].
As such, our model considers each cone as a point source with an intensity weighted by
the relative intensities from the two sources of reflections within the cones.
The relative contributions of the sources of reflection within the cones are not constant
however. While the reflection at the OS tips are nearly uniform across the macula, there is a
decreased reflection of the IS/OS junction near the base of the foveal pit. We suspect that this
decreased reflectance in the central fovea is due to the unique anatomical structure of the cone
photoreceptors at the foveal center, which exhibit a minimal taper at the IS/OS compared with
more peripheral cones [15–17, 26,27].
2.2. OCT measurements of foveal cone reflectance
To quantify the reflectance signal from different retinal layers, we examined OCT raster scans
(256(L) x 256(W) x 1024(H), acquired in ~4 sec.) and horizontal OCT cross-sectional images
through the fovea for 9 subjects aged 18-51 yrs old (median age = 25 yrs old). The OCT scans
were acquired with an AO-SDOCT system described previously [28]. We averaged 50 axial
profiles at several retinal eccentricities up to 1 deg. For each profile, the ratio of the
reflectance of the posterior tips of the outer segments to the layer corresponding to the IS/OS
junction was measured. The fovea was located by the appearance on the images of the pit, the
foveal reflex, and the increased separation between the signal from the IS/OS junction and
that from the posterior tips of the OS (indicative of cone elongation associated with packing
in the fovea). For comparison of reflectance signals, the customary logarithmic scaling –
normally used to accentuate dim anterior layers – was eschewed in favor of linear scaling.
Figure 1(a) shows a retinal image linearly scaled with an inverse gray-scale color map. The
arrow shows the location of the fovea where the IS/OS junction signal is attenuated. Figure
1(b) show an OCT image (composite of 5 co-added frames) with typical logarithmic
reflectance scaling and gray-scale color map. The boxes in Fig. 1(b) show two regions where
the profiles were averaged, one centered on the fovea and one centered at 1 deg. The
corresponding profiles are shown in Fig. 1(c).
#133434 - $15.00 USD Received 17 Aug 2010; revised 13 Oct 2010; accepted 22 Oct 2010; published 15 Nov 2010(C) 2010 OSA 22 November 2010 / Vol. 18, No. 24 / OPTICS EXPRESS 24905
Fig. 1. (a) Single linearly scaled OCT image illustrating attenuation of the IS/OS junction layer
(arrow). (b) Composite OCT image showing regions over which the profiles were averaged
(boxes). (c) Profiles from the regions in (b). In this case the ratio of reflectance at the posterior
tips of the OS divided by reflectance at the IS/OS junction at the fovea was 4.18 and at 1 deg
was 1.16.
Figure 2 shows an en-face OCT image through the fovea of one subject where individual
retinal layers through the photoreceptors have been summed using a projection view of the
layer containing the IS/OS junction (Fig. 2(a)) and the layer containing the posterior tips of
the OS (Fig. 2 (b)). The mottled appearance of the image in Fig. 2(a) is due to the cones,
although the mosaic is not completely visible because of eye motion during the relatively
slow OCT raster. The decreased reflectivity in the region within 0.5 deg of the fovea is clearly
visible (arrow) in Fig. 2(a) while Fig. 2(b) does not show a comparable decrease in
reflectivity.
#133434 - $15.00 USD Received 17 Aug 2010; revised 13 Oct 2010; accepted 22 Oct 2010; published 15 Nov 2010(C) 2010 OSA 22 November 2010 / Vol. 18, No. 24 / OPTICS EXPRESS 24906
Fig. 2. En-face OCT images at the photoreceptor layers (left) and corresponding summed
layers shown in cross-sectional image through the fovea (right). (a) Composite image created
from 27 depth slices through the IS/OS junction layer. Decreased reflectivity within 0.5 deg of
the fovea is clearly visible (arrow). (b) Composite image created from 15 depth slices through
the posterior tips of the OS.
To quantify the decrease in reflectivity for all subjects, we analyzed the horizontal cross-
sectional scans. Figure 3 shows the average linear reflectance ratio between the photoreceptor
layers (IS/OS junction and posterior tips of the OS). At eccentricities greater than 0.5 deg, the
ratio between photoreceptor layers approaches 1. The attenuation of the IS/OS layer signal
caused an increase in the reflectance ratio at eccentricities less than ± 0.5 deg in all subjects.
The average ratio was approximately 2.5 times higher at the fovea compared with
eccentricities greater than 0.5deg (min = 1.94 and max = 3.55).
Fig. 3. Increase in reflectance ratio associated with IS/OS layer attenuation in the central fovea.
Average values for 9 subjects.
A polynomial fit to the data in Fig. 3 was performed using Microsoft Excel and is
expressed with Eq. (1), where r is retinal eccentricity in degrees. This fit is shown in Fig. 3.
22.8532 4.9122 3.4963.weight r r (1)
#133434 - $15.00 USD Received 17 Aug 2010; revised 13 Oct 2010; accepted 22 Oct 2010; published 15 Nov 2010(C) 2010 OSA 22 November 2010 / Vol. 18, No. 24 / OPTICS EXPRESS 24907
This polynomial curve fit is only accurate for the range of data shown in Fig. 3, a region
extending approximately 1 degree away from the foveal center. In this way, the intensity of
the reflection from the IS/OS junction in the region with the highest cone density contributed
approximately 3.5 times less than the reflection from the posterior tips of the OS while in
contrast cones out as little as 0.5 degrees only contribute approximately 1.5 times less.
AOSLO images and flood-illuminated AO ophthalmoscopy images of the foveal cone mosaic
are taken with the instrument focus at the anterior tips of the inner segments of the
photoreceptors (at the level of the external limiting membrane), with the light collected being
the sum of the two en-face OCT images shown in Fig. 2. As a result, the weight of an
individual cone would in general be proportional to a contribution defined by the inverse of
the weight defined by Eq. (1) from the IS/OS junction plus a constant intensity contribution
from the posterior tips of the OS. In our model, the center of the fovea is defined by using
automated software to determine the point with maximum cone density and r is then the
distance to the cone with maximum density [29]. In real images there are individual variations
in the intensity of light emitted from cones, but this function describes only the overall
variation seen in the foveal center [30].
2.3. The impact of source coherence
Cone photoreceptors are known to act as waveguides. As stated earlier, the light scattered
from the IS/OS junction and the posterior tips of the OS are summed and emerge at the
anterior tips of the IS. Since their size [31], and behavior [22,23,32], is consistent with the
cones being single mode fibers, we can consider each as an isolated point source for AOSLO
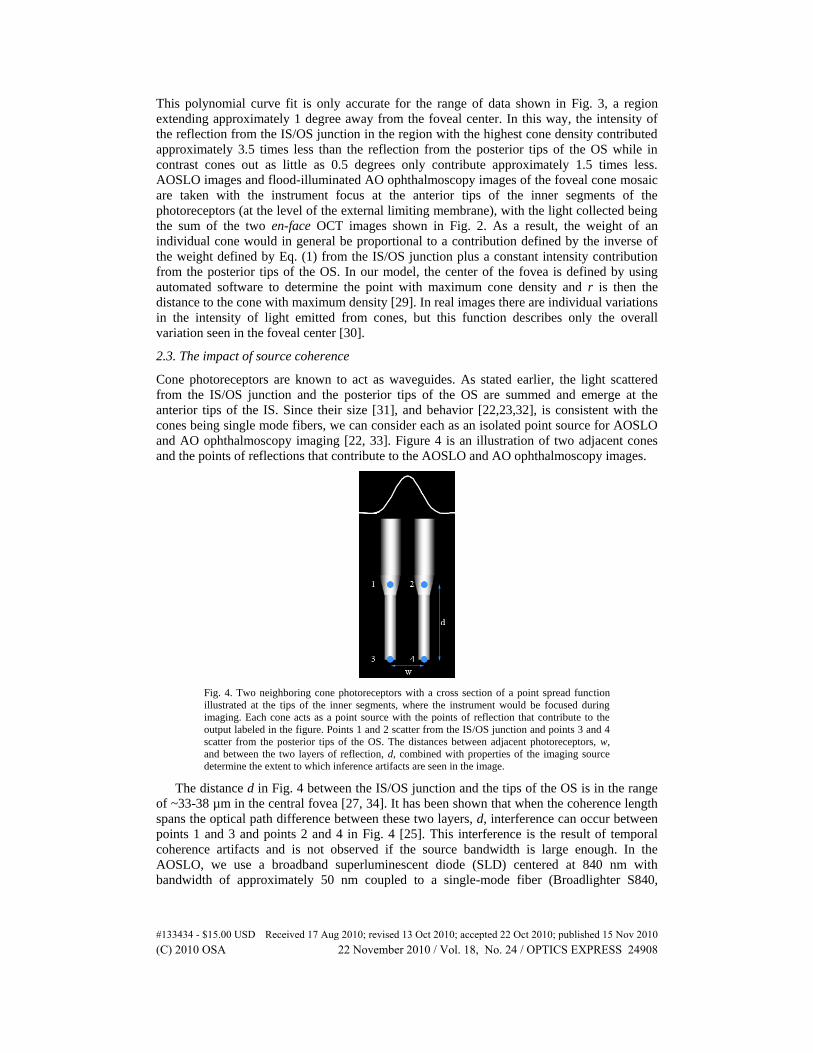
and AO ophthalmoscopy imaging [22, 33]. Figure 4 is an illustration of two adjacent cones
and the points of reflections that contribute to the AOSLO and AO ophthalmoscopy images.
Fig. 4. Two neighboring cone photoreceptors with a cross section of a point spread function
illustrated at the tips of the inner segments, where the instrument would be focused during
imaging. Each cone acts as a point source with the points of reflection that contribute to the
output labeled in the figure. Points 1 and 2 scatter from the IS/OS junction and points 3 and 4
scatter from the posterior tips of the OS. The distances between adjacent photoreceptors, w,
and between the two layers of reflection, d, combined with properties of the imaging source
determine the extent to which inference artifacts are seen in the image.
The distance d in Fig. 4 between the IS/OS junction and the tips of the OS is in the range
of ~33-38 µm in the central fovea [27, 34]. It has been shown that when the coherence length
spans the optical path difference between these two layers, d, interference can occur between
points 1 and 3 and points 2 and 4 in Fig. 4 [25]. This interference is the result of temporal
coherence artifacts and is not observed if the source bandwidth is large enough. In the
AOSLO, we use a broadband superluminescent diode (SLD) centered at 840 nm with
bandwidth of approximately 50 nm coupled to a single-mode fiber (Broadlighter S840,
#133434 - $15.00 USD Received 17 Aug 2010; revised 13 Oct 2010; accepted 22 Oct 2010; published 15 Nov 2010(C) 2010 OSA 22 November 2010 / Vol. 18, No. 24 / OPTICS EXPRESS 24908
Superlum, Russia). The coherence length inside the cone photoreceptors is calculated to be
approximately 4.35 µm, which is much shorter than the distance d [20, 25]. The distance w in
Fig. 4 between adjacent cones in the central fovea is approximately 2-3 microns or 0.5
minutes of arc, which is large enough to resolve the cones under typical imaging conditions,
but the AO-corrected illumination spot does cover more than one cone, as does the secondary
image of the cones formed at the confocal aperture.
Each cone photoreceptor is considered to be a point source. In the confocal pinhole plane
of the AOSLO, the image of each point takes the following form, which when multiplied by
its complex conjugate corresponds to a diffraction-limited Airy disk:
12 ( )
( ) exp( 2 ).j
j o j
j
J krE r cE i t
kr (2)
In Eq. (2), c is a constant, k is the wavenumber, r the cone location, and t represents a
random phase term assigned to each simulated cone photoreceptor, to account for variable
optical path lengths of the photoreceptor caused by variable outer segment lengths, or active
metabolic processes resulting in phase differences between cones. The time dependence on
the phase term could be fast changes caused by bleaching and recovery, or slow changes
caused by shedding and regeneration of outer segments [25,35]. In the case of a coherent
system where all points can interfere with each other, the intensity function includes phase
terms due to constructive and destructive interference:
2 2 2 2
1 2 3 4
* *
1 2 1 2 1 3 1 3
* *
1 4 1 4 2 1 2 1
* *
2 3 2 3 2 4 2 4
* *
3 1 3 1 3 2 3
exp[ 2 ( )] exp[ 2 ( )]
exp[ 2 ( )] exp[ 2 ( )]
exp[ 2 ( )] exp[ 2 ( )]Re
exp[ 2 ( )] exp[ 2 (
E E E E
E E i E E i
E E i E E i
I c E E i E E i
E E i E E i
2
1
2
* *
3 4 3 4 4 1 4 1
* *
4 2 4 2 4 3 4 3
2 ( ).
)]
exp[ 2 ( )] exp[ 2 ( )]
exp[ 2 ( )] exp[ 2 ( )]
j
j
J kr
kr
E E i E E i
E E i E E i
(3)
For a purely incoherent system, no interference is observed, resulting in the intensity
function:
2
2 2 2 2 1
1 2 3 4
2 ( ).
j
j
J krI c E E E E
kr
(4)
Finally, in the case for our AOSLO system, for which the distance d between the layers of
reflection is longer than the coherence length of the laser, Eq. (3) reduces to include only the
terms that can interfere:
2 2 2 2
21 2 3 4
1* *
1 2 1 2 3 4 3 4
* *
2 1 2 1 4 3 4 3
2 2 2 2
1 2 3 4
2 2
1 2 1 2 3 4
2 ( )exp[ 2 ( )] exp[ 2 ( )]
Reexp[ 2 ( )] exp[ 2 ( )]
cos[2 ( )] cos
j
j
E E E EJ kr
I c E E i E E ikr
E E i E E i
E E E Ec
E E E E
2
1
3 4
2 ( ).
[2 ( )]
j
j
J kr
kr
(5)
#133434 - $15.00 USD Received 17 Aug 2010; revised 13 Oct 2010; accepted 22 Oct 2010; published 15 Nov 2010(C) 2010 OSA 22 November 2010 / Vol. 18, No. 24 / OPTICS EXPRESS 24909
Equation (4) and Eq. (5) show that the use of a low-coherence SLD or other wide
bandwidth source can effectively eliminate or reduce interference artifacts. This is indeed the
case, as flood illuminated AO-ophthalmoscopes with temporally and spatially incoherent light
show no apparent coherence artifacts and AOSLOs equipped with broadband sources have
been shown to produce images with fewer interference artifacts [10,20,36]. But spatial
coherence remains an issue for AOSLO imaging of densely packed foveal cones due to lateral
optical interactions between them.
2.4. Defining the foveal cone mosaic
A set of coordinates of individual foveolar cones obtained offline from human cone images
was used as the input object for the model. The intensity at each cone was initially set to be
inversely proportional to cone density such that it was uniform across the image [29].
Incoherent mosaics were generated by assigning an intensity value to each cone that was
the sum of the two sources of reflections with relative intensities between the sources as
specified by Eq. (1). We intentionally ignored individual variations in cone intensity in an
effort to isolate the impact of the diminished contribution of the IS/OS junction at the foveal
center.
For coherent imaging, we assigned intensities to the two respective sources separately in
same manner as above and additionally assigned random phase terms to the two sources
within each cone.
For the AOSLO image we treated the two sources within each cone as mutually
incoherent, owing to the short coherence length of the SLD source. As such, the image was
effectively formed by the sum of two independently generated coherent images, each with
different initial phase terms, initiating from the two sources of reflection.
2.5. Image formation in the model
The point spread function (PSF) of the imaging system was considered to be diffraction-
limited with appropriate settings for the pupil size and imaging wavelength used in our
system. Because of the confocal pinhole, the PSF for incoherent imaging becomes the square
of an actual Airy disk [37]. The illumination PSF was assumed to be the same as the imaging
PSF as is typical for AOSLOs. For coherent imaging, the amplitude PSF was used for both
the illumination and imaging paths. Incoherent images were generated in the classic way, by
convolving the object with an intensity PSF.
Similar to the process by which they are formed in an actual AOSLO, the simulated
coherent and AOSLO images were defined point by point using custom software developed
in Matlab (The Mathworks, Natick, MA). First, initial intensity and phase values were
assigned to each cone in accordance to the process outlined above. Then, an illumination PSF
was centered at a specific location on the model retina and was used to weight its intensity. A
secondary image of the illuminated model retina was generated at the confocal pinhole plane
by convolving the object with the imaging PSF. The intensity of this secondary image was
computed and then integrated over the open aperture of the confocal pinhole which, in a
properly aligned system corresponds to the same location as the illuminated point. A single
intensity value was determined in this manner and was repeated for a grid of illumination
locations across the model retina. In this simulation, the confocal pinhole was considered to
be an infinitely small aperture but the result will be similar for finite pinholes.
To offer some intuition about how interference arises in the scanning imaging process,
consider the following situation where the AOSLO beam is scanning over two adjacent cones
in the foveal center. The PSF is small enough to resolve the cones, but still large enough to
illuminate two adjacent cones simultaneously (as illustrated in Fig. 4). Now consider the case
where the scanning beam is midway between the two cones. With incoherent light, the PSF is
just small enough to record a slight drop in reflected intensity at that location compared to
when it was centered over one cone, and the cones are thus resolved. Now consider the
#133434 - $15.00 USD Received 17 Aug 2010; revised 13 Oct 2010; accepted 22 Oct 2010; published 15 Nov 2010(C) 2010 OSA 22 November 2010 / Vol. 18, No. 24 / OPTICS EXPRESS 24910
coherent case: When the light from the two cones are in phase, light from the two adjacent
cones will constructively interfere and will be observed as a maximum in reflectance at that
scan location. Conversely, when the light from the two cones are 180° out of phase there is
destructive interference and a minimum in intensity is recorded. In the actual situation, the
phase difference of the light emerging from adjacent cones is random, and generates a type of
speckle pattern whose maximum spatial frequency corresponds to the cone mosaic (provided
that the incoherent resolution is better than the cone mosaic).
2.6. Adding multiple coherent or AOSLO Images
Since no noise was modeled, there is no benefit gained by adding multiple incoherent images.
When adding multiple AOSLO or coherently imaged frames, we generated independent
images as specified above, each with a new set of randomly assigned phase terms for each
cone and added them in intensity. This was done to account for changes in optical path
lengths, either by varying OS lengths, slight changes in the sources of reflection within the
cone, or changes in refractive index within the cones. As such, the benefits shown by adding
multiple frames are only realized when such changes have occurred. When random phase
changes do occur, then the sum of multiple coherent and/or AOSLO images is expected to
yield an image that is identical to the incoherent image.
3. Results
Typical imaging parameters were used to compute simulated images of the foveal cone
mosaic with a wavelength of 840 nm and a 6 mm pupil, which corresponds to a full width at
half maximum (FWHM) of approximately 0.6 arcmin. It is important to note that with a
typical residual RMS wavefront error, we would expect this to increase according to previous
studies [38]. Figure 5(a) shows an incoherent image, Fig. 5(b) shows a coherent AOSLO
image with one layer of interference, and Fig. 5(c) shows a partially-coherent AOSLO image
with two separate layers with independent interference artifacts and weighting summed to
form the overall adjusted coherent AOSLO image.
Fig. 5. Model foveal cone mosaics using 840 nm light and a 6 mm pupil. (a) Incoherent image
(b) Coherent AOSLO image which allows for interference to occur between the two scattering
sources within each cone, and (c) Low-coherence AOSLO image which does not allow for
interference between the two scattering sources within each cone.
The highest density foveal cones are difficult to see in all the images, but particularly in
Fig. 5(b) and (c) where interference artifacts completely contaminate their visibility. With
coherent light, interference occurs between the two sources within the cone, causing random
brightness variations across the entire mosaic. The immediate benefit of eliminating the
interference between the two sources within a cone is apparent in Fig. 5(c), for which the
intensity of the cone reflectivity remains much more uniform. But, at the foveal center, the
lateral interference between neighboring cones dominates and the interference appears more
similar between 5 (b) and (c).
#133434 - $15.00 USD Received 17 Aug 2010; revised 13 Oct 2010; accepted 22 Oct 2010; published 15 Nov 2010(C) 2010 OSA 22 November 2010 / Vol. 18, No. 24 / OPTICS EXPRESS 24911
Figure 6 compares actual images of the same cone mosaic taken with coherent (660 nm
laser diode) and low-coherence (680 nm superluminescent diode) light from a living eye. As
expected, the mosaic has a much more uniform reflectance in the low-coherence case and a
more contiguous cone mosaic is resolved.
Fig. 6. Both images are of the same photoreceptor mosaic in a healthy normal eye. Both
images are a registered sum of 100 frames from a single video. Variations in phase were not
expected to have occurred over the course of one video and the addition of multiple frames is
used here to increase the S:N of the image. The left image is taken with coherent 660 nm light
and the right is taken with low coherent 680 nm light. The cone reflectance in the right image
is much less variable, and the image reveals more of the contiguous close-packed cone
photoreceptor array. The FFT of the image (lower left inset) reveals a better defined ring
corresponding to the periodic cone array for the low-coherent image.
Figure 7. shows the benefit of adding multiple frames with independent phase
relationships for coherent AOSLO images, where Fig. 7(a) is a single coherent image, Fig.
7(b) is the sum of 100 coherent images, and Fig. 7(c) is the incoherent image for comparison.
As per the model, each image is generated with a unique set of random phase assignments to
each cone. In both the coherent and the partially-coherent AOSLO cases, the addition of
multiple frames reduces the interference artifacts, resulting in a higher fidelity image of the
cone mosaic. The low coherence of the light source in the partially-coherent AOSLO image
leads to faster convergence toward an incoherent image compared to the purely coherent case.
Single coherent image (b) Sum of 100 coherent images (c) Incoherent image.
As expected, summing many coherent images results in an effectively incoherent image,
provided that random phase changes occur between cones in the mosaic. In order to further
illustrate the difference between the incoherent image and sums of coherent images for the
model, a simplified retinal mosaic was used comprised of a small field with only 2, 3, or 4
#133434 - $15.00 USD Received 17 Aug 2010; revised 13 Oct 2010; accepted 22 Oct 2010; published 15 Nov 2010(C) 2010 OSA 22 November 2010 / Vol. 18, No. 24 / OPTICS EXPRESS 24912
cones. Figure 8 illustrates the convergence of the sums of these simplified coherent images
onto the incoherent image with Fig. 8(a) plotting the log of the difference between the
maximum intensity in the images for the sum images and a single incoherent image and Fig.
8(b) plotting the log of the difference between the mean intensities. All cases approach zero
difference with the sum of multiple coherent images, more slowly with more cones in the
image.
Fig. 8. Plots illustrate the maximum (a) and mean (b) intensities of difference images between
sums of independent coherent images and the corresponding incoherent image, where all
images have a normalized maximum intensity of 255. For images containing 2, 3, and 4 cones,
the sum of independent coherent images approaches the incoherent image and images with
more cones require the addition of more images.
4. Discussion
Simulated images from the model are qualitatively similar to actual AOSLO images of the
foveal cone mosaic. Figure 9 shows a typical image of the foveal cone mosaic taken from a
healthy normal retina. The retinal topography is rarely flat and the layer of interest is not
necessarily the layer that the wavefront sensor drives the correction toward. To account for
that, we programmed the deformable mirror to apply precise focal adjustments during closed-
loop. For all images like that shown in Fig. 9, the focus is adjusted to obtain the sharpest and
brightest cone images. Despite focal adjustments with steps as small as 0.05 D, we still do not
routinely resolve cones in the foveal center. In both simulated and actual images, there is no
clear and unambiguous mosaic of cones in the foveal center, but neither image is of low
contrast either. Rather, the foveal center has a high contrast speckle-like pattern. These
images support the idea that the presence of interference artifacts in AOSLO images is the
primary reason it fails to reliably produce images of the foveal cone mosaic. While the use of
a low coherent laser in the AOSLO offered major improvements, it was not sufficient to
mitigate interference artifacts in images of the highest density cones.
#133434 - $15.00 USD Received 17 Aug 2010; revised 13 Oct 2010; accepted 22 Oct 2010; published 15 Nov 2010(C) 2010 OSA 22 November 2010 / Vol. 18, No. 24 / OPTICS EXPRESS 24913
Fig. 9. AOSLO image of the foveal center of a healthy normal eye taken with broadband 840
nm light. The image is a sum of 279 frames from an individual video where variations in phase
are not expected to occur, similar to the images in Fig. 6. A contiguous, close-packed mosaic is
visible at the margins of the image but at the foveal center, the mosaic of cones is less clear.
Despite the fact that cones are not resolved, the image still has high contrast, exhibiting a
speckle-like appearance.
A straightforward and obvious approach to reliably image the foveal cone mosaic is to
minimize lateral interference between cones. This can be achieved by using larger pupil sizes
and shorter-wavelength broadband light sources along with improved control of the AO
system. But in a single frame, or even with a registered sum of multiple frames taken under
the same optical conditions, lateral interference is still inevitable, given the practical limits on
pupil size and wavelength available in a human eye. Further mitigation of the remaining
interference artifacts can be achieved only by generating different phase relationships
between the cones and summing frames acquired under those conditions. By averaging
images with different interference patterns the net image would approach an incoherent
image, as demonstrated by Fig. 7 and Fig. 8.
To generate images of the same mosaic with different interference patterns we can image
the same mosaic at different times, where the time delay between images is large compared to
the underlying metabolic processes that cause phase differences within the cones. Over time,
it is reasonable to expect that the relative optical path lengths between adjacent cones will
vary randomly by ¼ wave or more, an amount that is sufficient to generate a unique
interference pattern. We can also average images taken with different wavelengths.
Interference artifacts will become less correlated as the wavelength separation increases.
Finally, the average of a sequence of images taken over a time course where the optical path
lengths of cones are intentionally changed is a promising approach and would be the most
efficient. Miller‟s lab at Indiana University has shown that with visible light stimulation the
optical path length of the cone photoreceptors does change quickly [25]. If we image the
foveal cones with IR light and stimulate the cones with red light, then the average of the
sequence of frames during which the red light is activating the cones, should yield an image
that is effectively incoherent. The dual wavelength imaging techniques along with precise
stimulation in our AOSLO systems will facilitate these experiments [10].
The model assumes that all cones reflect equally in space and over time. In fact, the
reflectivity of cones is known to vary over time, even in the absence of interference artifacts.
Pallikaris et al. used a flood-illuminated AO ophthalmoscope with a spatially and temporally
incoherent Krypton flashlamp illumination source to measure the reflectivity of a human cone
mosaic approximately every hour over a span of 24 hours [30]. The images revealed
significant changes in cone reflectivity to the extent that, after six hours, cone intensity
#133434 - $15.00 USD Received 17 Aug 2010; revised 13 Oct 2010; accepted 22 Oct 2010; published 15 Nov 2010(C) 2010 OSA 22 November 2010 / Vol. 18, No. 24 / OPTICS EXPRESS 24914
became uncorrelated with baseline. They also determined that the source of the variability
originated primarily from the posterior termination of the cone outer segment. The
implications of the latter results are that cones in the foveal center, which have a relatively
weak reflection from their IS/OS junction, ought to experience larger relative changes in
reflectance than more peripheral cones that have a stable and significant IS/OS component. In
our (unreported) observations of incoherent cone images, it appears that the variability of
cone-to-cone brightness is in fact greater at the foveal center than elsewhere in the mosaic.
The presence of these variations is one more reason why adding images taken over time
might help in resolving the entire foveal cone mosaic.
The model in this paper is specific for simulating images of the cone mosaic. How the
coherence of light will affect other structures is not modeled, but is worth consideration here.
Whenever an object being imaged consists of randomly arranged scatterers throughout its
volume, then speckle in AOSLO images is inevitable. This applies to almost every other
retinal structure including the retinal pigment epithelial cells, blood cells, ganglion cells and
their axons which comprise the nerve fiber layer. To illustrate this point, Fig. 10 shows an
image of a model eye taken with coherent and low coherent light. In the model eye, the optic
is a 100 mm focal length achromat and the „retina‟ is a simple sheet of clear white paper
mounted at the lens focal point. Both images are nearly identical, and comprise very high
contrast features which are evidence of interference artifacts. As expected, scattering
structures in the paper fall within the coherence length of both light sources and the image
taken with low coherent light only shows a slight reduction in speckle contrast.
Fig. 10. Registered sums of 150 frames from an AOSLO video of a model eye with a paper
retina. The left image is taken with a coherent laser diode (660 nm) and the right image is with
a low-coherent superluminescent diode (680 nm). In both cases, there are high contrast
interference artifacts in the image, with only a slight reduction in its contrast from the SLD.
Finally, other practical considerations need to be taken into account in the effort to resolve
foveal cones and are described briefly here:
Temporal Frequencies: Owing to the scanning nature of the image, the AOSLO image is
generated by decoding a temporally modulated signal. Cones in the foveal center have the
highest density and therefore generate the highest temporal frequencies - upwards of 5MHz -
depending on the actual scan frequency and image field size. The temporal response of the
entire electronics train needs to pass this signal.
Correcting for Eye Motion: Ever-present eye motions generate unique distortions in
each AOSLO frame. Correction for these requires intra-frame removal of the distortions, and
needs to be done with sufficient accuracy so that registered sums of frames from one or more
videos will not reduce the contrast of the details in the image. This is especially important for
features near the resolution limit. Our corrections are done with custom developed software
[5,39].
Pixel Sampling and Scanner Nonlinearities: Most AOSLO systems use resonant
scanners for the fast scanning axis in order to achieve high frame rates with sufficient
#133434 - $15.00 USD Received 17 Aug 2010; revised 13 Oct 2010; accepted 22 Oct 2010; published 15 Nov 2010(C) 2010 OSA 22 November 2010 / Vol. 18, No. 24 / OPTICS EXPRESS 24915
sampling within each frame. A downside of the resonant scanners is that they scan in a
sinusoidal fashion and therefore do not sample the scanned field with the same frequency
throughout. With a fixed frequency pixel clock, the center of the field for which the scanner is
moving fastest, is sampled less frequently then the edges. The design of the AOSLO needs to
be set so that the sampling frequency at the center of the field is sufficient for foveal cones.
Focus Adjustment: While the depth of focus is typically around 60 microns for AOSLO
imaging, precise focus adjustments can be made in steps of 0.05D, which correspond to
approximately 20 microns in depth at the retina. When imaging the foveola, the defocus is
adjusted to optimize the visibility of the smallest cones. This focus will be slightly different
than what is required to provide the best focus of neighboring cones since the ELM tends to
be slightly elevated at the foveola. The elevation is approximately 25 microns, which
corresponds to a defocus shift of ~0.06D [34]. As a result it is important to consider the
defocus position carefully and make adjustments to optimize the visibility of the smallest
cones, especially when imaging the foveal region.
Anisoplanatism: It is possible that topography of the inner retina at the foveal pit could
introduce anisoplanatism across the AOSLO field. If this was the case, then the average
wavefront across the field, which is what the AO system in a typical AOSLO uses to correct
the wavefront, would be compromised everywhere and may limit the quality of the optical
correction. The refraction of light along the slope of the pit is about 1 degree [40]. Owing to
the narrowness of the scanning beam at the retinal surface, we expect that any aberrations
introduced due to anisoplanatism will have a negligible effect on the overall aberrations
observed. Other studies have shown that the isoplanatic patch size at the fovea is 0.81 degrees
on average [41], which is the field size we use for foveal imaging.
5. Conclusions
Developing a better understanding of the limits of AOSLO systems that use low-coherence
light sources is an essential step on the path toward recording the highest fidelity images of
the retina. This paper carefully models the process of AOSLO imaging of foveal cones, taking
into account the nature of the light source as well as the unique structure of the cones and the
way they pack into a mosaic, particularly cones in the foveal center. Our simulations compare
well with actual images recorded in our system, lending support to the notion that interference
artifacts impose limits on our ability to resolve cones in the foveal center. The model has also
led to new ideas on potential ways to overcome these limits.
Acknowledgments
The authors would like to thank Joe Carroll for the cone coordinates used in the model. This
work has been supported by the National Institute of Health grants NIH EY014375 and NIH
EY018986, the National Science Foundation grant NSF AST9876783, AF contract FA8650-
05-C-6552, and the AOF Ezell Fellowship.
#133434 - $15.00 USD Received 17 Aug 2010; revised 13 Oct 2010; accepted 22 Oct 2010; published 15 Nov 2010(C) 2010 OSA 22 November 2010 / Vol. 18, No. 24 / OPTICS EXPRESS 24916