26
Modeling the New 1- Hour Nitrogen Dioxide (NO 2 ) and Sulfur Dioxide (SO 2 ) NAAQS Alan Dresser Research Scientist I October 14, 2011
| Date post: | 15-Dec-2015 |
| Category: |
Documents |
| Upload: | paxton-owens |
| View: | 214 times |
| Download: | 0 times |

Modeling the New 1-Hour Nitrogen Dioxide (NO2) and Sulfur Dioxide (SO2)
NAAQS
Alan DresserResearch Scientist I
October 14, 2011

Overview of New NO2 NAAQS
1-hr NO2 = 100 ppb (189 ug/m3)
Effective on April 12, 2010
Based on 98th percentile of annual distribution of daily max. 1-hour values
Current NJ 1-Hour Background Levels:
37% to 67% of NAAQS

NO2 1-Hour Modeling
EPA Guidance Memos of June 28, 2010 and March 1, 2011:
Interim SIL (7.5 ug/m3)
3-Tiered NO to NO2 conversion approach
Treatment of intermittent emissions (limits modeling of start-up/shutdown, emergency equipment)

NO2 1-Hour Modeling
NJDEP Guidance:
Interim SIL of 10 ug/m3 (NESCAUM)
July 29, 2011 memo – Emergency generator and fire pump exemptions from modeling 1-hour NO2/SO2 impacts
(specific to combined-cycle plants, case- by-case for others)
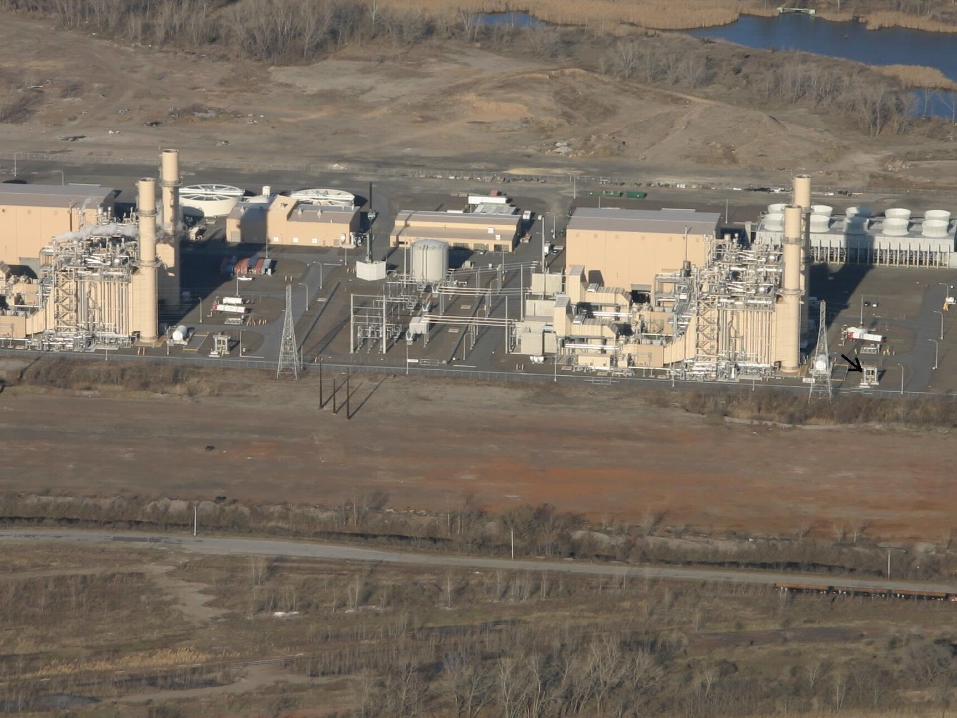
Example of 1-Hour NO2 Modeling
LS Power West Deptford Station
600 MW Combined-Cycle Plant
Natural gas with 0.05% sulfur oil backup
Modeled before EPA and NJDEP guidance memos (intermittent sources; emergency generator/fire pumps)
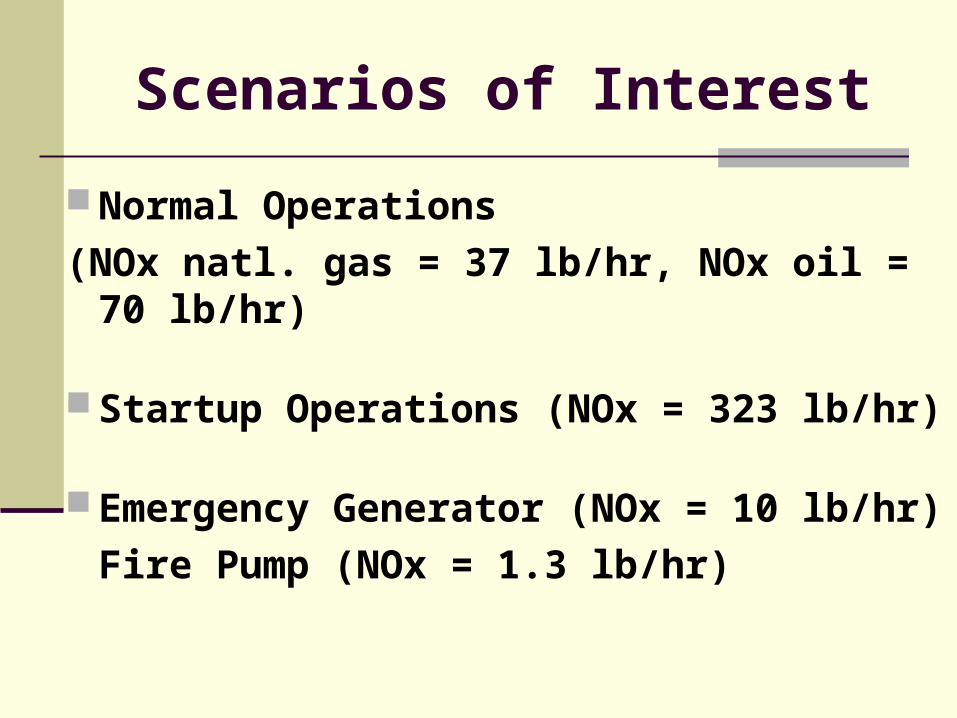
Scenarios of Interest
Normal Operations
(NOx natl. gas = 37 lb/hr, NOx oil = 70 lb/hr)
Startup Operations (NOx = 323 lb/hr)
Emergency Generator (NOx = 10 lb/hr)
Fire Pump (NOx = 1.3 lb/hr)

1-Hour NO2 Impacts(Highest 98th percentile / 8th high concentration)
Normal Operations (70 lbs/hr, oil) = 8.1 ug/m3
Startup Operations (323 lbs/hr) = 42 ug/m3
Emergency Equipment(11.3 lbs/hr) = 43 ug/m3
(no testing during turbine startup/shutdown)
(1-hour NO2 NAAQS = 189 ug/m3)

Lesson : Smaller sources with short stacks and transitional scenarios at large facilities can cause big 1-hr NO2 impacts!

Overview of New SO2 NAAQS
1-hr SO2 = 75 ppb (196 ug/m3)
Effective on August 23, 2010
Based on 99th percentile of annual distribution of daily max. 1-hour values
Current NJ 1-Hour Background Levels:
18% - 47% of NAAQS

SO2 1-Hour Modeling
August 23, 2010 EPA Guidance Memos:
Suggested interim SIL (7.8 ug/m3)
Methods of demonstrating NAAQS compliance, calculating background, etc.
24-hour and annual SO2 NAAQS revoked
Intermittent emissions not as important as with NO2

Example of 1-Hour SO2 Modeling
Portland Power Plant
Coal-fired Unit 1 – 160 MW / 1958 Unit 2 – 240 MW / 1962
No existing emission controls for SO2
Average 2007 – 2010 annual emissions of 29,067 tons


1-Hour SO2 Modeling Conducted with Two EPA Models
1. AERMOD (guideline model)
2. CALPUFF (complex terrain model)
Designed for locations with complex wind fields
Must conduct a model validation showing it performs better for the given application than EPA’s guideline model
(see June 2011 JAWM article)

CALPUFF – Allowable Emissions
Max. Impact 1.4 times over 3-hr NAAQS
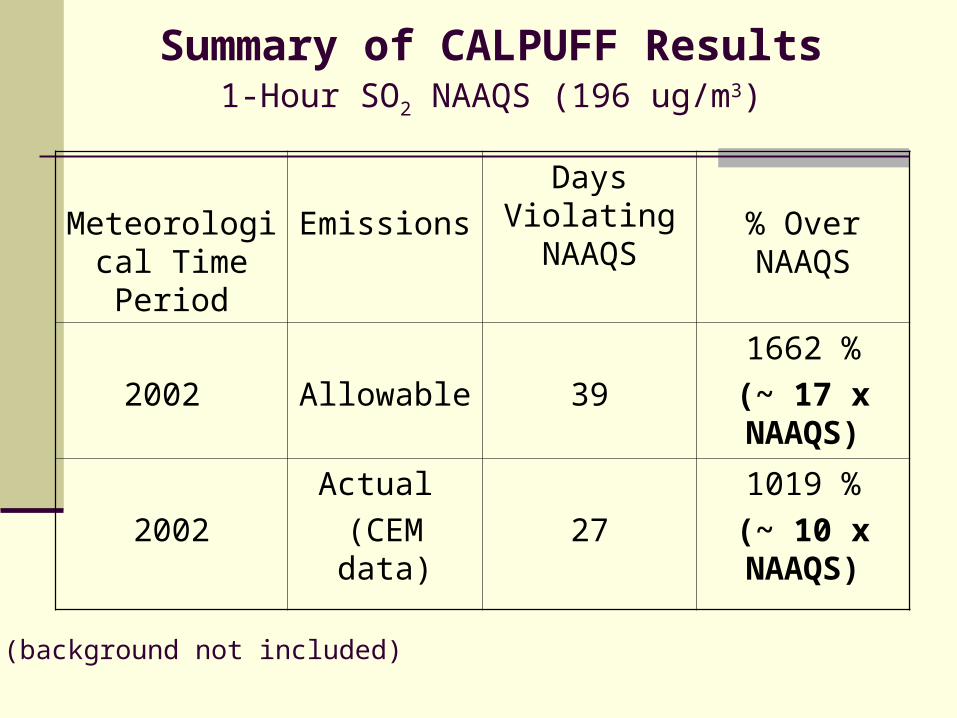
Summary of CALPUFF Results 1-Hour SO2 NAAQS (196 ug/m3)
Meteorological Time Period
Emissions
Days Violating NAAQS
% Over NAAQS
2002 Allowable 39
1662 %
(~ 17 x NAAQS)
2002
Actual
(CEM data) 27
1019 %
(~ 10 x NAAQS)
(background not included)

M
m

Summary of AERMOD Results 1-Hour SO2 NAAQS (196 ug/m3)
Meteorological Time Period
Emissions
Days Violating NAAQS
% Over NAAQS
1993-94 Allowable 42
615 %
(~ 6 x NAAQS)
1993-94
Actual
(avg. monthly) 5
138 %
(~ 1.4 x NAAQS)
(No predicted violations of the 3-hour or 24-hour NAAQS,
background not included)


Columbia Lake SO2 Monitor
Data collected at Columbia Lake Monitor since Sept. 23, 2010
31 exceedances of the 1-hour SO2 NAAQS of 75 ppb (196 ug/m3) recorded since Sept. 23, 2010
Monitor located where both models predicted high impacts but not maximum


Columbia Lake - Sept. 23, 2010 to Sept. 15, 2011
1-Hour SO2 Modeling Conclusions
SO2 1-Hour NAAQS is much more easily violated than the 3 and 24-Hour NAAQS
Columbia Lake monitoring confirms both CALPUFF and AERMOD predictions of 1-hour NAAQS violation at that location
Principal sources of concern are older, large sources burning No. 6 oil or coal
(especially after Sub. 9 Sulfur in Fuel Rule)


