+ All Categories
Home > Documents > Modeling the profitability of power production from short ... the profitability of power production...

Modeling the profitability of power production from short ... the profitability of power production...

Date post: 11-Mar-2018
Category:
Upload: phungkien
View: 215 times
Download: 2 times
Share this document with a friend
12
Modeling the profitability of power production from short-rotation woody crops in Sub-Saharan Africa Thomas Buchholz a, *, Timm Tennigkeit b , Axel Weinreich b , Kai Windhorst b , Izael DaSilva c a Gund Institute for Ecological Economics, University of Vermont, 617 Main Street, Burlington, VT 05405, USA b UNIQUE Forestry and Land Use GmbH, Schnewlinstraße 10, 79098 Freiburg, Germany c Centre of Excellence in Renewable Energy and Sustainable Development (CERESD), Strathmore University, Madaraka Estate, Ole Sangale Road, PO Box 59857, 00200 City Square, Nairobi, Kenya article info Article history: Received 19 January 2012 Received in revised form 27 November 2012 Accepted 28 November 2012 Available online xxx Keywords: Bioenergy Electric power production Short-rotation woody crops Sub-Saharan Africa Economics Biomass abstract Increasing electricity supply in Sub-Saharan Africa is a prerequisite to enable economic development and reduce poverty. Renewable sources such as wood-fueled power plants are being promoted for social, environmental and economic reasons. We analyzed an economic model of a vertically integrated system of short-rotation woody crops (SRWC) plantations coupled with a combined heat and power (CHP) plant under Sub-Saharan African conditions. We analyzed a 5 MW (electric) base-case scenario under Ugandan conditions with a 2870 ha Eucalyptus grandis plantation and a productivity of 12 t ha 1 y 1 (oven dry basis) under a 5-year rotation. Plant construction and maintenance constituted 27% and 41% of total costs, respectively. Plantation productivity, carbon credit sales as well as land, fuel, labor & transport costs played an economic minor role. Highly influential variables included plant efficiency & construction costs, plantation design (spacing and rotation length) and harvest technologies. We conclude that growing 12e24 t ha 1 y 1 at a five year rotation can produce IRR’s of 16 and 19% over 30-years, respectively. Reducing rotation length significantly reduced short-term financial risk related to frontloaded costs and relatively late revenues from electricity sales. Long-term feed-in tariffs and availability of a heat market played a significant economic role. The base-case scenario’s 30-year IRR dropped from 16% to 9% when a heat market was absent. Results suggest a leveling-off of economies-of-scale effects above 20 MW (electric) installations. Implementation-related research needs for pilot activities should focus on SRWC productivity and energy life cycle analysis. ª 2012 Elsevier Ltd. All rights reserved. 1. Introduction Sub-Saharan Africa currently faces a major electricity shortage. Regionally, only 20% of the population of Sub- Saharan Africa has access to electricity [1]. Without access to electricity it is difficult to attain the Millennium Development Goals on poverty reduction and environmental sustainability [2]. Over 75% of the electricity produced in Sub-Saharan Africa is derived from coal or oil, with the share of renewables declining in the region [1]. In 2007, more than 50% or 200 MW of the power in Uganda was produced by emergency thermal generators with tariffs as high as 0.2 V kWh 1 and large carbon footprints [3]. Considering that 77% of Ugandans live in rural areas [4] and that these are in particular underserved with * Corresponding author. Tel.: þ1 802 881 5590. E-mail address: [email protected] (T. Buchholz). Available online at www.sciencedirect.com http://www.elsevier.com/locate/biombioe biomass and bioenergy xxx (2012) 1 e12 Please cite this article in press as: Buchholz T, et al., Modeling the profitability of power production from short-rotation woody crops in Sub-Saharan Africa, Biomass and Bioenergy (2012), http://dx.doi.org/10.1016/j.biombioe.2012.11.027 0961-9534/$ e see front matter ª 2012 Elsevier Ltd. All rights reserved. http://dx.doi.org/10.1016/j.biombioe.2012.11.027
Transcript

ww.sciencedirect.com

b i om a s s a n d b i o e n e r g y x x x ( 2 0 1 2 ) 1e1 2

Available online at w

http: / /www.elsevier .com/locate/biombioe

Modeling the profitability of power production fromshort-rotation woody crops in Sub-Saharan Africa

Thomas Buchholz a,*, Timm Tennigkeit b, Axel Weinreich b, Kai Windhorst b, Izael DaSilva c

aGund Institute for Ecological Economics, University of Vermont, 617 Main Street, Burlington, VT 05405, USAbUNIQUE Forestry and Land Use GmbH, Schnewlinstraße 10, 79098 Freiburg, GermanycCentre of Excellence in Renewable Energy and Sustainable Development (CERESD), Strathmore University, Madaraka Estate, Ole Sangale

Road, PO Box 59857, 00200 City Square, Nairobi, Kenya

a r t i c l e i n f o

Article history:

Received 19 January 2012

Received in revised form

27 November 2012

Accepted 28 November 2012

Available online xxx

Keywords:

Bioenergy

Electric power production

Short-rotation woody crops

Sub-Saharan Africa

Economics

Biomass

* Corresponding author. Tel.: þ1 802 881 559E-mail address: [email protected]

Please cite this article in press as: Buchhocrops in Sub-Saharan Africa, Biomass an

0961-9534/$ e see front matter ª 2012 Elsevhttp://dx.doi.org/10.1016/j.biombioe.2012.11.

a b s t r a c t

Increasing electricity supply in Sub-Saharan Africa is a prerequisite to enable economic

development and reduce poverty. Renewable sources such as wood-fueled power plants

are being promoted for social, environmental and economic reasons. We analyzed an

economic model of a vertically integrated system of short-rotation woody crops (SRWC)

plantations coupled with a combined heat and power (CHP) plant under Sub-Saharan

African conditions. We analyzed a 5 MW (electric) base-case scenario under Ugandan

conditions with a 2870 ha Eucalyptus grandis plantation and a productivity of 12 t ha�1 y�1

(oven dry basis) under a 5-year rotation. Plant construction and maintenance constituted

27% and 41% of total costs, respectively. Plantation productivity, carbon credit sales as well

as land, fuel, labor & transport costs played an economic minor role. Highly influential

variables included plant efficiency & construction costs, plantation design (spacing and

rotation length) and harvest technologies. We conclude that growing 12e24 t ha�1 y�1 at

a five year rotation can produce IRR’s of 16 and 19% over 30-years, respectively. Reducing

rotation length significantly reduced short-term financial risk related to frontloaded costs

and relatively late revenues from electricity sales. Long-term feed-in tariffs and availability

of a heat market played a significant economic role. The base-case scenario’s 30-year IRR

dropped from 16% to 9% when a heat market was absent. Results suggest a leveling-off of

economies-of-scale effects above 20 MW (electric) installations. Implementation-related

research needs for pilot activities should focus on SRWC productivity and energy life

cycle analysis.

ª 2012 Elsevier Ltd. All rights reserved.

1. Introduction

Sub-Saharan Africa currently faces a major electricity

shortage. Regionally, only 20% of the population of Sub-

Saharan Africa has access to electricity [1]. Without access to

electricity it is difficult to attain the Millennium Development

Goals on poverty reduction and environmental sustainability

0.du (T. Buchholz).

lz T, et al., Modeling thed Bioenergy (2012), http

ier Ltd. All rights reserved027

[2]. Over 75% of the electricity produced in Sub-Saharan Africa

is derived from coal or oil, with the share of renewables

declining in the region [1]. In 2007,more than 50%or 200MWof

the power in Uganda was produced by emergency thermal

generatorswith tariffs as high as 0.2V kWh�1 and large carbon

footprints [3]. Considering that 77% of Ugandans live in rural

areas [4] and that these are in particular underserved with

profitability of power production from short-rotation woody://dx.doi.org/10.1016/j.biombioe.2012.11.027

.

b i om a s s a n d b i o e n e r g y x x x ( 2 0 1 2 ) 1e1 22

energy, i.e. less than 9% of the rural population had access to

electricity [5] there is a strong need to increase renewable

electricity production in rural centers.

Electricity production from biomass has a potential to

improve human well-being by delivering energy on a long-

term sustainable basis more efficiently than other sources of

energy (Banerjee for India [6]; Buchholz and Da Silva for

Uganda [7]). Woody-biomass based power plants ranging from

a few kW to 50 MW are being investigated across the region

(see Buchholz andVolk [8] or Buchholz et al. [9] for small-scale;

Buchholz et al. [3] for large-scale). Most of these systems rely

on fast-growing tree plantations or short-rotation woody

crop (SRWC) systems where trees or shrubs are planted that

have the ability to coppice and do not need to be replanted

after a harvest. While many tree and shrub species exhibit

coppicing abilities, Eucalyptus spp. has been widely used in

commercial SRWC systems most notably for charcoal

production in Brazil with over 45,000 km2 of Eucalyptus bio-

energy plantations in 2009 [10] or tea drying in Sub-Saharan

Africa [8]. Historically, these systems applied rotation cycles

of >5 years while more recent research investigates shorter

rotation cycles due to increased harvest mechanization and

improved planting stock [11].

Power systems based onwoody-biomass such as SRWC are

characterized by low material, energy and labor input,

yielding energy returns on investment (EROI) between 43:1 [12]

and 58:1 [13] at the plantation gate or 11:1 [14] for producing

electricity. Pimentel et al. [15] reported of an EROI of 7:1 for

a biomass power plant in the US sourcing wood from natural

forests. Zanchi et al. [[16]] found SRWC-based gasifiers

producing electricity to be advantageous in material and

energy input compared with fossil-fuel based alternatives in

Uganda. At the same time, decision frameworks to mitigate

potential negative ecological and social impacts of such

bioelectricity systems are being developed for the region

[17,18].

However, economic studies on medium- to large-scale

wood-based power systems are rare for the region. Several

studies analyzed the economics at the small-scale power

plant level [7e9]. Uncertainties on sustainably produced wood

supply require vertically integrated business models with

integrated feedstock production and power plant. A compre-

hensive economic analysis of the basic production schemes

for SRWC-based power production in different tropical and

sub-tropical regions or under various price structures is rare

(van den Broek et al. for Nicaragua [19], Sims et al. [20] for New

Zealand). We understand such a comprehensive economic

analysis should at least consider components such as plan-

tation economics, power plant engineering, and carbon

finance. Other aspects such as viable energy distribution

related business models and support policies should be

investigated to attract investment, but this was not part of our

investigation.

We modeled the economic performance of wood-derived

electricity and heat production under various economic,

biophysical, and management conditions using the Power-

Forest 1.1 (Beta) model [21]. While the analytical framework

can be applied to any dedicated woody feedstock plantations,

we used Eucalyptus grandis in our case study since this species

is widely used in Uganda and more local information on

Please cite this article in press as: Buchholz T, et al., Modeling thecrops in Sub-Saharan Africa, Biomass and Bioenergy (2012), http

growth characteristics and plantation management is avail-

able compared to other potential tree species. Our simulation

covered establishment, maintenance, harvest, transport of

wood and electricity and heat production from SRWC systems

under African conditions. We analyzed various site and

spacing specific growth curves, treatments, and rotation

lengths. Energy conversion technology varies little by region

therefore our analysis focused on the biomass production part

characterized by high variability while standard assumptions

have been used for energy conversion and CDM AR related

costs and revenues. The objectives of this simulation were:

➢ To identify the significance of SRWC economics within

a vertically integrated business model incorporating

plantation economics as well as power plant construc-

tion and maintenance costs representative for Sub-

Saharan Africa;

➢ To identify the cost factors that have the greatest

potential for improving the overall economics of

a SRWC-based bioelectricity project.

2. Methods

2.1. Model description

Our model was designed for tree plantations using a coppice

management system and subsequent conversion of biomass

to electricity and usable heat. It analyzed the entire produc-

tion chain from plantation establishment, maintenance, and

harvest to the transport and storage of the biomass and

energy production.

General input variables included total electricity output

and conversion efficiency, inclusion of heat sales and carbon

finance, project development and termination costs as well as

skill-specific labor costs. Key variables for each of the biomass

production modules (plantation establishment, maintenance,

choice of harvest system, biomass transport, energy conver-

sion, carbon finance) included incentive payments such as

establishment grants and yearly rental payments in case of

a land lease scenario.

We developed a species-, site- and rotation length-specific

growthmodel that specified biomass growth, heating value, as

well as the plantation design jointly with harvest productivity

assumptions which are largely guided by plantation charac-

teristics such as planting density and tree dimensions. We

implied a continuous productivity throughout the plantation

lifetime with no replanting requirements and changes in

rotation length. Plantation establishment variables included

site preparation such as clearing and road construction, per

unit seedling costs and a manual planting system. Plantation

maintenance cost variables covered pest control, inventory-

related tasks, as well as labor, travel, equipment, and other

supply costs. Establishment of the plantation was staggered

over the rotation length of choice; for a 5-year rotation period

only one-fifth of the total plantation area required was

established in the first year with the remainder planted in

the subsequent years until the full plantation is fully estab-

lished. While initial and annual land costs will occur for the

full plantation area starting with year one, plantation

profitability of power production from short-rotation woody://dx.doi.org/10.1016/j.biombioe.2012.11.027

b i om a s s a n d b i o e n e r g y x x x ( 2 0 1 2 ) 1e1 2 3

maintenance costs will increase in accordance with the

progress in plantation establishment. As it is common prac-

tice on existing commercial SRWC plantations in Uganda, the

maintenance module included costs associated with cutting

back coppicing stems to one per stump for the manual and

mechanized single-grip harvesting system (Fig. 1). This

procedure maximizes diameter development while reducing

stem density.

Three different plantation harvest systems were consid-

ered representative for tropical SRWC plantations:

➢ Manual felling, debranching, and cutting to length fol-

lowed by carrying log segments manually to and stack-

ing them at a skidding trail (each work step done by

a separate laborer). A knuckle boom grab loads stems on

roadworthy trailers; the wood is stacked and air-dried

for two months at the power plant prior to being chip-

ped and combusted;

➢ A single-grip harvester cuts, debranches and cuts stems

to length, followed by mechanized skidding and loading

of logs on roadworthy trailers; the wood is stacked and

air-dried for two months at the power plant prior to

being chipped and combusted;

➢ A track-mounted combined cut and chip harvester

blows chips into roadworthy trailers; the chips air-dried

for two months at the power plant prior to being

combusted.

For the manual and single-grip harvester units, only log

segments up to a top diameter of 5 cm were considered for

extraction. Tops, branches, and leaves would be left on the

ground to reduce soil nutrient depletion [22].

While efficiencies of each system relied on plantation

characteristics (planting density, tree dimensions), they were

not necessarily applicable at the same time. For instance, the

combined cut and chip harvester might not be able to cut

large-dimensioned trees. These assumptions are based on

a project design where short transport distances keep trans-

port with smaller and field-worthy trailers economically

Fig. 1 e 1.5 year old Eucalyptus grandis bioenergy coppice in

Western Uganda. The SRWC system supplies biomass to

a tea drying facility.

Please cite this article in press as: Buchholz T, et al., Modeling thecrops in Sub-Saharan Africa, Biomass and Bioenergy (2012), http

feasible and field conditions allow broad access by such

trailers (no steep slopes, improved skidding trails etc.). For

each harvest system, we modeled the appropriate hauling

costs of logs or chips based on labor and equipment variables.

The number of tractors and trailers was calculated based on

the biomass harvest speed and plant consumption rate. The

hauling distance was modeled on the assumption that the

power plant is centrally located in the plantation but longer

hauling distances were simulated as well. Machine costs for

the harvest, transport, and bioenergy conversionmodulewere

based on a per unit basis with a depreciation period of five

years. Loading and unloading of trailers are included in

harvest and bioenergy production costs and not part of the

transport costs.

The size of the biomass storage area was calculated based

on a two month supply of logs or chips to secure steady

operation and a 20% moisture reduction (on a wet basis)

independent of the time of the year [20,23]. We further

considered capital and maintenance requirements for the

woodyard and a combined heat and power or power-only

plant, as well as internal electricity needs, capacity factor,

labor requirements and options for plant site purchase or

rental. Construction of the power plant was timed to start two

years prior to the first harvest with two thirds of the costs

occurring in the first year of construction and the remaining

one-third occurring in the second and last year of

construction.

We analyzed revenues from the sale of temporary

Certified Emission Reductions (tCERs) providing a 20-year

carbon sequestration commitment. Due to the high variability

in carbon assessment schemes, we applied a very basic

calculation only and did not consider carbon accounting

methodology-specific eligibility criteria. Potential carbon

credits from fuel-switch activities replacing fossil-fuel have

not been considered since reliable data was not available.

We used the pre-tax Internal Rate of Return (IRR) and Net

Present Value (NPV) for a project life of 10-, 20- and 30-years as

economic performance indicators besides various figures on

production costs, revenues, earnings, and profits on a unit and

area basis. Further output numbers included total permanent

positions created and startup costs required (including all

costs up until electricity is produced for the first time). We

modeled a best-case scenario based on a 10% increase in

revenues and a 10% decrease in costs as well as a worst-case

scenario including a 10% decrease in revenues and a 10%

increase in costs.

2.2. Base-case scenario

The base-case was modeled on a 5 MW (electric) combined

heat and power case study in Uganda (Table 1). We assumed

a purchase of the required land for both the plantation and

plant site. The plantation design was based on a 5-year rota-

tion cycle using Eucalyptus grandis with a productivity of

12.2 t ha�1 y�1 (Table 2). Logs would be manually felled and

then chipped at the plant site. Costs used in the base-case

scenario for standard plantation operations such as herbi-

cide applications and plowing and disking are based on 2011

rates for Uganda. While revenue from the liquidation (sale of

land at purchase price only) at the end of the project lifetime

profitability of power production from short-rotation woody://dx.doi.org/10.1016/j.biombioe.2012.11.027

Table 1 e Selected input variables used for the base-case scenario. For details on the plantation growthmodel and harvestproductivity see Table 3. For an exhaustive list of input variables see Supporting information Tables S1e7.

Variable description Unit Values

General variables Unskilled labor V y�1 675

Skilled labor V y�1 5400e10,800

Management V y�1 32,000e48,000

Indirect labor costs % of direct labor costs 35%

Plantation Plantation size (incl. roads etc.) ha 2870

Rotation length Y 5

Land cost V ha�1 300

Planting stock costs per seedling V 0.05

Fertilization per rotation V ha�1 110

Roads (and fire strips) m ha�1 10 (90)

Road construction costs V m�1 16

Harvest Manual harvest e see Table 3 for details

Transport Transport distance km 3

Harvest and transport losses 5%

Fuel consumption km L�1 4

Fuel price V L�1 1.0

Tractor-trailer costs (three trailers per tractor) V km�1 2.0

Max. trailer capacity m3 (t) 40 (30)

Bioenergy production Net electric (heat) output MW 5.0 (9.9)

Electric (heat) conversion efficiency 30% (60%)

Capacity factor 85%

Lower heating value at time of

combustion (30% moisture content)

MWh t�1 4.4

Electric power capital cost V MW�1 2,500,000

Heat recovery capital cost V MW�1 500,000

Woodyard equipment V 540,000

Biomass storage losses Logs/chips 1%/3%

Electricity (heat) tariff V MWh�1 100 (35)

Carbon finance Price per t of carbon dioxide equivalent V 5

Initial carbon assessment costs V 100,000

Carbon monitoring costs V (every 5 years) 10,000

Table 2 e Input variables analyzed on their impact onoverall project profitability. Ranges show the inputnumbers used for the sensitivity analysis.

Variables Unit Range

General

Biomass yield t ha�1 y�1 1.1e26

Harvest costs Dependent on stand

conditions, see Table 3

Rotation length y 1e5

Planting density Plants ha�1 1588e10,000

Establishment

grants

% of total

establishment costs

50%e100%

Tariffs electricity V MWh�1 70e130

Tariffs heat V MWh�1 0e40

Electric capacity MW 1e50

Electric conversion

efficiency

20%e40%

Land costs V ha�1 300 � 30%;

purchase vs. lease

Fuel costs V L�1 1 � 30%

Labor costs �30%

Transport distance km 2e50

Carbon price V per of t carbon

dioxide equivalent

0e30

b i om a s s a n d b i o e n e r g y x x x ( 2 0 1 2 ) 1e1 24

Please cite this article in press as: Buchholz T, et al., Modeling thecrops in Sub-Saharan Africa, Biomass and Bioenergy (2012), http

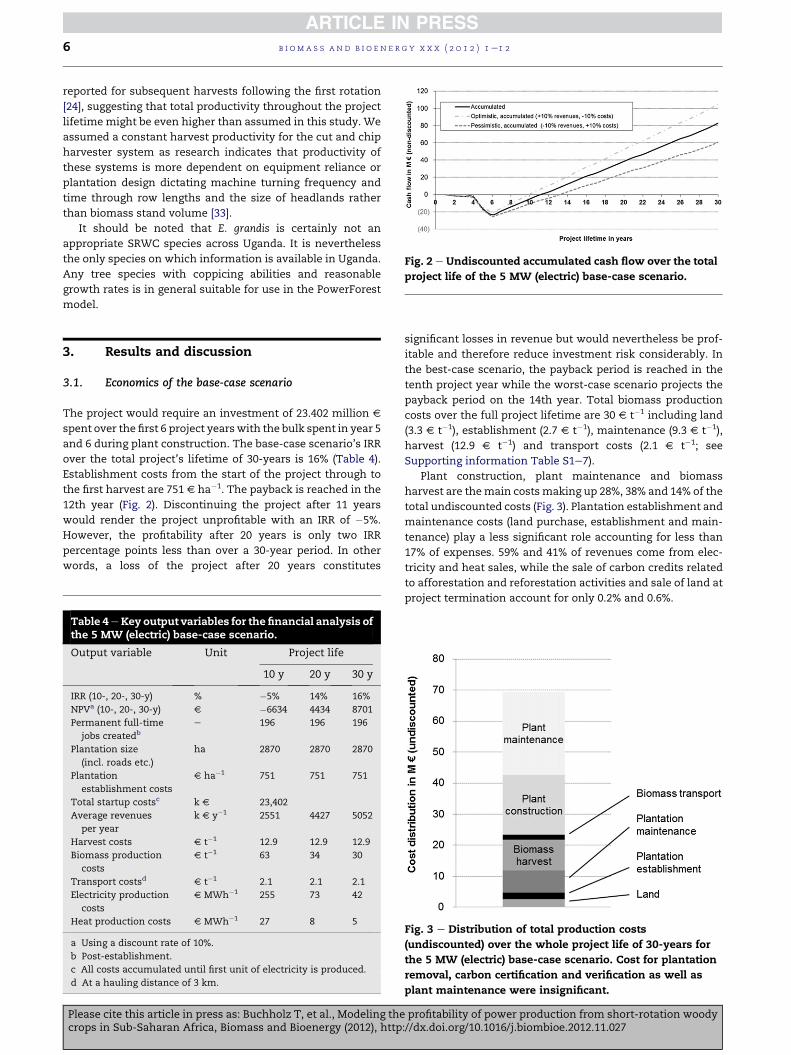
was considered in the base-case scenario, plantation removal

costs were not considered. The power plant would start

producing electricity in the 7th project year coinciding with

the first biomass harvest and would produce power for 24

years. Table 3 lists variables that were adjusted in regard to

the base-case scenario to perform an economic sensitivity

analysis.

Table 2 outlines growth assumptions for E. grandis for three

site productivities based on growth models developed for

Uganda [28]. The goal of this growth model, which only

considers stem biomass (see Section 2.1), was to maximize

volume production (rather than tree diameter) based on

a given rotation length. The planting density was optimized

towards a density index of 75% when competition for light

starts and self-thinning sets in at the end of the rotation

period. Optimal planting densities reported for Eucalyptus spp.

range from 2000 [24] to 5000 ha�1 [25] for 2e5 year rotations,

while trials include densities as high as 40,000 plants ha�1 [26].

We analyzed site productivities corresponding to dominant

tree heights or a site index (SI) of 25, 30, and 35 m at an age of

10 years. Themean annual productivity peaks in year 3, 4, and

year 6 at a SI of 35, 30, and 25, respectively, which corresponds

to findings of Stape et al. [11] on Eucalyptus spp. plantations in

Brazil. We assumed validity of the growth model beyond the

first rotation as coppice shoots were trimmed to one per

stump (see Section 2.1) for all harvest systems except the cut

and chip harvester system. Increased productivity has been

profitability of power production from short-rotation woody://dx.doi.org/10.1016/j.biombioe.2012.11.027

Table 3 e Plantation growth model and harvest system productivity for Eucalyptus grandis for a site index (SI) of 25, 30 and 35 based on Alder [27]. Harvest systems aredescribed in Section 2.1; ‘n/a’ indicates that a given harvest system is not suited for the specific plantation characteristics.

Plantation growth model Harvest productivity

Rotationlength, y

Productivitya,t ha�1 y�1

Total biomassstanding, t ha�1

Planting density,plants ha�1

DBHb atharvest, cm

Dominant heightat harvest, m

Cut and chipharvest, h ha�1

Single-grip harvesttrees, h�1

Manual harvest,c

trees h�1 person�1

SI 25

(base-case

scenario)

1 1.1 1.1 10,000 1.3 4.2 0.9 n/a n/a

2 8.1 16.2 9323 4.0 8.6 0.9 n/a 45

3 10.8 32.3 5441 6.4 12.1 0.9 n/a 40

4 11.8 47.3 3901 8.3 14.8 n/a n/a 40

5 12.2 61.0 3091 10.0 17.2 n/a 80 35

SI 30 1 5.3 5.3 10,000 2.5 6.1 0.9 n/a n/a

2 14.8 29.7 5829 6.0 11.6 0.9 n/a 40

3 17.2 51.7 3597 8.9 15.6 0.9 n/a 35

4 17.8 71.2 2669 11.1 18.8 n/a 80 30

5 17.7 88.6 2166 13.0 21.4 n/a 80 25

SI 35 1 15.8 15.8 9476 8.5 3.9 0.9 n/a 45

2 24.3 48.5 3813 15.1 8.5 n/a 80 35

3 25.6 76.7 2487 19.6 11.7 n/a 80 30

4 25.1 100.5 1911 23.1 14.2 n/a 75 20

5 24.2 120.8 1588 26.0 16.2 n/a 70 20

a Mean annual productivity considering only stem biomass to a top diameter of 5 cm (except one year rotation).

b Diameter at breast height (1.3 m).

c Using a chainsaw or brushcutter; including felling, debranching and cutting to length.

bio

mass

and

bio

energy

xxx

(2012)1e12

5

Please

citeth

isarticle

inpress

as:B

uch

holz

T,e

tal.,M

odelin

gth

epro

fitability

ofpowerpro

ductio

nfro

msh

ort-ro

tatio

nwoody

cropsin

Sub-SaharanAfrica

,Biom

ass

andBioenergy(2012),http

://dx.doi.o

rg/10.1016/j.b

iombioe.2012.11.027

Fig. 2 e Undiscounted accumulated cash flow over the total

project life of the 5 MW (electric) base-case scenario.

b i om a s s a n d b i o e n e r g y x x x ( 2 0 1 2 ) 1e1 26

reported for subsequent harvests following the first rotation

[24], suggesting that total productivity throughout the project

lifetimemight be even higher than assumed in this study. We

assumed a constant harvest productivity for the cut and chip

harvester system as research indicates that productivity of

these systems is more dependent on equipment reliance or

plantation design dictating machine turning frequency and

time through row lengths and the size of headlands rather

than biomass stand volume [33].

It should be noted that E. grandis is certainly not an

appropriate SRWC species across Uganda. It is nevertheless

the only species on which information is available in Uganda.

Any tree species with coppicing abilities and reasonable

growth rates is in general suitable for use in the PowerForest

model.

3. Results and discussion

3.1. Economics of the base-case scenario

The project would require an investment of 23.402 million V

spent over the first 6 project yearswith the bulk spent in year 5

and 6 during plant construction. The base-case scenario’s IRR

over the total project’s lifetime of 30-years is 16% (Table 4).

Establishment costs from the start of the project through to

the first harvest are 751 V ha�1. The payback is reached in the

12th year (Fig. 2). Discontinuing the project after 11 years

would render the project unprofitable with an IRR of �5%.

However, the profitability after 20 years is only two IRR

percentage points less than over a 30-year period. In other

words, a loss of the project after 20 years constitutes

Table 4eKey output variables for the financial analysis ofthe 5 MW (electric) base-case scenario.

Output variable Unit Project life

10 y 20 y 30 y

IRR (10-, 20-, 30-y) % �5% 14% 16%

NPVa (10-, 20-, 30-y) V �6634 4434 8701

Permanent full-time

jobs createdb

e 196 196 196

Plantation size

(incl. roads etc.)

ha 2870 2870 2870

Plantation

establishment costs

V ha�1 751 751 751

Total startup costsc k V 23,402

Average revenues

per year

k V y�1 2551 4427 5052

Harvest costs V t�1 12.9 12.9 12.9

Biomass production

costs

V t�1 63 34 30

Transport costsd V t�1 2.1 2.1 2.1

Electricity production

costs

V MWh�1 255 73 42

Heat production costs V MWh�1 27 8 5

a Using a discount rate of 10%.

b Post-establishment.

c All costs accumulated until first unit of electricity is produced.

d At a hauling distance of 3 km.

Please cite this article in press as: Buchholz T, et al., Modeling thecrops in Sub-Saharan Africa, Biomass and Bioenergy (2012), http

significant losses in revenue but would nevertheless be prof-

itable and therefore reduce investment risk considerably. In

the best-case scenario, the payback period is reached in the

tenth project year while the worst-case scenario projects the

payback period on the 14th year. Total biomass production

costs over the full project lifetime are 30 V t�1 including land

(3.3 V t�1), establishment (2.7 V t�1), maintenance (9.3 V t�1),

harvest (12.9 V t�1) and transport costs (2.1 V t�1; see

Supporting information Table S1e7).

Plant construction, plant maintenance and biomass

harvest are themain costsmaking up 28%, 38% and 14% of the

total undiscounted costs (Fig. 3). Plantation establishment and

maintenance costs (land purchase, establishment and main-

tenance) play a less significant role accounting for less than

17% of expenses. 59% and 41% of revenues come from elec-

tricity and heat sales, while the sale of carbon credits related

to afforestation and reforestation activities and sale of land at

project termination account for only 0.2% and 0.6%.

Fig. 3 e Distribution of total production costs

(undiscounted) over the whole project life of 30-years for

the 5 MW (electric) base-case scenario. Cost for plantation

removal, carbon certification and verification as well as

plant maintenance were insignificant.

profitability of power production from short-rotation woody://dx.doi.org/10.1016/j.biombioe.2012.11.027

b i om a s s a n d b i o e n e r g y x x x ( 2 0 1 2 ) 1e1 2 7

The project would create 191 permanent full-time labor

and 5 management positions, respectively, once the planta-

tion is fully established (see Fig. 4). Most of the positionswould

be associated with harvest activities (124) and biomass plant

maintenance (38).

3.2. Variations to the baseline scenario

3.2.1. Rotation length and harvest systemBiomass production costs including land, establishment,

maintenance, harvest, and transport costs would account for

34% of total project costs. 42% of those biomass production

costs are harvest costs (12.9 V t�1, see Table 4). Reducing

harvest costs might therefore affect the project’s cash flow

considerably. The mechanized alternative (single-grip

harvester system, 115 V t�1) is not profitable (2% IRR over 30-

years) in the base-case scenario compared with a manual

harvest due to the small individual tree diameters even at

a five year rotation (Table 2). An alternative could be to reduce

rotation length which would reduce stem size at the time of

harvest and therefore allow for a mechanized cut and chip

harvest system also reducing harvest labor costs. But poten-

tially most influential for the overall project profitability is the

late electricity production start in the 7th project year caused

by a five year long plantation establishment period. Therefore,

it might be of interest to reduce the rotation length despite

losses in plantation productivity. Another option might be to

establish a five year rotation design but harvest sections

already after two or three years in the early project phase to

allow the plant to come online as soon as possible, though

with an initially reduced capacity.

Reducing the rotation period from5 to 3 years and changing

the harvest system from amanual to a mechanized one using

a cut and chip harvester reduces harvest costs to 6.3 V t�1,

reduces the post-establishment permanent labor workforce

to 66 (down from 191, Fig. 4), but increases the required

Fig. 4 e Full-time positions per year during the project’s

lifetime for the base-case scenario (5-year rotation, manual

harvest) and a 3-year rotation scenario with a cut and chip

harvester assuming the same site productivity (SI 25, see

Table 2). A rapid plantation establishment with increased

planting densities in the 2-year rotation scenario causes an

initial high labor requirement. Positions associated with

power plant construction are not included.

Please cite this article in press as: Buchholz T, et al., Modeling thecrops in Sub-Saharan Africa, Biomass and Bioenergy (2012), http

plantation size from 2870 ha to 3177 ha. These changes

increase the 30-y IRR by 1% point to 17% (Fig. 5). However,

allowing the power plant to go online three years earlier than

the base-case scenario increases the 10-year IRR significantly

by 9% points to 4%; therefore reducing the project’s economic

risk considerably. Compared with the base-case scenario, the

gain in short-term profitability is balanced in the long-run by

the fact that the combined plantation establishment mainte-

nance, and transport costs increase by 31% from 14.1 to

18.5 V t�1 which is not so much a result of the increased

plantation size but more influenced by the lower density of

chips compared with logs are transported.

3.2.2. Site productivityFig. 5 further details how site productivity in combination

with harvesting systems influence the project’s profitability.

Results suggest that rotation length and to some degree site

productivity has only limited influence on a project’s overall

profitability. Instead, matching harvest technology to planta-

tion design (spacing and rotation lengths) and productivity

seems to be paramount. All site productivity scenarios were

capable of producing a 30-year IRR of >16%. Increasing site

productivity from SI 25 to SI 35 increases the maximum IRR

from 17% to 19% (3-year rotation with a cut and chip har-

vesting system for SI 25; 3e5-year rotation harvested manu-

ally for SI 35). Several harvesting systems might yield positive

returns for a given productivity and rotation length. Never-

theless, switching from one harvesting system to another can

change the IRR drastically. For instance, harvesting a 3-year

rotation system with a high productivity of 24 t ha�1 y�1 (SI

35) with a single-grip harvester instead of amanual harvesting

system reduces the IRR from 19% to 9%. In general, themanual

harvest system produces highest IRRs for longer rotations.

Plantation design decisions prior to establishment are crucial

as options to switch from one harvest system to another are

limited as plantation design and size are geared towards

maximum returns for a given harvest system in terms of

planting density and tree diameter. It has to be noted that

these results are highly sensitive to harvest productivity

assumptions as well as site productivities. Therefore, exten-

sive research on matching species with site productivity is

essential to reduce uncertainties concerning harvest and

plantation productivity of a specific project under review.

High planting densities for 1e2 year rotations are not well

researched and might produce unnecessary initial establish-

ment costs as well as increased harvest costs due to a lower

mean stem diameter. Reducing planting density from

9323N ha�1 to amore traditional density of 3000 ha�1 for a one

year rotation at a site productivity corresponding to SI 25

reduces establishment costs from 1141 to 747 V ha�1 and

increases the 30-year IRR by 1% point.

3.2.3. Financial incentivesElectricity production from biomass receives increasing

support by governmental and non-governmental institutions

based on a range of benefits such as its traits being a local or

renewable energy source. Establishment grants as well as

favorable tariffs above market prices are two widely used

financial incentivemechanisms to spur its adoption. Providing

an establishment grant covering 50% or 100% of plantation

profitability of power production from short-rotation woody://dx.doi.org/10.1016/j.biombioe.2012.11.027

Fig. 5 e Profitability over the total project’s lifetime of 30-years for different harvest techniques and rotation lengths and

under different site productivity assumptions.

b i om a s s a n d b i o e n e r g y x x x ( 2 0 1 2 ) 1e1 28

establishment costs (up to 751 V ha�1 or 2,071,458 V total)

would increase the IRR by 1e2% points. Alternatively, the

funds available to a grantor might be invested in providing an

increased tariff. In contrast to an establishment grant, this

incentive would be paid over time and be tied to the electricity

production rate. To make both incentives comparable in

costs over time we assumed that the funds (50%e100% of

2,071,458 V) would be available for an establishment grant at

the start date of a project or alternatively available over time in

termsof an increased tariff anddiscounted at an annual rate of

10%. Based on these assumptions, an increased tariff of

125e249 V MWh�1 would be available additional to the

100 V MWh�1 base-case revenues considering a 50% or 100%

establishment grant; resulting in a 30-year IRR of 29e40%.

Meanwhile, establishment grantsmight still be favorable to an

investor to reduce overall startup costs and therefore invest-

ment risks.

3.2.4. Tariff for electricity and heatIn the base-case scenario revenues from heat sales

(35 V MWh�1) constitute 41% of total revenues. Fig. 6 outlines

how changing heat sales impact the project’s overall profit-

ability based on three scenarios differing in electricity tariffs

(70e130 V MWh�1). Excluding heat sales (as well as capital

costs for a heat recovery unit) would reduce the 30-year IRR of

the base-case scenario by 7% points to 9%. Selling heat at

10 V MWh�1 can result in a decreased IRR (130 V MWh�1

Fig. 6 e The impact of tariffs for heat on overall project IRR.

Three different tariffs for electricity are considered.

Please cite this article in press as: Buchholz T, et al., Modeling thecrops in Sub-Saharan Africa, Biomass and Bioenergy (2012), http

electricity scenario) compared to a power-only scenario only,

as heat sales are not offsetting additional costs from a heat

recovery installation. A tariff for electricity of 70 V MWh�1

would require a tariff for heat of at least 28 V MWh�1in order

to result in a 30-year IRR of 10% or more. Furthermore, having

no option to sell heat might require additional costs to install

cooling technology which can be substantial in the humid

tropics. Markets for steam- or hot-water driven cooling

demand could substitute for absent heat markets.

3.2.5. Plant capacity and electric conversion efficiencyCapital costs of the power plant constitute 27% of total project

cost assuming 3,000,000 V MW�1 for the installation of CHP

technology. Biomass power plants as big as 50 MW have been

analyzed under East African conditions [8]. Economies-of-

scale are regularly used to decrease capital costs per MW unit

installed while increasing electric conversion efficiency.

Based on Sievers [29] and Everett and Billington [30] who

assumed a 23% and 16% cost reduction when doubling

capacity, respectively, we assumed a 20% decrease in capital

costs when doubling plant capacity (Fig. 7). We further

assumed an increase in maintenance costs in a linear rela-

tionship with scale; transport distance was linked to planta-

tion size requirements. Depending on electric conversion

efficiency and plant size, plantation sizes varied from 431 to

861 ha for a 1 MW (electric) plant to 21,525 to 43,051 ha for

a 50MW (electric), plant (40% heat and 20% electric conversion

efficiency, respectively).

Fig. 7 shows how the IRR develops with increasing scale

under three different electric conversion efficiency scenarios.

While all three efficiency scenarios show considerable gains

in IRR when increasing the scale from 1 to 20 MW, gains in IRR

level off beyond 20 MW (electric) especially for technologies

using lower conversion efficiencies. This leveling-off can be

mainly attributed to the smaller capital cost-gains once

a 20MWsize is exceeded. Theremight be slight economies-of-

scale beyond the 20 MW scale when considering decreasing

maintenance costs on a per unit basis and project transaction

and management costs. In our analysis we assumed that

management costs are linearly related to capacity.

It also should be noted that conversion efficiencies often

increase with scale. The low-efficiency scenario (20% electric

conversion efficiency) might be therefore more realistic for

plant sizes<5 MW (electric) while the high-efficiency scenario

profitability of power production from short-rotation woody://dx.doi.org/10.1016/j.biombioe.2012.11.027

Fig. 7 e Financial analysis of economies-of-scale under various electric efficiency scenarios. We assumed capital costs of

3,000,000 V MWL1 for a 5 MW (electric) CHP plant excluding land costs and a reduction of capital costs by 20% when

doubling plant size.

b i om a s s a n d b i o e n e r g y x x x ( 2 0 1 2 ) 1e1 2 9

(30% and 40% electric efficiency for proven and currently

researched technology, respectively) might be more repre-

sentative of larger plants. However, highly efficient gasifica-

tion systems [31,32] or technology using the organic Rankine

cycle are increasingly becoming commercially competitive in

the lower capacity range. In conclusion, land availability,

energy demand especially for heat, price spans between heat

and electricity tariffs as well as socio-economic consider-

ations might have a larger influence on a project’s size than

financial gains through economies-of-scale [33].

3.2.6. Land costsLand costs are often positively related to site productivity.

However, we refrained from discussing both variables jointly

as the nature of this relation is difficult to quantify across the

region. Also the impact of other factors such as land avail-

ability in large tracts, as well as non-yield related biophysical

(e.g. slope) and socio-economic factors (e.g. secure land titles,

vicinity to energy demand or grid lines) on regional land

pricing is highly variable.

Decreasing land costs by 30%e200 V ha�1 did change the

30-year IRR by less than 1% point. Increasing the land costs up

to 406 V ha�1 would decrease the 30-year IRR by less than 1%

point. Another option to modify land costs is changing from

a ‘land purchase’ scenario (300V ha�1 land price, 20V ha�1 y�1

annual administration costs) to a ‘land lease’ scenario

(10 V ha�1 initial costs to secure land titles, 50 V ha�1 y�1

annual lease) for both plantation area (2870 ha) and plant site

(3.0 ha). This land lease scenario would leave the 10-, 20-, and

30-year IRR unchanged. The total startup costs would drop by

2% to 23,000,113 V. Results suggest that land price and prop-

erty structure (land purchase vs. lease) play a minor role in

a project’s profitability under Sub-Sahara African conditions.

Other considerations such as riskmanagement and long-term

commitment of land owners might play a dominant role in

land-access decisions.

3.2.7. Fuel and labor costsThe economics of energy production from renewables such

as biomass power are often sensitive to volatile fossil-fuel

Please cite this article in press as: Buchholz T, et al., Modeling thecrops in Sub-Saharan Africa, Biomass and Bioenergy (2012), http

markets. Diesel fuel is the major source of fossil-fuel

consumption in SRWC systems [13]. Increasing or decreasing

Diesel price by �30% from 1.0 V L�1 would increase/decrease

harvest costs by �1.1 V t�1 or �6% (from 12.9 V t�1) while

leaving transport costs per t unchanged. This modification

would not change the project’s IRR. Only an increase in diesel

fuel price by 90% to 1.9 V L�1 would decrease the 30-year IRR

by 1% point. This result suggests that even high fluctuations in

fuel costs play aminor role in the overall project’s profitability

despite the significant role that harvest costs play in the

project’s cash flow and the fairly high influence of diesel fuel

price on harvest costs. Compared with manual harvest

systems, highly-mechanized harvest designs are more

susceptible to volatile fuel prices: increasing fuel costs by 30%

for a 3-year rotational system with a cut and chip harvester

did not reduce the overall 30-year IRR. Only an 80% increase in

fuel costs decreased the IRR by 1% point. However, only direct

fuel costs have been considered in this analysis. A full energy

life cycle analysis [22] would also need to take indirect fossil-

fuel consumption into account for e.g. fertilizer production,

plant construction and equipment manufacturing. Mean-

while, increasing fossil-fuel costs also drive competing fossil-

fuel based power production up which can improve the

competitiveness of renewable energy systems.

Labor costs (excluding management) account for 21% of

total undiscounted costs over the 30-year project lifetime.

Compared with the base-case scenario, changing the labor

costs by �30% would change the 30-year IRR by 0/þ1% points.

While labor costs play a significant role in the project budget,

drastic changes seem to affect the project’s profitability to

a limited extend. This is especially interesting considering

that the base-case scenario is very labor intensive compared

with other scenarios using more mechanized harvest

systems.

3.2.8. Transport distanceTransport costs account for 2.3% of total project costs. In the

base-case scenario we assumed a transport distance of 3 km

resulting in transport costs of 2.1 V t�1. Reducing stand

density due to a change in rotation length or site productivity

profitability of power production from short-rotation woody://dx.doi.org/10.1016/j.biombioe.2012.11.027

Fig. 8 e Transport distance and its relation to transport

costs. We assumed a transport of logs and a tractor pulling

two trailers with a total transport capacity of 37 t.

Requirements to employ an additional transport unit to

assure a minimum daily delivery rate cause drastically

increasing transport costs when exceeding 4 and 26 km.

b i om a s s a n d b i o e n e r g y x x x ( 2 0 1 2 ) 1e1 210

or increasing plant capacity (Section 3.2.5) can increase

transport distance considerably. Fig. 8 shows the relationship

between transport distance and transport costs. While

transport costs nearly tripled when increasing transport

distance from2 km to 50 km, the project’s 30-year IRR changed

by less than 1% point up to a transport distance of 26 km.

While playing a significant role in biomass costs, transport

distance plays a limited role for the overall project’s profit-

ability. These results might for instance encourage managers

to locate the power plant close to a heat consumer rather

attempting to locate the plant in the center of a biomass

plantation to reduce transport costs.

3.2.9. Carbon credit sales from CDM AR activitiesSale of carbon credits at 5 V per t of carbon dioxide equivalent

account for 0.2% of total revenues (296,278V) and 0.2% of costs

(130,000 V). Removing sales of carbon credits under the

conditions as outlined in the base-case scenario would leave

the 30-year IRR unchanged while decreasing the 10-year IRR

Fig. 9 e Carbon credit price and its influence on overall

project profitability.

Please cite this article in press as: Buchholz T, et al., Modeling thecrops in Sub-Saharan Africa, Biomass and Bioenergy (2012), http

by 1% point. Fig. 9 shows that sales of carbon credits will play

a minor role in the projects profitability even when increasing

carbon credit prices 7-fold. Exceptional carbon prices of up to

30 V per t of carbon dioxide equivalent as paid on rare occa-

sions in 2010 [34] would change the 30-year IRR by 1% point.

However, these high priced carbon credits might be only

possible under commitments exceeding a 20-year carbon

sequestration time span. In contrast and if eligible, carbon

credit sales derived from fuel-switch projects such as replac-

ing oil-derived electricity systems with biomass power might

play a superior role in the project’s economics compared with

CO2 sequestration occurring at the plantation.

4. Conclusions and recommendations

Electricity production from woody-biomass is increasingly

considered a viable option to increase electricity access in

Sub-Saharan Africa. However, no commercial SRWC-based

electricity system is being installed to date, though in

a number of countries respective investments are under

investigation. The goal of this study was to simulate the

profitability of SRWC-based electricity production in a range

of 1e50 MW (electric) under conditions typical for the region.

For the 5 MW (electric) base-case scenario, plant construc-

tion and plant maintenance were the main expenses asso-

ciated with the project making up 28% and 38% of total

undiscounted costs. In general, biomass production costs

(except harvest) played a minor role in the overall project

economics. However, plantation management and design

such as rotation length had a considerable influence on

project profitability. For instance, shortening the rotation

length can significantly reduce the project’s short-term

investment risk. In the base-case scenario, the 10-year IRR

increased from �5% to 4% when reducing the rotation period

from 5 to 3 years and switching from a manual harvest

system to a mechanized one. This increase in the short-term

IRR can be mainly attributed to the fact that the power plant

would go online and generate revenues two years earlier.

Long-term profitability remained fairly constant (30-year IRR

16%e17%).

In the base-case scenario the (manual) harvest system

accounted for 14% of total project costs (12.9 V t�1). The

economics of harvest systems and choice of technology are

driven by rotation length and site productivity which in turn

dictate plantation design such as planting density and plan-

tation size. Reducing rotation length to three years decreases

stem size and therefore would allow to employ a cut and chip

harvester at reduced costs (6.3 V t�1).

Tariffs for electricity and heat played a significant

economic role. The base-case scenario’s 30-year IRR dropped

from 16% to 9% if no heat sales were included. An electricity

tariff of 70 V MWh�1 would require a heat tariff of

>27 VMWh�1 to achieve a 30-year IRR of >10%. Feed-in tariffs

for bagasse-fired power plants range from 38 to 48 V MWh�1

[35]. Site productivity (12e24 t ha�1 y�1 for a 5-year rotation),

land, plantation establishment and maintenance, transport

distance, fuel, and labor costs as well as revenues from carbon

credit sales played a limited role in the overall project’s

profitability.

profitability of power production from short-rotation woody://dx.doi.org/10.1016/j.biombioe.2012.11.027

b i om a s s a n d b i o e n e r g y x x x ( 2 0 1 2 ) 1e1 2 11

Economies-of-scale increased a project’s IRR for plants of

up to 20 MW (electric), while benefits from increasing plant

size were leveling-off for larger plants. However, novel small-

to medium-scale commercially proven integrated biomass

gasification combined cycle (IGCC) or organic Rankine cycle

technology [32] might cancel out gains from economies-of-

scale. Plant capacitymight need to be driven to a larger extend

by proximity to markets for heating or cooling as well as land

availability rather than economies-of-scale.

Key factors for a bioenergy growth market are access to

financing, long-term feed-in contracts and local heat sales. To

makewood-based power production investments competitive

in Sub-Saharan Africa research should further focus on i)

integrated sustainability assessment methods [18] that

consider land-access and -use disputes reduce assessment

costs and increase acceptance, ii) improved energy life cycle

analysis [16,22] including indirect fossil-fuel consumption, as

well as ii) improved understanding of region-specific species

and site management including long-term soil productivity

and harvest productivities.

Acknowledgments

The research presented in this paper has been partly funded

under the RE-Impact project ENV/2007/114431, funded by the

European Union Aid Cooperation Office Programmes on

Environment in Developing Countries and Tropical Forests

and other Forests in Developing Countries. We are grateful for

comments from Matthias Seebauer and Sofce Spasikova. We

acknowledge two anonymous reviewers for their important

contributions to this paper.

Appendix A. Supplementary data

Supplementary data related to this article can be found at

http://dx.doi.org/10.1016/j.biombioe.2012.11.027.

r e f e r e n c e s

[1] UNECA/UNEP. Making Africa’s power sector sustainable. Ananalysis of power sector reform in Africa. Addis Ababa,Ethiopia: United Nations Economic Commission for Africa;2007 Sep. p. 151.

[2] IEA/UNDP/UNIDO. Energy poverty how to make modernenergy access universal? Special early excerpt of the worldenergy outlook 2010 for the UN general assembly on themillennium development goals. Paris: International EnergyAgency; 2010. p. 40.

[3] Buchholz T, Volk T, Tennigkeit T, Da Silva I. Electricityproduction from energy forests: results from a feasibility andimpact scoping study in northern Uganda for a 50 MWe gridmodel. In: Maniatis K, editor. Proceedings 15th Europeanbiomass conference, 7e11 May 2007, Berlin, Germany.Florence: ETA; 2007. p. 2667e71.

[4] FAO Country Profiles [data base on the Internet] Rome e

Italy: Food and Agriculture Organization of the UnitedNations 2012. [cited 2012 Sep 30] Select a country, Uganda;

Please cite this article in press as: Buchholz T, et al., Modeling thecrops in Sub-Saharan Africa, Biomass and Bioenergy (2012), http

Available from: http://www.fao.org/countryprofiles/default/en/Files updated annually.

[5] The Electricity Access Database [data base on the Internet]Paris e France: International Energy Agency (IEA) e [cited2012 Sep 30] Available from: http://www.worldenergyoutlook.org/media/weowebsite/energydevelopment/WEO2011_new_Electricity_access_Database.xls Files updated annually.

[6] Banerjee R. Comparison of options for distributed generationin India. Energ Policy 2006;34(1):101e11.

[7] Buchholz T, Da Silva I. Potential of distributed wood-basedbiopower systems serving basic electricity needs in ruralUganda. Energ Sus Dev 2010;14(1):56e61.

[8] Buchholz T, Volk T, editors. Final report BIOSYRCA project edesigning short-rotation coppice bioenergy systems for ruralcommunities in East Africa. Washington DC, USA: UnitedStates Agency for International Development [Report on theInternet] [cited 2012 Sep 30]. Available from: pdf.usaid.gov/pdf_docs/PNADL582.pdf; 2007.

[9] Buchholz T, Da Silva I, Furtado J. Power from wood gasifiersin Uganda: a 250 and 10 kW case study. P Civil Eng 2012:165.

[10] Couto L, Nicholas I, Wright L. Short rotation Eucalyptplantations for energy in Brazil, vol. 43. Paris: InternationalEnergy Agency (IEA) Bioenergy Task; 2011. p. 17.

[11] Stape JL,BinkleyD,RyanMG,FonsecaS,LoosRA,TakahashiEN,et al. The Brazil Eucalyptus Potential Productivity Project:influence of water, nutrients and stand uniformity on woodproduction. For Ecol Manag 2010;259(9):1684e94.

[12] Roedl A. Production and energetic utilization of wood fromshort rotation coppiceda life cycle assessment. Int J LifeCycle Ass 2010;15:567e78.

[13] Heller MC, Keoleian GA, Volk TA. Life cycle assessment ofa willow bioenergy cropping system. Biomass Bioenerg 2003;25:147e65.

[14] Heller MC, Keoleian GA, Mann MK, Volk TA. Life cycle energyand environmental benefits of generating electricity fromwillow biomass. Renew Energ 2004;29(7):1023e42.

[15] Pimentel D, Herz M, Glickstein M, Zimmerman M, Allen R,Becker K, et al. Renewable energy: current and potentialissues. Bioscience 2002;52:1111e9.

[16] Zanchi G, Frieden D, Pucker P, Bird N, Buchholz T, WindhorstK. Climate benefits of biomass plantations for energy inUganda. Biomass Bioenergy, in press.

[17] Amezaga JM, von Maltitz G, Boyes SL. Assessing thesustainability of bioenergy projects in developing countries:a framework for policy evaluation. Newcastle University,ISBN 978-9937-8219-1-9; 2010. p. 179.

[18] Buchholz T, Rametsteiner E, Volk T, Luzadis VA. Multicriteria analysis for bioenergy systems assessments. EnergPolicy 2009;37(2):484e95.

[19] van den Broek R, van Wijk A, Turkenburg W. Electricity fromenergy crops in different settings e a country comparisonbetween Nicaragua, Ireland and the Netherlands. BiomassBioenerg 2002;22(2):79e98.

[20] Sims REH, Venturi P. All-year-round harvesting of shortrotation coppice Eucalyptus compared with the deliveredcosts of biomass from more conventional short season,harvesting systems. Biomass Bioenerg 2004;26:27e37.

[21] PowerForest v1.0 (Beta) e An energy forest business modelfor sub-Saharan Africa. Newcastle e UK: Centre for Land Useand Water Resources, [cited 2012 Sept 30]. Available from:http://research.ncl.ac.uk/reimpact/economics2.htm.

[22] Patzek TW, Pimentel D. Thermodynamics of energyproduction from biomass. Crit Rev Plant Sci 2005;24(5e6):327e64.

[23] Afzal MT, Bedane AH, Sokhansanj S, Mahmood W. Storage ofcomminuted and uncomminuted forest biomass and itseffect on fuel quality. BioResources 2010;5(1):55e69.

profitability of power production from short-rotation woody://dx.doi.org/10.1016/j.biombioe.2012.11.027

b i om a s s a n d b i o e n e r g y x x x ( 2 0 1 2 ) 1e1 212

[24] Sims REH, Senelwa K, Maiava T, Bullock BT. Eucalyptusspecies for biomass energy in New Zealand e I: growthscreening trials at first harvest. Biomass Bioenerg 1999;16:199e205.

[25] Sims REH, Maiava TG, Bullock BT. Short rotation coppice treespecies selection for woody biomass production in NewZealand. Biomass Bioenerg 2001;20:329e35.

[26] Tolosana E, Laina R, Ambrosio Y. Eucalyptus short rotationwoody crops for energy: a literature and experiences reviewwith special reference to industrial trials in Spain. In: Gil L,Tadesse W, Tolosana E, Lopez R, editors. Eucalyptus speciesmanagement, history, status and trends in Ethiopia.Proceedings from the Congress held in Addis Ababa;September 15the17th, 2010. p. 370e80.

[27] Buchholz T, Volk TA. Improving the profitability of willowcrops e identifying opportunities with a crop budget model.BioEnerg Res 2011;4(2):85e96.

[28] Alder D, Drichi P, Elungat E. Yields of Eucalyptus andCaribbean Pine in Uganda. Consultancy report for theUganda Forest Resources Management and ConservationProgramme, Kampala, Uganda: 2003, p. 52.

[29] Sievers J. The economics of heat storage in CHP plants andintegration techniques such as use of buildings as

Please cite this article in press as: Buchholz T, et al., Modeling thecrops in Sub-Saharan Africa, Biomass and Bioenergy (2012), http

‘batteries’ and heat pumps. Proceedings of the DESIRESeminar, University of Birmingham. University of Kassel;2005. p. 14.

[30] Everett R, Billington I. Low-cost biomass electricity: morewires or more traffic? Proceedings of the ICE - Energy 2008;161(1):31e6.

[31] Brown D, Gassner M, Fuchino T, Marechal F. Thermo-economic analysis for the optimal conceptual design ofbiomass gasification energy conversion systems. ApplTherm Eng 2009;29(11e12):2137e52.

[32] Brandin J, Tuner M, Odenbrand I. Small scale gasification: gasengine CHP for biofuels. Lund: Swedish Energy Agency; 2011.p. 137.

[33] Buchholz T, Volk TA. Is project scale the key to sustainablemodern bioenergy systems in the tropics? J Sustain For 2012;31:154e73.

[34] Forest TrendsAssociation. State of forest carbonmarkets 2011:from canopy to currency. Washington DC, USA: EcosystemMarketplace and Forest Trends Association; 2011. p. 93.

[35] Generation tariffs e Bagasse plants. [data base onthe Internet] Kampala e Uganda: Electricity RegulatoryAuthority e [cited 2012 Sep 30] Available from: http://www.era.or.ug/BaggaseTariffs.php Files updated regularly.

profitability of power production from short-rotation woody://dx.doi.org/10.1016/j.biombioe.2012.11.027


Recommended