A858 Journal of The Electrochemical Society, 162 (6) A858-A869 (2015)
Modeling the SEI-Formation on Graphite Electrodesin LiFePO4 BatteriesDongjiang Li,a,b Dmitry Danilov,a Zhongru Zhang,c Huixin Chen,c Yong Yang,b,c,∗,z
and Peter H. L. Nottena,d,∗,z
aDepartment of Chemical Engineering and Chemistry, Eindhoven University of Technology,Eindhoven 5600MB, The NetherlandsbSchool of Energy Research, Xiamen University, Xiamen 361005, People’s Republic of ChinacDepartment of Chemistry, Xiamen University, Xiamen 361005, People’s Republic of ChinadForschungszentrum Julich IEK-9, D-52425 Julich, Germany
Manuscript submitted September 25, 2014; revised manuscript received February 11, 2015. Published February 27, 2015. This wasPaper 132 presented at the Como, Italy, Meeting of the IMLB, June 10–14, 2014.
Li-ion batteries, based on the C6/LiFePO4 chemistry, attracts nowa-days much attention for application in, for example, electric vehiclesdue to the excellent cycling stability of the LiFePO4 electrode. Themain electrochemical storage reactions of this battery type can berepresented by
C6 + xLi+ + xe−charge−−−−−−−→←−−−−−−−
dischargeLixC6, [1]
LiFePO4
charge−−−−−−−→←−−−−−−−discharge
Li1−x FePO4 + xLi+ + xe−. [2]
During charging electrons and Li+ ions are extracted from theLiFePO4 (0 ≤ x ≤ 1) electrode and flow into the graphite electrode.The reverse reactions take place during discharging. The structure ofLiFePO4 (LFP) is highly robust due to the strong bonding betweenthe P and O atoms. LFP batteries therefore combine a good cyclingstability with excellent thermal stability and long lifespan.1–5 The vol-ume decreases only 6.8%6 when all Li (�x = 1) is extracted and thesesmall volumetric changes do not influence the structure of LiFePO4
and FePO4. Favorably, it almost fully counterbalances the volumetricchanges of the graphite electrode during Li (de)insertion.
Due to these favorable properties, the capacity losses caused bythe LFP cathode are generally assumed to be negligible. Furthermore,Broussely et al. showed that the capacity of the graphite electrodecan be fully recovered even after more than 1 year storage under‘floating’ conditions at 60◦C, demonstrating that the stability of thecarbon electrode is also excellent.7 However, capacity losses are stillfound in LFP batteries. It is generally accepted, that the formation ofa Solid Electrolyte Interface (SEI) is one of the main reasons for thecapacity losses of graphite-based Li-ion batteries, especially undermoderate conditions during the initial stages of aging.
The SEI plays a dual-role in the performance of Li-ion batteries.On the one hand, it protects the negative electrode from solvent co-intercalation, preventing exfoliation of the graphene layers. On theother hand, it consumes cyclable lithium inside the battery, which istherefore no longer available for the energy storage process and hence
leads to irreversible capacity losses. Extensive efforts have been madeto study the structural and chemical composition of SEI layers.8–26
Despite the fact that a lot of studies were made to investigate theSEI by experimental methods, the understanding of the SEI formationprocess is still limited due to the complexity of the SEI formation re-action, which was found to be highly dependent on the composition ofthe electrolyte, the electrode voltage and electrode surface morphol-ogy. While modeling seems to be an efficient way to investigate theSEI formation process, only a few studies are related to the SEI growthmechanism, which are still under discussion.27–36 Some researchersassumed the electron diffusion process to be rate determining29 whileothers considered solvent diffusion through the SEI layer to be ratelimiting.33–36 In contrast to the solvent diffusion model, the tunnel-ing model assumes that the reduction of solvent takes place at thesurface of the inner SEI layer instead of the graphite surface. Tanget al.27 reviewed several models, concluding that electron tunnelingbased models cannot describe their experimental results. However,these experiments were related to the initial stages of SEI formationonly when the SEI layers are formed on graphite during the so-calledformation process. For most commercial batteries very stable SEI lay-ers are already formed as part of the manufacturing process, playinga dual role in protecting the graphite electrode. On the one hand, itinsulate electrons from being in direct contact with the solvent and,on the other hand, it prevents solvent molecules passing through and,consequently, preventing exfoliation of the graphene layers.
Experimental studies demonstrate that the SEI consists of a com-pact inner SEI layer and a more porous outer SEI layer, whichare mainly composed of inorganic Li-salts and organic Li-salts,respectively.11,12,14 The inner SEI-layer is dense and is considered toisolate the surface of the graphite electrode from being in direct con-tact with the electrolyte, thereby preventing solvent co-intercalationinside the graphite electrode. The inner SEI layer is, however, consid-ered to be highly conductive for unsolvated Li+ ions. The outer SEIlayer is highly porous, allowing solvated Li+ ions to pass through.37
Based on these experimental results, an advanced electrontunneling-based SEI formation model is proposed and simulated inthe present contribution. The model is focusing on battery aging afterformation when a relatively stable SEI has already been formed onthe graphite surface during the manufacturing process. The simulationresults are validated by the experimental data.
) unless CC License in place (see abstract). ecsdl.org/site/terms_use address. Redistribution subject to ECS terms of use (see 131.155.81.84Downloaded on 2015-03-02 to IP
Journal of The Electrochemical Society, 162 (6) A858-A869 (2015) A859
Figure 1. Schematic representation of a C6/LiFePO4 battery, showing the formation of the inner- and outer SEI layer during charging (a) and storage underopen-circuit conditions (b).
SEI Formation Mechanism
The complex morphology of the dual SEI layer is schematicallyrepresented in Fig. 1. The inner SEI layer is considered to be an insu-lator for electrons. Solvent reduction is assumed to take place at theinterface of the inner and outer SEI layer and is facilitated by electrontunneling from the graphite electrode through the inner SEI layer to theLowest Unoccupied Molecular Orbital (LUMO) of the solvent. TheFermi level for Lithium and LiC6 has been reported to be −2.36 eVand −2.80 eV versus vacuum, respectively.38 The LUMO of ethylenecarbonate (EC), one of the main solvents in LFP battery electrolytes,was reported to be −2.99 eV39 in the presence of Li+ ions. Thisvalue is more negative than the Fermi level of the graphite electrodeand, consequently, EC will be reduced assuming that electrons cancross the energy barrier for electron tunneling. The electrochemicalreduction of EC has, in general terms, been represented by
ECe−−−−−−−→Li+
EC · · · Li+e−−−−−−−→Li+
Li2CO3 + C2H4 [3a]
ECe−−−−−−−→Li+
EC · · · Li+e−−−−−−−→
Li++EC(CH2CO3Li)2 + C2H4 [3b]
where route (3a) is considered to be the electrochemical conversionreaction building up the inner SEI layer while route (3b) mainly con-tributes to the growth of the outer SEI layer.40
The SEI formation is initiated when the voltage of the graphiteelectrode drops below approximately 1.0 V vs Li/Li+.14,18,19,22,41 TheSEI is formed during the activation procedure after the battery manu-facturing process has been completed. During (dis)charging Li+ ionscan easily pass the layered structure of the entire battery stack, in-cluding both SEI layers. The solvent molecules (S) present in theelectrolyte can also easily pass the porous outer SEI layer but cannotpenetrate the inner SEI layer.33,36 The inner SEI layer is, however, agood insulator but electrons can tunnel through it when its thicknessis sufficiently small. The tunneling process is assumed to be the ratedetermining step, implying that solvent molecules are immediatelyreduced when the electrons arrive at the SEI interface. The productsof these reduction reactions increase the thickness of both SEI lay-ers but the individual rates might be significantly different as will beshown below.
When a current Ich is applied to the battery (see Fig. 1a), thiscurrent is used to drive two electrochemical processes at the graphiteelectrode, according to
Ich = I trch + ISE I [4]
where I trch represents the charge transfer current used to facilitate Li+
ion intercalation in the graphite electrode (Eq. 1) and ISE I is the currentrelated to the SEI formation reactions (Eq. 3). Obviously, the major
) unless CC License in place (see abstract). ecsdl.org/site/terms_use address. Redistribution subject to ECS terms of use (see 131.155.81.84Downloaded on 2015-03-02 to IP
A860 Journal of The Electrochemical Society, 162 (6) A858-A869 (2015)
part of the current is used to drive the main electrochemical storagereaction.
It is known that the volumetric expansion/shrinkage of graphiteelectrodes during (dis)charging can significantly influence the SEIformation process.42,43 Due to the mechanical stress, resulting fromthese volumetric changes, cracks are formed in the SEI layer, in-ducing the formation of uncovered graphite. As a result, the solventis directly brought in contact with pristine graphite and will imme-diately be reduced and new SEI products are acceleratory formed.Therefore, these volumetric changes have a considerable influence onthe increased capacity losses upon cycling.
In case of storage, no current flows through the outer circuit (seeFig. 1b). The SEI formation can, however, still occur under open-circuit conditions. When a battery is stored at a certain State-of-Charge (x > 0), electrons can still tunnel through the inner layerand reduce the solvent molecules at the inner/outer SEI interface.Obviously, this reduction reaction should be counter-balanced underopen-circuit conditions by an oxidation reaction as no external currentis flowing. Oxidation of Lithium stored inside the graphite electrodewill take place at the graphite/inner SEI layer interface, resultingin Li+ ion diffusion through the inner SEI layer. This electrolessprocess is illustrated in Fig. 1b. As Lithium from the graphite electrodewill be consumed this ultimately result in irreversible capacity losseseven under open-circuit conditions. The SEI formation during storageof LFP batteries is considered to be the main cause of irreversiblecapacity losses.
Model Development
When electron tunneling is considered to be rate limiting, as dis-cussed in Ref. 48, the tunneling current (Itl ) is proportional to thenumber of electrons reaching the surface of the graphite electrode( d N
dt , [s−1]) and the probability (P, dimensionless) of electrons to tun-nel through the inner SEI layer. The electron tunneling current canthen be written as
Itl = Pd N
dte, [5]
where e is the electron charge. In the present work, the electricaldouble layer (dis)charging currents are excluded and the only focus isthe description of the faradaic tunneling currents.
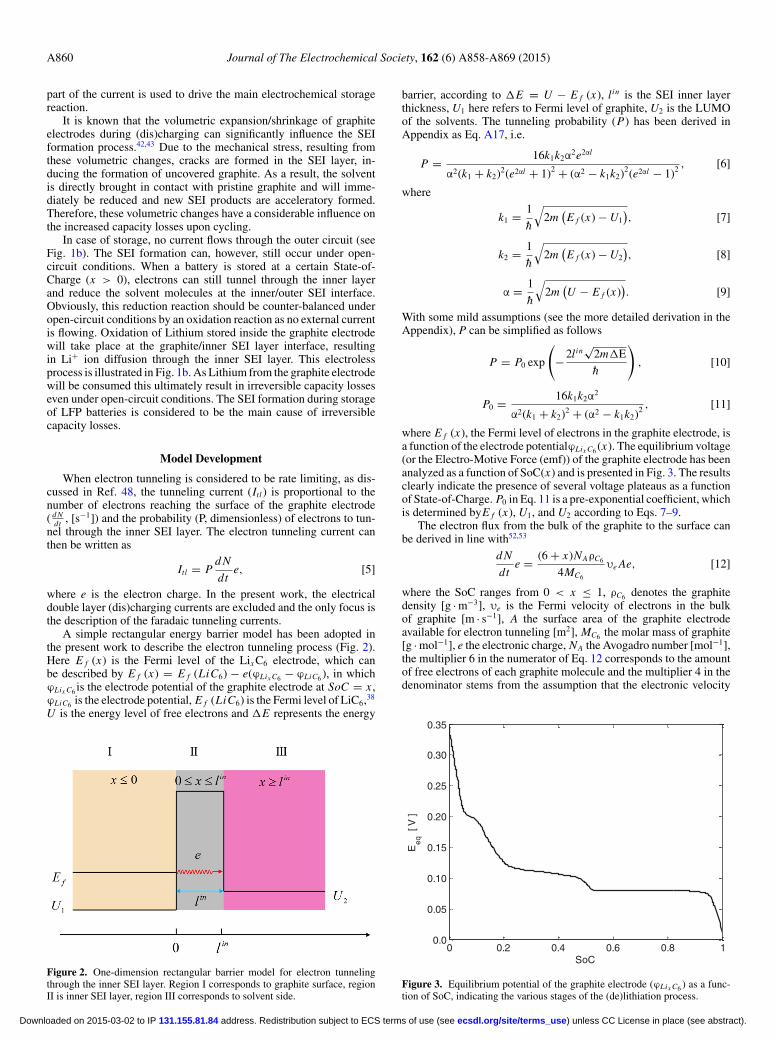
A simple rectangular energy barrier model has been adopted inthe present work to describe the electron tunneling process (Fig. 2).Here E f (x) is the Fermi level of the Lix C6 electrode, which canbe described by E f (x) = E f (LiC6) − e(ϕLix C6 − ϕLiC6 ), in whichϕLix C6 is the electrode potential of the graphite electrode at SoC = x ,ϕLiC6 is the electrode potential, E f (LiC6) is the Fermi level of LiC6,38
U is the energy level of free electrons and �E represents the energy
Figure 2. One-dimension rectangular barrier model for electron tunnelingthrough the inner SEI layer. Region I corresponds to graphite surface, regionII is inner SEI layer, region III corresponds to solvent side.
barrier, according to �E = U − E f (x), lin is the SEI inner layerthickness, U1 here refers to Fermi level of graphite, U2 is the LUMOof the solvents. The tunneling probability (P) has been derived inAppendix as Eq. A17, i.e.
With some mild assumptions (see the more detailed derivation in theAppendix), P can be simplified as follows
P = P0 exp
(−2lin
√2m�E-h
), [10]
P0 = 16k1k2α2
α2(k1 + k2)2 + (α2 − k1k2)2 , [11]
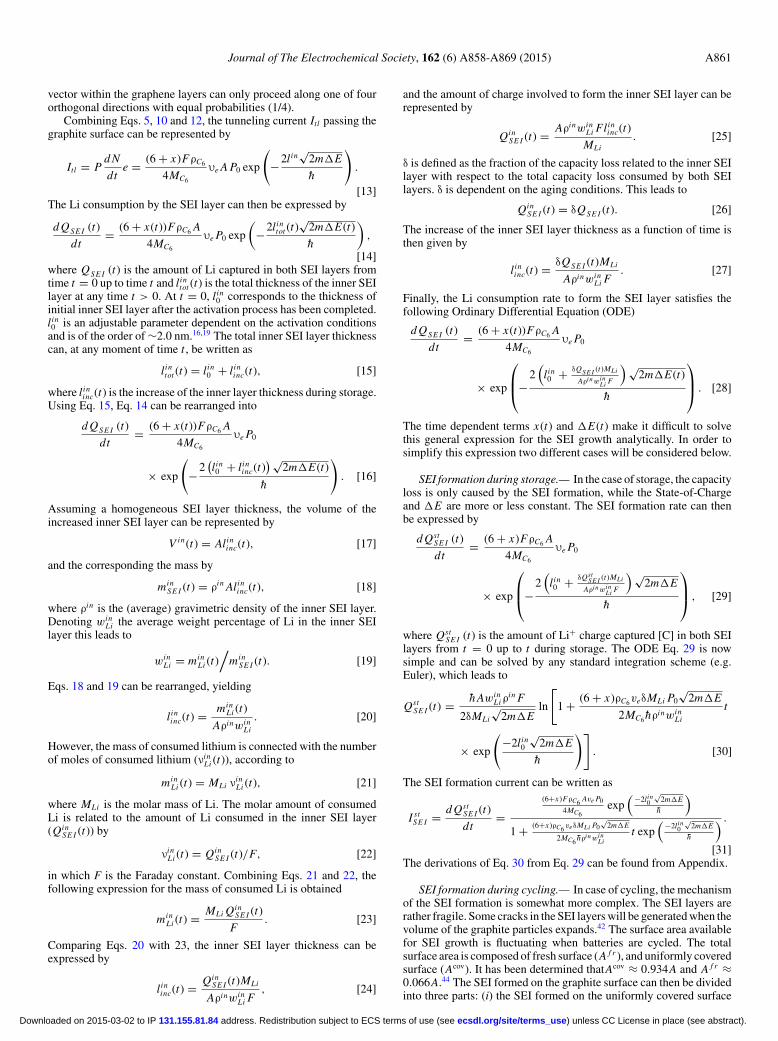
where E f (x), the Fermi level of electrons in the graphite electrode, isa function of the electrode potentialϕLix C6 (x). The equilibrium voltage(or the Electro-Motive Force (emf)) of the graphite electrode has beenanalyzed as a function of SoC(x) and is presented in Fig. 3. The resultsclearly indicate the presence of several voltage plateaus as a functionof State-of-Charge. P0 in Eq. 11 is a pre-exponential coefficient, whichis determined byE f (x), U1, and U2 according to Eqs. 7–9.
The electron flux from the bulk of the graphite to the surface canbe derived in line with52,53
d N
dte = (6 + x)NAρC6
4MC6
υe Ae, [12]
where the SoC ranges from 0 < x ≤ 1, ρC6 denotes the graphitedensity [g · m−3], υe is the Fermi velocity of electrons in the bulkof graphite [m · s−1], A the surface area of the graphite electrodeavailable for electron tunneling [m2], MC6 the molar mass of graphite[g · mol−1], e the electronic charge, NA the Avogadro number [mol−1],the multiplier 6 in the numerator of Eq. 12 corresponds to the amountof free electrons of each graphite molecule and the multiplier 4 in thedenominator stems from the assumption that the electronic velocity
0 0.2 0.4 0.6 0.8 10.0
0.05
0.10
0.15
0.20
0.25
0.30
0.35
SoC
Ee
q [
V ]
Figure 3. Equilibrium potential of the graphite electrode (ϕLix C6 ) as a func-tion of SoC, indicating the various stages of the (de)lithiation process.
) unless CC License in place (see abstract). ecsdl.org/site/terms_use address. Redistribution subject to ECS terms of use (see 131.155.81.84Downloaded on 2015-03-02 to IP
Journal of The Electrochemical Society, 162 (6) A858-A869 (2015) A861
vector within the graphene layers can only proceed along one of fourorthogonal directions with equal probabilities (1/4).
Combining Eqs. 5, 10 and 12, the tunneling current Itl passing thegraphite surface can be represented by
Itl = Pd N
dte = (6 + x)FρC6
4MC6
υe A P0 exp
(−2lin
√2m�E-h
).
[13]The Li consumption by the SEI layer can then be expressed by
d QSE I (t)
dt= (6 + x(t))FρC6 A
4MC6
υe P0 exp
(−2lin
tot (t)√
2m�E(t)-h
),
[14]where QSE I (t) is the amount of Li captured in both SEI layers fromtime t = 0 up to time t and lin
tot (t) is the total thickness of the inner SEIlayer at any time t > 0. At t = 0, lin
0 corresponds to the thickness ofinitial inner SEI layer after the activation process has been completed.lin0 is an adjustable parameter dependent on the activation conditions
and is of the order of ∼2.0 nm.16,19 The total inner SEI layer thicknesscan, at any moment of time t , be written as
lintot (t) = lin
0 + lininc(t), [15]
where lininc(t) is the increase of the inner layer thickness during storage.
Using Eq. 15, Eq. 14 can be rearranged into
d QSE I (t)
dt= (6 + x(t))FρC6 A
4MC6
υe P0
× exp
(−2
(lin0 + lin
inc(t)) √
2m�E(t)-h
). [16]
Assuming a homogeneous SEI layer thickness, the volume of theincreased inner SEI layer can be represented by
V in(t) = Alininc(t), [17]
and the corresponding the mass by
minSE I (t) = ρin Alin
inc(t), [18]
where ρin is the (average) gravimetric density of the inner SEI layer.Denoting win
Li the average weight percentage of Li in the inner SEIlayer this leads to
winLi = min
Li (t)/
minSE I (t). [19]
Eqs. 18 and 19 can be rearranged, yielding
lininc(t) = min
Li (t)
AρinwinLi
. [20]
However, the mass of consumed lithium is connected with the numberof moles of consumed lithium (νin
Li (t)), according to
minLi (t) = MLi νin
Li (t), [21]
where MLi is the molar mass of Li. The molar amount of consumedLi is related to the amount of Li consumed in the inner SEI layer(Qin
SE I (t)) by
νinLi (t) = Qin
SE I (t)/F, [22]
in which F is the Faraday constant. Combining Eqs. 21 and 22, thefollowing expression for the mass of consumed Li is obtained
minLi (t) = MLi Qin
SE I (t)
F. [23]
Comparing Eqs. 20 with 23, the inner SEI layer thickness can beexpressed by
lininc(t) = Qin
SE I (t)MLi
AρinwinLi F
, [24]
and the amount of charge involved to form the inner SEI layer can berepresented by
QinSE I (t) = Aρinwin
Li Flininc(t)
MLi. [25]
δ is defined as the fraction of the capacity loss related to the inner SEIlayer with respect to the total capacity loss consumed by both SEIlayers. δ is dependent on the aging conditions. This leads to
QinSE I (t) = δQSE I (t). [26]
The increase of the inner SEI layer thickness as a function of time isthen given by
lininc(t) = δQSE I (t)MLi
AρinwinLi F
. [27]
Finally, the Li consumption rate to form the SEI layer satisfies thefollowing Ordinary Differential Equation (ODE)
d QSE I (t)
dt= (6 + x(t))FρC6 A
4MC6
υe P0
× exp
⎛⎜⎝−
2(
lin0 + δQSE I (t)MLi
AρinwinLi F
) √2m�E(t)
-h
⎞⎟⎠ . [28]
The time dependent terms x(t) and �E(t) make it difficult to solvethis general expression for the SEI growth analytically. In order tosimplify this expression two different cases will be considered below.
SEI formation during storage.— In the case of storage, the capacityloss is only caused by the SEI formation, while the State-of-Chargeand �E are more or less constant. The SEI formation rate can thenbe expressed by
d QstSE I (t)
dt= (6 + x)FρC6 A
4MC6
υe P0
× exp
⎛⎜⎝−
2(
lin0 + δQst
SE I (t)MLi
AρinwinLi F
) √2m�E
-h
⎞⎟⎠ , [29]
where QstSE I (t) is the amount of Li+ charge captured [C] in both SEI
layers from t = 0 up to t during storage. The ODE Eq. 29 is nowsimple and can be solved by any standard integration scheme (e.g.Euler), which leads to
QstSE I (t) =
-h AwinLiρ
in F
2δMLi
√2m�E
ln
[1 + (6 + x)ρC6veδMLi P0
√2m�E
2MC6-hρinwin
Li
t
× exp
(−2lin
0
√2m�E
-h
)]. [30]
The SEI formation current can be written as
I stSE I = d Qst
SE I (t)
dt=
(6+x)FρC6 Ave P0
4MC6exp
(−2lin0
√2m�E
-h
)1 + (6+x)ρC6 veδMLi P0
√2m�E
2MC6-hρinwin
Lit exp
(−2lin0
√2m�E
-h
) .
[31]The derivations of Eq. 30 from Eq. 29 can be found from Appendix.
SEI formation during cycling.— In case of cycling, the mechanismof the SEI formation is somewhat more complex. The SEI layers arerather fragile. Some cracks in the SEI layers will be generated when thevolume of the graphite particles expands.42 The surface area availablefor SEI growth is fluctuating when batteries are cycled. The totalsurface area is composed of fresh surface (A f r ), and uniformly coveredsurface (Acov). It has been determined thatAcov ≈ 0.934A and A f r ≈0.066A.44 The SEI formed on the graphite surface can then be dividedinto three parts: (i) the SEI formed on the uniformly covered surface
) unless CC License in place (see abstract). ecsdl.org/site/terms_use address. Redistribution subject to ECS terms of use (see 131.155.81.84Downloaded on 2015-03-02 to IP
A862 Journal of The Electrochemical Society, 162 (6) A858-A869 (2015)
(QcovSE I (t)); (ii) fresh SEI formed on the newly formed surface induced
by the volume change expansion during (dis)charging (Q f rSE I (t)) and
(iii) the peeled SEI, formed during the previous (dis)charging cycles(Q peel
SE I (t)), i.e.
QcycSE I (t) = Qcov
SE I (t) + Q f rSE I (t) + Q peel
SE I (t). [32]
Considering the case of the inner SEI formation on the covered surface,the formation rate in each cycle is largely dependent on the thicknessof the already-existing layer, which grows with cycle number. TheSEI formation rate on this surface is defined by the general expressiongiven by Eq. 30. To simplify this equation a 50% State-of-Charge isassumed and �E(t) = �E(t) = �E , which is an unknown constant.The following expression can then be derived
d QcovSE I (t)
dt= (6.5)FρC6 Acov
4MC6
υe P0
× exp
(−2
(lin0 + lin
cov(t)) √
2m�E-h
), [33]
where QcovSE I (t) denotes the development of capacity loss to the SEI
of the covered surface, Acov is the covered surface area of graphite,t is the operating time after the start of the experiment, lin
cov(t) is theinner layer thickness growth, lin
0 is the initial inner SEI layer thicknessafter activation process at t = 0. The inner SEI formation rate at thecovered surface can then be expressed as
d QcovSE I (t)
dt= (6.5)FρC6 Acov
4MC6
υe P0
× exp
⎛⎜⎝−
2(
lin0 + δQcov
SE I (t)MLi
AcovρinwinLi F
) √2m�E
-h
⎞⎟⎠ . [34]
Similar to the case of storage, the capacity loss can be calculatedby integrating Eq. 34, which leads to
QcovSE I (t) =
-h AcovwinLiρ
in F
2δMLi
√2m�E
ln
[1 + 6.5ρC6veδMLi P0
√2m�E
2MC6-hρinwin
Li
t
× exp
(−2lin
0
√2m�E
-h
)]. [35]
Determination of Q f rSE I (t) and Q peel
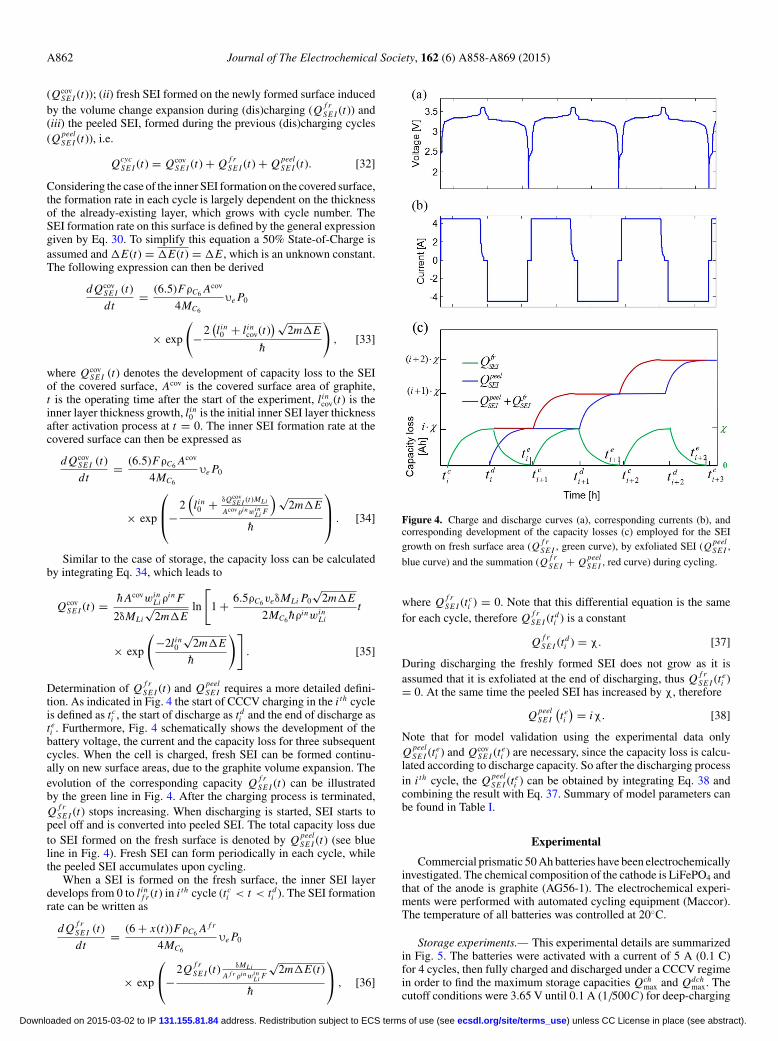
SE I requires a more detailed defini-tion. As indicated in Fig. 4 the start of CCCV charging in the i th cycleis defined as t c
i , the start of discharge as tdi and the end of discharge as
t ei . Furthermore, Fig. 4 schematically shows the development of the
battery voltage, the current and the capacity loss for three subsequentcycles. When the cell is charged, fresh SEI can be formed continu-ally on new surface areas, due to the graphite volume expansion. Theevolution of the corresponding capacity Q f r
SE I (t) can be illustratedby the green line in Fig. 4. After the charging process is terminated,Q f r
SE I (t) stops increasing. When discharging is started, SEI starts topeel off and is converted into peeled SEI. The total capacity loss dueto SEI formed on the fresh surface is denoted by Q peel
SE I (t) (see blueline in Fig. 4). Fresh SEI can form periodically in each cycle, whilethe peeled SEI accumulates upon cycling.
When a SEI is formed on the fresh surface, the inner SEI layerdevelops from 0 to lin
f r (t) in i th cycle (t ci < t < td
i ). The SEI formationrate can be written as
d Q f rSE I (t)
dt= (6 + x(t))FρC6 A f r
4MC6
υe P0
× exp
⎛⎝−
2Q f rSE I (t) δMLi
A f r ρinwinLi F
√2m�E(t)
-h
⎞⎠ , [36]
Figure 4. Charge and discharge curves (a), corresponding currents (b), andcorresponding development of the capacity losses (c) employed for the SEIgrowth on fresh surface area (Q f r
SE I , green curve), by exfoliated SEI (Q peelSE I ,
blue curve) and the summation (Q f rSE I + Q peel
SE I , red curve) during cycling.
where Q f rSE I (t c
i ) = 0. Note that this differential equation is the samefor each cycle, therefore Q f r
SE I (tdi ) is a constant
Q f rSE I (td
i ) = χ. [37]
During discharging the freshly formed SEI does not grow as it isassumed that it is exfoliated at the end of discharging, thus Q f r
SE I (t ei )
= 0. At the same time the peeled SEI has increased by χ, therefore
Q peelSE I
(t ei
) = iχ. [38]
Note that for model validation using the experimental data onlyQ peel
SE I (t ei ) and Qcov
SE I (t ei ) are necessary, since the capacity loss is calcu-
lated according to discharge capacity. So after the discharging processin i th cycle, the Q peel
SE I (t ei ) can be obtained by integrating Eq. 38 and
combining the result with Eq. 37. Summary of model parameters canbe found in Table I.
Experimental
Commercial prismatic 50 Ah batteries have been electrochemicallyinvestigated. The chemical composition of the cathode is LiFePO4 andthat of the anode is graphite (AG56-1). The electrochemical experi-ments were performed with automated cycling equipment (Maccor).The temperature of all batteries was controlled at 20◦C.
Storage experiments.— This experimental details are summarizedin Fig. 5. The batteries were activated with a current of 5 A (0.1 C)for 4 cycles, then fully charged and discharged under a CCCV regimein order to find the maximum storage capacities Qch
max and Qdchmax. The
cutoff conditions were 3.65 V until 0.1 A (1/500C) for deep-charging
) unless CC License in place (see abstract). ecsdl.org/site/terms_use address. Redistribution subject to ECS terms of use (see 131.155.81.84Downloaded on 2015-03-02 to IP
Journal of The Electrochemical Society, 162 (6) A858-A869 (2015) A863
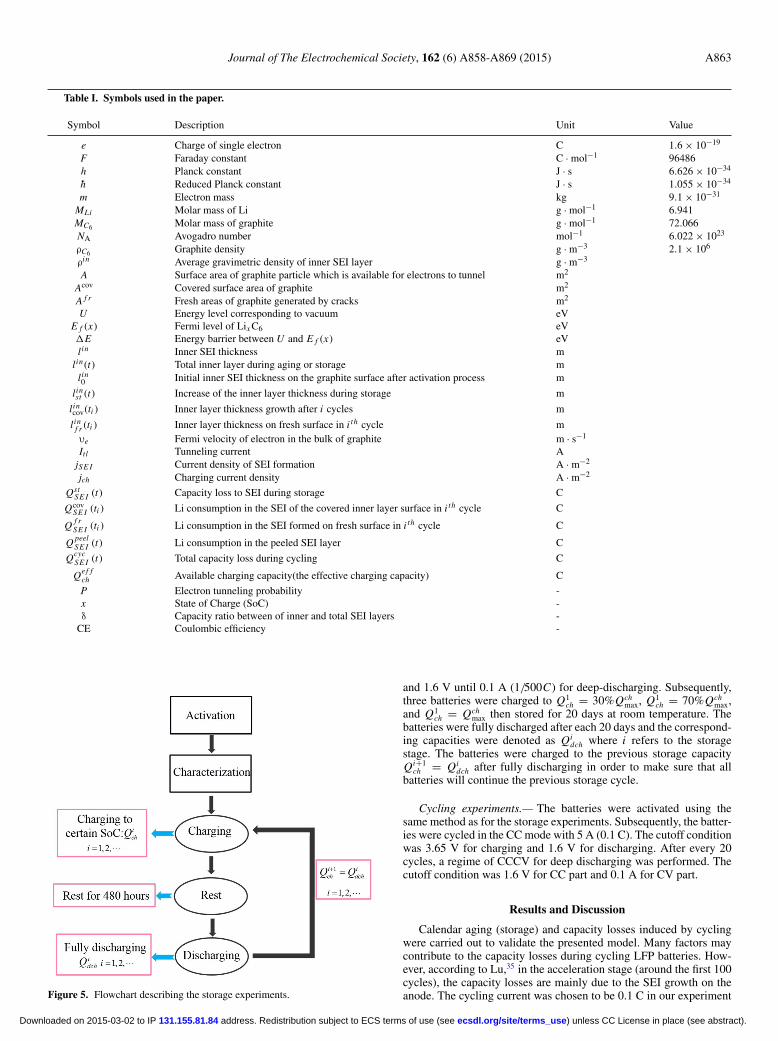
Table I. Symbols used in the paper.
Symbol Description Unit Value
e Charge of single electron C 1.6 × 10⁻¹⁹
F Faraday constant C · mol−1 96486h Planck constant J · s 6.626 × 10⁻³⁴
-h Reduced Planck constant J · s 1.055 × 10⁻³⁴
m Electron mass kg 9.1 × 10⁻³¹
MLi Molar mass of Li g · mol−1 6.941MC6 Molar mass of graphite g · mol−1 72.066NA Avogadro number mol−1 6.022 × 10²³
ρC6 Graphite density g · m−3 2.1 × 10⁶
ρin Average gravimetric density of inner SEI layer g · m−3
A Surface area of graphite particle which is available for electrons to tunnel m2
Acov Covered surface area of graphite m2
A f r Fresh areas of graphite generated by cracks m2
U Energy level corresponding to vacuum eVE f (x) Fermi level of Lix C6 eV�E Energy barrier between U and E f (x) eVlin Inner SEI thickness m
lin(t) Total inner layer during aging or storage mlin0 Initial inner SEI thickness on the graphite surface after activation process m
linst (t) Increase of the inner layer thickness during storage m
lincov(ti ) Inner layer thickness growth after i cycles m
linf r (ti ) Inner layer thickness on fresh surface in i th cycle mυe Fermi velocity of electron in the bulk of graphite m · s−1
Itl Tunneling current AjSE I Current density of SEI formation A · m−2
jch Charging current density A · m−2
QstSE I (t) Capacity loss to SEI during storage C
QcovSE I (ti ) Li consumption in the SEI of the covered inner layer surface in i th cycle C
Q f rSE I (ti ) Li consumption in the SEI formed on fresh surface in i th cycle C
Q peelSE I (t) Li consumption in the peeled SEI layer C
QcycSE I (t) Total capacity loss during cycling C
Qef fch Available charging capacity(the effective charging capacity) C
P Electron tunneling probability -x State of Charge (SoC) -δ Capacity ratio between of inner and total SEI layers -
CE Coulombic efficiency -
Figure 5. Flowchart describing the storage experiments.
and 1.6 V until 0.1 A (1/500C) for deep-discharging. Subsequently,three batteries were charged to Q1
ch = 30%Qchmax, Q1
ch = 70%Qchmax,
and Q1ch = Qch
max then stored for 20 days at room temperature. Thebatteries were fully discharged after each 20 days and the correspond-ing capacities were denoted as Qi
dch where i refers to the storagestage. The batteries were charged to the previous storage capacityQi+1
ch = Qidch after fully discharging in order to make sure that all
batteries will continue the previous storage cycle.
Cycling experiments.— The batteries were activated using thesame method as for the storage experiments. Subsequently, the batter-ies were cycled in the CC mode with 5 A (0.1 C). The cutoff conditionwas 3.65 V for charging and 1.6 V for discharging. After every 20cycles, a regime of CCCV for deep discharging was performed. Thecutoff condition was 1.6 V for CC part and 0.1 A for CV part.
Results and Discussion
Calendar aging (storage) and capacity losses induced by cyclingwere carried out to validate the presented model. Many factors maycontribute to the capacity losses during cycling LFP batteries. How-ever, according to Lu,35 in the acceleration stage (around the first 100cycles), the capacity losses are mainly due to the SEI growth on theanode. The cycling current was chosen to be 0.1 C in our experiment
) unless CC License in place (see abstract). ecsdl.org/site/terms_use address. Redistribution subject to ECS terms of use (see 131.155.81.84Downloaded on 2015-03-02 to IP
A864 Journal of The Electrochemical Society, 162 (6) A858-A869 (2015)
Table II. Model parameters and battery variables.
30% 70% 100% 0.1C
lin0 /nm b 2.834 2.834 2.834 2.834A/m2 b 292.15 292.15 292.15 292.15
δa c 6.1 · 10−3 4.5 · 10−3 4.5 · 10−3 4.6 · 10−3
Q0/Ah c 55.179 54.321 53.165 53.352�E/eV d 2.90 2.8 2.8 2.81
QcoSE I /Ah e 0.935 1.844 1.841 1.677
Q peelSE I /Ah e 0 0 0 1.134
AMSE/Ah e 0.0074 0.0057 0.0076 0.0026
aδ is optimized as average valueboptimized parameters, optimized simultaneouslycoptimized parameters, optimized independentlydvariables, calculated from literatureeoutput parameters
and the temperature was controlled at 20◦C in order to avoid severematerials decay and other factors contributing to capacity losses. Boththe reversible and irreversible capacity losses in the present work areattributed to the SEI formation on anode electrode.46,49–51 The LeastSquares method was used to determine the unknown parameters in thesimulations. The optimized parameters are listed in Table II. Both theexperimentally observed capacity losses and the simulated results areshown in Figs. 6 and 7. Fig. 6 shows the normalized capacity lossesas a function of time and Fig. 7 illustrates the absolute capacity lossupon cycling and storage.
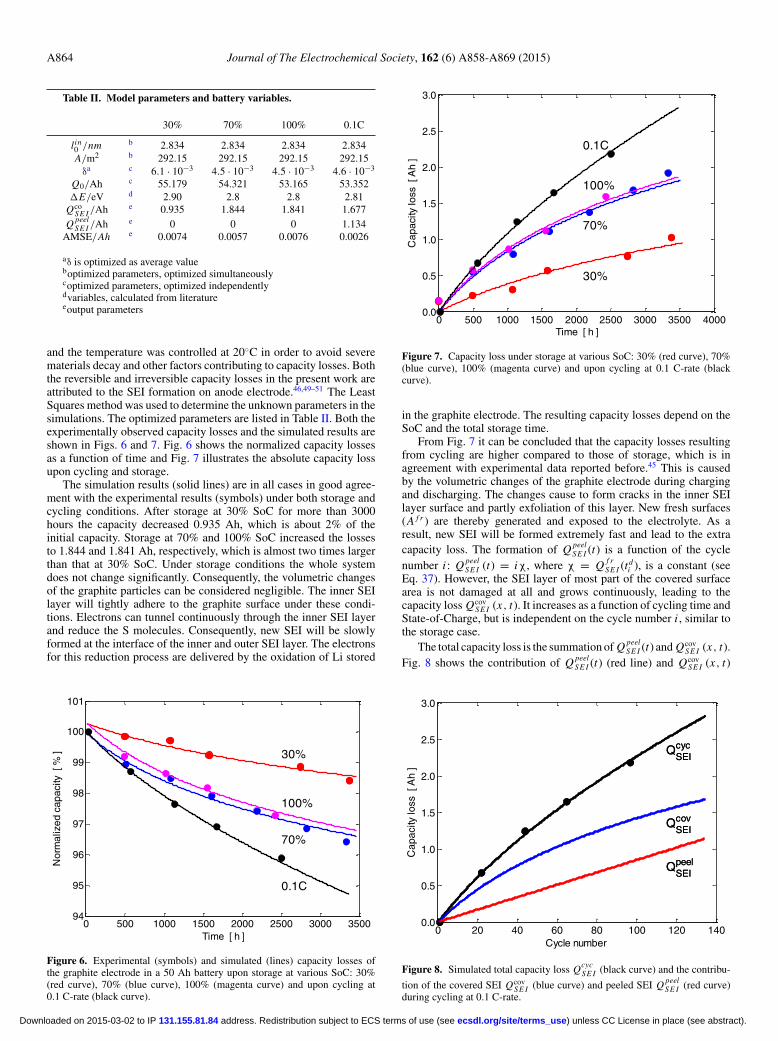
The simulation results (solid lines) are in all cases in good agree-ment with the experimental results (symbols) under both storage andcycling conditions. After storage at 30% SoC for more than 3000hours the capacity decreased 0.935 Ah, which is about 2% of theinitial capacity. Storage at 70% and 100% SoC increased the lossesto 1.844 and 1.841 Ah, respectively, which is almost two times largerthan that at 30% SoC. Under storage conditions the whole systemdoes not change significantly. Consequently, the volumetric changesof the graphite particles can be considered negligible. The inner SEIlayer will tightly adhere to the graphite surface under these condi-tions. Electrons can tunnel continuously through the inner SEI layerand reduce the S molecules. Consequently, new SEI will be slowlyformed at the interface of the inner and outer SEI layer. The electronsfor this reduction process are delivered by the oxidation of Li stored
0 500 1000 1500 2000 2500 3000 350094
95
96
97
98
99
100
101
Time [ h ]
Nor
mal
ized
cap
acity
[ %
] 30%
70%
100%
0.1C
Figure 6. Experimental (symbols) and simulated (lines) capacity losses ofthe graphite electrode in a 50 Ah battery upon storage at various SoC: 30%(red curve), 70% (blue curve), 100% (magenta curve) and upon cycling at0.1 C-rate (black curve).
0 500 1000 1500 2000 2500 3000 3500 40000.0
0.5
1.0
1.5
2.0
2.5
3.0
Time [ h ]
Cap
acity
loss
[ A
h ]
30%
70%
100%
0.1C
Figure 7. Capacity loss under storage at various SoC: 30% (red curve), 70%(blue curve), 100% (magenta curve) and upon cycling at 0.1 C-rate (blackcurve).
in the graphite electrode. The resulting capacity losses depend on theSoC and the total storage time.
From Fig. 7 it can be concluded that the capacity losses resultingfrom cycling are higher compared to those of storage, which is inagreement with experimental data reported before.45 This is causedby the volumetric changes of the graphite electrode during chargingand discharging. The changes cause to form cracks in the inner SEIlayer surface and partly exfoliation of this layer. New fresh surfaces(A f r ) are thereby generated and exposed to the electrolyte. As aresult, new SEI will be formed extremely fast and lead to the extracapacity loss. The formation of Q peel
SE I (t) is a function of the cyclenumber i : Q peel
SE I (t) = iχ, where χ = Q f rSE I (td
i ), is a constant (seeEq. 37). However, the SEI layer of most part of the covered surfacearea is not damaged at all and grows continuously, leading to thecapacity loss Qcov
SE I (x, t). It increases as a function of cycling time andState-of-Charge, but is independent on the cycle number i , similar tothe storage case.
The total capacity loss is the summation of Q peelSE I (t) and Qcov
SE I (x, t).Fig. 8 shows the contribution of Q peel
SE I (t) (red line) and QcovSE I (x, t)
0 20 40 60 80 100 120 1400.0
0.5
1.0
1.5
2.0
2.5
3.0
Cycle number
Cap
acity
loss
[ A
h ]
QpeelSEI
QcovSEI
QcycSEI
QpeelSEI
QcovSEI
QcycSEI
Figure 8. Simulated total capacity loss QcycSE I (black curve) and the contribu-
tion of the covered SEI QcovSE I (blue curve) and peeled SEI Q peel
SE I (red curve)during cycling at 0.1 C-rate.
) unless CC License in place (see abstract). ecsdl.org/site/terms_use address. Redistribution subject to ECS terms of use (see 131.155.81.84Downloaded on 2015-03-02 to IP
Journal of The Electrochemical Society, 162 (6) A858-A869 (2015) A865
0 500 1000 1500 2000 2500 3000 35002.83
2.85
2.87
2.89
2.91
2.93
Time [ h ]
Inne
r lay
er th
ickn
ess
[ nm
]
30%
70%100%
0.1C
Figure 9. Simulated Inner SEI layer growth under various operating condi-tions: 30% (red curve), 70% (blue curve), 100% (magenta curve) and cyclingat 0.1 C-rate (black curve).
(blue line) to the total capacity loss (black line). The simulations areagain compared to the experimental results (black symbols). As aguedabove there is a linear relationship between Q peel
SE I (t) and the cyclenumber. It can be seen that the Q peel
SE I (t) is smaller than QcovSE I (x, t) at
the beginning of cycling, but that it is still considerably contributes tothe overall capacity loss.
Fig. 9 shows the simulated growth of the inner SEI layer thick-ness upon storage and cycling. It has been well documented that theSEI layer is composed of the inner and outer SEI layer.12 The maincomponents of inner layer were attributed to inorganic Li salts. Thethickness of inner layer was measured by Edstrom,16 using X-rayphotoelectron spectroscopy (XPS). According to this study, the in-ner SEI layer thickness is around 20 Å. The thickness of this layersimulated, using the present model (see Fig. 9), is in a good agree-ment with these experimental results. Obviously, the simulated theinner SEI-layer thickness in Fig. 9 should be considered as an averagethickness. Although the factors affecting the formation of the innerSEI layer are still under discussion it has been identified that the elec-trode potential has a significant influence on the products of the SEIformation.18 When the batteries are stored at 70 and 100% SoC, thegraphite electrode potentials are close in magnitude, which indeed re-sults in a similar growth rate of the inner SEI layer (see Fig. 9). In thecase of storage at a lower SoC (30%), the inner layer development issignificantly slower in line with the more positive electrode potentialin Fig. 3.
The growth of the outer SEI layer is shown in Fig. 10. It revealsa similar growth trend as the inner SEI layer but at a significantlyhigher rate. In the case of high SoC storage and cycling, the outerSEI layer increased with about 50 nm, while this amounts to 25 nmwhen stored at 30% SoC. The initial thickness of outer SEI layer wasanalyzed to be approximately 44 nm after the activation process hadbeen completed. This value has been determined by extrapolating theinitial cycles. The outer SEI layer grows much faster than inner SEIlayer due to the relatively small value of δ. This is obviously also inline with the fact that electron tunneling stops to take place when theinner SEI layer is becoming too thick.
According to Eq. 28 the SEI formation rate depends on the energybarrier �E , the inner layer thickness, the State-of-Charge and thesurface area. When batteries are produced in the same batch, these allhave a similar initial SEI inner layer thickness and surface areas. So theenergy barrier �E and State-of-Charge are the most important factorsdetermining the SEI formation rate of these batteries. The energybarrier, in turn, is dependent on the graphite electrode potential, which
0 500 1000 1500 2000 2500 3000 350040
50
60
70
80
90
Time [ h ]
Out
er la
yer t
hick
ness
[ n
m ]
30%
70%100%
0.1C
Figure 10. Simulated outer SEI layer growth under various operating condi-tions: 30% (red curve), 70% (blue curve), 100% (magenta curve) and cyclingat 0.1 C-rate (black curve).
is determined by the State-of-Charge. The energy barrier values arecalculated on data given in Ref. 38.
Fig. 11 shows the normalized current consumed by the SEI forma-tion ( jSE I ) during storage at various State-of-Charge and cycling. TheSEI formation current density is 4.8μA·m−2 in the initial stages of cy-cling and decreases to 2.0μA·m−2 after 3000 hours. During storage thecurrent density monotonically decreased from 4.5μA · m−2 at 100%SoC, 4.0μA · m−2 at 70% SoC and 1.6μA · m−2 at 30% SoC. FromEq. 33 a reciprocal relationship between the capacity loss and storagetime is indeed predicted. The higher current density upon cycling mustagain be attributed to the contribution of the new surface generatedby the volumetric changes. The model not only predicts the calendarlife and cycle life performance of LPF batteries but can also predictthe impedance increase observed upon cycling, which is caused bythe peeled-off SEI particles blocking the pores of the graphite elec-trode. Furthermore, the present tunneling model can be coupled bytaking into account electrical double layer (dis)charging effects andthe electrochemical charge transfer reactions (Eqs. 1 and 2).47
It is generally accepted that the Coulombic Efficiency (CE) is animportant factor, determining the overall performance of rechargeable
0 500 1000 1500 2000 2500 3000 35000
1.0
2.0
3.0
4.0
5.0
Time [ h ]
Cur
rent
den
sity
of S
EI f
orm
atio
n j S
EI [
uA
/ m
2 ]
30%
70%
100%
0.1C
Figure 11. Calculated current density used for SEI formation at various op-erating conditions: 30% (red curve), 70% (blue curve), 100% (magenta curve)and cycling at 0.1 C-rate (black curve).
) unless CC License in place (see abstract). ecsdl.org/site/terms_use address. Redistribution subject to ECS terms of use (see 131.155.81.84Downloaded on 2015-03-02 to IP
A866 Journal of The Electrochemical Society, 162 (6) A858-A869 (2015)
0 20 40 60 80 100 120 1402.0
3.0
4.0
5.0
6.0
SE
I for
min
g ra
te j
SE
I [ u
A /
m2 ]
Cycle number
j SEI
CE
99.97
99.98
99.99
Cou
lom
bic
Effi
cien
cy [
% ]
Figure 12. Current density ( jSE I ) of SEI formation (black line) and calculatedCoulombic Efficiency (CE) upon cycling (red line).
batteries. CE has been generally defined as CE = Qidch
Qich
and does not
get more detailed information of the origin of the system inefficiency.A modified definition of the effective Coulombic Efficiency (CEe f f )is therefore proposed here
CEe f f = jch − jSE I
jch× 100%, [39]
which considers the efficiency of the charging process only and henceconsiders the fundamentals behind the inefficiency. The current usedfor the main electrochemical storage reaction is given by
jch − jSE I = jchCEe f f . [40]
Eq. 40 is very similar to the model proposed by Dahn.41 Multiplyingboth sides of Eq. 40 with the charging time, the effective chargingefficiency (Qef f
ch ) can be described by
Qef fch = QchCEe f f . [41]
As discussed before, the SEI formation current jSE I decreases withincreasing inner SEI layer. Since the cycling current of 0.1 C is ratherlow, it is reasonable that capacity loss caused by power fade is ignored.
0 100 200 300 400 500 600 700 8000.0
0.5
1.0
1.5
2.0
2.5
3.0
3.5
Surface area [ m2 ]
Cap
acity
loss
[ A
h ]
t1
t2
t3
Figure 13. Calculated capacity loss as a function of surface area for threedifferent storage times: t1 = 1000 hours (black line), t2 = 2000 hours (blueline), t3 = 3000 hours (red line).
0 10 20 30 40 500
2.0
4.0
6.0
8.0
10.0
Particle size [ um ]
Cap
acity
loss
[ A
h ]
t1t2
t3
Figure 14. Capacity loss as a function of graphite particle size for differentstorage times: t1 = 1000 hours (black line), t2 = 2000 hours (blue line),t3 = 3000 hours (red line).
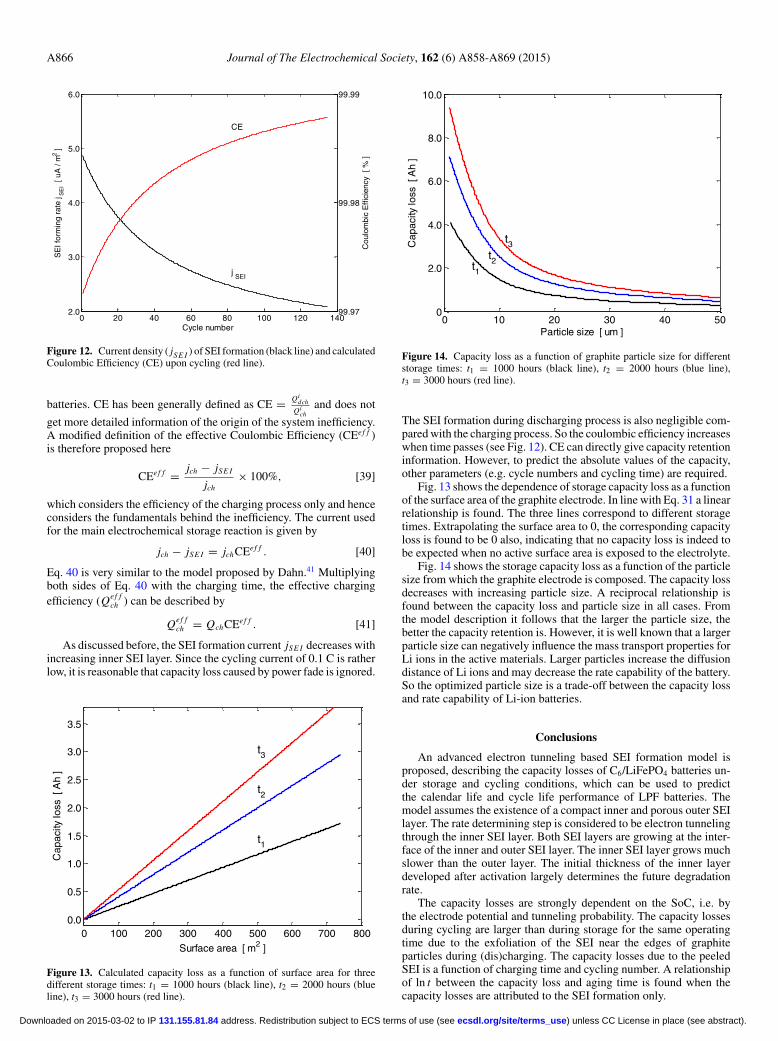
The SEI formation during discharging process is also negligible com-pared with the charging process. So the coulombic efficiency increaseswhen time passes (see Fig. 12). CE can directly give capacity retentioninformation. However, to predict the absolute values of the capacity,other parameters (e.g. cycle numbers and cycling time) are required.
Fig. 13 shows the dependence of storage capacity loss as a functionof the surface area of the graphite electrode. In line with Eq. 31 a linearrelationship is found. The three lines correspond to different storagetimes. Extrapolating the surface area to 0, the corresponding capacityloss is found to be 0 also, indicating that no capacity loss is indeed tobe expected when no active surface area is exposed to the electrolyte.
Fig. 14 shows the storage capacity loss as a function of the particlesize from which the graphite electrode is composed. The capacity lossdecreases with increasing particle size. A reciprocal relationship isfound between the capacity loss and particle size in all cases. Fromthe model description it follows that the larger the particle size, thebetter the capacity retention is. However, it is well known that a largerparticle size can negatively influence the mass transport properties forLi ions in the active materials. Larger particles increase the diffusiondistance of Li ions and may decrease the rate capability of the battery.So the optimized particle size is a trade-off between the capacity lossand rate capability of Li-ion batteries.
Conclusions
An advanced electron tunneling based SEI formation model isproposed, describing the capacity losses of C6/LiFePO4 batteries un-der storage and cycling conditions, which can be used to predictthe calendar life and cycle life performance of LPF batteries. Themodel assumes the existence of a compact inner and porous outer SEIlayer. The rate determining step is considered to be electron tunnelingthrough the inner SEI layer. Both SEI layers are growing at the inter-face of the inner and outer SEI layer. The inner SEI layer grows muchslower than the outer layer. The initial thickness of the inner layerdeveloped after activation largely determines the future degradationrate.
The capacity losses are strongly dependent on the SoC, i.e. bythe electrode potential and tunneling probability. The capacity lossesduring cycling are larger than during storage for the same operatingtime due to the exfoliation of the SEI near the edges of graphiteparticles during (dis)charging. The capacity losses due to the peeledSEI is a function of charging time and cycling number. A relationshipof ln t between the capacity loss and aging time is found when thecapacity losses are attributed to the SEI formation only.
) unless CC License in place (see abstract). ecsdl.org/site/terms_use address. Redistribution subject to ECS terms of use (see 131.155.81.84Downloaded on 2015-03-02 to IP
Journal of The Electrochemical Society, 162 (6) A858-A869 (2015) A867
Both the particle size and particle surface area of graphite have alarge influence on the capacity losses. A linear relationship betweenthe surface area and capacity loss is observed while a reciprocal re-lationship between the particle size and the capacity loss is foundin accordance with the model. The SEI formation currents are alsodiscussed. It was found that those currents decline exponentially withtime. A new Coulombic Efficiency definition based on SEI formationcurrent is proposed, describing the charging efficiency.
Acknowledgments
The China Scholarship Committee (CSC) is acknowledged forfunding the first author studying in Department of Chemistry andChemical Engineering of the Eindhoven University of Technology.The second and last authors appreciate the financial support fromEniac BATTMAN project (Battery Management with Solar PoweredDevices).
Appendix
1. Derivation of the tunneling probability
For a one-dimensional rectangular barrier model (see Fig. 2), the space can be dividedinto 3 parts: region I corresponds to graphite electrode, where we suppose x ≤ 0; regionII corresponds to the inner SEI, where 0 ≤ x ≤ lin ; region III corresponds to the solventside, where x ≥ lin . The wave function of electrons in the various regions are calculatedaccording to the stationary Schrodinger equation.
In region I, the Schrodinger equation takes the following form
d2ψ1
dx2+ 2m
-h2 (E − U1) ψ1 = 0, [A1]
where ψ1 is the electron wave function in region I. The solution of Eq. A1 yields
ψ1 = eik1 x + re−ik1 x , [A2]
and therefore
dψ1
dx= ik1
(eik1 x − re−ik1 x ) , [A3]
where k1 =√
2m(E−U1)-h2 and r are constants to be determined from the boundary
conditions.Similarly, the wave function in region II can be calculated, according to
d2ψ
dx2+ 2m
-h2 (E − U ) ψ = 0, [A4]
where ψ is the electron wave function in region II. Solving Eq. A4 leads to
ψ = aeiαx + be−iαx , [A5]
and
dψ
dx= iα(aeiαx − be−iαx ), [A6]
where α =√
2m(E−U )-h2 = i
√2m(U−E)
-h2 , a and b are constants.
In region III, the Schrodinger equation can be written as
d2ψ2
dx2+ 2m
-h2 (E − U2) ψ2 = 0, [A7]
where ψ2 is the electron wave function, which leads to
ψ2 = ceik2 x , [A8]
and
dψ2
dx= ik2ceik2 x , [A9]
where k2 =√
2m(E−U2)-h2 and c are constants.
Considering that both the wave function and its derivative are continuous, the con-tinuity conditions must be applied at the boundary. As a result, the following system ofequations holds ⎧⎪⎪⎪⎪⎪⎪⎪⎪⎨
⎪⎪⎪⎪⎪⎪⎪⎪⎩
ψ1 (x = 0) = ψ (x = 0) ,
ψ(x = lin ) = ψ2(x = lin ),
dψ1
dx(x = 0) = dψ
dx(x = 0),
dψ
dx(x = lin ) = dψ2
dx(x = lin ).
[A10]
Substituting the corresponding boundary values, described by Eqs. A2, A3, A5, A6, A8and A9, into Eq. A10 leads to the following system
−r + a + bk1r + αa − αb
aeiαlin + be−iαlin − ceiαlin
αaeiαlin − αbe−iαlin − ck2eiαlin
====
1,
k1,
0,
0.
[A11]
This system of Eqs. A11 can be written in form of
AV = Z, [A12]
where
A =
⎛⎜⎜⎜⎝
−1 1 1 0k1 α −α 0
0 eiαlin e−iαlin −eik2lin
0 αeiαlin −αe−iαlin −k2eik2lin
⎞⎟⎟⎟⎠ , V =
⎛⎜⎜⎝
rabc
⎞⎟⎟⎠ , Z =
⎛⎜⎜⎝
1k1
00
⎞⎟⎟⎠ .
[A13]A straightforward calculation leads to
c = 4αk1e(α−k2 i)l
α (k1 + k2)(e2αl + 1
) − i(k1k2 − α2
) (e2αl − 1
) , [A14]
which is known as ‘transmission coefficient’. Note that the magnitude of the complexnumber c, given in Eq. A14 determines the amplitude of the complex function ψ2 accord-ing to Eq. A8. However, the function of interest is not the transmission coefficient itselfbut rather a transmission probability, given by the equation
P = k2
k1c c, [A15]
where c is a complex conjugate of c, i.e.
c = 4αk1e(α+k2 i)l
α (k1 + k2)(e2αl + 1
) + i(k1k2 − α2
) (e2αl − 1
) . [A16]
Straightforward multiplication leads to the tunneling probability of electrons on theirFermi level
and m is mass of electron, U1 is corresponding to the graphite Fermi level, U1 = −4.4eV,U2 is the solvent LUMO, which is determined by the state of the solvent, e.g. when 3 ECmolecules combine with one Li ion, then the LUMO of each solvent is −2.99 eV.39
Eq. A23 has much simpler form, widely accepted in the literature, but usually assumesP0 = 1, which clearly violates Eq. A24. It is interesting to find out the behavior of P0
as a function of the underlying parameters k1, k2 and α. Eq. A24 can be rewritten in thefollowing form
P0 = 16
k1
k2+ k2
k1+ k1k2
α2+ α2
k1k2
. [A25]
) unless CC License in place (see abstract). ecsdl.org/site/terms_use address. Redistribution subject to ECS terms of use (see 131.155.81.84Downloaded on 2015-03-02 to IP
A868 Journal of The Electrochemical Society, 162 (6) A858-A869 (2015)
02
46
810 0
24
68
10
0
1
2
3
4
yx
P0
Figure A1. P0 calculated according to Eq. A26, as function of x and y.
From Eq. A25 it can be seen that P0 depends only on two combinations of parameters.Defining x = k1
k2and y = k1
α
k2α
will lead to
P0 = 16
x + 1
x+ y + 1
y
. [A26]
The behavior of P0 as function of x and y is illustrated in Fig. A1.One can see that P0 is symmetric with respect to x and y. It varies between 0 and
4, reaching the maximal value when x = y = 1, which corresponds to the symmetriccase k1 = k2 = α. That implies that using the simplified Eq. A23 with P0 = 1 can leadto considerable errors. This error can overestimate or underestimate the real tunnelingprobability.
2. Derivation of Eq. 30 from Eq. 29
d QstSE I (t)
dt= (6 + x)FρC6 A
4MC6
υe P0
× exp
⎛⎜⎜⎝−
2
(lin0 + δQst
SE I (t)MLi
AρinwinLi F
)√2m�E
-h
⎞⎟⎟⎠ . [29]
Moving the capacity term QstSE I (t) to the left side and time term dt to the right side results
in
exp
(2δQst
SE I (t)MLi
√2m�E
AρinwinLi F-h
)d Qst
SE I (t)
= (6 + x)FρC6 A
4MC6
υe P0 exp
(− 2lin
0
√2m�E-h
)dt. [A27]
When time t = 0, the capacity loss QstSE I (0) = 0, then integrating both sides of Eq. A27
yields ∫ QstSE I (t)
0exp
(2δQst
SE I (t)MLi
√2m�E
AρinwinLi F-h
)d Qst
SE I (t)
=∫ t
0
(6 + x)FρC6 A
4MC6
υe P0 exp
(− 2lin
0
√2m�E-h
)dt, [A28]
therefore-h Awin
Li ρin F
2δMLi
√2m�E
[exp
(2δQst
SE I (t)MLi
√2m�E
AρinwinLi F-h
)− 1
]
= (6 + x)FρC6 Aυet
4MC6
P0 exp
(− 2lin
0
√2m�E-h
). [A29]
Shifting the multiplier of left side to the right side leads to
exp
(2δQst
SE I (t)MLi
√2m�E
AρinwinLi F-h
)− 1 = (6 + x)ρC6 veδMLi P0
√2m�E
2MC6-hρinwin
Li
t
× exp
(−2lin
0
√2m�E
-h
). [A30]
Moving the second term on the left side to the right side, one obtains
exp
(2δQst
SE I (t)MLi
√2m�E
AρinwinLi F-h
)= 1 + (6 + x)ρC6 veδMLi P0
√2m�E
2MC6-hρinwin
Li
t
× exp
(−2lin
0
√2m�E
-h
). [A31]
Calculating the logarithm of both sides, results in
2δQstSE I (t)MLi
√2m�E
AρinwinLi F-h
= ln
[1 + (6 + x)ρC6 veδMLi P0
√2m�E
2MC6-hρinwin
Li
t exp
(−2lin
0
√2m�E
-h
)]. [A32]
Finally, the capacity loss is obtained as a function of time, according to
QstSE I (t) =
-h AwinLi ρ
in F
2δMLi
√2m�E
ln
[1 + (6 + x)ρC6 veδMLi P0
√2m�E
2MC6-hρinwin
Li
t
× exp
(−2lin
0
√2m�E
-h
)]. [30]
References
1. X.-Z. Liao, Z.-F. Ma, Q. Gong, Y.-S. He, L. Pei, and L.-J. Zeng, Electrochem Commun,10 (5), 691 (2008).
2. P. He, X. Zhang, Y.-G. Wang, L. Cheng, and Y.-Y. Xia, Journal of the ElectrochemicalSociety, 155 (2), A144 (2008).
3. Y. Zhang, C.-Y. Wang, and X. Tang, Journal of Power Sources, 196 (3), 1513 (2011).4. T. G. Zavalis, M. Klett, M. H. Kjell, M. Behm, R. W. Lindstrom, and G. Lindbergh,
Electrochimica Acta, 110, 335 (2013).5. C. Weng, Y. Cui, J. Sun, and H. Peng, Journal of Power Sources, 235, 36 (2013).6. L.-X. Yuan, Z.-H. Wang, W.-X. Zhang, X.-L. Hu, J.-T. Chen, Y.-H. Huang, and
J. B. Goodenough, Energy & Environmental Science, 4(2), 269 (2011).7. M. Broussely, S. Herreyre, P. Biensan, P. Kasztejna, K. Nechev, and R. J. Staniewicz,
Journal of Power Sources, 97, 13 (2001).8. S. Shi, P. Lu, Z. Liu, Y. Qi, L. G. Hector Jr., H. Li, and S. J. Harris, Journal of the
American Chemical Society, 134(37), 15476 (2012).9. P. Arora, R. E. White, and M. Doyle, Journal of the Electrochemical Society, 145(10),
3647 (1998).10. S. Yamaguchi, H. Asahina, K. A. Hirasawa, T. Sato, and S. Mori, Molecular Crystals
and Liquid Crystals Science and Technology Section a-Molecular Crystals and LiquidCrystals ,322, 239 (1998).
11. D. Aurbach, B. Markovsky, I. Weissman, E. Levi, and Y. Ein-Eli, ElectrochimicaActa, 45(1-2), 67 (1999).
12. D. Aurbach, Journal of Power Sources, 89(2), 206 (2000).13. A. M. Andersson and K. Edstrom, Journal of the Electrochemical Society, 148(10),
A1100 (2001).14. D. Aurbach, E. Zinigrad, Y. Cohen, and H. Teller, Solid State Ionics, 148(3-4), 405
(2002).15. A. M. Andersson, M. Herstedt, A. G. Bishop, and K. Edstrom, Electrochimica Acta,
47 (12), 1885 (2002).16. A. M. Andersson, A. Henningson, H. Siegbahn, U. Jansson, and K. Edstrom, Journal
of Power Sources, 119–121, 522 (2003).17. E. Peled, D. Golodnitsky, A. Ulus, and V. Yufit, Electrochimica Acta, 50(2-3), 391
(2004).18. S. Leroy, F. Blanchard, R. Dedryvere, H. Martinez, B. Carre, D. Lemordant, and
D. Gonbeau, Surface and Interface Analysis, 37(10), 773 (2005).19. K. Edstrom, M. Herstedt, and D. P. Abraham, Journal of Power Sources, 153(2), 380
(2006).20. S. Leroy, H. Martinez, R. Dedryvere, D. Lemordant, and D. Gonbeau, Applied Surface
Science, 253(11), 4895 (2007).21. M. Lu, H. Cheng, and Y. Yang, Electrochimica Acta, 53(9), 3539 (2008).22. P. Verma, P. Maire, and P. Novak, Electrochimica Acta, 55(22), 6332 (2010).23. K. Xu and A. von Cresce, Journal of Materials Chemistry, 21(27), 9849 (2011).24. A. J. Smith, J. C. Burns, X. Zhao, D. Xiong, and J. R. Dahn, Journal of the Electro-
chemical Society, 158(9), S23 (2011).25. F. M. Wang, M. H. Yu, Y. J. Hsiao, Y. Tsai, B. J. Hwang, Y. Y. Wang, and C. C. Wan,
Int J Electrochem Sc, 6(4), 1014 (2011).26. J. T. Lee, N. Nitta, J. Benson, J. Magasinski, T. F. Fuller, and G. Yushin, Carbon, 52,
388 (2013).27. M. Tang, S. Lu, and J. Newman, Journal of the Electrochemical Society, 159(11),
A1775 (2012).28. J. Christensen and J. Newman, Journal of the Electrochemical Society, 151(11),
A1977 (2004).29. E. Peled, Journal of the Electrochemical Society, 126 (12), 2047 (1979).30. E. Peled, D. Golodnitsky, and G. Ardel, Journal of the Electrochemical Society,
144(8), L208 (1997).
) unless CC License in place (see abstract). ecsdl.org/site/terms_use address. Redistribution subject to ECS terms of use (see 131.155.81.84Downloaded on 2015-03-02 to IP
Journal of The Electrochemical Society, 162 (6) A858-A869 (2015) A869
31. J. Christensen and J. Newman, Journal of the Electrochemical Society, 152(4), A818(2005).
32. A. Awarke, S. Pischinger, and J. Ogrzewalla, Journal of the Electrochemical Society,160(1), A172 (2013).
33. M. B. Pinson and M. Z. Bazant, Journal of the Electrochemical Society, 160(2), A243(2013).
34. Y. Xie, J. Li, and C. Yuan, Journal of Power Sources, 248, 172 (2014).35. X. Lin, J. Park, L. Liu, Y. Lee, A. M. Sastry, and W. Lu, Journal of the Electrochemical
Society, 160(10), A1701 (2013).36. H. J. Ploehn, P. Ramadass, and R. E. White, Journal of the Electrochemical Society,
151(3), A456 (2004).37. P. Lu and S. J. Harris, Electrochemistry Communications, 13(10), 1035 (2011).38. G. K. Wertheim, P. Vanattekum, and S. Basu, Solid State Communications , 33(11),
1127 (1980).39. Y. Wu, N. Hu, L. Wei, and Y. Dai, Ecs Electrochemistry Letters, 3(6), A50 (2014).40. D. Aurbach, M. L. Daroux, P. W. Faguy, and E. Yeager, Journal of the Electrochem-
ical Society, 134(7), 1611 (1987).41. A. J. Smith, J. C. Burns, and J. R. Dahn, Electrochemical and Solid State Letters,
13(12), A177 (2010).42. M. B. Pinson and M. Z. Bazant, Journal of the Electrochemical Society, 160(2), A243
(2012).
43. R. Deshpande, M. Verbrugge, Y.-T. Cheng, J. Wang, and P. Liu, Journal of theElectrochemical Society, 159(10), A1730 (2012).
44. Y. Qi, H. Guo, L. G. Hector Jr., and A. Timmons, Journal of the ElectrochemicalSociety, 157(5), A558 (2010).
45. M. Safari and C. Delacourt, Journal of the Electrochemical Society, 158(10), A1123(2011).
46. N. N. Sinha, A. J. Smith, J. C. Burns, G. Jain, K. W. Eberman, E. Scott,J. P. Gardner, and J. R. Dahn, Journal of the Electrochemical Society, 158(10), A1194(2011).
47. M. A. Quiroga, K. T. Xue, T. K. Nguyen, M. Tułodziecki, H. Huang, andA. A. Franco, Journal of the Electrochemical Society, 161(8), E3302 (2014).
48. D. Li, D. Danilov, Z. H. Zhang Chen, Y. Yang, and P. H. L. Notten, ECS Transactions,62(1) 1 (2014).
49. M. Safari and C. Delacourt, Journal of the Electrochemical Society, 158(12), A1436(2011).
50. R. Spotnitz, Journal of Power Sources, 113, 72 (2003).51. S. E. Sloop, J. B. Kerr, and K. Kinoshita, Journal of Power Sources, 121, 330 (2003).52. G. W. Castellan, Physical Chemistry, 3rd edn. (Addison-Wesley Pub. Co., London
1983).53. H. S. Taylor and S. Glasstone, A treatise on Physical Chemistry: a cooperative effort
by a group of physical chemists, vol. 1, Van Nostrand, 1947.
) unless CC License in place (see abstract). ecsdl.org/site/terms_use address. Redistribution subject to ECS terms of use (see 131.155.81.84Downloaded on 2015-03-02 to IP