Modeling the Spatial and Temporal Variation of Monthly and Seasonal Precipitation on the Nevada Test Site and Vicinity, 1960-2006 Open-File Report 2007–1269 U.S. Department of the Interior U.S. Geological Survey
Transcript
Modeling the Spatial and Temporal Variation of Monthly and Seasonal Precipitation on the Nevada Test Site and Vicinity, 1960-2006
Open-File Report 2007–1269
U.S. Department of the Interior U.S. Geological Survey
Modeling the Spatial and Temporal Variation of Monthly and Seasonal Precipitation on the Nevada Test Site and Vicinity, 1960-2006
By Joan B. Blainey, Robert H. Webb, and Christopher S. Magirl
Open-File Report 2007–1269
U.S. Department of the Interior U.S. Geological Survey ii
iii
U.S. Department of the Interior DIRK KEMPTHORNE, Secretary
U.S. Geological Survey Mark D. Myers, Director
U.S. Geological Survey, Reston, Virginia 2007
For product and ordering information: World Wide Web: http://www.usgs.gov/pubprod Telephone: 1-888-ASK-USGS
For more information on the USGS—the Federal source for science about the Earth, its natural and living resources, natural hazards, and the environment: World Wide Web: http://www.usgs.gov Telephone: 1-888-ASK-USGS
Suggested citation: Blainey, J.B., Webb, R.H., Magirl, C.S., 2007: Modeling the Spatial and Temporal Variation of Monthly and Seasonal Precipitation on the Nevada Test Site and Vicinity, 1960-2006: U.S. Geological Survey Open-File Report 2007-1269, p. 40
Any use of trade, product, or firm names is for descriptive purposes only and does not imply endorsement by the U.S. Government.
Although this report is in the public domain, permission must be secured from the individual copyright owners to reproduce any copyrighted material contained within this report.
Purpose and Scope ........................................................................................................................................................4 Acknowledgements........................................................................................................................................................4
Study Area ...........................................................................................................................................................................4 Geography and Topography .........................................................................................................................................4 Climate ..............................................................................................................................................................................4
Precipitation Data and Geospatial Characteristics......................................................................................................7 Data Sources and Quality .............................................................................................................................................7 Data Trends With Elevation and Position.................................................................................................................10 Time-Series Analysis ...................................................................................................................................................13
Multivariate Statistical Analyses...................................................................................................................................15 Results of Spatial Interpolation of Precipitation.........................................................................................................16
Period of Record Precipitation Averages ................................................................................................................16 Seasonal Precipitation for 1969, 1989, and 1998 .....................................................................................................21 Seasonal Coefficients of Variations ..........................................................................................................................26 Time Series at Specific Sites......................................................................................................................................31
Study Limitations ..............................................................................................................................................................32 Conclusions .......................................................................................................................................................................32 References Cited ..............................................................................................................................................................33
Figures Figure 1. Prominent topographic features illustrated with a hillshade model based on a 30-m digital
elevation model and selected place names of the Nevada Test Site, Nevada. The Nevada Test Site boundary is outlined in black, and the Beatley plots are discussed in the text and on figure 15. .........2
Figure 2. Locations of precipitation gages of the Nevada Test Site and vicinity, Nevada, illustrated with 30-m digital elevation model (DEM) and hillshade based on the 30-m DEM. The precipitation gage symbol represents the data source. The model domain is the extent of the DEM...................................3
Figure 3. Mean annual precipitation at the Nevada Test Site presented by source of data and time period, as a function of elevation. ...................................................................................................................................6
Figure 4. Median monthly gage precipitation at the Nevada Test Site from 1960 to 2006. Error bars represent the 25th and 75th percentiles. .............................................................................................................6
Figure 5. Annual number of actively recording precipitation gages in the period of 1960 to 2006 for the Nevada Test Site. A. The average elevation of the active precipitation gage network is given in red. B. and C. The number of actively recording precipitation gages by data source.....................................8
Figure 6. Change in annual and seasonal precipitation with elevation for two periods of record on the Nevada Test Site. A. 1960 to 2006. B. 1992 to 1996........................................................................................11
Figure 7. Time series of annual precipitation on the Nevada Test Site from 1960 to 2006. The dashed line is the mean annual precipitation averaged over all the gages for the same time period, and the red squares represent the average elevation of the actively recording precipitation stations..................13
v
Figure 8. Time series of winter (November through April) and summer (May through October) season precipitation, an average of all the precipitation gages, from 1960 to 2006 for the Nevada Test Site.................................................................................................................................................................................14
Figure 9. Time series of percent of winter season (November through April) and summer season (May through October) precipitation from 1960 to 2006 for the Nevada Test Site. Because the winter season starts November 1, the percentages are based on the sum of the winter and summer precipitation and therefore correspond to the year from November 1 through October 31.................15
Figure 10A. Average annual precipitation over the period from 1960 to 2006 for the Nevada Test Site. ......17 Figure 10B. Average winter season (November through April) precipitation over the period from 1960 to
2006 for the Nevada Test Site...........................................................................................................................18 Figure 10C. Average summer season (May through October) precipitation over the period from 1960 to
2006 for the Nevada Test Site...........................................................................................................................19 Figure 10D. Average winter season (November through April) precipitation as a percent of average
annual precipitation over the period from 1960 to 2006 for the Nevada Test Site. .................................20 Figure 11A. Winter season (November through April) precipitation for 1969, a wet year on the Nevada Test
Site.........................................................................................................................................................................22 Figure 11B. Winter season (November through April) precipitation, as a percent of average winter
precipitation, for 1969, a wet year on the Nevada Test Site. ......................................................................23 Figure 12A. Winter season (November through April) precipitation for 1998, a wet year for the Nevada
Test Site. ...............................................................................................................................................................24 Figure 12B. Winter season (November through April) precipitation for 1998, expressed as a percent of
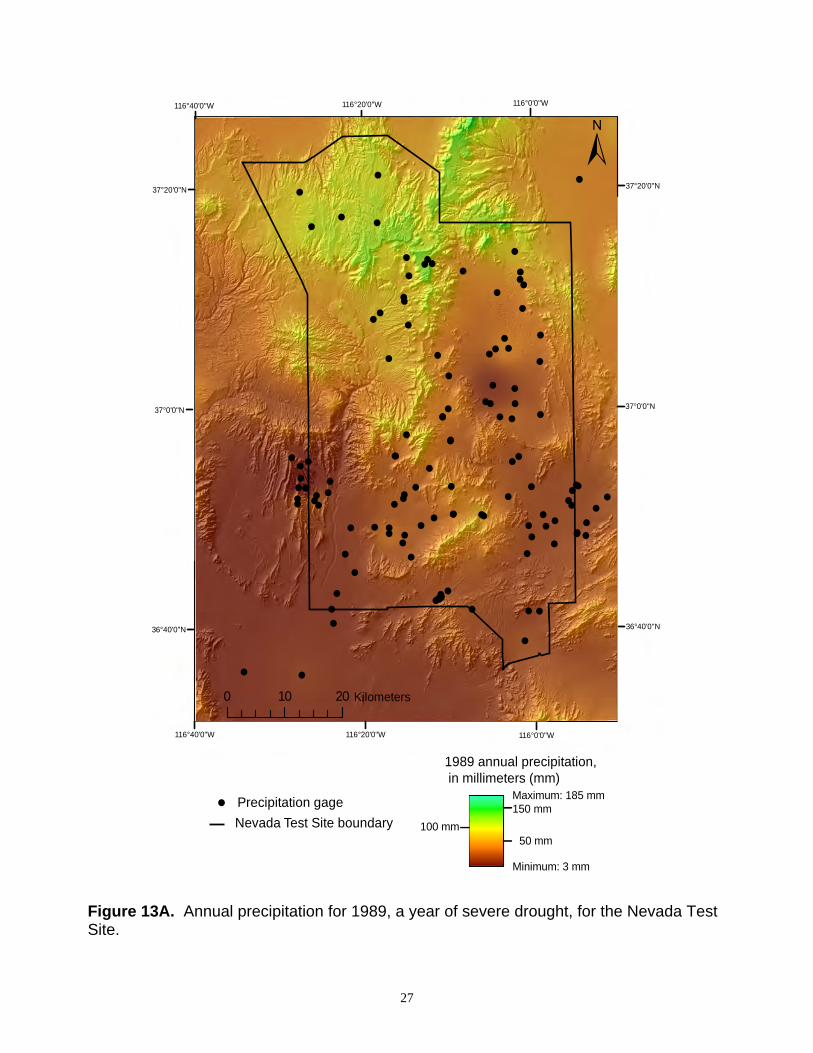
average winter precipitation, for the Nevada Test Site. .............................................................................25 Figure 13A. Annual precipitation for 1989, a year of severe drought, for the Nevada Test Site. ....................27 Figure 13B. Annual precipitation for 1989, expressed as a percent of average annual precipitation, for the
Nevada Test Site.................................................................................................................................................28 Figure 14A. The coefficient of variation (CV) of winter season (November through April) precipitation for
the Nevada Test Site. .........................................................................................................................................29 Figure 14B. The coefficient of variation (CV) of summer season (May through October) precipitation for
the Nevada Test Site. .........................................................................................................................................30 Figure 15. Time series of annual precipitation from 1960 to 2006 for a high elevation (2,274 m, Beatley plot
64), an intermediate elevation (1,245 m, Beatley plot 46), and a low elevation (961 m, Beatley plot 8) permanent ecological study plot on the Nevada Test Site. ........................................................................32
Tables Table 1. Regression equations for annual and seasonal precipitation as a function of climate-station
elevation for two time periods on the Nevada Test Site (fig. 6). ................................................................12 Table 2. Regression equations for annual and seasonal precipitation as a function of climate-station
position (n = 115 stations) on the Nevada Test Site. ....................................................................................12
Appendix Table A1. Metadata for precipitation stations on or adjacent to the Nevada Test Site, Nye County, Nevada.
The only data used were from January 1, 1960, through December 31, 2006..........................................35
vi
Conversion Factors SI to Inch/Pound
Multiply By To obtain
Length
centimeter (cm) 0.3937 inch (in.)
millimeter (mm) 0.03937 inch (in.)
kilometer (km) 0.6214 mile (mi)
Area
square kilometer (km2) 0.3861 square mile (mi2)
Volume
cubic meter (m3) 35.31 cubic foot (ft3)
Mass
gram (g) 0.03527 ounce, avoirdupois (oz) Vertical coordinate information is referenced to the North American Vertical Datum of 1988 (NAVD 88). Horizontal coordinate information is referenced to the North American Datum of 1927 (NAD 27).
Abbreviations and Acronyms ARL-SORD Air Resource Laboratory Special Operations and Research Division, Department of Energy BECAMP Basic Environmental Compliance And Monitoring Program, Reynolds Electric and Engineering Company
and Department of Energy CV Coefficient of Variation DEM Digital Elevation Model ENSO El Niño – Southern Oscillation GPS Geographic Positioning System NCDC National Climatic Data Center NDFF Nevada Desert FACE (Free Air Carbon dioxide Enrichment) Facility NTS Nevada Test Site, Department of Energy PDO Pacific Decadal Oscillation PRISM Parameter-Elevation Regressions on Independent Slopes YMMP Yucca Mountain Meteorological Monitoring YMP Yucca Mountain Project, Department of Energy
Modeling the Spatial and Temporal Variation of Monthly and Seasonal Precipitation on the Nevada Test Site and Vicinity, 1960-2006
By Joan B. Blainey, Robert H. Webb, and Christopher S. Magirl
Abstract The Nevada Test Site (NTS), located in the climatic transition zone between the Mojave
and Great Basin Deserts, has a network of precipitation gages that is unusually dense for this region. This network measures monthly and seasonal variation in a landscape with diverse topography. Precipitation data from 125 climate stations on or near the NTS were used to spatially interpolate precipitation for each month during the period of 1960 through 2006 at high spatial resolution (30 m). The data were collected at climate stations using manual and/or automated techniques. The spatial interpolation method, applied to monthly accumulations of precipitation, is based on a distance-weighted multivariate regression between the amount of precipitation and the station location and elevation. This report summarizes the temporal and spatial characteristics of the available precipitation records for the period 1960 to 2006, examines the temporal and spatial variability of precipitation during the period of record, and discusses some extremes in seasonal precipitation on the NTS.
Introduction High-resolution spatial interpolation of rainfall data is extremely useful in the mountainous
areas of the western United States, where precipitation gages generally are widely dispersed (see http://www.wrcc.dri.edu/summary/Climsmnv.html). Some existing approaches, such as the Parameter-elevation Regressions on Independent Slopes Model (PRISM; Daly and others, 1994), use multivariate techniques to estimate regional patterns of precipitation at coarse spatial scales (typically 4 km). These methods are advantageous for scales on the order of states or continents because they take into account, among other things, rain-shadow effects, temperature inversions, distance from large surface water bodies, and group climate stations according to similarity, but in many cases their coarse resolution limits the applicability to specific sites or questions.
Many landscape-scale analyses benefit from high-resolution climate data, particularly long-term ecological study plots. Long-term changes in permanent vegetation plots in the Mojave Desert, such as those on the Nevada Test Site (NTS, fig. 1), are caused by variation in annual or seasonal precipitation. This Department of Energy facility has a large number of climate stations (table A1, fig. 2), which provides sufficient data for relatively high-resolution estimations of seasonal precipitation that are essential for evaluating long-term vegetation change. In this report, we use a distance-weighted multiple-linear regression technique (Nalder and Wein, 1998) to estimate monthly precipitation, then combine monthly totals to obtain seasonal and annual
1
precipitation for the NTS (fig. 1). We discuss the precipitation data for the period 1960 through 2006, discuss our estimation technique, and provide examples of time series and spatial variability of seasonal and annual precipitation for the NTS and for specific permanent vegetation plot locations. We provide maps depicting selected wet and dry years, winters, and summers for the NTS and vicinity.
Figure 1. Prominent topographic features illustrated with a hillshade model based on a 30-m digital elevation model and selected place names of the Nevada Test Site, Nevada. The Nevada Test Site boundary is outlined in black, and the Beatley plots are discussed in the text and on figure 15.
2
S
E
G
Air Resource Laboratory Special Operations andResearch Division (ARL-SORD)Beatley
Flint and Davies
Nevada Desert FACE Facitlity (NDFF)
Basic Environmental Compliance And MonitoringProgram (BECAMP)
National Climatic Data Center (NCDC)
Yucca Mountain Meteorological Monitoring (YMMP)
Elevation, in meters (m)
Nevada Test Site boundary
Maximum: 2,570 m
Minimum: 690 m1,000 m
2,000 m1,500 m
2,500 m
Precipitation gage data source
±116°40'0"W
116°40'0"W
116°20'0"W
116°20'0"W
116°0'0"W
6°0'0"11 W
36°40'0"N 36°40'0"N
37°0'0"N 37°0'0"N
37°20'0"N 37°20'0"N
0 10 20 Kilometers
#*
#*
#*
#*
#*
#*
#*
#*
#*
#*
#*
#*
#*
#*
#*
#*
GF
#*
GF
GF
GF
GF
GF
GF
GFGF
GF GF
GF
GFGFGFGF
GF
")")")
")
")
")
")
")
E
E
E
E
E
E
S
Figure 2. Locations of precipitation gages of the Nevada Test Site and vicinity, Nevada, illustrated with 30-m digital elevation model (DEM) and hillshade based on the 30-m DEM. The precipitation gage symbol represents the data source. The model domain is the extent of the DEM.
3
Purpose and Scope The purpose of this report is to document the methods and data sources used to estimate
annual and seasonal precipitation on the Nevada Test Site from 1960 through 2006. The time series of precipitation at each gage is examined with respect to seasonal precipitation and variability in annual precipitation. Changes in the gage network over the study period are examined to assess that influence on estimates of regional precipitation. We provide examples of point estimates of annual and seasonal precipitation as well as estimates for distributed precipitation at the NTS.
Acknowledgements Phil Medica (USGS), Richard Hunter (Salisbury College, Maryland), and Paul Gregor
(Bechtel Nevada) told us about the availability of the BECAMP data, accessed in files archived on the NTS.
Study Area Geography and Topography
The NTS encompasses about 3,567 square kilometers (km2) in southern Nevada (Nye County) and is bounded by latitudes 37°20’45” N and 36°40’43” N and by longitudes 116°34’20” W and 115°55’37” W (fig. 1). The NTS is approximately a rectangle 40 km wide (west-east) and 80 km long (north-south). Precipitation on the NTS is strongly influenced by topography, with the highest elevations in the north (Rainer Mesa, 2,341 m) and lowest elevations near the southwest corner (819 m). Prominent low-elevation topographic features of the terrain include two large closed basins—Yucca and Frenchman Flats—bearing dry lakebeds (playas), and Jackass Flats, a broad area in the southwest of the NTS drained by 40-Mile Wash (fig. 1). Three large, relatively flat, and higher-elevation plateaus—Rainier, Buckboard, and Pahute Mesas—dominate the northwestern part of the NTS (fig. 1).
We used a 30-m resolution digital-elevation model (DEM) of the topography of the NTS in our analyses. This 30-m DEM was obtained from the U.S. Geological Survey’s National Elevation Dataset (see U.S. Geological Survey, 1999). We also obtained 10-m DEMs (Kent Ostler, Bechtel Nevada, 2004), but we chose to use the less-accurate 30-m data because the computational requirements of using 10-m data would be beyond the computational power of normal personal computers for an area the size of the NTS.
Climate The NTS spans the transition between the Mojave and Great Basin Deserts, and this
transition is created by a strong variation in topography and climate. Climate at the NTS has been described in detail by Quiring (1968), French (1983a; 1983b), Spaulding (1985), and Soulé (2006). Three climatological processes create precipitation, the sum of accumulated rain and water produced by snowmelt, in the Mojave Desert (Hereford and others, 2004; 2006) and the NTS. Winter precipitation generally results from frontal systems bearing moisture from the North Pacific Ocean; wetter storms may be enhanced by moisture from the tropical Pacific Ocean. In the spring and fall, cutoff low-pressure systems advect tropical moisture in the region, which can result in considerable precipitation. Both of these sources of moisture are influenced by mountain masses,
4
creating orographic effects of increasing precipitation with elevation (Spaulding, 1985). In the summer, local convective thunderstorms cause precipitation with high spatial variability (Hereford and others, 2004; 2006). Typically, moisture originates in either the Pacific Ocean – especially the Gulf of California – and (or) the Gulf of Mexico and is advected north during the North American monsoon. Summer precipitation can also result from low-pressure systems passing over the Great Basin to the north of the NTS (Quiring, 1968). Summer thunderstorms are characterized by widespread high intensity precipitation with durations on the order of hours. Some summer thunderstorms are associated with heavy rains, flash floods, and strong surface winds. The combined effects of moisture from the Gulfs of Mexico and California cause a general trend of increasing precipitation from west to east across southern Nevada (French, 1983a).
Annual and winter precipitation is highly affected by hemispheric- or global-scale climate processes, especially the El Niño – Southern Oscillation (ENSO) (see discussion of ENSO effects in Hereford and others, 2004; 2006) which is defined by an oscillation of the ocean-atmosphere system, specifically persistent warm sea-surface temperatures, in the equatorial Pacific Ocean. Rainfall in the Southwest tends to be greatly increased in nearly all El Niño years, which generally have increased strength of westerly winds and increased sea-surface temperatures off the west coast of California. Examples of years with El Niño conditions include 1969, 1978, and 1983; persistent El Niño conditions occurred from about 1991 through 1995 and again from 1997 to 1998. In contrast, cooler ocean waters off California occur during La Niña years, which tend to induce drought. Examples of years with La Niña conditions and drought include 1989 and 2002. The influence of these large-scale processes on summer precipitation is unknown and difficult to determine because of the high spatial and temporal variability of summer precipitation in the Mojave Desert.
The Pacific Decadal Oscillation (PDO) is another climate index known to reflect climatic processes affecting the Mojave Desert (Hereford and others, 2004; 2006) and the western United States. The PDO represents low-frequency fluctuations in the North Pacific Ocean occurring on a decadal-time scale (each phase lasting 10 to 30 years) and can be greatly influenced by phases in the ENSO. Generally, when the PDO is positive (e.g., 1977 to 1998; 2002 to present), the Mojave Desert tends to experience above-average precipitation; in contrast, when the PDO is negative (e.g., 1947 to 1976; 1998 to 2002), the Mojave Desert tends to experience extended or short-term drought (Hereford and others, 2004; 2006).
Annual precipitation at the highest elevations in the NTS averages about 330 mm and includes significant accumulation of snow. At lower elevations, annual precipitation typically ranges from 110 to 200 mm (fig. 3) and infrequent snow accumulations typically persist less than twenty-four hours (Bechtel Nevada, 2001). In general, snow frequently occurs above 1,800 m but is relatively rare for locations below 1,200 m (Soulé, 2006). At only six stations (see footnote in Appendix table A1) in the precipitation network record is snowfall recorded in addition to precipitation, and all these stations are at low elevation. Three of these stations, at elevations of 665, 747, and 814 m, did not record snowfall over the period of record. Three stations recorded measurable snow (located at elevations of 952, 1,007, and, 1,082 m) between October and April. For these three stations, the highest average-monthly snowfall (41 mm) occurred in January, followed by December (12.5 mm). Assuming a snow density of 0.10 g/cm3 (Dingman, 1994), these snow accumulations represent 32 percent and 13 percent of the total precipitation for January and February, respectively. Average accumulated snow during February, March, April, and November is similar, ranging from 4.2 to 6.8 mm which is an insignificant fraction of total precipitation, less than 6 percent.
5
As previously discussed, precipitation is seasonally bimodal, with most of the precipitation occurring during the winter and summer. Little precipitation occurs during the periods of April
Figure 3. Mean annual precipitation at the Nevada Test Site presented by source of data and time period, as a function of elevation.
Jan Feb Mar Apr May Jun Jul Aug Sep Oct Nov Dec
Mon
thly
Prec
ipita
tion
(mm
)
0
10
20
30
40
50
60
70
Figure 4. Median monthly gage precipitation at the Nevada Test Site from 1960 to 2006. Error bars represent the 25th and 75th percentiles.
through June and September through October (fig. 4). Winter precipitation, between November and April, accounts for 63 percent of the average annual precipitation on the NTS. Summer
6
precipitation, between July and August, accounts for 12 percent of average annual precipitation. The driest months at the NTS are May and June (fig. 4), which have average precipitation accumulations of 2.8 mm and 2.5 mm, respectively. February is the wettest month, receiving 12.2 mm of precipitation on average; it is also the month with the highest variability in precipitation (fig. 4).
Precipitation Data and Geospatial Characteristics A total of 125 precipitation gages recorded a year or more of data between 1960 and 2006
(fig. 2). The locations of climate stations and the sources of the data are given in the Appendix (table A1). Although the stations are referred to as precipitation gages, the vast majority of the gages record only rainfall. From 1960 through 2006, as many as 91 precipitation gages actively recorded during a single year (fig. 5). This represents a maximum gage density equivalence of 1 gage per 39 km2 and results from data at 68 permanent ecological study plots established by Janice C. Beatley and measured between 1963 and 1973 (Webb and others, 2003). During most of the period of record, however, the gage density equivalence is about 1 gage per 142 km2, with typically about 20 precipitation stations collecting data (fig. 5). The minimum gage density occurred during the period of 1960 to 1962 when 8 or fewer gages in the station network were actively recording.
Data Sources and Quality Precipitation data were obtained from several sources (table A1, fig. 2) and represent a wide
range of temporal scales for each month between January 1960 and December 2006. All data were obtained from publicly accessible websites with the exception of some data from the National Climatic Data Center (NCDC). Data from NCDC stations (National Climatic Data Center, 2003) that have not undergone quality control checks are available on the internet from the Western Regional Climate Center (http://www.wrcc.dri.edu/summary/Climsmnv.html). Geospatial data for many of the sites were obtained from station metadata available from the source. We used several different types of hand-held global positioning system (GPS) units to determine the locations and elevations of unpublished climate data sets, such as those established by Beatley (see below). In those cases, our data generally had an estimated position error of ± 4-6 m using a World Geodetic System (WGS) 84 coordinate system. For all climate stations, we checked elevations acquired from
7
Num
bero
f Act
ive
Stat
ions
0
20
40
60
80
100
Number of Active Stations
Average
Netw
ork Elevation(m
)
0
200
400
600
800
1000
1200
1400
Average Elevation of Network
A.
Num
bero
f Act
ive
Stat
ions
ARL-SORD StationsBeatley plotsYMMM Stations
B.
1960 1970 1980 1990 2000 2010
Num
bero
f Act
ive
Stat
ions
0
2
4
6
8
10
BECAMP StationsNDFF FacilityFlint and Davies (1997)NCDC Stations
C.
0
20
40
60
80
Figure 5. Annual number of actively recording precipitation gages in the period of 1960 to 2006 for the Nevada Test Site. A. The average elevation of the active precipitation gage network is given in red. B. and C. The number of actively recording precipitation gages by data source.
8
the station metadata or using handheld GPS units with the elevation reported for that location on the 10-m digital-elevation model. Where significant differences were noted, we recollected data in the field using handheld GPS units.
The data for six precipitation stations from the NCDC Summary of the Day database were aggregated into monthly totals. Precipitation was measured in increments of 0.25 mm or reported as trace precipitation of less than 0.13 mm. Trace amounts of precipitation were set equal to zero for subsequent analyses. These are the only stations that recorded both rainfall and snowfall.
Six NCDC stations (table A1) were incorporated in the NTS precipitation network over the period 1960 to 2006 (fig. 5C). The stations Amargosa Farms Garey and Lathrop Wells are southwest of the NTS in a low-elevation portion of the modeling domain (fig. 2). The Beatty and Beatty 8 N stations are about 5 km west of the western boundary of the modeling domain and are the western-most climate stations in the network. The lowest-elevation station – Lathrop Wells 16 SSE – is about 9 km south of the modeling domain at 665.1 m elevation. The Indian Springs station, the eastern-most precipitation gage, is approximately 13 km east of the eastern boundary of the modeling domain.
Precipitation was measured at Beatley vegetation plots from 1963 through 1972 (Webb and others, 2003). An above-ground funnel collected precipitation that was stored in an underground storage gage with a small amount of added oil to minimize evaporation. The storage gage was emptied and measured periodically (approximately every 2 weeks). We aggregated these data into monthly precipitation using methods discussed in Webb and others (2003). Most of the 68 Beatley precipitation stations are located in the eastern and southern portion of the NTS (fig. 2). Between 1987 and 1994, the Basic Environmental Compliance And Monitoring Program (BECAMP) also measured precipitation on the NTS (Hunter, 1994) using standard storage gages placed on posts at about 2-m height. Some of the 17 BECAMP gages are located within or adjacent to the Beatley plots (e.g., plots 3 and 46, fig. 1), extending the monthly precipitation record beyond 1972 at these sites. Several of the BECAMP gages are located on Pahute Mesa in the northern high elevation portion of the NTS (fig. 2); this area has a relatively low precipitation gage density.
The Air Resource Laboratory, Special Operations and Research Division (ARL-SORD) is a cooperative project between the National Oceanic and Atmospheric Administration and the Department of Energy that has collected climate data on the NTS since 1957. The 17 precipitation stations range in elevation between 939 m to 2,283 m (http://www.sord.nv.doe.gov/arlsord-1.htm) and are located throughout the NTS (fig. 2). The rain gages are storage gages with recording strip charts set to record for 1-week periods; however, in the mid-1990s, the recording strip charts were set to record for 30 days (Soulé, 2006) thereby lowering the data resolution.
Yucca Mountain, a proposed high-level radiation waste-storage site on the southwestern side of NTS (fig. 1) operated by the Department of Energy, has monitored climate as part of its site characterization since the beginning of the project in the early 1980s. Between April 1987 and September 1997, Flint and Davies (1997) operated 5 weather stations at 8 sites on the NTS (fig. 2). The elevation of these sites ranged from 1,055 to 1,789 m. Tipping bucket rain gage data was collected every 10 seconds and averaged into 15 minute increments. The Yucca Mountain Meteorological Monitoring (YMMM) network consists of nine meteorological stations that collect daily precipitation (fig. 2). Data are available for these stations from December 1985 through December 2004 (http://www.ymp.dri.edu).
Since 1996, precipitation events have been recorded at the Nevada Desert FACE (Free Air Carbon dioxide Enrichment) Facility (NDFF). Data are available for this station (https:// www.unlv.edu/Climate_Change_Research/NDFF/), which is located in Frenchman Flats; daily
9
precipitation values are reported with a resolution of 0.1 mm. At the beginning of our analysis period in 1960, there were four actively recording
precipitation gages in the network, and all four of these were NCDC stations. In 1963, the number of stations in the network greatly increased with the addition of the 68 gages on Beatley permanent plots (fig. 5A, fig. 5B). These stations were monitored until 1973, whereupon the number of actively recording gages in the network decreased to 20. The number of gages since 1973 increased slightly to 28 stations in 2004 and 18 stations at the end of the analysis period in December 2006. The large decrease in the number of actively recording precipitation gages from 26 in 2005 to 18 in 2006 is a reflection that not all of the 2006 data have been quality checked and made publically available; no rapid changes to the precipitation network occurred during this period.
The average elevation of the gages is a consideration for the data representation of the NTS in the multivariate extrapolation techniques. The elevation of precipitation stations ranges from 665 m for a site south of the NTS to 2,283 m on Rainer Mesa in the north. The elevation of the DEM varies between 690 and 2,570 m (fig. 2), which indicates that the available climate data is appropriate for describing variation of precipitation, both annual and seasonal, on the NTS. Over the study period, the average elevation of the precipitation network varied between 1,229 m and 1,382 m (fig. 5A). The maximum average precipitation network elevation occurred in 1960 when only a few stations were active. Based on the long-term relation between elevation and average annual precipitation (fig. 6A), an elevation difference of 153 m (the maximum change in the average precipitation network elevation over the study period 1960 to 2006) corresponds to a difference of 19.6 mm of average annual precipitation.
Data Trends With Elevation and Position We used linear-regression techniques to evaluate the influence of elevation and geospatial
position on annual and seasonal precipitation on the NTS. A simple linear regression (Freedman and others, 1998) takes the form of
Y c aX= + , (1)
where Y = the dependent variable (precipitation total), c = a regression constant that is the x-axis intercept, X = the independent variable (e.g., elevation), and a = the independent variable constant that is the slope of the regression line. The regression coefficient r2 is a measure of goodness-of-fit that can be interpreted as the amount of variance explained by equation 1 (Freedman and others, 1998). Finally, a standard error of estimate is the square root of the average sum-of-square residual deviations from the mean and is another measure of goodness-of-fit that depends on the accuracy of predictions made with the regression relation.
Elevation has a strong influence on precipitation on the NTS (fig. 6A). For 115 stations reporting a minimum of 5 years of record on or adjacent to the NTS, we used equation 1 to estimate the relation between elevation and annual, winter, and summer precipitation (table 1). The elevation coefficient (slope) for winter precipitation (0.070) was more than 1.5 times that for summer precipitation (0.045), indicating a stronger orographic effect of increasing precipitation with elevation. This effect was more pronounced for annual precipitation, which had an elevation coefficient of 0.128 (table 1).
10
E levation (m)
600 800 1000 1200 1400 1600 1800 2000 2200 2400
Pre
cipi
tatio
n(m
m)
0
100
200
300
400
Annual P recipitationW inter P recipitationS ummer P recipitation
0
50
100
150
200
250
300
A. 1960-2006
B. 1992-1996
Figure 6. Change in annual and seasonal precipitation with elevation for two periods of record on the Nevada Test Site. A. 1960 to 2006. B. 1992 to 1996.
The difference in orographic effect varies with time. For the period of 1992 through 1996, a period with a constant network of 19 climate stations and persistent El Niño conditions (Hereford and others, 2004; 2006), we again examined the relation between elevation and precipitation (fig. 6B). For this time period, the regression coefficient r2 indicates that only 33 percent of the variance in annual precipitation can be explained by the linear dependence on elevation. The regression for winter precipitation is similar to that for annual precipitation, albeit with a slightly lower slope (0.055 versus 0.076; table 1). However, summer season precipitation, or precipitation that occurs during May to October, has less of an orographic dependence as indicated by an even lower slope (0.0207), which is less than half of the slope for average annual precipitation or winter season precipitation (table 1).
11
Table 1. Regression equations for annual and seasonal precipitation as a function of climate-station elevation for two time periods on the Nevada Test Site (fig. 6).
Season Number of stations n
Regression constant c
Elevation coefficient a
Regression coefficient r2
Standard error of
estimate
Time period
1960-2006 Annual 115 9.612 0.128 0.67 28.42
1960-2006 Winter 115 13.776 0.070 0.46 24.06
1960-2006 Summer 115 -7.963 0.045 0.60 11.73
1992-1996 Annual 19 80.072 0.0757 0.33 35.38
1992-1996 Winter 19 77.631 0.055 0.27 29.83
1992-1996 Summer 19 2.441 0.0207 0.32 10.04
Precipitation varies little north-south and east-west on NTS, with less trend than the effect
of elevation (table 2). Although the r2 values obtained by using equation 1 with latitude as the independent variable suggest that there is a statistically significant relation of increasing precipitation with increasing distance northward, the slope of the regression equation is very low; also, elevation generally increases northwards as well. No statistically significant relations were found between precipitation and east-west position on the NTS (table 2). These results, which show minimal trends in average precipitation with position on the NTS, show the strong influence of elevation and show that a multivariate approach to estimating monthly precipitation using position and elevation may not be compromised by drift imposed by the northing-easting data.
Table 2. Regression equations for annual and seasonal precipitation as a function of climate-station position (n = 115 stations) on the Nevada Test Site.
Season Independent variable
Regression constant c Coefficient a Regression
coefficient r2
Standard error of
estimate
Time period
1960-2006 Annual Northing -6546 0.002 0.42 37.86
1960-2006 Winter Northing -3107 0.001 0.22 28.96
1960-2006 Summer Northing -2859 0.001 0.56 12.43
1960-2006 Annual Easting 633 -0.001 0.06 35.38
1960-2006 Winter Easting 519 -0.001 0.11 30.92
1960-2006 Summer Easting 57.2 -0.000 0.00 18.63
12
Time-Series Analysis On the basis of all the available rainfall data, the wettest three years on record were 1978
(annual precipitation of 349 mm), 1983 (348 mm), and 1998 (343 mm) (fig. 7). During the period of 1978 through 1984, 5 of the 7 years had above-average precipitation; in contrast, both 1969 and 1998 were preceded and followed by below-average years. The three driest years on record were 2002 (annual precipitation of 44 mm), 1989 (54 mm), and 1964 (78 mm). Two of these driest years are parts of longer droughts that occurred from 1988 through 1991 and 1959 through 1964. For the period of record, above-average annual precipitation was recorded for 20 years, and below-average annual precipitation was recorded for 24 years (fig. 7).
Ann
ual P
reci
pita
tion
(mm
)A
verageN
etwork
Elevation(m
)
1960 1970 1980 1990 2000 20100
100
200
300
400
500
Annual precipitation Average annual precipitation
800
1000
1200
1400
Average network elevation
Figure 7. Time series of annual precipitation on the Nevada Test Site from 1960 to 2006. The dashed line is the mean annual precipitation averaged over all the gages for the same time period, and the red squares represent the average elevation of the actively recording precipitation stations.
13
The amount of seasonal precipitation varies from year to year, with winter precipitation generally mirroring annual precipitation and summer precipitation showing a different variation (fig. 8). During the five wettest years on record since 1960 (1965, 1969, 1978, 1983, and 1998), winter season precipitation varied from 57 to 88 percent of the annual precipitation. In some years, particularly 1964, 1972, 1977, 1989, and 1990, winter precipitation was below average and less than summer rainfall. Summer precipitation also was greater than winter season precipitation in some years when winter precipitation was at or above average (1976, 1984, and 1987). The time series data in figure 8 show that for at least some years, summer precipitation can be a high percentage of annual precipitation and therefore is a significant source of moisture to the ecosystem of the NTS. Although summer precipitation can be significant portion of annual precipitation, the timing, duration, and intensity of summer precipitation is distinct from winter precipitation which results in ecological differences for plant mortality and recruitment.
The percentage of precipitation that occurs in each season varies annually (fig. 9). On average, for the extent of the network of climate stations, 61 percent of annual precipitation occurs in winter and 39 percent occurs in summer. During high-rainfall periods, particularly those associated with El Niño conditions, the percentage of winter precipitation is much higher (e.g., 1978-1983, 1991-1995; fig. 9). During some drought years, notably 1989 and 1990 (fig. 9), the percentage of precipitation that occurs in summer is much higher than the percentage in winter. Persistence of the percentages of winter versus summer rainfall, particularly following 1978, is striking compared with the earlier part of the record and may have significant ecological consequences in terms of plant mortality and recruitment.
1960 1970 1980 1990 2000 2010
Prec
ipita
tion
(mm
)
0
50
100
150
200
250
300
350Winter precipitation
Summer precipitation
Average annual precipitation
Average summer precipitation
Average winter precipitation
Figure 8. Time series of winter (November through April) and summer (May through October) season precipitation, an average of all the precipitation gages, from 1960 to 2006 for the Nevada Test Site.
14
1960 1970 1980 1990 2000 2010
Perc
ento
f Pre
cipi
tatio
n
0
20
40
60
80
100
Percent winter
Percent summer
Figure 9. Time series of percent of winter season (November through April) and summer season (May through October) precipitation from 1960 to 2006 for the Nevada Test Site. Because the winter season starts November 1, the percentages are based on the sum of the winter and summer precipitation and therefore correspond to the year from November 1 through October 31.
Multivariate Statistical Analyses Monthly precipitation data were spatially interpolated using a combination of multivariate
regression of the geospatial position and inverse distance-square weighting (Nalder and Wein, 1998). Although this technique was developed for northern Canada, it can be applied to any geographic region or climate regime. Nalder and Wein (1998) found that their method out performed other standard geostatistical techniques for estimating variables in space, including the better known techniques of kriging and co-kriging. Their method was shown to interpolate data more efficiently, which makes it highly desirable in the case of precipitation in the inter-mountain West.
The technique of Nalder and Wein (1998) uses linear-regression coefficients fit to precipitation data for each month along north-south, east-west, and elevation gradients. These coefficients are used to weight the interpolation as follows:
21
21
( ) ( ) ( )
1
Ni i x i y i
i iN
i i
Z X X C Y Y C E E C
dZ
d
=
=
+ − × + − × + − ×
=∑
∑
e
, (2)
where X and Xi are the easting of a grid cell and the easting of precipitation station i, Y and Yi are the northing of a grid cell and northing of precipitation station i, and E and Ei are the elevation of a grid cell the elevation of precipitation station i. Cx, Cy, and Ce are the multiple linear-regression
15
coefficients for easting, northing, and elevation, respectively. N is the number of precipitation stations and di is the distance between the node of a model grid cell and precipitation station i. At each node of the 30-m DEM, this method interpolates between stations such that the precipitation between adjacent stations is most strongly influenced by the closest ones. The gradient plus inverse distance-square method (Nalder and Wein, 1998) defaults to the simpler inverse-distance method if the regression fit is statistically insignificant. The validity of the precipitation estimates obtained with this method depends greatly on the structure of the spatial correlation of precipitation as recorded by the climate-station network. Consequently, the density of stations, the topographic gradients between stations, and precipitation gradients between stations has a large influence on the interpolated precipitation.
For example, during the summer months, adjacent stations may record substantially different monthly precipitation due to small-scale convective thunderstorms that generate rainfall over a small (generally 2.5-25 km2) area. In this case, the gradient plus inverse distance-square method of interpolation results in a “bullseye” effect where precipitation estimates decrease rapidly in a radial manner with distance from the station that recorded high thunderstorm activity. The bullseye effect reflects the artificial smoothing of precipitation estimates relative to the local scale of the thunderstorm activity. The maps of interpolated precipitation may also look smooth because there is no local directional gradient. More complex spatial interpolation algorithms, such as those in the PRISM model (Daly and others, 1994), use directional gradients to account for effects such as rain shadows. However, the NTS is located a great distance from major mountain ranges, such as the Sierra Nevada, which is more than 350 km to the west and, consequently, rain shadow effects do not appear to exert a significant influence on the local distribution of precipitation.
Results of Spatial Interpolation of Precipitation Period of Record Precipitation Averages
Period of record (POR) climate averages are a common way of characterizing climate at a particular location or over a region (fig. 10). For some areas, POR climate averages may not reflect average conditions at a specific location as some climate events, such as the Pacific Decadal Oscillation, persist for periods of 20 to 30 years (Hereford and others, 2004; 2006). POR average annual precipitation was calculated by averaging interpolated monthly precipitation at each 30-m node over the period 1960 through 2006 for the NTS and vicinity. The smallest POR average annual precipitation occurs in the southwestern portion of the modeling domain in the Amargosa Desert (79 mm); the highest POR average annual precipitation (362 mm) occurs on Rainer Mesa and along the Belted Range on the northern boundary of the model domain (fig. 10). In general, the POR average precipitation reflects topography, which is expected given the strong orographic influences within the climate-station data (fig. 6). For example, Yucca Flat and Frenchman Flats, which are broad flat-lying topographic lows, have lower average annual precipitation than adjacent areas and also have low variability in average annual precipitation. Strong precipitation gradients indicative of the topography are also evident with average annual precipitation increasing from the western to eastern portion of the southern part of the NTS. Lack of such a gradient in the north helps to explain why regressions between annual precipitation and easting (table 2) are not statistically significant.
16
±
0 10 20
Annual precipitation, in millimeters (mm)
Kilometers
! Precipitation gageNevada Test Site boundary
116°40'0"W
116°40'0"W
116°20'0"W
116°20'0"W
116°0'0"W
6°0'0"11 W
36°40'0"N 36°40'0"N
37°0'0"N 37°0'0"N
37°20'0"N 37°20'0"N
!
!!
!
!
!
!
! !
!!!
!
!!
!
!!
!
!
!
!
!!
!
!
!!
!!
!
!
!
!!!!
!!
!! !
!!
!!
!!
!
! !!!
!
!
!
!
!
!
!!
! !
!
!!
!
! !
!
!
!!
!!
!
!
!
!
!
!
!
!
!
!
!
!
!
!
!
!
!
!
!
!
!
!
!
!
!!
!!
!
!!!!
!
!!!
!
!
!
!
!
!
!
!
Maximum: 362 mm
Minimum: 79 mm100 mm
150 mm200 mm
250 mm350 mm300 mm
Figure 10A. Average annual precipitation over the period from 1960 to 2006 for the Nevada Test Site.
17
±
0 10 20
Winter precipitation, in millimeters (mm)
Kilometers
! Precipitation gage
Nevada Test Site boundary
116°40'0"W
116°40'0"W
116°20'0"W
116°20'0"W
116°0'0"W
6°0'0"11 W
36°40'0"N 36°40'0"N
37°0'0"N 37°0'0"N
37°20'0"N 37°20'0"N
!
!!
!
!
!
!
! !
!!!
!
!!
!
!!
!
!
!
!
!!
!
!
!!
!!
!
!
!
!!!!
!!
!! !
!!
!!
!!
!
! !!!
!
!
!
!
!
!
!!
! !
!
!!
!
! !
!
!
!!
!!
!
!
!
!
!
!
!
!
!
!
!
!
!
!
!
!
!
!
!
!
!
!
!
!
!!
! !
!
!!!!
!
!!!
!
!
!
!
!
!
!
!
Maximum: 199 mm
Minimum: 56 mm
100 mm
150 mm
Figure 10B. Average winter season (November through April) precipitation over the period from 1960 to 2006 for the Nevada Test Site.
18
±
0 10 20
Summer precipitation, in millimeters (mm)
Kilometers
! Precipitation gage
Nevada Test Site boundary
116°40'0"W
116°40'0"W
116°20'0"W
116°20'0"W
116°0'0"W
6°0'0"11 W
36°40'0"N 36°40'0"N
37°0'0"N 37°0'0"N
37°20'0"N 37°20'0"N
!
!!
!
!
!
!
! !
!!!
!
!!
!
!!
!
!
!
!
!!
!
!
!!
!!
!
!
!
!!!!
!!
!! !
!!
!!
!!
!
! !!!
!
!
!
!
!
!
!!
! !
!
!!
!
! !
!
!
!!
!!
!
!
!
!
!
!
!
!
!
!
!
!
!
!
!
!
!
!
!
!
!
!
!
!
!!
!!
!
!!!!
!
!!!
!
!
!
!
!
!
!
!
Maximum: 183 mm
Minimum: 23 mm
50 mm
100 mm
150 mm
Figure 10C. Average summer season (May through October) precipitation over the period from 1960 to 2006 for the Nevada Test Site.
19
±
0 10 20
Average winter precipitation as
Kilometers
percent of average annual precipitation
! Precipitation gage
Nevada Test Site boundary
116°40'0"W
116°40'0"W
116°20'0"W 116°0'0"W
!
116°20'0"W 6°0'0"11 W
36°40'0"N 36°40'0"N
37°0'0"N 37°0'0"N
37°20'0"N 37°20'0"N
! !!!
!
!!
!
!
!
!
! !
!!!
!
!!
!
!!
!
!
!
!
!!
!
!
!!
!!
!
!
!
!!!
!!
!
!
!! !
!!
!!
!!
!
!
!
!
!
!
!
!
!
!!
!
!
!
!
!
!
!
! !
!
!!
!
!
!
!!
!
!
!
! !
!
!
!!
!!
!
!
!
!
!
!
!
!
!!
!
!!!!
!
!!!
!
!
!
!
!
!
!
!
0.49 - 0.55
0.55 - 0.60
0.60 - 0.65
0.65 - 0.70
0.70 - 0.73
Figure 10D. Average winter season (November through April) precipitation as a percent of average annual precipitation over the period from 1960 to 2006 for the Nevada Test Site.
20
Like annual average precipitation, both average winter and summer precipitation are
strongly dependent on elevation for the period of record. Most precipitation on the NTS occurs during the winter, and average winter precipitation ranges from 56 to 199 mm (fig. 10B) over the model domain. The average summer rainfall has less geographic variation and ranges from 23 to 183 mm (fig. 10C). In the lower elevations, or southwestern portion of the model domain, particularly in the area south of Yucca Mountain, winter precipitation accounts for most of the average annual precipitation (about 70 to 73 percent) (fig. 10D). In contrast, winter precipitation accounts for only about 50 to 55 percent of average annual precipitation at higher elevations on Pahute Mesa in the northwestern portion of the model domain.
Seasonal Precipitation for 1969, 1989, and 1998 We also examined the spatial variability of seasonal precipitation on the NTS for select
years during which precipitation was atypical for the period of record. Winter precipitation was evaluated for 1969 and 1998, both years having above average precipitation (the 3rd and 4th wettest years during the period of record). A major drought occurred on the NTS from 1989 to 1991; therefore, we created a map of annual precipitation for 1989 as an example of the spatial distribution of precipitation during such a drought.
Winter precipitation during 1969 was more than 450 mm on the higher-elevation terrain in the north-central parts of the NTS (fig. 11A) and was well above average throughout the modeling domain, mostly ranging from 2 to 3 times that of average (fig. 11B). Winter precipitation during 1969 was highest in the eastern one-third of the NTS, where it typically was greater than 250 percent of the average winter precipitation. The difference between winter season precipitation during 1969 and average winter precipitation was largely independent of elevation; precipitation extremes occurred both in higher-elevation areas (west of the Belted Range) and in the low-elevation areas (e.g., Frenchman Flats).
The distribution of precipitation during the winter seasons of 1969 and 1998 are significantly different due to a difference in storm types during the highest rainfall periods. For example, in February 1998, a procession of strong frontal systems crossed southern Nevada, leading to a relatively uniform coverage of precipitation across the NTS (http://docs.lib.noaa.gov/rescue/dwm/1998/19980202-19980208.djvu). In contrast, during February 1969, a series of cutoff low-pressure systems with a few frontal systems crossed southern Nevada, leading to more spatially patchy precipitation across the NTS. During the winter of 1998, precipitation was as much as 375 mm at higher elevations, or less than what occurred in 1969, and generally 165-200 mm at lower elevations, which was more than what occurred during 1969 (fig. 12A). The intermediate-elevation areas, including Jackass Flats and the area to its west and also in intermediate-elevation areas west of Buckboard Mesa, were mostly between 280 and 350 percent of the average winter precipitation (fig. 12B). By looking at 1998 winter precipitation as a percent of winter average (fig. 12B), it is evident that many of the high-elevation areas, particularly on Rainer Mesa and on the Belted Range, received less precipitation relative to the surrounding areas than would normally occur. The smallest increase in above normal winter season precipitation during 1998 occurred northwest of Frenchman Flats and west of Yucca Flat, which are low- and intermediate-elevation areas, respectively, in the central and southeastern portion of the NTS.
21
±
0 10 20
1969 winter precipitation, in millimeters (mm)
Kilometers
! Precipitation gage
Nevada Test Site boundary
116°40'0"W
116°40'0"W
116°20'0"W
116°20'0"W
116°0'0"W
6°0'0"11 W
36°40'0"N 36°40'0"N
37°0'0"N 37°0'0"N
37°20'0"N 37°20'0"N
!
!!
!
!
!
!
! !
!!!
!
!!
!
!!
!
!
!
!
!!
!
!
!!
!!
!
!
!
!!!!
!!
!! !
!!
!!
!!!
! !!!
!
!
!
!
!
!
!!
! !
!
!!
!
! !
!
!
!!
!!
!
!
!
!
!
!
!
!
!
!
!
!
!
!
!
!
!
!
!
!
!
!
!
!
!!
! !
!
!!!!
!
!!!
!
!
!
!
!
!
!
!
Maximum: 524 mm
Minimum: 6 mm100 mm
200 mm 300 mm
400 mm 500 mm
Figure 11A. Winter season (November through April) precipitation for 1969, a wet yon the Nevada Test Site.
ear
22
±
0 10 20
1969 winter precipitation,as percent of winter average
Kilometers
! Precipitation gage
Nevada Test Site boundary
116°40'0"W
116°40'0"W
116°20'0"W
116°20'0"W
116°0'0"W
6°0'0"11 W
36°40'0"N 36°40'0"N
37°0'0"N 37°0'0"N
37°20'0"N 37°20'0"N
!
!!
!
!
!
!
! !
!!!
!
!!
!
!!
!
!
!
!
!!
!
!
!!
!!
!
!
!
!!!!
!!
!! !
!!
!!
!!
!
! !!!
!
!
!
!
!
!
!!
! !
!
!!
!
! !
!
!
!!
!!
!
!
!
!
!
!
!
!
!
!
!
!
!
!
!
!
!
!
!
!
!
!
!
!
!!
! !
!
!!!!
!
!!!
!
!
!
!
!
!
!
!
Maximum: 351 %
Minimum: 5 %
100 %
300 %
200 %
Figure 11B. Winter season (November through April) precipitation, as a percent of average winter precipitation, for 1969, a wet year on the Nevada Test Site.
23
±
0 10 20
1998 winter precipitation,in millimeters (mm)
Kilometers
! Precipitation gage
Nevada Test Site boundary
116°40'0"W
116°40'0"W
116°20'0"W
116°20'0"W
116°0'0"W
6°0'0"11 W
36°40'0"N 36°40'0"N
37°0'0"N 37°0'0"N
37°20'0"N 37°20'0"N
!
!!
!
!
!
!
! !
!!!
!
!!
!
!!
!
!
!
!
!!
!
!
!!
!!
!
!
!
!!!!
!!
!! !
!!
!!
!!
!
! !!!
!
!
!
!
!
!
!!
! !
!
!!
!
! !
!
!
!!
!!
!
!
!
!
!
!
!
!
!
!
!
!
!
!
!
!
!
!
!
!
!
!
!
!
!!
! !
!
!!!!
!
!!!
!
!
!
!
!
!
!
!
Maximum: 375 mm
200 mm
250 mm
350 mm
Minimum: 165 mm
300 mm
ear
Figure 12A. Winter season (November through April) precipitation for 1998, a wet yfor the Nevada Test Site.
24
±
0 10 20 Kilometers
1998 winter precipitation,as percent of winter average
! Precipitation gage
Nevada Test Site boundary
116°40'0"W
116°40'0"W
116°20'0"W 116°0'0"W
116°20'0"W 6°0'0"11 W
36°40'0"N 36°40'0"N
37°0'0"N 37°0'0"N
37°20'0"N 37°20'0"N
!
!!
!
!
!
!
! !!
!!
!
!
! !
!!
!!!
!
!!
!
!!
!
!
!!
!!
!
!
!
!!!
!
!
!
!
!
!
!
!
!
!
!! !
! !
!
!
!!
!!
!
!
!
! !
!
!!
!
!
!
!!
!!
!!
!
!
!
!
!!
!
!!
!
!
!
!
!
! !
!
!!
!!
!
!!
!
!!
!
!!!
!
!
!
!
!!!
!!
!
!
!
Maximum: 426 %
Minimum: 157 %
300 %
200 %
400 %
Figure 12B. Winter season (November through April) precipitation for 1998, expressed as a percent of average winter precipitation, for the Nevada Test Site.
25
The drought of 1989 was pervasive, covering most of the NTS (fig. 13A), and particularly affecting winter precipitation. The drought was pronounced in the southwestern portion of the modeling domain. Low-elevation areas such as the Amargosa Desert and Crater Flat (fig. 1) received as little as 10 mm of annual precipitation. Parts of Yucca Mountain, at intermediate elevations, also experienced extreme drought with as little as 5 mm of annual precipitation. During this drought year, areas at lower elevations and further east than Yucca Mountain, such as Frenchman Flats, received about 26 mm of annual precipitation.
Differences between annual precipitation during 1989 and average precipitation were strongly dependent on elevation. Annual precipitation for 1989 varied between 2 and 71 percent of average annual precipitation (fig. 13B). The greatest precipitation deficit, which resulted in precipitation that was about 5 to 10 percent of average annual precipitation, occurred in the vicinity of Yucca Mountain and west of Jackass Flats in the southwestern part of the NTS. Precipitation was closest to normal at higher-elevation areas in the northern part of the NTS, including Pahute Mesa, where precipitation was about 50 percent of normal.
Seasonal Coefficients of Variations We examined temporal variability in precipitation by producing maps of the coefficient of
variation (CV) for the winter and summer seasons (fig. 14) based on interpolated precipitation from 1960 to 2006. The CV, defined as the standard deviation of a sample population divided by the mean of the sample, is one way of providing a meaningful comparison between sample populations (in this instance, precipitation at different locations). The CV is a useful statistic for comparing the degree of variation from one data series to another, even if the means of the data series are significantly different.
For winter precipitation, the CV generally was lower in the northwest (generally higher elevation) and higher in the southeast (lower elevation; fig. 14A). Other than the general pattern, local elevation gradients seem relatively unimportant for the winter season rainfall CV. A large radial gradient, or “bullseye,” indicates an outlier precipitation gage located on Pahute Mesa. The winter season CV near the gage was significantly higher than the CV of surrounding areas. For winter season CV, most values ranged between 0.42 and 0.65 (95 percent confidence interval).
Average summer season CV was equal to winter season CV with mean values of 0.54. However, summer season CV was more variable across the model domain as indicated by the larger 95 percent confidence interval of 0.36 to 0.71. Summer precipitation had a stronger northwest-southeast gradient with lower CVs in the northwest and higher CVs in the south and southeast (fig. 14B). Although local elevation gradients influence the summer season CV, there were also low relief areas with significant variability in CV. For example, there was a large gradient (0.56 to 1.04) for the summer season CV in the Amargosa Desert although there was little variation in elevation (less than 100 m) in this area. Note that the outlier precipitation gage for the winter season CV, which was located on Pahute Mesa, was not an outlier for the summer season CV. This indicates that the outlier was not likely due to a systematic problem such as an incorrect station elevation but rather a reflection of the winter season precipitation data at this station.
26
±
0 10 20
1989 annual precipitation, in millimeters (mm)
Kilometers
! Precipitation gage
Nevada Test Site boundary
116°40'0"W
116°40'0"W
116°20'0"W
116°20'0"W
116°0'0"W
6°0'0"11 W
36°40'0"N 36°40'0"N
37°0'0"N 37°0'0"N
37°20'0"N 37°20'0"N
!
!!
!
!
!
!
! !
!!!
!
!!
!
!!
!
!
!
!
!!
!
!
!!
!!
!
!
!
!!!!
!!
!! !
!!
!!
!!
!
! !!!
!
!
!
!
!
!
!!
! !
!
!!
!
! !
!
!
!!
!!
!
!
!
!
!
!
!
!
!
!
!
!
!
!
!
!
!
!
!
!
!
!
!
!
!!
!!
!
!!!!
!
!!!
!
!
!
!
!
!
!
!
Maximum: 185 mm
Minimum: 3 mm
50 mm100 mm
150 mm
Figure 13A. Annual precipitation for 1989, a year of severe drought, for the Nevada TeSite.
st
27
±
0 10 20
1989 annual precipitation,as percent of annual average
Kilometers
! Precipitation gage
Nevada Test Site boundary
116°40'0"W
116°40'0"W
116°20'0"W
116°20'0"W
116°0'0"W
6°0'0"11 W
36°40'0"N 36°40'0"N
37°0'0"N 37°0'0"N
37°20'0"N 37°20'0"N
!
!!
!
!
!
!
! !
!!!
!
!!
!
!!
!
!
!
!
!!
!
!
!!
!!
!
!
!
!!!!
!!
!! !
!!
!!
!!
!
! !!!
!
!
!
!
!
!
!!
! !
!
!!
!
! !
!
!
!!
!!
!
!
!
!
!
!
!
!
!
!
!
!
!
!
!
!
!
!
!
!
!
!
!
!
!!
! !
!
!!!!
!
!!!
!
!
!
!
!
!
!
!
Maximum: 71 %
Minimum: 2 %10 %
50 %
30 %
70 %
Figure 13B. Annual precipitation for 1989, expressed as a percent of average annual precipitation, for the Nevada Test Site.
28
±
0 10 20
coefficient of variation for winter precipitation
Kilometers
! Precipitation gage
Nevada Test Site boundary
116°40'0"W
116°40'0"W
116°20'0"W
116°20'0"W
116°0'0"W
6°0'0"11 W
36°40'0"N 36°40'0"N
37°0'0"N 37°0'0"N
37°20'0"N 37°20'0"N
!
!!
!
!
!
!
! !
!!!
!
!!
!
!!
!
!
!
!
!!
!
!
!!
!!
!
!
!
!!!!
!!
!! !
!!
!!
!!
!
! !!!
!
!
!
!
!
!
!!
! !
!
!!
!
! !
!
!
!!
!!
!
!
!
!
!
!
!
!
!
!
!
!
!
!
!
!
!
!
!
!
!
!
!
!
!!
! !
!
!!!!
!
!!!
!
!
!
!
!
!
!
!
0.43 - 0.50
0.50 - 0.60
0.60 - 0.70
0.70 - 0.80
Figure 14A. The coefficient of variation (CV) of winter season (November through Aprprecipitation for the Nevada Test Site.
il)
29
±
0 10 20
coefficient of variation for summer precipitation
Kilometers
! Precipitation gage
Nevada Test Site boundary
116°40'0"W
116°40'0"W
116°20'0"W 116°0'0"W
37°20'0"N 37°20'0"N!
! !
116°20'0"W 6°0'0"11 W
36°40'0"N 36°40'0"N
37°0'0"N 37°0'0"N
!
!!
!
!
!
!
! !
!!!
!
!!
!
!
!
!
!
!!
!
!
!
!!
!
!
!!
!
!
!
!!!!
!
!
!! !
!!
!!
!!
!
! !!!
!
!
!
!
!
!
!!
! !
!
!
!
!
!
!
!
!
!
!
!
!
!
!
!!
!
!
!
!
!!
!
!!!!
!!
!
!
! !
!
!
!!
!!
!
!
!
!
!!!
!!!
!
!
!
!
0.16 - 0.30
0.30 - 0.40
0.40 - 0.50
0.50 - 0.60
0.60 - 0.70
0.70 - 0.80
0.80 - 1.00
1.00 - 1.34
Figure 14B. The coefficient of variation (CV) of summer season (May through October) precipitation for the Nevada Test Site.
30
Time Series at Specific Sites Permanent ecological study plots on the NTS have been measured at irregular intervals
from 1963 through 2006 (Webb and others, 2003). The plots established by Janice Beatley had storage rainfall gages that recorded between 1963 and 1973, but for most plots, no precipitation data is available after 1973, requiring that precipitation be estimated from other sites. We used our interpolation technique to create time series of precipitation at three Beatley plots—plots 8, 46, and64 (fig. 1)—that span the elevation range of NTS to show the usefulness of this technique in understanding the potential for climatic influence on vegetation. As shown in figure 15, these three plots, which range in elevation from 961 to 2,274 m, generally show the same interannual variability; all three plots show the same pattern of above- and below-average annual precipitatioalthough the relative amounts exhibit a high amount of inter-annual variability.
For the NTS in general, 1978 is the wettest winter on record by a wide margin (fig. 8), bu1978, 1983, and 1998 have similar high annual precipitation (fig. 7). A similar pattern also occurs on the three Beatley plots (fig. 15), where 1969, 1978, and 1983 have the highest annual precipitation, followed closely by 1998. At Beatley plots 46 and 64, annual precipitation in 1969 ithe largest annual precipitation on record. In contrast, when all stations in the network were averaged, 1969 is the 4th wettest year on record. By comparing the observed and simulated precipit
n,
t
s
cated
th
e
ation at Beatley plot 64 with the adjacent active precipitation gage on Rainer Mesa, lowithin a distance of 1 km, it is evident that precipitation recorded during the winter of 1969 at Beatley plot 64 was much greater than that of the adjacent station. The simulated annual precipitation at Beatley plot 64 was 752 mm while a gage (100013) at a similar elevation of 2,283 m, located on the eastern side of the ridge between the two gages, recorded 480 mm of precipitation. Monthly precipitation was recorded at Beatley plot 64 for each month of 1969 withe exception of February. Based on 11 months of precipitation data, the recorded annual precipitation at Beatley plot 64 was at least 670 mm.
The drought of 1989-1991 is striking for these three plots; no other year in the record has as low an annual precipitation with as little variability with elevation as occurred in 1989, and the 3-year period is unprecedented in the 47-year interpolated record. This type of data provides support for the contention that the nature of the 1989-1991 drought, which had devastating effects on somplant species on the NTS (Webb and others, 2003), is unique to the historical record of precipitationon the NTS. Another significant drought occurred during 2002. Like the drought of 1989-1991, lower than average precipitation occurred at low, mid, and high elevations on the NTS during 2002.
31
1960 1970 1980 1990 2000 2010
Prec
ipo
mita
tin
(m)
0
200
400
600
800Beatley Plot 8
Beatley Plot 46
Beatley Plot 64
F(2,274 m, Beatley plot 64), an intermediate elevation (1,245 m, Beatley plot 46), and a low
t Site.
e
fr
w he high de tation
co lo
onclusions
l tically robust technique was used to estimate annual and seasonal precipitation on
the Nevada Test Site (NTS) at 30-m resolution, which is sufficient to allow reconstruction of
igure 15. Time series of annual precipitation from 1960 to 2006 for a high elevation
elevation (961 m, Beatley plot 8) permanent ecological study plot on the Nevada Tes
Study Limitations The quality of the spatial interpolation of precipitation described in this report is strongly
dependent on the accuracy of the precipitation data at individual gages and on the density of thgage network. Data were collected by different groups using different measurement devices,
equencies of data collection, data-collection protocols, and quality assurance procedures. Due to data gaps and changes in the number and location of actively recording precipitation gages, the density of the gage network changes both temporally and spatially. The density of the gage network
as insufficient to accurately represent small-scale thunderstorms with the exception of tnsity network around Yucca Mountain. While the accuracy and reliability of the precipi
estimates presented in this report are dependent on the quality of the precipitation data, they arealso dependent on the interpolation schemes we used. In general, interpolation tends to produce smoothed estimates of precipitation. In addition to the precipitation data, the accuracy of the interpolation scheme also depends on the resolution of the DEM; as the DEM resolution increases, the elevation of the DEM becomes more accurate, which improves the precipitation estimates. A simple interpolation scheme was employed in this report. A more detailed interpolation scheme
uld consider the location and direction of the precipitation gage relative to areas with significantcal relief.
CHigh-resolution spatial models for interpolating precipitation are highly useful in the
intermountain western United States, where networks of climate stations provide only sparse spatiacoverage. A statis
32
clirecprebeof
hought f vary
ntly itu av i th e Nnear-normal n w rs a ragd ye r-no ecipitat ccur hig whdrought occurs at lower elevations. With respect to evaluation of the causes of change in ecological s t on o chniqu gh-re n apse e on in e; for e hy h ele y not change as much in response to a drought period as lower-elevation sites.
in hniqu es the r lue o t-te . Fcalculation of mean annual precipitation and its interannual varianc cords of relatively l at erred. F onal int n, shor c proi t on for sp riods o at hel cre of within that region. Therefore, this technique incr data, which m i poral c but en e spa tia thin mountain West.
References Cited Bechtel Nevada, 2001, Ecology of the Nevada Test Site: An annota hy, C. A. Wills
and W. K. Ostler (eds.), DOE/NV/11718-594, Las Vegas, NV, 40Daly, C., Neilson, R.P., and Phillips, D.L., 1 tatisti pog r m
climatological precipitation over mountainous terrain: Journal of Applied Meteorology, v. 33, p. 8
D , , Physic ology: E od Cl ew ce HFlint, A.L., and Davies, W.J.,
s untai a: U.S. cal S Op t 96-Freedman, D., Pisani, R., and Purves, R., 1998, Statistics (3 edition): New York, W.W. Norton &
n appendF reli analysis pitati ou : Water Resources
Institute, DOE/NV/10162–10, 42 p. F b, Precipi southe
1023-1036. H , ., an pré, C.I recip h ojav
, 1 S. G al Surve heet 1 , 4Hereford, R., W ecipit his tem
ec tion ity in th e Desert and v 3–2001 f Arid Environments, v. 67, p. 13-34.
H s o nd faun evad t S : Laa, ent y, Nev ation e, V/1 77
mate at specific sites of interest, including permanent ecological study plots where climatic ords are discontinuous. Using this technique, one can evaluate both the spatial variation of cipitation during a given year as well as a time series of precipitation over a region. An added
nefit is the ability to calculate spatially distributed coefficients of variation, which give a measure the variation in reliability of precipitation over a region.
This technique allows us to evaluate different types of years that might otherwise be tas “wet years” and “dry years.” As shown in our graphical maps, wet years cano
significa in the magn precipitatio
de of above-hereas othe
erage precip tation, wibove-ave
some parts of the amounts. The sam
TS with e is true of have greatly
rought ars, where nea rmal pr ion can o at the hest elevations ile extreme
tudy plo s, one applicati f this te e—the hi solutio precipitation m —can help to xplain r gional variati respons xample, w igher- vation sites ma
F ally, this tec e chang elative va f shor rm climate datae, climate re
or stable
ong dur ion are pref or regi erpolatio t-term limate stations vide mportan informati ecific pe f time th
eases the imp to de
portance of short-termase the amount uncertainty
ay prov de poor tem overage hances th rse spa l coverage wi the inter-
ted bibliograp0 p.
994, A s cal-to raphic model fo apping
140-15 . ingman S.L., 1994 al Hydr
1997, Meteorological data for water nglewo iffs, N Jersey, Prenti all, 575 p.
years 1988-94 from five weather station at Yucca Mo n, Nevad Geologi urvey
rden-File Repor 462, 10 p.
Compa y, 578 p. + ices. rench, RCenter, Desert Research
.H., 1983a, A p minary of preci on in s thern Nevada
rench, R.H., 1983 tation in rn Nevada: Journal of Hydraulic Engineering, v. 109, p.
ereford R., Webb, R.H d Long ., 2004, P itation istory of the M e Desert region 893-2001: U.
ebb, R.H., and Longpré, C., 2006, Preologic y Fact S 17-03
ation p. tory and ecosys response to
multid adal precipita variabil e Mojav icinity, 189 : Journal o
unter, R.B., 1994, Statu f flora a a on the N a Tes ite, 1989-1991E/N
s Vegas, Nevadp.
U.S. Departm of Energ ada Oper s Offic Report DO 1432-57, 3
33
N I.A., and Wein, R.W., 1998, Spatial interpolation of climatic normals: Test of a new m od in the Canadian boreal forest: Agricultural and Forest Me 2, p. 211-225.
National Clima e S of the ville, C al C ta
, w1 aa.gov /docum ibr 00.Quiring, R.F., 1968, Climatological data, Nevada Test Site and Nuclear Rocket Development
: l Sc ervice A ration, D f Comm A ARL-7, Las Vegas, Nevada, 34 p.
Soulé, D.A., 2006, Climatology of the Nevada Test Site: S O ese on ) emo SORD Natio ea pher
Administration, Las Vegas, Nevada, 171 p. e.go e/Clima f_Th ada .Soule.p
Spaulding, W. G., 1985, Vegetation and clima h-ce vada: U ogica ey ape .
U.S. Geological Survey, 1999, National Elevation Dataset: U.S. Geological Survey Fact Sheet 148-99, http://ned.usgs.gov.
W .H ., E .C., Bo , DeF .A D.F., Ol .,
e on ada Te ye Co Ne log Fi 36,
alder, eth teorology, v. 9
atic Data Center, 2003, Data documily Cooperativ
entation for Data Set 3200 (DSI-3200), Surface Day: AshLand D ummary North arolina, Nation
td32limatic Da
p. 18, http://ww .ncdc.no /pub/data entl ary/tddoc/ pdf. Center
Station Environmenta iences S dminist U.S. epartment o erce, ESSTechnical Memorandum
pecial perations and Rmos
arch Divisi(SORD , Technical M randum 2006-3, nal Oc nic and At ic
http://www.sord.nv.do v/climat tology_o e_Nev _Test_Site df. ates of the last 45,000 years in the vicinity of the .S. GeolNevad Test Site, sout ntral Ne l Surv Professional P r 1329, 55p
ebb, R ., Murov, M.B sque, T yer, D.E. alco, L ., Haines, dershaw, DScoles, S.J., ThomFrom P
as, K.A., Blainey, J.B., armanent Plots
nd Medica, P.A., 2003, Perennial Vegetation Data st Site, NThe Nev unty, vada: U.S. Geo ical Survey
Open- le Report 03-3 251 p.
34
A n
T 1 r pr ion sta or adjacent to the Nevada Test Site, Nye County, Nevada. The only data used were fr2
n CDC or our un gned nu . Th are AR r
Resource Laboratory Special Operations Research Division (http://www.sord tm); E a c by Janice (Web he MP, u a
in the files of the Basic Environmental Compliance And Monitoring Program lso see Soulé, 2006); l 97; evada De (Free bon ment)
(https://www.unlv.edu/Climate_Change_Research/NDFF/); NCDC, National nter (see w umm mnv.html , Yuc nta gical Mon
(http://www.ymp.dri.edu/index.html). Many stations have isolated month(s) o
Station Station Name UTM NAD 27 ng
UTM NAD 27 Z11 northing
Elevation (m
Data Source
ppe dix
able A . Metadata fo ecipitat tions onom January 1, 1960, through December 31,
006.
[Statio ID is either the N number iquely assi mbers e data sources .nv.doe.gov/arlsord-1.h
L-SORD, Ai
BEATL Y, unpublished dat ollected C. Beatley b and ot rs, 2003); BECA archives, NTS (a
npublished dat
F&D, F int and Davies, 19 NDFF, N sert FACE Air Car dioxide Enrich Climatic Data Ce
Facility
http://w w.wrcc.dri.edu/s ary/Clims ); YMMM ca Mou in Meteorolof missing data.]
itoring
Z11 easti eters) Period of Record
ID 100001 40 Mile Canyon 563357 4100361 1,469 ARL-SORD
North February 1960- January 2007
100002 Area 06 (South) 586028 4083950 1,131 ARL-SORD
100015 Tippipah Spring 571899 4100860 1,518 ARL-SORD
February 1997- January 2007 February 1960- January 2007 September 1964- January 2007 October 1963- January 2007 December 1996- January 2007 January 1958- January 2007 August 1976- January 2007 April 1962- October 1963, March 1971 - January 2007 September 1964- January 2007 January 1964- January 2007 October 1964- January 2007 January 1960- January 2007 March 1963- January 2007 May 1960-
2 January 2007
35
Station ID
Station Name UTM NAD 27 Z11 easting
UTM NAD 27 Z11 northing
Elevation (meters)
Period of Record Data Source
100016 Well 5B 592307 4073198 939 ARL-SORD October 1962- January 2007
100017 Yucca Dry Lake 584801 4090255 1,196 ARL-SORD
January 1960 – January 2007 May 1962- December 1972May 1962- December 1972May 1962- December 1972May 1962- December 1972 May 1962- December 1972May 1962- December 1972June 1962- December 197June 1962- December 1972 July 1962- Beatley PDecember 19July 1962- December 1972 July 1962- December 19July 1962- December 19July 1962- December 1972 July 1962- BeatleDecember 197August 1962- December 197
Beatley Pl August 196December 1972May 1962- December 1972July 1962- December 1972August 1962- December 1972 June 1962- December 1972 August 1962- December 1972 July 1962- December 1972 September 1962- December 1972May 1962- December 197July 1962- December 1972
36
Station ID
Station Name UTM NAD 27 Z11 easting
UTM NAD 27 Z11 northing
Elevation (meters)
Period of Record Data Source
200026 Beatley Plot 26 579921 4073999 1,232
BEATLEY July 1962- December 1972
200027 Beatley Plot 27 584859 4083111 1,132
BEATLEY
200028 tley Plot 28 596375 4079026 1,007 BEATLEY
200029 atley Plot 29 596029 4079195 987 BEATLEY
200030 atley Plot 30 594676 4076565 957 - BEATLEY
200031 tley Plot 31 595205 4075785 954 BEATLEY
200032 Beatley Plot 32 601437 4077160 1,031 2-
BEATLEY
200033 Beatley Plot 33 599466 4075291 1,009 2-
BEATLEY
200034 Beatley Plot 34 597801 4072852 935 BEATLEY
200035 Beatley Plot 35 597718 4070719 1,015
BEATLEY
200036 Beatley Plot 36 596154 4071024 935 BEATLEY
200037 Beatley Plot 37 596205 4071199 953 er 1962- BEATLEY
200039 Beatley Plot 39 574144 4086703 1,467 er 1962- BEATLEY
200040 574111 4086567 1,467
BEATLEY
200041 Beatley Plot 41 572760 4090653 1,538 972
BEATLEY
200042 Beatley Plot 42 572741 4090564 1,538
BEATLEY
200043 Beatley Plot 43 582700 4090610 1,274
BEATLEY
200044 Beatley Plot 44 581064 4092802 1,257
BEATLEY
200045 Beatley Plot 45 580226 4093124 1,284
BEATLEY
200046 Beatley Plot 46 581490 4095855 1,245 972
BEATLEY
200047 Beatley Plot 47 573852 4097457 1,472
BEATLEY
200048 Beatley Plot 48 580904 4101103 1,283 December 1972
BEATLEY
4101986 1,258 September 1962- December 1972
BEATLEY
200050 Beatley Plot 50 583510 4103740 1,337 September 1962- December 1972
BEATLEY
200051 Beatley Plot 51 576317 4114983 1,535 September 1962- December 1972
BEATLEY
200052 Beatley Plot 52 586286 4114822 1,359 September 1962- December 1972
BEATLEY
July 1962- December 1972July 1962- BeaDecember 1972 July 1962- BeDecember 1972
Be September 1962December 1972 July 1962- BeaDecember 1972 September 196December 1972September 196December 1972August 1962- December 1972 August 1962- December 1972August 1962- December 1972 OctobDecember 1972 August 1962December 1972 OctobDecember 1972
Beatley Plot 40 August 1962- December 1972July 1962- December 1November 1962- December 1972July 1962- December 1972September 1962- December 1972September 1962- December 1972September 1962- December 1September 1962- December 1972September 1962-
200049 Beatley Plot 49 581946
37
38
Station ID
Station Name UTM NAD 27 Z11 easting
UTM NAD 27 Z11 northing
Elevation (meters)
Period of Record Data Source
200053 Beatley Plot 53 586246 4113580 1,431 September 1962- December 1972
BEATLEY
200054 Beatley Plot 54 586853 4112702 1,362 September 1962- December 1972
BEATLEY
200055 Beatley Plot 55 586661 4108742 1,330 October 1962- December 1972
BEATLEY
200056 Beatley Plot 56 589772 4104270 1,339 September 1962- December 1972
BEATLEY
200057 Beatley Plot 57a 589658 4099870 1,271 September 1962- December 1972
BEATLEY
200058 Beatley Plot 58 585317 4095326 1,200 September 1962- December 1972
BEATLEY
200059 Beatley Plot 59 585367 4092811 1,195 September 1962- December 1972
BEATLEY
200060 Beatley Plot 60 589802 4090961 1,216 September 1962- December 1972
BEATLEY
200061 Beatley Plot 61 566068 4109952 1,746 August 1962- December 1972
BEATLEY
200062 Beatley Plot 62 565982 4110613 1,749 August 1962- December 1972
BEATLEY
200063 Beatley Plot 63 566441 4117269 2,001 August 1962- December 1972
BEATLEY
200064 Beatley Plot 64 570131 4116946 2,274 August 1962- December 1972
BEATLEY
200065 Beatley Plot 65 566790 4105957 1,697 December 1962- December 1972
BEATLEY
200066 Beatley Plot 66 574614 4074332 1,294 August 1963- December 1972
BEATLEY
200067 Beatley Plot 67 574566 4074243 1,294 August 1963- December 1972
BEATLEY
200068 Beatley Plot 68 566887 4114217 1,846 March 1964- December 1972
BEATLEY
260150 Amargosa Farms Garey1
548226 4047300 747 December 1965 – January 2007
NCDC
260714 Beatty1 522348 4085464 1,007 July 1948 – November 1972
NCDC
260718 Beatty 8 N1 525146 4094158 1,082 December 1972 – January 2007
NCDC
263980 Indian Springs1 617873 4049258 952 July 1948 – June 1964
NCDC
264457 Lathrop Wells1 553710 4056018 814 July 1948 – January1963
NCDC
264473 Lathrop Wells 16 SSE1
558353 4030168 665 November 1973 – August 1977
NCDC
300001 ADA 27 554319 4061008 866 March 1965- September 1969
BECAMP
300002 CETO Building Mercury
589605 4058071 1,165 March 1973- June 1995
BECAMP
300003 GMX 595349 4078255 969 August 1976- April 1980
BECAMP
300004 Little Feller 1 560666 4106905 1,573 August 1976- May 1984
BECAMP
300005 Lookout Peak 574240 4078970 1,720 August 1962- February 1967
BECAMP
39
Station ID
Station Name UTM NAD 27 Z11 easting
UTM NAD 27 Z11 northing
Elevation (meters)
Period of Record Data Source
300006 Pahute Mesa 2 547858 4128209 1,933 September 1964- December 1969
BECAMP
300007 Pahute Mesa 3 555124 4124032 1,978 September 1964- December 1969
BECAMP
300008 Pahute Mesa 4 561338 4123089 2,103 September 1964- December 1969
BECAMP
300009 Pahute Mesa 5 561477 4131041 2,058 September 1964- December 1969
BECAMP
300010 PU 13 596584 4130355 1,396 August 1976- April 1984
BECAMP
300011 Schultz Ranch 538173 4047887 727 March 1964- December 1969
BECAMP
300012 Shoshone Basin 566446 4087565 1,725 August 1962- December 1969
BECAMP
300013 Station 353 582221 4111402 1,329 August 1962- September 1964
BECAMP
300014 Rock Valley Plot A
571586 4059846 1,018 October 1969- February 1976
BECAMP
300015 Rock Valley Plot B
571994 4060169 1,050 October 1969 – April 1976
BECAMP
300016 Rock Valley Plot C
572549 4060354 1,020 October 1969- July 1979
BECAMP
300017 Rock Valley Plot D
572425 4060844 1,035 October 1969 – March 1975
BECAMP
400001 NTS-60 550772 4077380 1,143 December 1985- January 2006
YMMM
400002 Yucca Mountain 547644 4078749 1,478 January 1989- January 2006
YMMM
400003 Coyote Wash 548883 4078694 1,279 January 1989- January 2006
YMMM
400004 Alice Hill 553111 4079767 1,235 February 1990- January 2006
YMMM
400005 Gate 510 553418 4058384 838 January 1993- January 2006
YMMM
400006 WT-6 549377 4083103 1,315 July 1992- January 2006
YMMM
400007 Sever Wash 552801 4077854 1,081 July 1992- January 2006
YMMM
400008 Knothead Gap 551154 4075780 1,131 July 1992- January 2006
YMMM
500001 Nevada Desert FACE Facility
592223 4069284 965 October 1996- January 2007
NDFF
880001 WX-1 550424 4076521 1,163 January 1988- September 1995
F&D
880002 WX-2a 564332 4075931 1,154 May 1987- December 1989
F&D
880003 WX-2b 563430 4071986 1,055 January 1990- September 1995
F&D
880004 WX-3 548038 4080316 1,351 August 1987- September 1994
F&D
880005 WX-4a 547504 4076856 1,498 January 1988- December 1990
F&D
880006 WX-4b 547481 4075990 1,489 January 1991- September 1995
F&D
40
Station ID
Station Name UTM NAD 27 Z11 easting
UTM NAD 27 Z11 northing
Elevation (meters)
Period of Record Data Source
880007 WX-5a 546453 4083775 1,789 July 1988- December 1993
F&D
880008 WX-5b 547984 4082370 1,563 January 1994- September 1995