Modeling Water Quality In Modeling Water Quality In Drinking Water Distribution Drinking Water Distribution Systems: Its Potential for Systems: Its Potential for Enhancing Water Security Enhancing Water Security By: Robert Clark
Transcript
Modeling Water Quality In Drinking Modeling Water Quality In Drinking Water Distribution Systems: Its Water Distribution Systems: Its Potential for Enhancing Water Potential for Enhancing Water
SecuritySecurity
By: Robert Clark
Will DiscussWill Discuss
Concern over the vulnerability of water Concern over the vulnerability of water distribution systems to security threats distribution systems to security threats
Basics of water quality modeling and its Basics of water quality modeling and its application in drinking water networksapplication in drinking water networks
Two examples of water quality modeling Two examples of water quality modeling for water security for water security
The future use of water quality modeling The future use of water quality modeling as part of a decision support framework as part of a decision support framework
9/11 Raised Concerns About Critical 9/11 Raised Concerns About Critical Infrastructure in the USInfrastructure in the US
Water supply was identified as critical Water supply was identified as critical infrastructureinfrastructure
It is now general consensus that the It is now general consensus that the vulnerability of drinking water networks vulnerability of drinking water networks systems to security threats is a major systems to security threats is a major concernconcern
Utility industry has also recognized the Utility industry has also recognized the importance of environmental monitoring in importance of environmental monitoring in maintaining water securitymaintaining water security
Drinking Water Systems In The U.S.Drinking Water Systems In The U.S.
There are 54,000 community water There are 54,000 community water systems in US serving 264 million peoplesystems in US serving 264 million people
79% of the population receives drinking 79% of the population receives drinking water from large utilities (serving 10,000 or water from large utilities (serving 10,000 or more), representing 14% of the systemsmore), representing 14% of the systems
21% of the population receives water from 21% of the population receives water from small utilities (serving less than 10,000 small utilities (serving less than 10,000 people) representing 86% of the systemspeople) representing 86% of the systems
U. S. Water Supplies Have Common U. S. Water Supplies Have Common CharacteristicsCharacteristics
Water source Water source A lake, reservoir, river or ground water from an aquiferA lake, reservoir, river or ground water from an aquifer Surface supplies generally have conventional Surface supplies generally have conventional
treatment facilities and disinfectiontreatment facilities and disinfectionGround water systems Ground water systems May have full range of treatment technology but some May have full range of treatment technology but some
practice chlorination only or do not disinfect at allpractice chlorination only or do not disinfect at allTransmission systems Transmission systems Tunnels; reservoirs and/or pumping facilities; and Tunnels; reservoirs and/or pumping facilities; and
storage facilitiesstorage facilitiesDistribution system Distribution system Carrying finished water pipes to consumerCarrying finished water pipes to consumer
Distribution System is Most Distribution System is Most Vulnerable Part of Water SystemVulnerable Part of Water System
Community water supplies designed to deliver water Community water supplies designed to deliver water under pressure and most of the system capacity is under pressure and most of the system capacity is reserved for fire fighting purposesreserved for fire fighting purposes
Could damage or destroy a tank or reservoirCould damage or destroy a tank or reservoir Potential for the deliberate introduction of Potential for the deliberate introduction of
contaminants into a distribution system (back flow, contaminants into a distribution system (back flow, cross connections)cross connections)
Need to be able to predict contaminant transport Need to be able to predict contaminant transport pathways and to measure concentration of pathways and to measure concentration of contaminants in networks contaminants in networks
Cyber attack could also provide a serious threat to an Cyber attack could also provide a serious threat to an utilities operations. However many SCADA systems are utilities operations. However many SCADA systems are not connected to the Internetnot connected to the Internet
Predicting Contaminant Movement In Predicting Contaminant Movement In Drinking Water Distribution SystemsDrinking Water Distribution Systems
Movement of water in distribution systems is Movement of water in distribution systems is complexcomplex
The ability to predict movement is still relatively The ability to predict movement is still relatively crudecrude
Also need to be able to predict changes in Also need to be able to predict changes in concentration of contaminants concentration of contaminants
Few attempts to integrate monitoring and modelingFew attempts to integrate monitoring and modeling
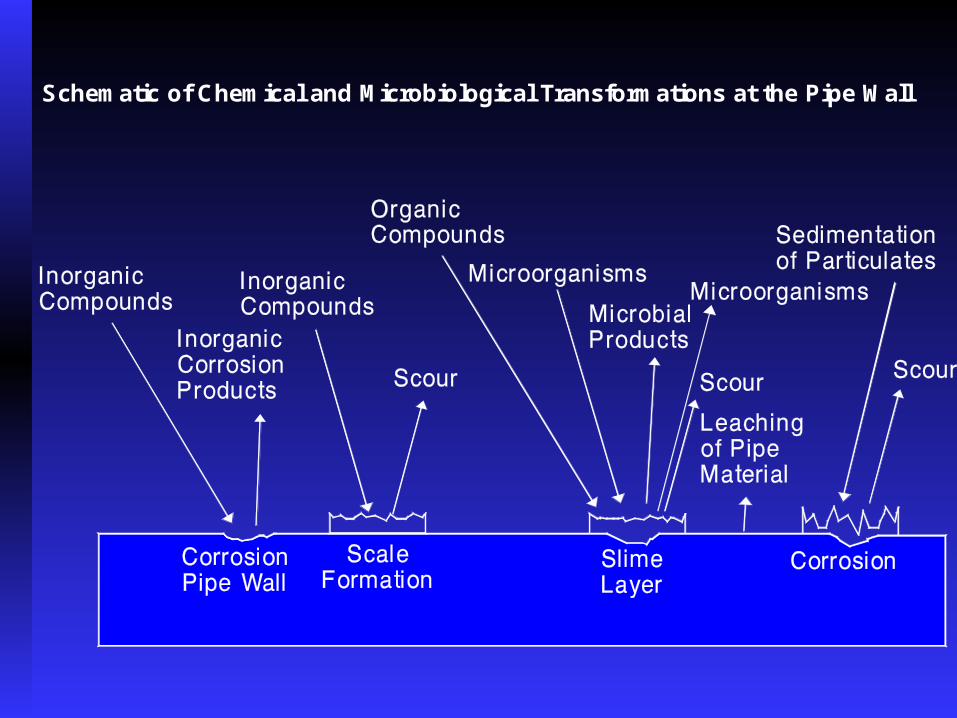
Contaminants May Be Conservative, or Contaminants May Be Conservative, or May Experience Decay or Growth May Experience Decay or Growth
Changes may take place in the bulk phase Changes may take place in the bulk phase or at the pipe wallor at the pipe wall
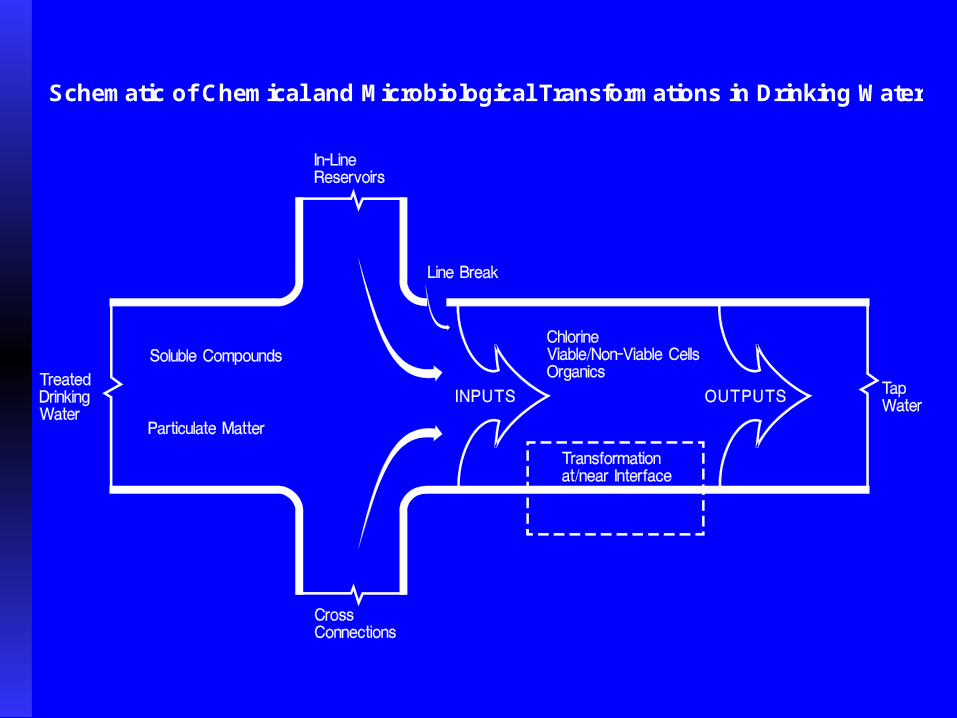
Quality may be influenced by:Quality may be influenced by: Cross ConnectionsCross Connections Failures at the Treatment BarrierFailures at the Treatment Barrier Transformations in the bulk phaseTransformations in the bulk phase
Schematic of Chemical and Microbiological Transformations at the Pipe Wall
Schematic of Chemical and Microbiological Transformations in Drinking Water
Water Quality Modeling PrinciplesWater Quality Modeling Principles
Conservation of mass within differential lengths of pipeConservation of mass within differential lengths of pipe
Complete and instantaneous mixing of the water enteringComplete and instantaneous mixing of the water enteringpipe junctionspipe junctions
Appropriate kinetic expressions for the growth or decay of theAppropriate kinetic expressions for the growth or decay of thesubstance as it flows through pipes and storage facilitiessubstance as it flows through pipes and storage facilities
This change in concentration can be expressed by a differentialThis change in concentration can be expressed by a differentialequation of the form:equation of the form:
ijijij
ijij Ck
dx
dCv
dt
dC
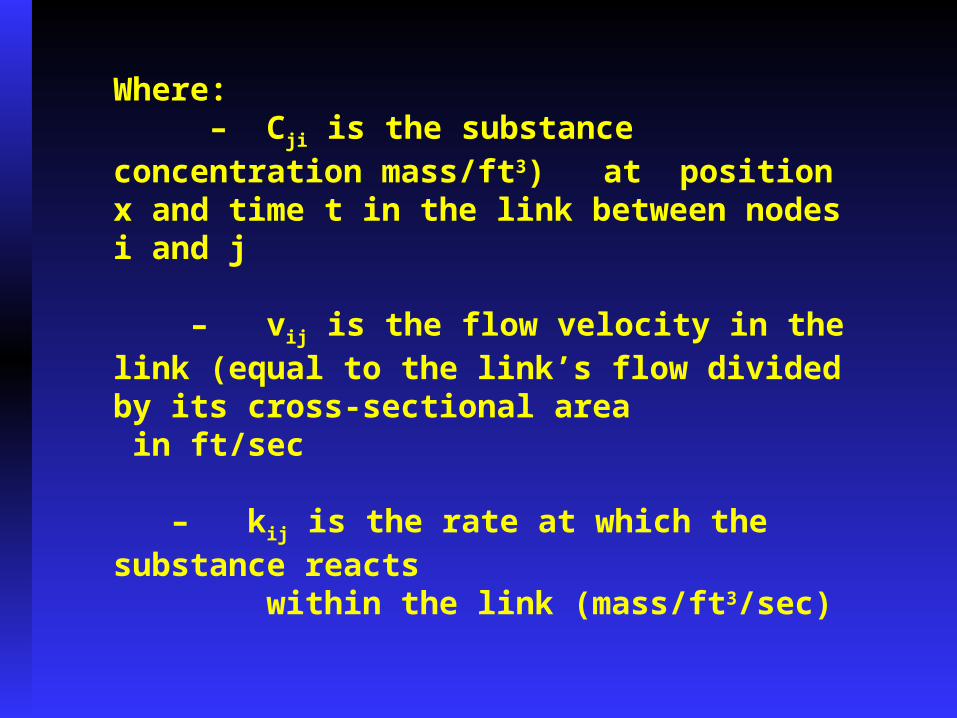
Where: – Cji is the substance concentration mass/ft3) at position x and time t in the link between nodes i and j
– vij is the flow velocity in the link (equal to the link’s flow divided by its cross-sectional area in ft/sec
– kij is the rate at which the substance reacts within the link (mass/ft3/sec)
Storage tanks can be modeled as completely mixed,Storage tanks can be modeled as completely mixed,variable volume reactors where the change in volumevariable volume reactors where the change in volumeand concentration over time are:and concentration over time are:
Where:Where:- V- Vss is the volume (ft is the volume (ft33) of the tank) of the tank- C- Css is the concentration in tank s is the concentration in tank s
)()(
silj ssjLkksksss
k jkjks
s
CkCQCQdt
CVd
QQdt
dV
The following equation represents the concentration of materialThe following equation represents the concentration of materialleaving the junction and entering a pipe:leaving the junction and entering a pipe:
kj
Lxkjkj
xij Q
CQC
00xij
C
WhereWhere::
linktheofendtheationconcentrattheisC
and
linktheofbeginningtheationconcentrattheisC
Lxkj
xij
0
Model InteractionWater quality models are generally piggy backed on hydraulic models.
Water Quality Model
Hydraulic Model
Flows and velocities
Water quality results
Will Use EPANET To Illustrate the Need Will Use EPANET To Illustrate the Need For Integrating Modeling and For Integrating Modeling and
MonitoringMonitoring First example will be the application of First example will be the application of
EPANET to North Marin Water District in EPANET to North Marin Water District in California California • Illustrates the linkage between monitoring Illustrates the linkage between monitoring
and modelingand modeling Second example is the waterborne outbreak Second example is the waterborne outbreak
in Cabool Missouri in 1990in Cabool Missouri in 1990• Forensic application of modelingForensic application of modeling
Modeling of ContaminantsModeling of Contaminants
First field study using EPANET in First field study using EPANET in North Marin CaliforniaNorth Marin California
Modeled chlorine residual Modeled chlorine residual propagation and THM formationpropagation and THM formation
Applied to two source systemApplied to two source system
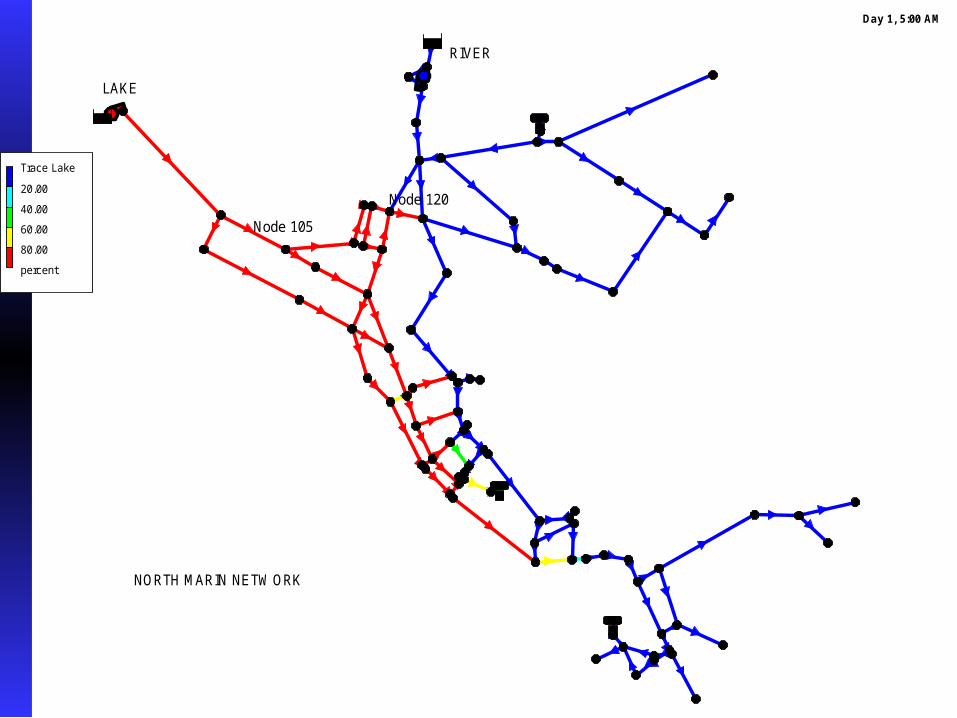
North Marin Water SystemNorth Marin Water System
Located near Novato , CaliforniaLocated near Novato , California Serves over 50,000 peopleServes over 50,000 people Virtually no rainfall during warm summer Virtually no rainfall during warm summer
monthsmonths Uses two sources of dramatically different Uses two sources of dramatically different
quality quality
LAKE
RIVER
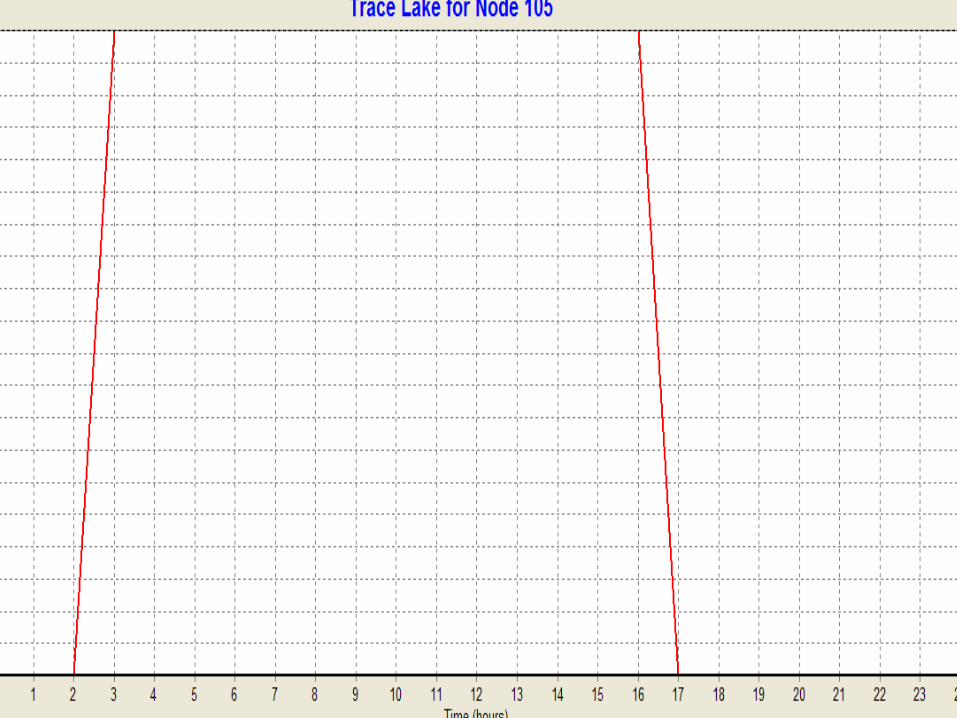
Node 105
Node 120
NORTH MARIN NETWORK
Trace Lake
20.00
40.00
60.00
80.00
percent
Day 1, 5:00 AM
TTHM Formation for Stafford Lake and North Marin Aquaduct
Salmonella contamination occurred in Salmonella contamination occurred in municipal tank due to failure of hatches municipal tank due to failure of hatches and ventsand vents
Taste and odor complaints caused water Taste and odor complaints caused water officials to start flushing programofficials to start flushing program
Out of population of approximately 1000 Out of population of approximately 1000 people, 440 became ill and 7 people diedpeople, 440 became ill and 7 people died
Used model to track outbreak and identify Used model to track outbreak and identify sourcesource
EPANET Applied to Waterborne EPANET Applied to Waterborne Outbreak in Gideon Missouri in 1993Outbreak in Gideon Missouri in 1993
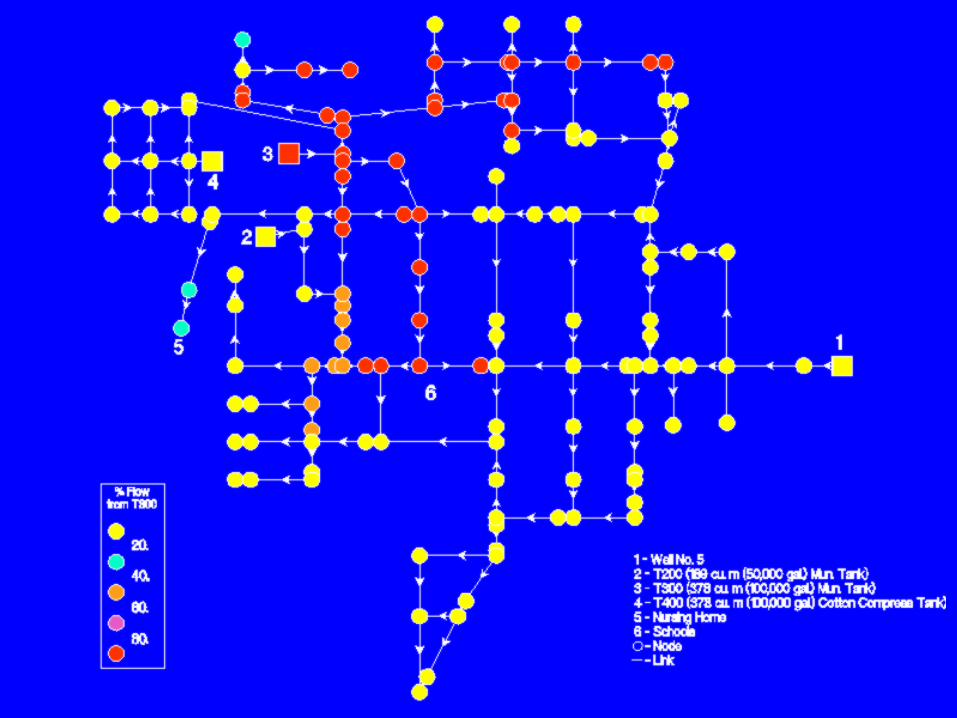
Municipal Water System in Gideon Municipal Water System in Gideon Was Old and in DisrepairWas Old and in Disrepair
Tuburculation and corrosion in the Tuburculation and corrosion in the distribution pipes was a major problemdistribution pipes was a major problem
Two municipal tanksTwo municipal tanks Another tank was located on the Another tank was located on the
property of the Cotton Compress which property of the Cotton Compress which was the major employer in the areawas the major employer in the area
Waterborne OutbreakWaterborne Outbreak
On November 29, 1993 Communicable On November 29, 1993 Communicable Disease Coordinator for the Missouri DOH Disease Coordinator for the Missouri DOH became aware of two high school students became aware of two high school students with culture confirmed with culture confirmed SalmonellosisSalmonellosis
Within two days five additional patients were Within two days five additional patients were hospitalized with confirmed hospitalized with confirmed salmonellosissalmonellosis
Missouri Department of National Resources Missouri Department of National Resources was informed that DOH suspected a water was informed that DOH suspected a water supply link to outbreaksupply link to outbreak
DNR samples were positive for fecal coliformDNR samples were positive for fecal coliform City of Gideon was required to issue a boil City of Gideon was required to issue a boil
water orderwater order
Number of Absentees in Gideon Schools
Homes with Cases Between 11/23 – 11/28 and 11/29 – 12/10 1994 in Gideon, Missouri
Comparison of Early Confirmed Comparison of Early Confirmed Cases and Salmonella Positive Cases and Salmonella Positive Sample Versus Penetration of Sample Versus Penetration of Tank Water During First Six Tank Water During First Six Hours of Flushing ProgramHours of Flushing Program
Current Status of Water Quality/Hydraulic Current Status of Water Quality/Hydraulic ModelsModels
Increasingly sophisticatedIncreasingly sophisticated Applied to exposure studiesApplied to exposure studies
• ATSDR study on contaminated ground ATSDR study on contaminated ground waterwater
Much research into modeling changes in Much research into modeling changes in water qualitywater quality• Formation of DBPs and Chlorine ResidualsFormation of DBPs and Chlorine Residuals
Tank Mixing ModelsTank Mixing Models
EPA Research in Real Time Monitoring EPA Research in Real Time Monitoring SystemsSystems
First EPA effort was development of sensors for First EPA effort was development of sensors for temperature, chlorine residual, fluoride and nitrate temperature, chlorine residual, fluoride and nitrate data with Battelledata with Battelle
Asked to assist during MCL violation in Asked to assist during MCL violation in Washington DCWashington DC
Initiated research on development of sensors and Initiated research on development of sensors and probes for chlorine residual, pH and temperature probes for chlorine residual, pH and temperature using pipe loopsusing pipe loops
Applied to DC water systemApplied to DC water system Future efforts should focus on integrating modeling Future efforts should focus on integrating modeling
and monitoringand monitoring
Summary and ConclusionsSummary and Conclusions
Water systems have been classified Water systems have been classified as critical infrastructureas critical infrastructure
Identified as potentially vulnerableIdentified as potentially vulnerable Contaminant Propagation Can be Contaminant Propagation Can be
Modeled and there are various Modeled and there are various models availablemodels available
EPANET is a public sector model EPANET is a public sector model that has become widely usedthat has become widely used
Summary and ConclusionsSummary and Conclusions
EPA has been conducting research into EPA has been conducting research into sensor development sensor development
Applied to operation of small package Applied to operation of small package plantsplants
Extended to chlorine residual monitoring Extended to chlorine residual monitoring in Washington DC systemin Washington DC system
Future research will focus on integrating Future research will focus on integrating remote sensing and water quality remote sensing and water quality modelingmodeling