Journal oJ C'LacioLog) ', r 'oL, 42, S o, 141 , 1996 Modelling albedo and specific balance of the Greenland ice sheet: calculations for the Sondre Strol'llfjord transect Z. Zuo AND J. OERLE.\JA.'\S In stitllteJor .Iiarine alld :lt mosjJ/zeric R esearch Utrecht , Utrecht Ullil 1 f}' sit)l, Pr illcetolljJLeill 5, 3584 CC, Clrecizt , Th e .\ 'e th erlands ABSTRACT. Glacio-met eoro logica l dat a o btained durin g the Gr eenla nd Ice M arg in Exp e rim e nt (GIMEX ) im'es ti ga ti o n s in Wes t Green land (the Sondre Stromuord tr a nsect) hav e b ee n used to test and ca li brate four energy-balan ce /mass- balance mo del s for the ice /sn ow s UI{a ce , Th e region is ch arac ter ised by the de\'elo pme nt o f a \\'id e zo ne of 10\\' s urfa ce a lb edo in th e co ur se of the mel tin g season. Thi s zo ne was simul a ted in onc of the e ner gy -balance mod els by inc ludin g th e e IT ee t of s urfi cial melt wate r on a lbedo. Ob servecl mass-balance a nd albedo d aw were u se d to co nstrain the mod els. Alth oug h a ll the mod els arc ca pa ble of pred ict ing the tran sect balan ce reasonably we ll , only the mo cl el with th e me lt water- albedo co uplin g, is a bl e to re pr o du ce th e obsen 'ed alb edo pa tt e rn a nd mass -b ala nc e pro fil e a lo n g th e tran sec t. By includin g the f ee db ack be tw een surficial me ltw ater and al bedo in the mode l, the sensiti\ 'ity of the specific balan ce to changes in a ir te mp era ture is f ou nd to be gr ea test ju st below the e quilibrium line (in co ntra st to wh a t is genera ll y found for va ll ey glaciers ) , A I K warmi ng of th e a ir temp er at ur e wou ld increase th e m ea n ab lat io n a long th e transect by 0.5 m w.e. yea r I. INTRODUCTION In recenr years, studi es h m'e been done 0 11 th e dyna mi c r es ponse of th(" Greenland ice sheet to c lim at ic change, with e mpha sis on its possible co ntributi on to sea-Ie\'c1 ri se in rase of globa l warm in g (Amb ac h, 1979; We idi ck, 1984; Br ai thwai te a nd Olese n, 1 990; H u\' br ec ht s a nd others, 199 1; O e rl e man s, 1 99 1; \ ' an de \\' al and Oerlem ans, 1994), Simu lat ion of the ice sheet by num erical mod els depends c riti ca ll y on th e way in \\'hich the surf ace m ass ba lance is fo rmulated. Th e s urf ace balanc e ca n b e pr esc ribed , calc ul ated w ith a d eg ree-d ay mod el (e.g. Bra ith\\ 'aite and Ol ese ll , 1989; R ee h, 199 1) or wi th an energy -b alance model (e.g. Oe rlcm a ns, 199 1), or ta ken from GCi\ 1 o utput (Ohmur a a nd Wild , 1995 ) . In o ur \'iew, th e energy- balance m ode l is an a ttr ac ti ve tool for simul at in g th e surfa ce mass ba lance, since th e ph ys ical processes on the s urf ace ca n be desc ri bed fairly exp li cilh' in the mode l. Up till n ow , however, ma ss -b alance mod e ls for th e Green la nd i ce sh ee t, follo\\'ing either the d eg ree-d ay (Reeh, 19 9 1) or energy -b alance app roac h (O erl emans, 199 1; Va n d e \\ 'a l and Oerlemans, 1994) h ave not been ri gorously \'a lid a ted , On e of th e problems is th e lack of re pr ese nt a ti\ 'e dat a, Neve rth ele ss , wc feel th a t th e d a ta we no\\' ha\'e a\'ail ab le a ll ow us to perform be tt er model tests than tho se pe rform ed so fa r. Th e Sondr e Stromuord tran sect prO\'id es us with a goo d o pportunit y, sin ce 4 years of ma ss - balance obser\'at ions are n ow a\'a il ablc, toget her with th e r es ult s of t\\ 'O detailed met eoro logical expe riment s (GI lVIEX- 90 a nd GIl\ fEX-91 ; sec Fig. I for the se t-up ). In the co ur se o f th e wo rk along th e Sondre tran sec t, h owever , it h as be come clear th at th e melt ph\'sics of thi s part of the ice sh eet are co mplicat ed , I n partic ular , th e sp at ia l \'<lr ia bilit y and tempora l evo lution of the a lb e do makes mod elling diffic ult. Thi s is illustrat ed in Fig ur e 2 which shows the daily mean a lb ed o as mca s ur ed at sit es 4--9 (sce Fig , I for loca tion s), t oge ther \\'ith a s nap shot of the spa tial distribution of th e a l b ed o in th e meltin g zone of cen tral 'V es t Green la nd , as deri\'ed fr om a NOAA -A \ ' HRR ( Ad\'anced Ver y Hi gh R esolution R ad i ometer ) im age ( Kn a p a nd Oerl e man s, 1 996 ). In the co u rse of' the melt seaso n, a band of low a lb e do de\ 'elops pa rall el to the ice edge, the physics of wh ic h are poorly under stood . \\ re will discuss this fea tur e a t length and tr y to re produ ce it in one of o ur mode ls. R ecently, 4 yea r observa tions of mass balance h a\'e be co me a\'a il ab le (g i\ 'e n in table in Van de \Val an d ot her s ( in pr ess ); Fi g. 3). Althou gh a sta ndard de\ 'iation ca n be ca lculat ed for eac h sta b ' loca tion on th e basis o f the int e rannual \'a ri a bility within thc 4 yea r per iod, it is not cl ea r ho\\' represe nt at i \'C th c ba la n ce profile is for th e long- te rm (for in stan ce, 30 year) mean, An add iti onal problcm is that th e energy -b alance model rcquir es input dat a that are not \ 'C ry we ll knO\\'Il . Fo r examp le, liltle is kno\\ 'n abo ut pr ec ip il a ti on, Although regu la r wea th e r obse r va - tion s a re ca rr ied out at Sondr e Stromu ord airp ort, it is ha rd to sec that pr eci pitation a mount s m eas ur ed th ere arc re pr ese nt al iv e [o r th e ice -sheet secto r uncl er stud y, For in s tanc e, it is kn o wn that in summ er significant co nv ec ti\'e pr ec ipita li on occ ur s O\ 'er the tundr a but not O\ 'er th e ice sh ee t. Al so, b eca u se of orographic e IT ects consid erab le var iation can occ ur on a 100 km sca le , In spile of th ese and 305
Transcript
Journal oJ C'LacioLog)', r 'oL, 42, S o, 141 , 1996
Modelling albedo and specific balance of the Greenland ice sheet: calculations for the Sondre Strol'llfjord transect
Z. Zuo AND J. OERLE.\JA.'\S
InstitllteJor .Iiarine alld :ltmosjJ/zeric Research Utrecht , Utrecht Ullil1f}'sit)l, PrillcetolljJLeill 5, 3584 CC, Clrecizt , The . \ 'e therlands
ABSTRACT. Glacio-meteoro logical data o btained during the Gree nl a nd I ce M argin Expe riment (GIMEX ) im'es tiga ti o ns in Wes t Green land (th e Sondre Stromuord tra nsec t) have been used to tes t and cali brate four energy-ba la nce/ m assba lance m odel s for the ice/snow sUI{a ce , Th e region is ch arac terised by the de\'elopment o f a \\'ide zo ne of 10\\' surface a lbedo in th e course of the m e lting season. Thi s zo ne was simula ted in onc of the e nergy-bal a nce mod els by including th e eITeet of surfi c ia l meltwate r on a lbedo. Obse rvecl mass-ba lance a nd a lbedo d aw were used to constrain th e mod els. A lthough a ll the models a rc ca pa ble of pred ict ing the transec t ba la nce reasona bl y we ll , only th e m ocl e l with th e me ltwater- a lbedo co upling, is a ble to reproduce th e obsen'ed a lbedo pa tte rn a nd mass-ba la nce profil e a lo ng th e transec t. By including th e feedback betwee n surfi cia l meltwa te r a nd a lbedo in the mode l, the sensiti\'ity of the spec ific bal a nce to c ha nges in a ir te mpera ture is fou nd to be grea test just below th e equilibrium line (in contrast to wh a t is genera ll y found for va lley g laciers ) , A I K warmi ng of th e a ir temperat ure wou ld in crease th e m ean ablat ion a long th e transec t by 0.5 m w.e. yea r I.
INTRODUCTION
In recenr years, studi es hm'e been done 0 11 th e d ynamic response of th(" Green land ice shee t to clim atic cha nge, with emphasis on its possible contribution to sea-Ie\ 'c1 ri se in rase o f g loba l warm in g (Amb ac h , 1979; W eidi c k, 1984; Bra i thwai te a nd Olese n, 1990; H u\' brec hts a nd oth ers, 199 1; O erl emans, 199 1; \ 'an d e \\'a l and O erlemans, 1994), Simulat ion of th e ice shee t by numerica l mod els d epends criti ca lly on th e way in \\'hi c h th e surface mass ba lance is fo rmulated. Th e surface balance ca n be presc ribed , calc ul a ted with a degree-d ay model (e.g. Bra ith\\'a ite and Olesell , 1989; R ee h, 199 1) or w i th a n energy-ba la nce model (e.g. O erlcm a ns, 199 1), or ta ken from GCi\ 1 output (Ohmura a nd Wild , 1995 ) . In our \'iew, th e energybalance mode l is an a ttrac ti ve tool for simul at ing th e surfa ce mass ba lance, since th e ph ysical processes on th e surface can be d escri bed fairly exp licilh' in th e mod el.
Up till now, howeve r, mass-ba lance mod e ls for th e Green la nd ice shee t, follo\\' in g either the d egree-day (R ee h, 199 1) o r energy-ba lance app roach (O erl emans, 199 1; Va n d e \\'a l and O er le m a ns, 1994) have not been ri go rously \'a lid a ted , One of th e problems is th e lack of representa ti\'e data , Neverthe less , wc feel th a t the d a ta we no\\' ha \'e a \'a ilable a ll ow us to pe rform be tter model tests th a n those perform ed so fa r. Th e Sondre Stromuord transec t prO\'id es us with a good opportunit y, sin ce 4 years of mass-balance obser\'at ions are now a\'a il a blc , together with th e results of t\\'O d eta iled m e teoro logica l ex periments (G I lVI EX-90 a nd GIl\ fEX-91 ; sec Fig. I for th e se t-up ) . In th e course o f th e wo rk along th e Sondre
Strom~jord tra nsec t, however, it h as become clea r th at th e melt ph\'sics of thi s part of th e ice sheet are complicated , I n pa rti cular, th e spat ia l \'<lr ia bility a nd tempora l evo lution of th e a lbedo ma kes m od elling diffi cult. This is illustrat ed in Fig ure 2 which sho ws the daily mean a lbed o as mcasured at sites 4--9 (sce Fig , I for loca tions) , toge th er \\'ith a snapshot of th e spa ti a l dist ributi o n of th e
a l bed o in th e melting zo ne of cen tral ' Ves t Green la nd , as d e ri \'ed from a NOAA-A \ 'HRR (Ad\'anced Very Hi gh
R esolution R ad iometer) image (Kn a p a nd Oerleman s, 1996) . In the co u rse of' the melt season, a band of low a lbedo de\'elops pa rall el to th e ice edge, the physics of wh ich are poo rl y understood . \\re will disc uss this fea ture a t leng th and try to reprodu ce it in o ne of our mode ls.
R ecently, 4 yea r observa tions of mass bala nce ha\'e become a\'a il ab le (g i\'en in table in Van de \Val an d others (in press); Fig. 3 ) . A lthough a standard de\'iation can be ca lculated for each sta b ' loca tion on the basis o f the inte rannual \'a ri a bility within th c 4 yea r period, it is no t cl ear ho\\' rep resentati\'C th c ba la nce profil e is for th e longte rm (for instan ce, 30 yea r) mean, An add iti ona l problcm is that th e energy-ba lance model rcquires input data that are no t \'Cry we ll knO\\'Il . For example, liltle is kno\\'n a bo ut prec ipil a ti o n , Although regu la r wea th er obse rvations a re ca rried out at Sondre Stromuord a irport, it is ha rd to sec that precipitation amounts measured th e re arc represental ive [o r th e ice-shee t secto r uncl er stud y , For instance, it is kn own th a t in summ er sig nifi cant convec ti\'e precipita li on occ urs O\'er th e tundra but not O\'er the ice sh ee t. Also, because of orographic eITects considerable variation can occur on a 100 km sca le , In spil e of th ese and
305
J ournal of Glaciology
3
ui ,,; 6
2
C-c . .§ '" > Cl)
~
West Greenland. 67 oN 50 °w
40
9
• s ite of mass balan:e m easurement, 90--94 o mast si te, GIMEX-91
80 120 160 200
distance from mast 3 (km)
240
Fig. J. T he experimental set-up during GJN/EX -91 and sll1face elevation oJ the "ice stations" . Site 9 is the bOluzdm)'-/a)'er station oJ the Free University oJ Amsterdam .
0 "U
~ -;;; ~ ;;
"U
0.8
0.6
0.4
0.2
a
010
72 'N
b
66 'N
precipitation
20 30 June
10
si te 6
20 July
30
56'W 40 'W
Fig. 2. (a) D ail), albedo in the summer oJ 1991 measured during GIN/EX -9J. Siles as indicated in Figure 1. ( b) AVHRR image (visible, channel 2) from the N OAA-ll satellite Jar the Sondre StromJjord area, showing a distinct band of low albedo (20-75 km Jrom the ice margin) on 25 J u0; 1991. T he GIMEX transect (thick black line ) and the location of sites 5, 6 and 9 (filled white circles) are also shown.
306
o th er complica tions, we thought it wou ld be worth doing a stud y with an en ergy-balance m od el. Alth ough the d etailed meteorologica l ex perimen ts las ted for only a short time, they have nevertheless ta u ght us a grea t d eal abo u t the excha nge of energy b e tween surface a nd atmosphere, and a bo ut alti tudina l gradients along the ice-sh ee t surface . This puts the param e teriza tions used in th e energy-balance m odel on a sounder basis.
In the following sec tions we w ill first discuss the obse rva ti ons made as p art of the Green land Ice M argin E xp erim ent (CIMEX) . We pos tu late tha t mel twater plays a key role in th e spati al and temporal va ri a tion of the a lbedo. T hen we d escribe the en e rgy-balance m od el used to simul a te th e specific bala n ce a long th c Sondre Stromfjord transec t . It is based on O e r lemans (199 1) , but because seve ra l of th e p arameterizati ons of energy flu xes have been changed , a fu ll description of th e mod el is give n . T he changes h ave been mad e o n the basis of th e GIMEX expe rim ents, and concern turbu len t-exch an ge coefficients and th e effect of clouds on the radia ti on bala nce. The trea tment of the albed o is perhaps th e most cri ti cal par t of the stud y. Since the se nsiti"ity of glacier m ass balance to clim ate change is signifi cantl y affected by the a lbedo feedbac k, it is importa nt to genera te the a lb ed o in the mod el. VV e have used fou r 'albedo mod e ls' ,
3 .--,. -:
'" '" 2 E C-o: .2 ro ;>-Q)
Oi 0
-5
N Ob>~ - 0.99
N f;,~ - 1.19
ELA ~ 1431 m
- 4 -3 - 2 - 1
mass balance (m w.e. yea{' ) o
Fig. 3. J'vi ean proJile of mass-balance observations Jar the years 1990- 94 togelher with the best fit to the model grid.
1
,(1I0 and OerLell7alls: Albedo and s/Jecijic balallce of Greenland ice sheet
o ne o f whi ch inyo h -es explicitly s urfi c ia l melt wa tc r. \\'e
di .. c uss \I'hich a lbcd o model perfo rm s bes t.
OBSERV ATIONS
Th c GIMEX cx p cditions were ca rri ed o ut in th e Sondre
Stromuord a rea, G7 ° N , 50° \\' , W cs t Gree nl a nd , in th e summe rs of 1990 a nd 199 1. During th e expe riments,
m e teo ro logica l qu a ntities (a ir tempe ra ture, humidity.
wind speed , wind direc tion , sho rt- a nd lo ng-\l'avc ra di a
ti o n ) \\'e re mea ured a t se \'era lmas ts a lo ng a tra nsec t ( th e
Sondre Stro mfJ o rd tra nsec t ) p e rpe ndi cul a r to th e ice
ed ge . "'fas ts o n th e ice shee t stood freel y on th e surface . Th e constru cti o n co nsisted of a reg ul a r a luminium m ast
with fo ur long legs, each a t a n a ng le o f 10° with th e
surface . Sh a rp pins were attac hed to th e end s of the legs to kee p th e mas t in pl ace . It is es tim a ted th a t th e tilt of th e
m as t was less th a n 2° O\'er th e entire peri od. D a ta were
coll ec ted yi a a tel c m e tric sys tem. l\[os t o f th e time th e
sampling frequ en cy for a ll senso rs w as 2 min. Fig ure I
sh o ws th e se t-u p o f th e m as ts du ri ng G 11\1 EX-9 1 a nd th e
a pprox im a te surface e1 e\'a tion o f th e ice shee t. Th e CIMEX expediti o ns a re d esc ribed in deta il in fi e ld
re p o rts by R. Binta nj a a nd o th e rs (unpubli shed inform a
tio n , 199 1) a nd W. Boo t and oth ers (unpubli shcd info rm a ti o n , 1991 ) . An ove rvie w can be found in
O e rl em a ns a nd Vug ts ( 1993 ) . Glo ba l radi a ti o n a nd short-wa \ 'e reOec ted ra dia tion
w e re m easured simulta neo usly with a Kipp CM1 4
p yra no meter. No cond ensa ti o n occ urred o n th e instru
m ents, beca use o f th e relati\ 'e ly hi g h tempera ture in th c area during th e field experim ent. The prec ision o f th e up
a nd d O\m-fac i ng p y ra nometers is \\ ' i th i n 2% . A sI ig h t tilt
o f th e instrum e nt s fro m th e h o ri zo nta l pl a n e will
in trod uce a n addi tion a l erro r. H o w eve r. provid ed th e tilt is no more th a n a few degrees, th e effec t on th e dail y
a l b ed o is neglig i bl e (unpub lished i n[o rm a ti on fro m W. H . Kn a p, 1992 ) .
W c define th e d a il y a lbedo 0: as th e ra tio of th e d ail y total s of short-\l'a \T reOec ted radi a ti o n a nd globa l radia tion.
Fig ure 2a sho\l's th e d a ilY a lbedo fo r sit es 4, 5, 6 a nd 9 ta ken
during a 5 1 d peri od ( IOJune- 30Jul y 199 1). The a lbedo on th e tundra (sit e 3, no t shO\m ) has a ra th er consta nt \ 'a lue
but drops s li g htl ~ · wh en prec ipita ti o n occ urs. Snowfa ll shows up \'ery clea rl y in th e a lbedo record a t site 9. The snowfa ll
on 3-4 Jul y ca uses a steep increase in th e a lbedo a t sites 6
a nd 9, but th e increase is not so prono un ced a t sites nearer
th e ice ma rgin (4 and 5). proba bl y because th e prec ipitatio n t1wrf fe ll as ra in. The cha racteri sti c d a il y albrdo of [j'es h
summ er sno\l' a pparentl v is a bo ut 0. 85 a nd dec lines to a
\ 'a luc of a bout 0.65 in a fe\l' d ays. This findin g is in good
ag reement with th e meas urements m ade by th e S\viss
F ed era l Institute o f T ec hn o logy (ETH-Ca mp ) a t a n ele \'a ti o n of 11 55 m a .s.1. a t a loca ti o n so mewh a t further
no rth (Ohmura a nd o th ers, 1992 ) .
N ear th e ice m a rg in (sites 4 a nd 5 ) , th e a lbed o re m a ins
at ra th er co nsta nt va lues of 0 .50- 0 .55 . Apparentl y, th e
dus t coming from th e tundra is not suffi c ient to cause a s ig nifi ca nt lowe ring o f th e alb ed o on th e ice shee t. It is no t
c lea r , howeve r, whe th er this is a lso th e case in o th e r p a rts
o f th e ice m a rg in. Parti cul a rly s triking in Figure 2a is th e
la rge d ec rease in th e a lbed o a t site 6 in th e course o f th e
melt season. The o bse rved redu cti o n is rcla ted to th e
a bund a n ce o f melt\l'a te r in th e sno\\'pac k a nd /OI' a t th e
surface , whi c h is ty pi ca l fo r thi s zo n e below th e
equilibrium line (in thi s regio n th e equilibrium line is at
a n e leva ti o n of about 1400 m a.s .I. ) . M e ltwa ter acc umu
la tes in sm a ll pools on an irregul a r and bumpy surface , and p a tc h es of old snow b ecome sa tura ted. Streams run
be twee n th e meltwater. All in a ll , th e m o rphology is quite
complica ted and one m ay well ha \T doubts a bout the
\ 'alue o f m easurements made a t a sing le loca ti on. Th e
a lbed o se nsor (a t a heig ht o f 1. 5 m a bo ve th e surface ) is hemisph e ri c, but 'sees' only a n a rea o f a b o ut 10 m ac ross .
H o wc ve r , a n A VHRR image (\ 'isibl e , c hannel 2). take n
by th e NOAA-II satellite o n 25 Juh' 199 1 fo r th e area of
Sondre St ro mu ord (Fig. 2 b ; Kn a p a nd O e rl e m a ns, 1996 ) ,
sho ws a di stin c t ba nd o f lo \\' a lbed o, hundreds of kil o m e tres long and running pa ra llel to th e ice edge .
This lo w-a lbedo ba nd extends betwee n 20 km (about
800 m a .s.l. ) a nd 75 m (a bout 1400 m a.s .l. ) from th e ice
ma rg in (Fig . 2b). Kn a p a nd O erl em a ns ( 1996) rep ort
th a t th e sa te llite-deri\ 'ed a lbed o va lues fo r th e IO\\'-albed o ba nd o n 25 July 1991 a r e in a ra nge o f 0. 34- 0 .63 . with the
10\l'Cs t \ 'a lue (0. 34) fo und a bo ut 40 km fro m th e ice ed ge,
a t a n cl e \'a ti on of a bout 1050 m a.s. l. ; s ite 6 from th e
Gli\1 EX (a bout 38 km from th e ice ed ge ) was th erefo r e close to th e minimum , a nd a lbedo \'al ues o bserved th e re
(0. 2 7 0.5 3 in Jul y) are fairl y representative for th e centre
of th e lo w- a lbedo ba nd. It thus a ppea rs th a t th e stron g
red uc t io n in th e a lbed o a t elc\'a ti ons o f 800- 1400 m a.s .1.
on th e ice shee t is a wid espread fea ture in centra l \Ves t
Gree nl a nd durin g th e abl a ti on seaso n. This a lbed o pa tte rn , whi ch is th e o ppos it e o f \l'h a t is o bse rved o n
mounta in g lac iers wh e re th e a lbed o no rm a ll y increases
\I'ith increasing a ltitude (e.g . K oclc m e ij e r and othc rs,
1993 ) , has la rge implica tio ns for th e e n e rg y budge t and dese rves careful study.
ri g u re 3 sho\\'s the m ean pro fi le of m ass-ba la nce
o bse rvati o ns for th e years 1990 9Lk Th e m ean equilib
rium-lin e a ltitude (ELA) is 143 1 m a .s.1. The tra nsec t
ba la nce o f th e obseryation s (Nobs) is 0. 99 m \\'. e. yea r I
" 'e d e fin e th e tra nsec t b a la nce (N ) as :
1 11
N=-LD;M ; . D tot ;= l
(1)
H ere I'If; is th e specifi c bal a nce a t meas uring site i, D ; is
th e corres po nding surface di sta nce a nd D IDI is th e tota l dis ta nce a lo ng th e meas ured transec t (a b o ut 89 km ; Fig.
I) . F o r a n cas)' compari son , th e obse l'\ 'Cd m ass ba lance is fill ed to th e model g rid. The tra nsec t b a la nce of th e [it
(Nfit ) is 1.19 m w. e . yea r I (Dlot = 113 km : Fig . 3) . It
sho uld be no ted th a t N d oes no t represent th e mean
spec ifi c b a lance of a dra in age sys te m ( lac k o f acc ura te
topogra phi c d a ta ma kes it imposs ible to d e fin e a dra in age basill fo r thi s a rea ) as usuall y defin ed . N e \'enheless, it is
useful to compa re th e m odel s with d a ta with respec t to
th e m ean ba la nce a long th e transec t.
THE ENERGY-BALANCE MODEL
Va ri o us types of mod els have bee n uscd to quantify th e
energy budge t as a fun c ti o n of tim e. Th e a sumptio n
307
J oumal oJ Glaciolog)!
underl ying a simple model is that the surface tempera ture is at freez ing point and m elting occurs wh eneve r the surface energy budget is positive. A comprehensive model, on the other hand , calculates englacial temperature, d ensity and water content on a vertical grid (e.g . Greuell and Konzelmann , 1994). In betwee n these two types of mod el one may use a model th a t calculates the surface temperature by trea ting the ice surface as a slab with fix ed h ea t ca p acity . However , a lthough thi s approach has been used with some success in treating land /ocean surface in atmospheric models, it does not work well for snow and ice surfaces , b ecause hea t conduction depends so strongl y on morphology. The type of model one se lec ts d epends on the purpose for which it is required and, in particular, on the amount of input data available. R egarding the annual mass balance, it has been shown by Greuell a nd Oerlema ns (1986) that the difference in the results form ed by the simple models and by the comprehensive models is rather insignificant, exccpt where annual melt is very small. H ere we will use the simple model , as we con sider it to be compatible with th e quality of data available for the Sondre Strornfjord transect. It is based on the model presented by O erlemans (1991 ), but has been simplified so that it works with daily time steps, and, conseq uently , with daily m ean meteo rological q ua n ti ties (u nless s ta ted otherwise) .
Th e basic eq uations in th e mod cl are:
B = Q + Li + Lo + Fs + F1
M = I ear [(1 - 1) min(O; -B/ L) + P*] dt.
(2)
(3)
In Eq uation (2), the energy balance is denoted by Band consists of absorbed short-wave radiation (Q ), incoming a nd outgoing long-wave radiation (L i a nd L o ) , and th e turbulent fluxes of sensible and la tent hca t (P s and F1 ). It is assumed th a t melting takes place a t the surface as soon as B becomes positive. In Equation (3), NI is the specific mass ba lan ce, f is the fra c tion of the meltwater that refreezes a nd does not contribute to mass loss, L is th e latent heat of melt and P * is the solid precipitation. Neither snowdrift nor water transport in the firn aquifer is taken into acco unt. NI is expressed in m w.e. year- 1
Solar radiation
Absorbed solar radi a tion Q is calculated as:
(4)
Here Sc is the daily a mount of solar radiation on a horizon tal surface at the top of the atmosphere and is d erived from stand a rd eq ua lions (Walra ven , 1978 ). Attenuation of the so la r b ea m by absorption and sca ttering a nd by cloud s is represented by the transmissivities Ta and Tc, resp ec ti vely. The surface albedo is deno ted by Ct . For the clear -sky transmissivity we use (h is surface elevation ):
Ta = 0.75 + 0.000023h. (5)
This is a fit to more d etailed calcula tion s presented in Hoogendoorn (1988), for a characteri sti c solar ele\·a tion
308
of 30°. For the effect of clouds we follow the parameterization of Konzelmann and others (1994), which is based on da ta from the Gree nland icc sheet:
Tc = 1 - 0.78n2 exp (-0.00085h) . (6)
H ere n is cloudiness (between 0 and 1). It should be noted that Equation (6) implies that clouds have con sid erabl y less effect on the global radiation than the parameterization used in earlier models (Oerl em ans, 1991 ; Van d e Wal and O erlemans, 1994). Th e la tter parameterization was based on data from the Alps , where clouds apparently are optically thicker. For typical cloud conditions in W es t Greenland, there can be a differen ce in global radiation of up to 15% (Konzelmann and others , 1994).
The al bedo is treated below in a separa te section .
Long-wave radiation
For the incoming long-wave radia tion Li we also follow th e parameterization for daily means as presented by Konzelmann and others (1994) . I l reads:
L i = aTa 4 {[ 0.23 + 0.483 (~)0125] (1 - n 3) + 0 .96n3
} .
(7)
H ere 0 is the Stefan-Bol tzmann constant, T.c'l is aIr temperature and ea is vapour pressure (2111 above the surface ). FOI- a melting surface with emissivity I the outgoing long-wave radiation Lo is:
Lo = 315 .6 Wm- 2 . (8)
Turbulent fluxes
The turbulent heat flu xes are calculated with th e bulk method , in which the fluxes a re se t proportional to the temperature/ humidity differe n ce between atmosphere and surface, namely:
Ps = C(Ta - Ts) 0.622L
FJ = --C(ea - eas ) . cpP
(9)
(10)
H ere C is tb e exchange coeffi cient, L is the latent hea t of melt, cl' is specific hea t, p is pressure and eas is sa turation vapour pressure at the surface. The latter is approximaled by (Kraus, 1972):
over water: eas = 610.8 exp [19.858(1- 273.15/T.c'l)] ,(11)
over ice: eas = 610.8 exp [22.4 7(1 - 273.15 / Ta )]' (12)
Eq uation (11 ) is used whenever the energy balance is positi ve.
The exchange coe ffi cient C is taken to be the same for the laten t and for the se nsible h ea t flux , but depends on a ltitude. This approach was used by O erl em a ns (1991 ) and is supported by the work of Ohata (1991 ) . On the bas is of th e GH.,,1EX results, we use:
C = 2 + 22 exp(~~) (C ~ 16) (13)
<lIO and Oerlemans: Albedo and sjJecijic balance oJ Greenland ice sheet
A deta il ed disc ussion of Equa tion (13) IS gIven In the Appendix.
INPUT D ATA
Meteorological input data needed to run the model are: dail y means of surface air temperature (at 2 m ) , humidity (at 2 m ) , cloudiness and precipitation as well as dail y mean iso lation .
Since on ly limited information is available about relat ive humidity, a constant \·alue of 76 % is used in th e present stud y; the value is based on observations made at th e Sondre Str01Tlfjord weather station (DMI , 1990- 92 ) . For comparison we mention that th e mea n humidity measured during GIMEX-91 was 74% a t site 4 (mean of 54 summer days ), and 79 % at site 9 (m ea n of Jul y). For cloudiness we take a constant \·alue of 0.59 (mean o\'er the melting zone during GIMEX-91 (unpublished data )) .
Table 1. Parameter values llsed ill Ihe models
Parameter Notation
·Model I Mean annual temperature Ta Seasonal tempera ture am pi i rude AT Albedo of snow aSll
Albedo of ice Ct ice
\![odel 2 ?-.1 ean annua l temperature Ta Seasona l temperarure amp litude AT Albedo of snow a Sll
Background albedo etb
Constants al
a2
a3
a-l
Model 3 Nlean a nnual temperat ure Ta Seaso nal temperature a mplitude AT Albedo of snow etSll
Background a lbedo etb
Consta n ts al
a2
a 3
a 4
Model 4 ?-./fean annual temperature Ta Seasonal temperature a n"lplitude Ar Albed o of snow asn
Albed o of ice eticc
Albed o of wa ter lXwat
Albedo of slush ets!
Scaling factor for meltwater w* Constants Cl
C2
C3
The 2 m air temperature is generated as follows:
- (27r(D - 12)) Ta = Ta - "(h + AT cos 365 . (14)
H ere Ta is th e mean annu al tempera ture a t sea leyel, AT is the seasonal temperature amplitude, D is th e day number ( I J a nuary = I), and "( is the a tmospheric lapse rate (taken to be - 0.0075 K m I on the basis of the mean ofGTMEX m easurements in the melting zone) . Values of Ta and AT used in calcu lations (based on temperature data from th e Sondre Stromfjord weather stat ion (Ohmura , 1987 ) and GIMEX data) are listed in T able I. Figure 4 shows the tempera ture eycle as used in th e present ca lcul a tions. The fit to observed da ta is genera ll y good, except in la te winter. This does not affect the calcul a ti ons, however.
\Ve assume that whenever a ir tempera ture is below 2°C, prec ipitat ion fall s as snow. 'Ve furth er ass ume that
l ·a/lIe SOllrce
3SC This work 15°C This work
0.7 1 Tuning OAO Tuning
- 3.5°C This work 15 C This work
0.75 GIMEX-91 , see text \·a n es Oerl emans, 199 1 0. 12 Tuning 500 111 Tuning 250 111 Tuning 0.54 Tuning
- 3 .5 C This work 15°C This work
0.75 GIMEX-91 , see text va ri es Oerlemans, 199 1 0. 1 J Tuning 500 111 Tuning 350 111 Tuning 0.49 Tuning
- 3.0°C This work 15°C This work
0.75 GIMEX-91 , see text 0.55 GIMEX-91, see text 0.15 Hummel a nd R eek, 1979 0.45 This work 0 .20m Tuning 1.5d Tuning 25 d Tuning 140 Tuning
309
J ournaL oJ GLacioLog)1
30 - -fit Semdre Str0mfjord (55 m)
20 0 da ta Ohmura
E + data GIMEX
~ 10
~ ::!
e o -CJ D- o El -10 -~
-20 0 0
-30 0 60 120 180 240 300 360
time Oulian day)
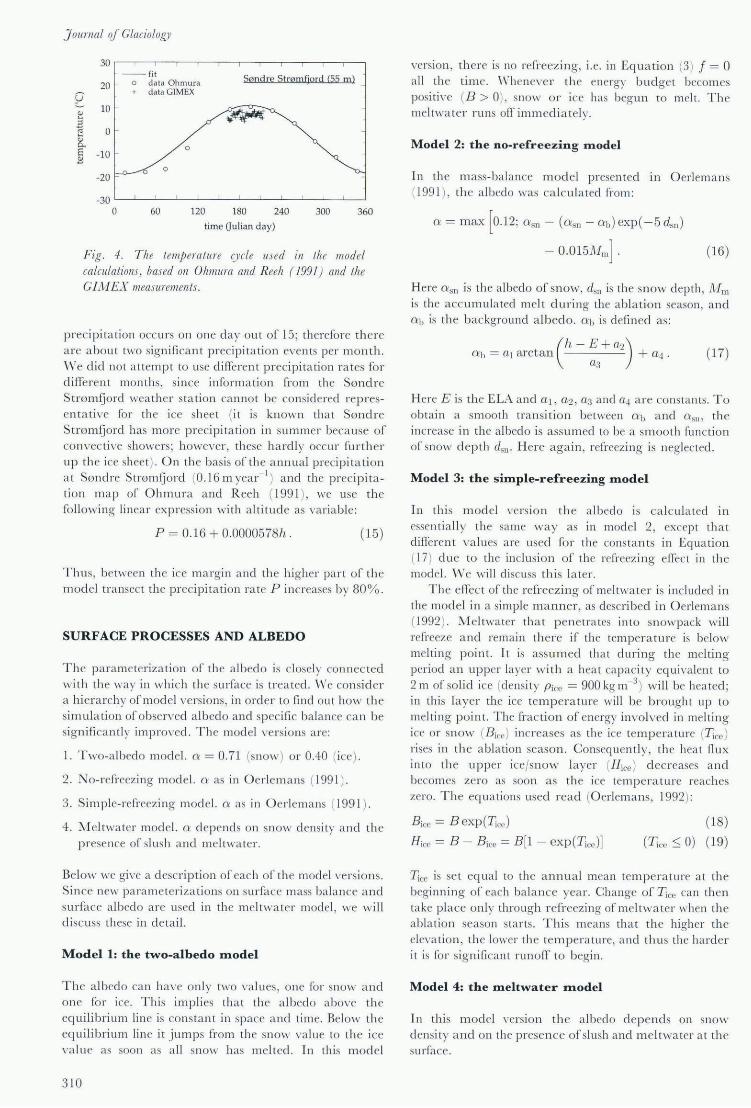
Fig. 4. The temjJeralllre C)'rle llsed in the model calculatiolls, based on Olzmll ra and Reeh ( 1991) and lite GINJEX measurements.
prec ipita ti on occ urs on one day out of 15; therefore th e re a re a bout two significant prec ipi ta ti on events per month. W e did not a ttempt to use different precipita tion ra tes fo r diffe rent months, since informa ti on from the Sondre S tro mfjord wea ther sta ti on ca nnot be considered representa ti\'e for the ice shee t (it is kn own tha t Sondre Stromfjord has more prec ipi tat ion in summer because of convec tive showers; h owever, th ese ha rdl y occur furth er up th e ice sheet). On th e bas is of th e a nnual precipita ti o n a t Sondre Stromfjord (0.1 6 m yea r I) and the precipita ti on ma p of Ohmura and R eeh (199 1), we use th e fo llowing linear expression with a ltitud e as vari a bl e:
P = 0.16 + 0.0000578h . (15)
Thus, betll'een the ice ma rgin a nd the higher part o f th e mod el transec t the precipita ti on ra te P increases by 80 %.
SURFACE PROCESSES AND ALBEDO
Th e pa rameterization of th e a lbedo is closely connec ted wi th th e way in which the surface is trea ted. 'Ve consid e r a hi era rchy of model ve rsions, in ord er to find out how th e simul a ti on of observed a l bedo and specific ba lance can be signifi ca ntly impro\"Cd . The mod el versions a re:
I . TII'o-a lbedo model. a = 0.71 (snow) or 0.40 (ice ).
2. t\o-refi-eezing mod el. a as in O erl em a ns (199 1) .
3. Simple-reli-eezing mod el. a as in O erl emans (199 1) .
4. M eltwa ter model. a depends on snow d ensity and th e presence of sI ush and mel twater.
Below we give a d esc ription of each of th e model \·ersio ns. Sin ce new pa rameteri za tions on surface mass ba lance a nd su r face albedo are used in th e meltwa ter model, we will di scuss th ese in deta il.
Model 1: the two-albedo model
Th e a lbedo can h ave onl y two values, one for snow a nd one fo r ice . This implies tha t th e a lbedo above the equilibrium lin e is constant in space a nd time. Below the equili brium line it jumps from the snow \'a lue to the ice \'a lue a. soon as a ll snow has melted. In this mod el
3 10
\'e rSlOn , there is no refreez ing, i. e. in Equation (3) f = 0 a ll th e time. \\'hene\ 'e r th e energy budge t becomes pos iti\'e (B > 0), snow o r ice has begun to melt. Th e meltwa te r runs 0 [[ imm edi a tely.
Model 2: the no-refreezing model
In th e m ass-balance m od el presented III O erl ema ns (199 1), th e a lbedo was ca lcul a ted from :
a = max [0.12: a sn - (asn - ab) exp ( -5 dsn)
- 0.015Mm] . (16)
Here a SIl is th e albedo of sn ow, dsn is th e snow depth , film is the acc umula ted melt during the a bl a tion season, a nd ab is the b ackground a lbed o . ab is definf'd as :
(17)
Here E is the ELA and a I , a2, a3 and a-l a re constants. T o obta in a smooth transiti on betll'een ab a nd a sn , the increase in the albedo is ass um ed to be a smooth fun cti on of snow d epth dSll ' H ere aga in , re freezing is neglec ted.
Model 3: the simple-refreezing model
In thi s model ve rsio n t h e a lbedo is ca lcula ted In essenti a ll y the sa me way as in model 2, except th a t different va lues a re used fo r th e constants in Equa tion (17) due to the inclusio n of the refreez ing effec t in the model. W e will discuss thi s la ter.
The effec t of the refreezing of meltwa ter is included in the model in a simple m a nn er, as described in O erl emans (1992 ) . Meltwater th a t pe netrates into snowpac k will refreeze a nd remain th ere if the tempera ture is below melting point. It is ass um ed th a t during the melting peri od a n upper layer with a heat capacity equi\'alent to 2 m of solid ice (density Piee = 900 kg m-3
) will be hea ted ; in thi s layer the ice tempe ra ture will be brought up to melting p o int. The fractio n of energy involved in melting ice or snow (B iee ) increases as the ice tempera ture (T;cc ) rises in th e a bla ti on seaso n. Consequently, the hea t nu x in to the upper ice/snow laye r (Hiee) d ecreases a nd becomes zero as soon as the ice tempera ture reaches zero. The equa tions used read (O erl emans, 1992):
Bire = B exp(T;cc )
fh·c = B - Biee = B [l - cxp (T;cc)]
(18)
(T iee ::; 0) (19)
T;cc is se t equal to th e a nnu a l mean tempera ture a t th e beginning of each ba la nce yea r. Change of T;ce can then take pl ace only through refreez ing of melt wa ter when th e ablat ion season sta rts. This means tha t the higher the eleva tion , th e IO\\'er th e tem pera ture, and thus the ha rd er it is fo r significant runoff to begin .
Model 4: the meltwater model
I n this m od el \'ersion t he a lbedo depends on snow density a nd on the presen ce o f slush and meltwa ter at the surface .
It is kn own th a t in some way th e la rge vari ations III
the a lbedo are primarily related to th e presence of meltwater a t the surface. "Ve have com e to the conclusion th a t a realistic param e teriza tion for the albedo can only be achieved if the amount of meltwa ter is trac ked. This is difficult , h owever. M od e ls exist for the tra nsport of water through firn (e.g. Ambach and others, 1981 ), but th ese a re not applicable, since in the zone we a re stud ying there is no uniform firn laye r. The flow in th e melt-wa te r channels can be desc ribed by simple hydra ulics, but thi s does not seem to be the important issue. \Vh a t rea ll y determines the time-scale of the surfi cia l meltwa ter runoff (ave raged o\'er a 2 km x 2 km area , for instance) is the time the water takes to reach the dra in age sys tem. In fact , from the time melting begins until the m o ment meltwater runs off, th e surface of th e ice sh ee t und ergoes a compli ca ted metamorphosis which changes the state of th e surface dra ma ti ca ll y a nd thu s d e termin es the behaviour of meltwa ter on the surface . This consequentl y affects th e surface a lbedo. In the light of this, the surface a lbedo is modelled in such a way that it can simulate th e following regimes: (i) decrease in the a lbed o during th e first p a rt of th e melting season (dsn > 0) due to th e densification of the snowpack; (ii ) d ec rease in the a lbedo associa ted with accumulation of meltwa ter during the rest of the melting peri od when the surface is snow-free (dsn = 0 ) . Figure 5 d epic ts a sc hematic stru cture of th e parameterizations used in the model for surface m ass ba la nce and surface a lbedo.
Swjace mass balance The avail a ble positi ve energy (B ), as ca lcul a ted b y Equation (2), is used to melt snow a nd ice in the foll owing steps:
a
yes
calcu lation o f runoff (R) W + hmt-R
~n- h mt (dsl "'dsn)
if dsn= 0 Ulcn d~ i - hm! if LiSl = 0 then ice ml'ib M-R
initia li zation: slush (dsl = 0)
supe rimposed ice (dsi:::O) me[hvater (W =0) mass balance ('\'1 =0)
snow density (p) s now (dsn)
no
no runoff (RooO) meltwater refreezing ~now temperature rr~n) warming lip
sno w density (p) increasing
calculation of runnff( R)
calclllation of snow d ensit y (p) d~ 1 + hmt - R (d!» oc:; d :-.n}
d~n- h mt (d .:.n ;::>: 0)
M-R
Snow m el ts. All meltwater is a ll owed to penetra te downward s into the snow cover and refreeze there as superimposed ice (dsi ) . The snow cove r (dsll ) is dr fincd as a snow layer that has acc umulated sin ce th e end of th e pre\'io us melting season (sta rting from J uli an day 230, 18 August). It is add ed with snovvfall (F *) and subtrac ted with melting (hllIt ) .
The corres ponding energy of the refreezin g is used to
heat up the snow laye r. Th e mean temperature of the snow layer (1:", ) is brought up toward s th e melting point. The snowpack is d ensifi ed due to m e lting and refreez ing. At this stage, no runoff takes pl ace and there is no change in m ass.
The snow temperature (1:",) exceeds the melting point ; Tsn is put equ a l to O°C. The me lt\~ ate r
perco la tes into the snow to build up a slush layer (dsJ) (a snow laye r sa tura ted with wate!-) . Th e slush (dsIl d oes not exceed the snow cover (dsn). The densi fi ca tion of the snowp ac k con tinu es . Runoff (R) sta rts.
The snow/slush has m e lted away. The superimposed ice melts. Dependin g on th e surface slope (5 ) , meltwater (Hi) starts acc umul ating on the surface.
The ice m elts.
SlllJace albedo /Jaram eleri<.a/iol1 The surface a lbedo is ca lcul a ted according to th e sta te of th e surface (snow/slush/ice ) :
During th e melting season (B > 0), until the cold sto rage 0 [' th e winter snow has bee n elimin a ted (dslI = 0 ) , th e albedo is assumed to be a lin ea r
b
if d~n >O
initialization:
snow albcd o (Usn)
ice albedo (U j('{')
waler albedo (Ilwat)
slush albed o (<<"'1)
fresh snow density (Psn)
water dens ity (Pw aJ
a = a..n+ (a..I-a"n)[(P- P~n)/(Pwill-Psn) 1 ifdsn - 0
a = Ow.l\ - (~'d \ - <ljec) C -It.' / w'
ifd~n>O then a = a sn
ifdsn =O then a = o"cc
Fig. 5. Scllemalie slructure oJjJarameteri<.atioll adO/lied il7 lite meltwater model Jor (aj sllIjace mass baLance and ( b) sllljace albedo .
3 11
J ournal oJ Glaci%g)'
fracti on of the mean d ensity of the sn owp ack (p); from th e moment the surface becomes snow-free, the a lbed o is d etermined by the amount of m eltwa ter a t the surface (W ). In formula ting the la tter regim e, we ensure a smooth transition between ice and wa ter a lbed o by using an exp onenti a l fun c tion.
Outsid e the melting season (B :S; 0) , albedo is se t either to the snow a lbed o (a sn) or to the ice a lbed o (aier ), depending on the properties of the surface.
Thus, th e surface albed o is lower for hig her density and la rge r wetn ess of the surface. The p a ra meteriza tion is based on the no ti on that density a nd we tn ess m ay represent the effec ts of surface ro ughness, grain-size and liquid-wa ter content (' !\fan-en, 1982 ; Greuell and K onzelma nn , 1994).
Densifi ca ti on by m e ta morph osis includ es the effect of snowfall , refreez ing and m elting:
(20)
H ere p is the mean den si ty of the snow cO\'er in kg m- 3
and Psn is the density of fresh snow (ass um ed to be 300 kg m- 3
) . It is obvious that the mean d ensity P increases with increasing meltin g.
Beca use the ice tempera ture a t the d epth of a few metres is below melting poin t, th e meltwa ter cha nnels rem ain a t the surface until they approach the ice ma rg in and disappear in moulins (this happen s typi ca lly a few kilom et res from th e ice ed ge ). :M eltwater proba bl y reach es th e dra inage sys tem quicker wh en the gen era l surface slope is la rger. Therefore, we d ec ided to use a n equ a ti on for the area-averaged surfi cia l meltwa ter W which takes in to acco unt surface slop e S in such a way that it can find :
a finite value for s = 0
a fini te value for S -+ 00 .
Th e equa ti on reads:
dW W --= P", dt t *
(21 )
where
t * = Cl + C2 exp ( - C3 S ) S -+ 00 t * -+ Cl
S -+ 0 t * -+ Cl + C2 . (22)
H ere Pw is the production of meltwa ter that does not r efr eeze and t * is th e cha rac teris ti c tim e-sca le for meltwater runoff as mentioned a bove. The surface slope S is d eri ved from a fit to the altitude profile along the GINIEX transec t whi ch was inferred from differentia l GPS m easurements (Fig. 1) . Equa tion (22 ) contains three consta nts tha t have to be chosen. U nfortuna tely, n o inform a ti on is availa ble co ncerning th e amount of surfi cia l wa ter over the course of time . So the best on e can d o is to determine optim al values for Cl , C2 and C3 by optimizing th e simula ted a lbedo against th e obse rva tion s and a t the same time taking into account tha t the obta ined t* is realistic. In light of thi s the va lues of Cl, C2
312
and C3 used in the mod el a r e 1. 5,25 and 140, respec ti vely (T able 1) . T hus, all mel twa ter at the surface wo uld dra in away within 1-2 d if the surface slope is very la rge, while it wo uld take a bout 26 d to dra in away all mel twa ter on a Oat surface with the slop e cl ose to 0°.
The expressions for th e a lbedo in a ll situ a ti ons therefore r ead :
if B > O
( [ P - Psn ] (dsn > 0) (23) a = a sn + a sl - a sn P wat - Psn
- W (dsn = 0) (24) a = awat - (awat - aice) exp (- -)
w*
if B :S; O
a= a Sll (dsn > 0) (25)
a = a ice (dsn = 0) (26)
H ere a wat is the albedo of wa ter, a sl is the a lbed o of slush , Pwat is th e d ensity of wa ter ( 1000 kg m 3) a nd w* is a constant. Th e values of a sn, a s1, a wat and aice a re taken to be constants (see T a bl e I ) . In the present version of th e model, 0 .75 is taken as th e mean snow a lbedo, an intermedi a te value of th e o bserva ti ons a t site 9 (ranging from 0. 64 to 0.89; GIMEX-9 1) . The slush a lbedo (0.45; T able 1) is chosen ra th er a rbi tra ril y because no information is avail a ble. Since slu sh is in fact a mixture of snow and wa ter, we feel th a t an inte rm edi a te valu e between th e snow a lbed o (0.75 ) and th e water a lbedo (0.1 5) may be a reasona ble approxim a ti o n , because wha t we d ea l with is not a unifo rm sa tura ted sn ow layer bu t a p a tch y surface where som e pa rts are we t and melting, a nd o th er parts a re covered by snow. Wha t we want to exp ress here by a gradual transition from sn ow albedo to slush albedo does not represen t an albed o ch ange a t a single spot where albedo "jumps" from snow to slush due to th e water ta ble in the sn ow rising to the sn ow surface, as observed in the fi eld , but a mean effec t of th e a lbedo transition a t surface where som e parts are covered b y slush or water and other parts are covered by snow during the earl y peri od of mel ting. As initi al condition we take a ba re-ice surface, with an ice a lbedo of 0. 55 (b ased on the observa tions of GIMEX-9 1) . Note tha t the a l bedo presc ribed a pri ori is not alti tud e-dependent.
SIMULATION OF A REFERENCE STATE
Compari son of models is m eaningful only when they are calibra ted against the sam e data. \Ve h ave adjusted model pa r a m eters (Table 1) in such a way tha t all mod els correctly simulate :
the observed mean E LA, E ( 143 1 m; Fig . 3);
the obse rved tra nsect b a la nce, Nfjt (- 1.1 9 III w.e. year- I; Fig. 3).
The integra tion of the energy-ba lance mod el was performed with a id tim e ste p , sta rting on 1 J anua ry. Calculation s were done for a number of g rid points which h ave equal dista nce in eleva tion a t intervals of 150 m. R es ults of the refe re nce experiment are presented in Figures 6-9 .
<110 al/d Oerlemalls: . 1Ibedo and s/Jecij"ic balance of Greenland ice sheel
Figure 6 sho\l's compa ri sons between th e o bsen'ed (mean of 1990- 94) a nd th e calculated mass ba la nce for a ll four models. The modelled m ass ba lance ge nera ll y agrees well \I'ith th e m easurements except for the lo \\'e r reaches 0 [" the tra nsec t (Fig. 6a a nd b ) . I t seems th a t a m ong th e fo ur model ve rsions the m e ltwa ter mod el (m od el 4) perfo rms bes t in reproducing th e ba lance \'a ri a ti o ns a long th e tra nsec t. Surprisingly, th e simplest m od cl I'e rsion (model I ) d ocs a good job as well. The specifi c ba la nce a t th e lo\\"e r pa rt 0 [" the tra nsec t (beIO\\" 500 m a .s.l. ) is not II'C II predi c ted by the other m od els (models 2 a nd 3; Fig. 6). Ca lculatio ns using mod el 4 indi ca te th a t th e a bsorbed short-wave radi a ti on (136 \\' m 2, dail v mean for the CI:.rEX-91 peri od 10 Jun e- 3 1 July), a t 350m a.s .1., acco unts fo r 70% of th e to ta l energy a l 'a il a ble for melting . This agrees with th e m easured absorbed shortwa l'e radiati o n ( 117\\'m 2, d a il y mea n fo r th e same peri od ) a t site 4 (340 m a .s.l. , Fig. I) \I'hi ch accounts for 73% of th e to ta l. Signifi ca nt ol'eres tima tes o f a bla ti on a rril 'Cd a t using models 2 a nd 3 (Fig . 6 b ) ca n be ex plained by th e effec t of th e unrealisti ca ll y lo w surface a lbedo th a t th e model ge nera tes [or the ice m a rg in.
<i ::
0 E. '"'
-1 u
.-& model I = model 2 T model 3
c: -2 '" o model 4
;;; -3 -"
:!l -4 '" E -s "0 ~ -6 Cj "0
-7_7 0 E -6 -1 o -s -4 -3 -2
a observed mass balance (m w.e.)
2.0
..-,. 1.S vi
cq. line eq. linc
'" E ~ 1.0 c .S ro ~ O.S
Cj
O ~~~~~~~~~~~~~~~~-L~~
-3 -2 -1 0 -3 -2 -1 0 -3 -2 -1 0 -3 -2 -1 0
b mod elled mass ba lance - observed mass ba lance (m w .e. year-I)
Fig. 6. CO Ill/Ja risOlls belween lite (a) observed (lIIean of /990- 94 ) and Ihe (b) calculaled mass balallce ill Ifte reference e.I/Jerilll fll l fo r aIL fOll r models: (a) the modeLLed mass balance /Jlo lled aga insl Ift e obserl1alio ll s; ( b) elevation de/Jendence of Ihe differfllccs between Ift e modelled alld l/ie obserlw/ lIIass balance.
Th e tra nsec t ba lancc (N; Equation ( I)) co mputed bl' means of a ll the models is compa tibl e \I'ith th e o bse n 'a ti ons (N fil ; Fig. 3). Th e difference betll'een N a nd N fit in a ll cases is less than 3% . Obvi o usly it is poss ibl e to fit the measured tra nsec t ba lance quite well by tunin g th e model pa ra meters regardl ess of th e m odel sc hem es . H OII'el'e r, holl' II'e ll can th e models re produce th e tempo ra l I'a ria ti ons of th e melting obse rl'ed in th e fi e ld? Are the models capa ble of predi c ting th e a lbedo vari a ti o ns seen
a lo ng the tra nsec t? Fig ure 7 illustrates th e computed a nd the measured time d ependence of th e melting at site 4 during the summ e r peri od for a ll th e models. Of th e fo ur m odels, model 4 ( th e meltwa ter mod el) appa rentl y d oes th e bes t job. It should he rea li zed th a t fittin g th e transec t ba la nce well a lo n e is not I'e ry meaningful if th e obsen 'ed te mporal a nd sp a tial \ 'ariations of th e abl a ti on ca nno t be co rrectl y simul a ted.
<l.i 'i E ~ ~
.9 ro :n '" ..:;.
'@ "U
a
b
8
6
4
.', .. 2 :'1
' . , , h
0
135 150 165 180 195 210 225 240 255
000-0-000 observed - - - model 1
model 2 - - - model 3 -- model 4
abla tion from 1 lune
135 150 165 180 195 210 225 240 j lln jul aug sep
time 011lian day)
255
Fig . 7. COI17/Jario,olls belll'eell lite measured alld l/ie /IIodelled lilll !' de/HI/ dmce of Ihe me/lillg al sill' 4-(337111 {/.d.; CJXIE.\"-9J) during Ifte SllIl1l1ler jJeriod
./01' all Ih(' lIIodels: (aJ dai~)' ab /alio l/ : (b) (" /lIIll/Lalive ablalion .
Figure 8 prese nls a compa ri so n between the obse l"\ 'ed (C r~IEX-9 1 ) a nd th e ca lcul a ted surface albedo for m od el 4 . Il a ppea rs th a t a better simula tio n of obse l"\"ed albed o can indeed be obta in ed if wa ter a t th e surface is explic itl y included in th e m od el. There is still a signifi cant di scrc' pa ne)' betwee n th e calculated a nd th e obse n 'ed a lbedo, hOll'el 'C r , espec iall y a t sites 5 and 6. Lt sho uld be mentioned th a t, when C[?\I"EX-91 II'as being se t up in eark June 199 1, th ere lI'as still som e snow COITr aro und site 6. H owel'er, th e mas t was el 'e ntu a ll y put up on bare ice instead of snoyv, because th e task \I'as simple r. Thi s pa rtl y expla ins th e di screpancy be lll'een th e obsen'ed a nd th e calcula ted albed o for site 6 during th e onse t of the a bl a ti on season. The dif1Crence betll'een the ca lculated and the obse rved a lbedo a t site 9 can be ex pl ained b y the fac t lh a t a mean valu e (0. 75, 0 11 th e basis of the albedo o bse rl'ations at sile 9 ) was laken as th e snoll' a lbedo in th e m od el, and th a t the effec t o f snow ageing was no t includ ed in th e ca lcul a ti on. Th e calcul a ted albedo at site 9 lhus ca nnot depi c t th e parti cul a r va ri a ti ons due LO those precipitation eve nts and th e snow-age ing effec t. N eve r-
Fig. 8. T emjJoral variation of slI1jace albedo at (a) siles 4 and 5, (b) sites 6 and 9 along the Sondre St1'@mjjord transect. L ines me the model results; symbols are the observed data collected during GJJ\!I.E X-91.
th eless, th e model is able to reprodu ce the m aj o r charac teristics of th e a lbedo pat tern in the melting zon e a long the Sonclre Stromfjord transec t. On the oth er ha nd , the simul a ted a lbed o varia tion de ri ved fi'om models I , 2 and 3 could in no way compare wi th the observa tions. The reason is clea r. In model 1, only two va lu es are assig ned to th e a lbedo, no allowance being made [or spa tia l and temporal varia tion. Th ere is simply a switch fro m one val ue to th e o ther. In mod els 2 and 3, th e e ffec t of meltwa ter is not considered in the scheme.
T o find out how rea li stically model 4 p erforms, the simula ted tempora l va ri a ti on in various quantities during th e melting season for the Sondre Str0mfjord tl'an sect is plo tted in Fig ure 9. As seen in the figure, th e m elting period (B > 0), a t the grid p oint a t 200 m a.s .l ., starts in la te YIay a nd las ts for a bout 3.5 months, whereas higher up on th e ice sheet, nea r th e equilibrium line, m elting does not occ ur un til th e end of June and las ts [o r a pproxima tely I month (Fig. 90. As soon as the abla tion begins, the snow layer is heated up to m elting point in a m a tter of d ays (2- 6 d ; Fig . 9c), and the mean density of the snowp ac k in c r eases ra pidl y (Fi g. 9b) . A s melting progresses, run off begins; water starts to accumula te on th e surface; a slush layer builds up and snow g r adua lly melts away. At th e ice ma rgin , the whole process of snowpack elimina tion (fo r exampl e, snow d epth of 0. 12 m w.e.) ta kes about 10 d , w hereas high up on the ice, 25 d a re n eed ed to m elt away a sn owpaek of 0.16 m w.e. (Fi g . 9d ). This is reasonable and is supported by fi eld observa ti ons (H enneken and o the rs, 1994). Th e refo re, i t can be co nclud ed th a t th e sur face conditions a nd t ra nsec t b a la n ce along the Sondre Stromfjord tra nsect have been simulated sa tis[actorily, and a set of sen sitivity tes ts can now be a ttempted.
CLIMATE SENSITIVITY
In thi s sec ti on we investigate the implica tion s of the va ri ous mod els for the sensiti vity of specific b a la nce to
3 14
a N 250 E ~ 0
o:l -250 :;....::"- -
b <", 800 'E
"" 500 C-a. 200
20 C
10
2 0 f--~
- 10 ______ _ 1
-20
0.3 d
o.i :i S 0.2
0 -a~ 0. 1
0.08 e o.i :i S 0.04
.J' :::, 0.06
*' " :i 0.04
S . ~ 0.02
'" :g 0 f M A M A SON D
month
F ig . 9. (a) Energy budget B. (b) mean snow density p, (c) mean snow temperature 1'81L• (d) snow del)/I! dsn , (e) sLush depth dsl and (f) ablation as a }illlction of time for three different grid fJoints along the Srmdre Stromjjord trallSec/.
ch a nges in air tempe ra ture and prec ipita ti on. First, we mad e ca lcul a tions for perturba ti ons of + I K
in a ir temperature. Tt has been sugges ted , however, that inc reasing tempera ture on the G reenla nd ice shee t a lso in vo lves so mewh a t hi gher prec ip ita ti on rates (e .g. Huy brechts and o th ers, 199 1). Th erefore wc also carried out model runs w ith combined pe rLu rbations in a ir tem perature and p recipi tation (a + I K te mpera ture ch a n ge with a + 5% ch ange in precipita ti on) . Ch a nges in transec t balance (.!J.N ) and in ELA (11E ) for a ll the m od els are summa ri sed in Figure 10.
I r is clear th a t values of 11N are no t " ery different (the increased ab lation ran ging £i'om 40% to 45% fo r a I K wanll ing); in the case of combined p erturba tions, the diffe ren ces in .!J.N a rc slightly la rger (the increased a bl a tion ranging fro m 31% to 39%; fi g. lOa ). F o r ch a nges in ELA, m od el 1 appears to be the mos t sensitive (Fig. l Ob). This is p robably due to the discontinuity in the a lbedo transi ti o n between snow a nd ice .
vVith rega rd to cha nges in mass-balance pro fil es, howe" er, the picture looks different (Fig. 11 ). Th ere a re large differences be tween the models. The change in m ass ba la nce in model I sh ows a sharp peak around 1400 m a.s. l. eleva ti on. This is obviously caused by the jump in a lbedo as d isc ussed p reviously. T h e largest cha nge a t mid-e le" a ti on seen in model 2 can be ex plained by th e a lbed o feedback. A lifting of the E L A due to a I K
<110 and OerLemalls : Albedo and specific balal/ ce oJ Greenlal/d ice sheel
Fig. 11. Sfllstlil'i{y o.f Ihe mass-balall cl' /Jrojile 10 challges ill air lelll/Jeralllre Jor all Ihe 1II0del I'e ntol/s.
\\'a rming reduces th e a lbedo signifi ca ntl y, thus red ucing the surface a lbed o a nd enh a ncing th e melting. ~fodel 3 beh a \'es simil a rl y but \\' ith a less pronounced mide levat ion maximum beca use of th e effec t or refr eez ing . With th e meltwa te r- albedo co u p ling in model 4, th e c ha nges in specifi c ba la nce reach a m ax imum just below th e equilibrium lin e . On th e lowe r pa n or the ice shee t, howe\'e r, th e ch a nge in mass ba la nce tends to becom e ind e pcndent of eleva ti on. On th e bas is or es tima tes m a d e with the melt\\'a te r m odel, a I K inc rease in th e a nnu a l m ea n air tempera ture leads to a c h a nge of 16 1 m in th e ELA , a nd the tra nsect bala nce c ha nges from 1. 22 to - 1.72 m '\·.e. yea r 1 ( th e mea n a bl a ti o n increases by 0. 5 m w .e . year I) .
It sho uld also be no ted that a cha nge in precipi ta ti o n has o nl y a slight effec t. A \ ery la rge c h a nge in prec ipita ti o n wo uld be need ed to ca ncel o ut the tempe ra ture effec t.
CONCLUSIONS
Fo ut- e n e rgy-ba la nce m od els ha\"(' b ee n prese nt ed. Alth o ug h a ll a rc cap ab le of" predi ct in g the tra nsec t ba la nce reasonab ly \\' e ll , onl y th e m cl t \\'a ter mod el is a ble to reproduce th e a lbedo pa tte rn a nd th e m ass ba la nce profi le \I'hic h were obse n Tcl a lo ng the Sond re Stromu o rd transec t in centra l Wes t G ree nl a nd. \\The n mel t\,'a te r a nd its effec t on a lbed o a re in cluded in th e mode l. th e simul a tion or a lbed o a nd mass ba la n ce imprO\TS consid era bl y .
Se ns iti \'ity tes ts sh o w tha t th e la rges t res ponse of th e spec ifi c ba la nce to tempera ture and p rec ipita ti on cha nges occ urs j ust below th e equilibrium lin e . This is in contras t to fin d in gs for mo unta in glac ie rs ( \" h ere sensiti\ 'it y decreases with increas ing a ltitud e; G re ue ll a lld O e rlema ns, 1986; O erl ema ns a nd Hooge ncl uo rn , 1989). 1n case of c lim a te \I'anning, lo w-albedo zo n es may becom e wid es pread and lea d to signifi ca nt a dditi onal run o ff f" o m th e ice shee t.
\ Ve halT modelled th e densifi ca ti o n of th c upper snowp ac k a nd thc a m o unt of melt wa te r contri buting to a lower ing o f the surface a lbedo \\'ith a simpl e a pproach. It sho uld be poss ible to re fin e th e mod e l consid erably, but thi s \,·ill be \\·orth\\·hile onl y if 111 0 re ex tensi,'e da ta beco Jl1 t' 'l\·a il ablc . S uc h d a ta m us t be deri l"Cd fro m ca refull y ca libra ted a nd nllid a ted remo te-sensing p ro ducts an cl m ust ha lT suffl cicnt spa ti a l a nd tempo ra l reso lu ti o n .
I t is no t clea r how wicl espread th e occ u r rencc of " lo wa lbecl o zones" over th e G reenl and ice shee t is. Also, a t thi s stage it is not poss ibl e to id cntif) a reas ha \' ing the cha racte ri s ti cs tha t will turn th em into lo w-a lbedo zo nes if th ere is sig nifi ca nt c lim a te warming . H O\\'C\'c r, th e la rge in crease ill a bla ti on ra tes \I'hen th e m e ltwa tcr-albecl o feedbac k is includ ed implies a po te nti a ll y importa nt mec ha ni sm th a t may a ffec t th e ba la l1 ce o f the \I'hole ICe shee t. Furth er st ud y o f thi s to pic is needed.
ACKNOWLEDGEMENTS
Wc a re \·t' ry gra teful to R. Bintanj a , :\1. \ 'an de n Broeke and \ \ '. Grt' uell for di sc ussing so ma n y p a rts of thi s wo rk. Fin a n c ia l support \I ' as o bta ined from th e Commiss ion o f th e E uro pean Communiti es, und er co ntrac t :\Ios . EV5 VCT 9 1-005 1 and EV5\1-C T 92-0 132 (E1l\ 'iro nm ent ), a nd fron. th e Dutch ;\ia ti on a l R esea rch P rog ra mme on Glo ba l Air P o lluti on a lld C lim a te Change (co ntrac t 276 /9 1-NOP) .
REFERENCES
:\mbac h . \\ '. 1979. 7.ur :"J(" t tocis<l b l,llion in (" il1 el11 I-Iohc np rolil a lll
gronl >i n ci isc hcn inbndc is . PolrllJon rhllllg. 49( 1) .55-62 , .\m bach . \\ ' .. \1. Bl unllhakr a nd P. I~ i rc hlcc h ne r . 1981. j\ pplica lio n of
the gnl\' il Y (lOll theo ry lO l il e pCrCOI<llion of m elt lI'a lcr lh rough ri rn. ]. Clariol., 27 9j , 67 75.
3 15
J ournal oJ C'laciology
Bra itl1\\'a ite, R .J . and O. B. Olesen. 1989. Calculation o Cg lacierab lation I;'om air temperature, \\'cst Greenland. III Oeriemans, j .. nI. Glacier
.fluclllalioll' alld cli/llalic ch([llge. D ord rccht. etc., K.lu we r .\ cadcm ic Publishers. :2 19 233.
Brai thwai te, R . j . and O. B. Olcsen. 1990. Incrcased a blation at the margin of the Greenland ice sh eet under a green ho use-cffec t cl ima te. . 11111. (;Iacioi.. 14. 20-22.
Greuell , \\'. a nd T. Konze lma nn. 1994. Nu merica l modeling oC the energy ba lance and the cnglacia l temprrature of the Grecnland ice sheet: calculat ions for the ETH- Camp loca tion (\\'es t Greenland, 1155 m a.s. I. ). Global alld Plallelm)' Change. 9 1- 21.9 1 11+.
Greuell , \\'. and j . Oeriemans. 1986. Sensiti\ 'it), studi es wi th a mass ba la nce model including temperature profile calc ul a tions inside the glac ier. Z. Glelscherkd. Gla::,ialgeol., 22 (2).101 - 124.
Henneken. E . A. C .. 'i.J. Bink. H . f. \ ·ugts. f . Ca nnemeijcr a nd A. G. C. A. i\j eesters. 1994. A case stud \' of the dai ly e nergy ba lance nea r the eq uilibrium line on the Greenland ice sh ee t. Global alld Plallelan' Challge. 9! 1- 2\, 69 78 .
H oogendoorn. N. C. 1988. De l7Iassbalall.1 NI/I alpfllgletsjers. Utrecht , Cni\'C rsit y of Ctrecht. Illstitut \'oor i\leteo ro logie en f ysische Oceanografie. (\ 'e rslag 88-1+. )
H ummel, J. R . a nd R. A. R eek. 1979. A global surface a lbedo model. J. . Ippl .. \leleorol., IS. 239- 253.
H uybrechts, P .. !\ . Lern'gu ill y and N. R teh. 1991. The Green land ice sheet a nd grcen house warming. Globalalld Planelal), Chal/ge, 3(4), 3994 12 .
Knap. \\'. H . and J. Oericmans . 1996. The surf'lce a lbedo of the Green la nd ice sheer: ,a tcllite-de ri \'ed a nd in situ measurements in the Sond rc StromGord area during the 1991 melt season . ]. Glaciol., 42( 141 ). 36e f 37+.
Koelemcijcr, R ., j . O eriemans and S. TjclTlkes. 1993. S urface refl ccta nce of Hin terci sferner. Austria , from Landsar 5 T lII imagery .. 11111.
Glaciol .. 17, 17 22 . Konzclmann , T. , R. S. \\'. \'a n d e \\'a l, J. \1'. Grcue ll . R . Bintanja.
E. A. C. H enneken and A. Abe-Ouchi. 1994. Pa ra m c teri zation of globa l a nd long\\'a\'c incoming ra di ation for the Greenla nd ice sheet. Global al/d Pial/elm)' Chal/ge, 9( I 2). 1+3 164.
Kraus, E. B. 1972. :i lllloJ/Jhere oceal/ illleraclioll. O xford. C larendon Press. i\lunro, D . S. 1989. Surface roughness and bulk hea t tra nsfer on a
glacier: comparison \\'ith eddy co rrela ti on. J. Glaciol .. 35 ( 121 ). 3~3-348. Oeriemans, J. 1991. The mass balance of the Green la nd ice sheet:
se nsiti\"ilY lO c1imale change as rnTa led by cnerg~-balance
modelling. !/oloCflle. 1(1),40- 49. Oeriemans, .1 . 1992. Cli mate sen siti vit ), of glaciers in southern "!orway:
applica tio n of an energy-ba la nce model to 'iigardsbrecn, Hellstug ubreen and ,\I fotbrecn. J. Glacial., 3Sr 129 , 223- 232.
Oericmans, J. and N. C. Hoogcnd oorn. 1989. ~l ass- balancc grad ien ts a nd clima ti c change. ]. Glacial., 35 ( 1211. 399-405.
Oeriemans, j . a nd H . F. \ ' ugts. 1993. i\ meteorologica l experiment in th e melting zone of the Greenla nd ice sheet. BII/I . . elm . .Ileleorol. Soc .. 74(3), 355- 365.
Oha ta, T . 199 1. The efleet or g lac ie r wind on loca l climate, turbulent heat flu xes and ablat ion . .;::. Glelscherkd. Gla~ialgeol., 25 ( I ). 1989. +9 68.
Ohmura. A. 1987. "Iel\' temperature distribution maps for Greenland.';:. Glelscherkd. Gla~i{"geol .• 23 I ) . 1-45.
Ohmura, A. a nd "I. R ee h. 199 1. Ne\\' precipitation and accum ul ation maps {o r Greenland.]' (;Iacio/.. 37 (125 ), HO 148.
Ohmu ra. A. and !'II. \\,ild . 1995. A possi ble change in m ass ba lance of Greenland and Antarcti c ice sh eets in the coming cen tu r). emuland, Geologiske Cndersogelse. SO'. Open File, 95/5,59- 77 .
Ohmura, A. alld /Oolhers. 1992. Energy anrl //lass balallce dl/ring Ihe /lie/I seasoll al Ihe eqllilibriulIl fille allilude. Paakilsoq, Greenlalld iN sheel (6'r3-/'25.3". \'orlh . -/9"17'44.1" W est. 1155ma.d.). ZUrich , Eidgenossische T echnisehe Hochschule. D epartment of Geography. (ETH Greenland Exped ition. Progress Report 2: April 199 1 to O ctober 1992. )
R ech , '\. 1991. Parameteri za ti o n of m elt rate and su rface temperature on the Greenland ice sheet. PolaljorJellllllg, 59 (3). 1989, 113- 128.
W a l, R. S. W . van de and j. O e rl ema ns. 1994. An energy ba la nce model for the Greenland ice shee t. Global alld Plalll'ltII)' Change. 9 1-2). 11 5- 131.
\\ 'a l. R. S. \\ ' . \'an de alld /I olhers. I n press . ~l ass ba la n ce measu rements in the Sondre Stromfjord a rea in the period 1990 1994 . .(. Glelscflerkd. Gla~ialgeol ..
\\ 'a lra\'Cn, R . 1978. Calculating th e pos ition of the Sun. Sol. El/erg)', 20, 393- 397.
Wa rren . S. G. 1982. Optica l properties of;nol\'. Rn'. Ceo/Jh)'S. S/iace PI~ys . ,
20( I ), 67- 89. \\'eidic k. A. 1984. St udies of g lac ier beha\' iour and g lacier mass balance
in G reenland a .T\·ie\\,. Geogr .. 11111 .. 66A 3 . 183- 195.
316
APPENDIX
ESTIMATE OF THE EXCHANGE COEFFICIENT
So far , direc t obsen 'a tions of turbulent nuxes o n g laciers (b y eddy-correlation techniqu es ) h ave been " e ry limited (e.g. Munro, 1989; H cnnekcn and o thers, 1994), a nd da ta se ts are not ye t adequa te for a thorough verification of exi sting th eo re ti ca l sc hemes ( the profile m e thod , in p a rticu lar) . Th e refor e, it see m s wo rthwhil e to use a lternative me thods to es tima te exchange coeffi cients.
One such m e thod is to ca lcul a te the tota l turbulent exchange as a residua l in the energy bala nce. This requires accurate measurements of the radiatio n balance, the sub-surface e nergy nux a nd th e amount 0 [' energy used for melting . In practice, suffi c ient accuracy can onl y be ohtained over longer periods of time during which th c m elt process is simple (negligible sub-surface hea t flux, no interna l accumula ti on, air tempe ra rure above the melting point most of th e time).
These conditi ons are met for three sites (4, 5 a nd 6; Fig. 1) along the G Il\IEX transec t, a nd an attempt has been made [0 cs timate the rurbule n t exchange by closing the energy budget. The pcriod consid ered is 10 June- 25 Ju ly 199 1. Data a\'a il a ble are measured ablation, air temperature, wind speed , a bsorbed sola r radia tion , and humidity a t site 4. Some other quantiti es were not used beca use the measuremen [ erro rs were considered too large.
The long-wave rad ia ti on balance is ca lcula ted using the parameterizat ion developed by Konzclmann and o thers (1994). First ofa1l, clo udiness is es timated from the difference between theoreti ca l clear-sky globa l radiation a nd the act ually observed global radia tion (the res ult for site 5 is shown in Figure 12) . Estimated cloudiness, measured air temperature and vapou r pressure a re then used to ca lcula te th e long-wa\'e b a lance. H umidi t)' was measured onl y at sites 4 a nd 9. V a lues for sites 5 and 6 were obtain ed by in terpola ti o n.
No\\' th e exch a nge coe ffi c ient C is defined in:
( ) (Lm + Lv) ( ) B = R + C Ta - Ts + C q - qsat . Cp
(AI)
Site 5 CIMEX-91 400,------,-----,------,-----,------,
ca -D o to
100 6
0: o
0 · ·· observed -- calculated
OL-----~----~----~----~----~
160 170 180 190 200 210
time Oulian day)
Fig. 12. Theorelical clear-sky global radial ion (including the iffect oJ waleI' vapour and varialiolls ill sUlface albedo Ihrough multiple riflection between stllface and atmosjJ/tere ) and measured global radiatioll al sile 5.
<lIO and Oerlemal/s : Albedo and s/Jecijic balance oJ Greenlal/d ice sheet
H ere B is the energy a\'a il ab le for m elting per un it o f tim e a nd a rea, R is th e net radi a ti on , a nd the las t two terms a re th e turbulent nu x of enth a lp y and la ten t hea t, res pecti\·ely. C is the excha nge coeffi cient (ta ke n equ a l fo r sensible a nd for la tent hea t), 1'" is air temperat ure, 1'., is surface temperature (mel ting poin t), Lv is la tent hea t of vap oriza ti on , cp is spec ifi c hea t, and q is specifi c humidity.
At the same tim e th e mass budge t is (L Ill is th e h ea t of m elting a nd II f th e rate of cha nge o f mass per unit a rea in kg m 2 Si ) :
B C Af = melting- d epos ition ------*- = M + - (q - qsat).
L rn ep
(A2)
Eli m inating B now yields:
(A3)
T a kin g th e mean value over the entire peri od a nd so lving fo r C gi\'es:
(A4)
Figure 13 shO\\·s th e \ 'a lu es for C obta ined in this way. In spite of th e la rge erro r b a rs, the da ta sugges t tha t th e exc ha nge coeffi cient d ec reases signifi cantl y with increasing di sta nce from th e ed ge of the ice sh ee t.
25
20
15 -~ 10
"! E 5 ~ 0 u
-5
-10
-15 3 4 5
site 6 7
Fig. 13. E~change (o~JJi(iellts (({/ciliated b)' closillg the energy balallce for sites 4-, 5 and 6. The error bars reslIlt when the IIllcertaill~J' ill the energy balance is assllmed 10 be 6% . Thi.' }ields a llel)' 100ge error Jor site 6. be(({use the IUl'bulellt jlll~es are small there .