Accepted Manuscript Modelling damage evolution in composite laminates subjected to low velocity impact Y. Shi, T. Swait, C. Soutis PII: S0263-8223(12)00154-7 DOI: 10.1016/j.compstruct.2012.03.039 Reference: COST 4598 To appear in: Composite Structures Please cite this article as: Shi, Y., Swait, T., Soutis, C., Modelling damage evolution in composite laminates subjected to low velocity impact, Composite Structures (2012), doi: 10.1016/j.compstruct.2012.03.039 This is a PDF file of an unedited manuscript that has been accepted for publication. As a service to our customers we are providing this early version of the manuscript. The manuscript will undergo copyediting, typesetting, and review of the resulting proof before it is published in its final form. Please note that during the production process errors may be discovered which could affect the content, and all legal disclaimers that apply to the journal pertain.
Transcript
Accepted Manuscript
Modelling damage evolution in composite laminates subjected to low velocity
impact
Y. Shi, T. Swait, C. Soutis
PII: S0263-8223(12)00154-7
DOI: 10.1016/j.compstruct.2012.03.039
Reference: COST 4598
To appear in: Composite Structures
Please cite this article as: Shi, Y., Swait, T., Soutis, C., Modelling damage evolution in composite laminates subjected
to low velocity impact, Composite Structures (2012), doi: 10.1016/j.compstruct.2012.03.039
This is a PDF file of an unedited manuscript that has been accepted for publication. As a service to our customers
we are providing this early version of the manuscript. The manuscript will undergo copyediting, typesetting, and
review of the resulting proof before it is published in its final form. Please note that during the production process
errors may be discovered which could affect the content, and all legal disclaimers that apply to the journal pertain.
Modelling damage evolution in composite laminates subjected to low
velocity impact
Y. Shi, T. Swait, C. Soutis*
Department of Mechanical Engineering (Aerospace), The University of Sheffield, Mappin Street, Sheffield S1 3JD, UK
Abstract
In this paper, the impact damage of composite laminates in the form of intra- and inter-laminar cracking was modelled using stress-based criteria for damage initiation, and fracture mechanics techniques to capture its evolution. The nonlinear shear behaviour of the composite was described by the Soutis shear stress-strain semi-empirical formula. The finite element (FE) method was employed to simulate the behaviour of the composite under low velocity impact. Interface cohesive elements were inserted between plies with appropriate mixed-mode damage laws to model delamination. The damage model was implemented in the FE code (Abaqus/Explicit) by a user-defined material subroutine (VUMAT). Numerical results in general gave a good agreement when compared to experimentally obtained curves of impact force and absorbed energy versus time. The various damage mechanisms introduced during the impact event were observed by non-destructive technique (NDT) X-Ray radiography and were successfully captured numerically by the proposed damage evolution model.
Keywords: Composite laminates, Impact behaviour, Finite element analysis, Delamination, Non-linear behaviour, Cohesive zone elements, Failure analysis
1. Introduction
Advanced composite structures offer many advantages compared to conventional materials, especially where high strength and stiffness to weight ratio is concerned. Thus, composites
have been used widely in many applications such as aerospace, sport equipment, pressure vessels and automotive parts. However, when loaded under static or fatigue conditions they exhibit a relatively brittle behaviour with extensive matrix cracking and delamination, which leads to loss of stiffness and load-carrying capability; they also show poor damage resistance and low impact strength. Modelling the progressive damage of thin laminates under low velocity impact is an important area, especially in the fabrication of aircraft structural components where barely visible impact damage (BVID) can be a critical issue [1]. The damage mechanisms for a thin plate are different for low and high velocity scenarios; in a high velocity impact of a thin plate perforation is more likely to occur, while for a low velocity impact, there is a sufficiently long contact duration to introduce internal matrix cracking, delamination and fibre breakage that spreads over a larger area [2].
Considering the time and cost of physical testing, finite element (FE) techniques offer the opportunity to develop a numerical model, which could accurately describe the impact and predict the complex internal damage mechanisms in a relatively short time. The complicated composite material behaviour can be simulated based on the constitutive models provided by several analytical studies [2-6]. It is important when constructing and meshing the model to follow the experimental conditions as closely as possible although in some cases it is also necessary to make some assumptions to simplify the model and speed up the analysis. An appropriate balance in terms of factors such as model complexity and mesh size and shape must be struck between reducing the calculation time and increasing the precision of the results. FE methods are thus convenient and efficient tools to use for engineering research when used with a strong knowledge background of the finite element theory [3].
Recent research, based on continuum damage mechanics (CDM), on modelling the damage of composite laminates subjected to impact has been reported [4-7]. This was initiated by the work of Kachanov [8] and Rabotnov [9]. In addition, Soutis et al. [10-11] developed the equivalent constraint model (ECM) [12] of damaged lamina to successfully predict the effect of matrix cracking and matrix crack induced delamination on stiffness degradation.
In this paper, a user-defined 3D damage model (VUMAT) with solid elements was developed and implemented into the finite element code Abaqus/Explicit to predict the type and extent of damage through the laminate thickness. Interface cohesive elements were inserted between plies of the modelled laminate to simulate delamination. An effective approach developed by Soutis et al. [13-14] was also used to describe the nonlinear shear behaviour of the laminate. The general contact algorithm in Abaqus was used to simulate the contact between impactor and composite plate surface, and the contact between layers by defining appropriate contact pair properties. The numerical results from the simulation were evaluated by comparing with experimental measurements and observations and this demonstrated the ability of the proposed damage modelling approach to predict the type and extent of impact induced damage.
2. Composite damage model for impact
Composite laminated structures, which are made from the continuous carbon fibres and a polymeric resin, usually show a complicated damage pattern that develops internally and becomes difficult to detect [15-16]. In general, this damage can be characterised by two main failure categories: i) Intra-laminar failure that occurs within a ply and can be expressed by modes such as: fibre tensile and compressive breakage, matrix tensile and compressive damage and damage between the fibre and matrix interface and ii) Inter-laminar failure or delamination that occurs between neighbouring plies.
Large tensile loads introduced during impact finally lead to fibre rupture. This damage mode releases large amounts of energy and the load in the composites cannot be redistributed. Thus this kind of damage can result in a catastrophic failure of the structure. Compression load in the fibre direction, causes fibre micro-buckling and leads to the formation of fibre kinking [13-14]. The resin shear behaviour and initial fibre misalignment have a crucial influence on this type of failure mode. Matrix cracking in the composite results from the load in the transverse direction. Tensile loading of the matrix can cause transverse ply cracks (TPC) and/or can lead to fibre/matrix interfacial failure or splitting. This interfacial failure is also called fibre/matrix debonding and can occur when a resin crack meets a fibre or when a fibre fractures and the crack is directed along the fibre-matrix interface. Matrix compression failure has been observed but experimental evidence has shown that it is actually dominated by the shear matrix failure with a fracture plane in the through-thickness direction [17].
Delamination is a common damage mechanism in composite laminated structures. Delamination seldom occurs on its own and in many cases is initiated due to intra-laminar failures such as transverse ply cracking [10-12]. The stiffness of the structure is decreased depending on the amount of delamination and this induces further intra-laminar damage which then prompts propagation of the delamination under high transverse shear loading and additional deterioration of stiffness and strength properties [18-20].
2.1 Damage initiation
Damage modelling in composites can be studied either by a stress or strain-based failure criteria approach or following damage mechanics concepts. The polynomial failure criteria, such as the Tsai-Wu or Tsai-Hill, based on the equivalent stress or strain are usually employed to describe the failure envelope of any given multidirectional laminate subjected to multi-axial loading. However, the damage mechanisms as different modes cannot be clearly characterised using the polynomial failure criteria, unless they are applied at the ply level. Hence a ply-by-ply method has been widely used to model the progressive failure in composites. Hashin proposed a failure criterion for a unidirectional composite to separately model four distinct failure modes: fibre damage in tension and compression and matrix tensile and compressive failure [21, 22]. Hashin failure criterion
has been used extensively in industry, although it cannot accurately predict the matrix compressive failure initiation. Thus, in the present study, Hashin criterion is used to estimate the fibre and tensile matrix damage initiation, while the damage model developed by Puck and Schurmann [23] is used to model matrix compressive failure, i.e.
Fibre tensile failure ( ):
(1)
Fibre compressive failure ( ):
(2)
Matrix tensile failure ( ):
(3)
Matrix compressive failure ( ):
(4)
In Eqs. (1-4), (i, j = 1, 2, 3) is the effective stress tensor, XT and XC denote the tensile and compressive strengths of the unidirectional composite laminate in the fibre direction, YT and YC are the tensile and compressive strengths in the transverse direction, Si, j (i, j = 1, 2, 3) denotes the longitudinal and transverse shear strengths of the composite, respectively. The coefficient in Eq. (1) accounts for the contribution of shear stress on fibre tensile failure, which is ignored in the present study. In Eq. (4) (i, j = L, T, N) is the stress tensor (i, j = 1, 2, 3) rotated to the fracture plane by using the transformation matrix T(α): (5)
is the transverse shear strength in the fracture plane, which can be determined by the transverse compression strength and the angle of fracture plane. The key concept of Puck’s failure criterion is to determine the inclination or orientation of the fracture plane by calculating the angle, α, as shown in Fig. 1. Generally it has been experimentally observed that matrix compressive damage occurs along a fracture plane oriented at α = 53o with respect to the through-thickness direction [23], although this angle was determined under uniaxial compressive loading rather than impact. The angle of the fracture plane can be evaluated by the finite element method where Fmc is estimated at various angles between 0o and 180o, the angle of the fracture plane will be that where the value of Fmc is maximum.
2.2 Damage evolution
In order to predict damage development in the laminate, a stiffness degradation rule needs to be defined. Tita et al. [20] reduced the material moduli by using appropriate factors with respect to the various failure modes observed. For instance, to account for transverse ply cracking the Young’s modulus E2 and the Poisson’s ratio ν12 were reduced to zero. For delamination the degradation stiffness parameters were given a value equal to 0.01. Although this process was straightforward to apply, the method was unable to accurately predict the size of the damage area. In this paper, the damage evolution procedure described in the following sections is used and is based on a strain failure criterion where the strain tensor is continuously updated with increasing load for each material point associated with each different failure mechanism.
2.2.1 Tensile failure modes
According to previous work [4-6], the stresses in the fibre direction are predominantly carried by the fibres because of their high stiffness and strength. When the damage initiation criterion is met, Eqs. (1) & (3), the material properties are gradually degraded, by using the following damage variable where for fibre and matrix tensile failure is expressed as:
(6)
where the subscript 1 and 2 denote the fibre and transverse direction, respectively; is the tensile strain for damage initiation. Due to the irreversibility of the damage variable, the strain calculated at each time step is defined as in Eq. (6). In order to avoid zero or negative energy absorption due to damage, the final failure strain
needs to be greater than the initial failure strain, i.e. .
The failure initiation strain is given by the following equations:
(7a)
(7b)
where is the undamaged elastic modulus and XT and YT are the tensile strengths of
the material in either the fibre or transverse direction. denotes the tensile strain at final
failure at which the damage variable is equal to one. The is derived from the fracture
toughness associated with fibre (1) or matrix (2) tensile failure, the failure strength of the material (XT or YT) and the characteristic length :
(8a)
(8b)
where is the characteristic length that would keep a constant energy release rate per unit area of crack and make the final results independent of FE mesh size. In this work the approach developed by Bažant and Oh [24] was used and for a solid element is given by
(9)
The AIP area is associated with an integration point and the θ angle between the mesh line and the crack direction. This method has been shown to be computationally efficient and to work reasonably well for solid elements [25].
2.2.2 Compressive failure modes
Similarly, the compressive damage variable in the fibre direction can be expressed:
(10)
The strain at failure initiation and the strain at final failure are obtained by a similar approach described in Section 2.2.1.
(11a)
(11b)
In order to account for matrix crushing and fragment interaction effects within the damage zone, the stress value at final failure is not completely degraded but is reduced to the transverse compressive strength of the material system YC.
For matrix compressive failure, the damage evolution can be effectively predicted by defining the fracture plane and the corresponding transformed strain, i.e.,
(12)
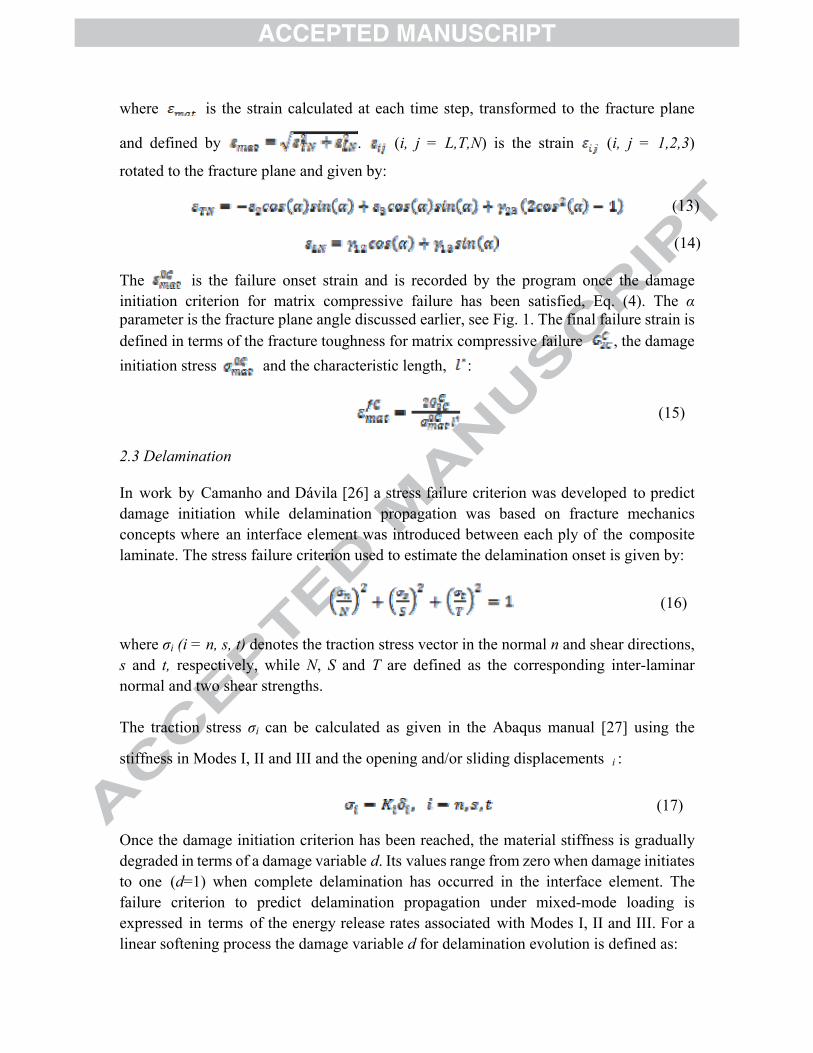
where is the strain calculated at each time step, transformed to the fracture plane
and defined by . (i, j = L,T,N) is the strain (i, j = 1,2,3)
rotated to the fracture plane and given by:
(13)
(14)
The is the failure onset strain and is recorded by the program once the damage initiation criterion for matrix compressive failure has been satisfied, Eq. (4). The α parameter is the fracture plane angle discussed earlier, see Fig. 1. The final failure strain is defined in terms of the fracture toughness for matrix compressive failure , the damage initiation stress and the characteristic length, :
(15)
2.3 Delamination
In work by Camanho and Dávila [26] a stress failure criterion was developed to predict damage initiation while delamination propagation was based on fracture mechanics concepts where an interface element was introduced between each ply of the composite laminate. The stress failure criterion used to estimate the delamination onset is given by:
(16)
where σi (i = n, s, t) denotes the traction stress vector in the normal n and shear directions, s and t, respectively, while N, S and T are defined as the corresponding inter-laminar normal and two shear strengths. The traction stress σi can be calculated as given in the Abaqus manual [27] using the
stiffness in Modes I, II and III and the opening and/or sliding displacements i :
(17)
Once the damage initiation criterion has been reached, the material stiffness is gradually degraded in terms of a damage variable d. Its values range from zero when damage initiates to one (d=1) when complete delamination has occurred in the interface element. The failure criterion to predict delamination propagation under mixed-mode loading is expressed in terms of the energy release rates associated with Modes I, II and III. For a linear softening process the damage variable d for delamination evolution is defined as:
(18)
where refers to the maximum value of the mixed-mode displacement attained
during the loading history. The m parameter corresponds to the total mixed-mode
displacement (normal, sliding, tearing) given by:
(19)
In Eq. (18) is the mixed-mode displacement at complete failure and is the
effective displacement at damage initiation. A Benzeggagh–Kenane (BK) fracture energy based criterion [26] can be used to define the mixed-mode displacement for complete
failure, :
(20)
where is the B-K power law parameter that can be determined using a least-square fit
from a set of mixed-mode bending experimental data; with ξ taking values
between zero and one. When ξ=0 fracture is mode I driven, while as ξ→1 is mode II
dominated (and this is also the case when =0). is the mode mixity ratio (= ).
A typical linear traction-separation model used for fracture Modes I, II and III is shown in Fig. 2. Initially, the linear elastic response is represented using the stiffness Ki (i = n, s, t). Once the normal or shear tractions reach the corresponding inter-laminar normal and shear strengths, delamination will be initiated and then the stiffness will start to degrade linearly according to the damage evolution variable d given by Eq. (18).
2.4 Nonlinear shear behaviour
According to experimental observations, composite laminates generally show a nonlinear and irreversible shear behaviour. There are two different mechanisms to describe the nonlinear shear behaviour: matrix plasticity, matrix cracking and fibre/matrix interfacial failure that progressively cause stiffness degradation leading eventually to fibre breakage and catastrophic failure. A number of approaches to model the nonlinear shear behaviour
of the composite laminate have been published in the literature such as continuum theories of plasticity [28], continuum damage mechanics [29], or combination of these two methods [30]. In this paper, a semi-empirical expression developed by Soutis et al. [13-14] is used to represent the nonlinear shear response. A good agreement between the experimental and analytical results is obtained as shown in Fig. 3a. The nonlinear shear stress-strain relations are expressed by Eq. (21):
, (21)
The ultimate shear strength and the elastic shear modulus , both of which are
composite materials constants and readily measurable, are required for implementation in the FE program that models the nonlinear shear behaviour of the composite.
The nonlinear shear damage is successfully simulated using a strain based damage initiation and evolution criterion as shown Fig. 3b. The strain in this nonlinear shear
model is decomposed into two parts: elastic strain and inelastic strain . The
inelastic strain is defined as:
(22)
where is the nonlinear shear stress corresponding to the different shear planes;
is the original shear modulus. The criterion of initiation of shear failure is expressed in terms of the nonlinear shear stress and maximum shear strength:
, (23)
where is the shear stress at the given shear plane and indicates the relative ultimate shear strength in that plane.
The damage evolution law for the nonlinear shear modes is expressed by the damage variable di,j :
(24)
where is the shear strain at complete failure and is related to the shear fracture
toughness (varies with mode of fracture) GS, shear strengths of the material and the characteristic length :
(25)
denotes the inelastic strain at shear damage initiation which can be stored and employed automatically when the material model is implemented into the FE software.
3. Experiment and simulation of impact events
3.1 Impact test
Composite laminates, 2 mm thick, were fabricated from carbon fibre/epoxy resin prepreg with a stacking sequence of [0/90]2s. The prepreg was made from continuous unidirectional high tensile strength carbon fibres (Tenax HTS40 12K 300) impregnated with Cycom® 977-2 epoxy resin, which is a typical high temperature curing aerospace grade system. The laminates were autoclave cured following the manufacturer's recommended schedule and cut into specimens measuring 100 mm x 100 mm.
The impact testing followed the guidelines given by the ASTM D7136/D7136M-07 standard [31]. The dart impactor used had a hemispherical head 15 mm in diameter, while the tested panels were clamped between two steel plates with a circular exposed area of 75 mm in diameter. A drop height of 0.75 m was used throughout the test program, the mass of the impactor was equal to 1, 1.5 and 2 kg resulting in impact energies of 7.35, 11.03 and 14.7 J, respectively. Force data were logged from the impactor using a high speed data acquisition unit. At least three specimens were tested for each energy level.
3.2 Simulation of impact event
The Abaqus/Explicit code was used to run the numerical FE model where the proposed failure initiation and fracture criteria were implemented together with the shear damage material model described in the earlier sections. Appropriate geometrical models were built and kinematic and loading boundary conditions were defined to represent the experimental set up.
3.2.1 Geometrical modelling and boundary conditions
A 3D FE model was built for the impactor and the circular plate and appropriate boundary conditions were defined as shown in Fig. 4. In the FE analysis the unsupported circular plate of 75 mm in diameter was modelled with a fully clamped edge. The 2 mm thick laminate consisted of 8 plies with a ply thickness of 0.25 mm in the stacking sequence [0/90]2s. Global and local coordinates were defined to account for ply orientations and correctly describe the laminate and material behaviour. All the nodes of the plate edge were fixed in all directions (x, y, z) to simulate the experimental clamped conditions, Fig. 4.
The impactor was modelled as a rigid body; the impact events were performed for the three energies mentioned earlier and a prescribed initial velocity of 3.83 ms-1 was assigned to the impactor.
3.2.2 Types of finite element used and mesh density
In the circular composite plate examined, each ply was represented by two eight-node linear brick element, C3D8. The computing time was reduced by introducing different mesh size/density in different regions of the FE model, from 1mm x 1 mm elements in the impacted zone, in Fig. 4, up to a coarser mesh size elements away from the impact where damage was not expected to occur, which is in agreement with experimental observations. The localised stiffness reduction due to internal damage can cause an excessive element distortion that could lead to difficulties in numerical convergence, run slowly or even abort the solution. To resolve this numerical issue, the ‘distortion control’ was activated in Abaqus and the damage variables were limited to a maximum value of 0.99, which helps to maintain some residual stiffness. At each ply interface, COH3D8 cohesive elements were inserted with a thickness of 0.0075 mm and were used to model delamination initiation and growth with the failure criteria discussed in Section 2.3. The degradation parameters were again set to a value of 0.99 and the failed elements were removed from the FE model once the failure criteria were satisfied. In this damage simulation process, a small stable time increment was required, which increased the computing time. The elastic modulus assigned to the cohesive zone element, Table 2, was normalised by its thickness (mass scaling) to reduce the calculation time.
3.2.3 Material properties
The detailed material properties are listed in Table 1 [5, 32]. The values of fracture toughness for the various intra- and inter-laminar damage modes were taken from the Refs. [33, 34]. The properties assigned to the cohesive elements are also listed in Table 2, which includes values for the elastic modulus, strength and fracture energy; the stiffness properties were normalised by the element thickness. Damage evolution under mixed-mode loading was predicted by the Benzeggagh–Kenane fracture energy law [26] where factor =1.45 was experimentally obtained. As mentioned previously the fracture energy should be kept independent of the FE mesh size, thus the characteristic length , Eq. (9), needs to be defined to correctly predict damage growth.
3.2.4 Contact algorithm
Contact between the impactor and impacted plate and among each contacted ply of the laminate, were defined by the general contact algorithm within Abaqus/Explicit. This algorithm generated the contact forces based on the penalty enforcement contact method. A tangential interaction was defined between the surfaces of adjacent layers in terms of a Coulomb friction model. The friction coefficient, μ, is used to account for the shear stress τ of the surface traction with contact pressure p, which can be represented as .
Generally, the friction coefficient is mainly determined by the material property and the surface quality. Various researchers have investigated the friction between composite surfaces and several effective methods exist to obtain the friction coefficient [35-37]. The friction coefficient between contacted layers is defined as a function of fibre orientation.
So for a 0o/0o interface the value of =0.2 was reported, while a value of 0.8 was suggested
for the interface between neighbouring 90o plies. Thus, in the present analysis an average friction coefficient of 0.5 was used between the 0o/90o interface of the cross ply laminate. In addition, a similar contact algorithm was applied between the surface of the metal
impactor and the composite plate and a friction coefficient value of = 0.3 was used. It
needs to be said that these assumed values do have an effect on energy absorbed
prediction, so ideally should be measured for the system examined.
4. Results and discussion
Experimental and predicted impact force and energy versus time curves were compared to assess the accuracy of the proposed model that attempts to estimate the impact resistance of the cross-ply laminate.
4.1 Impact force
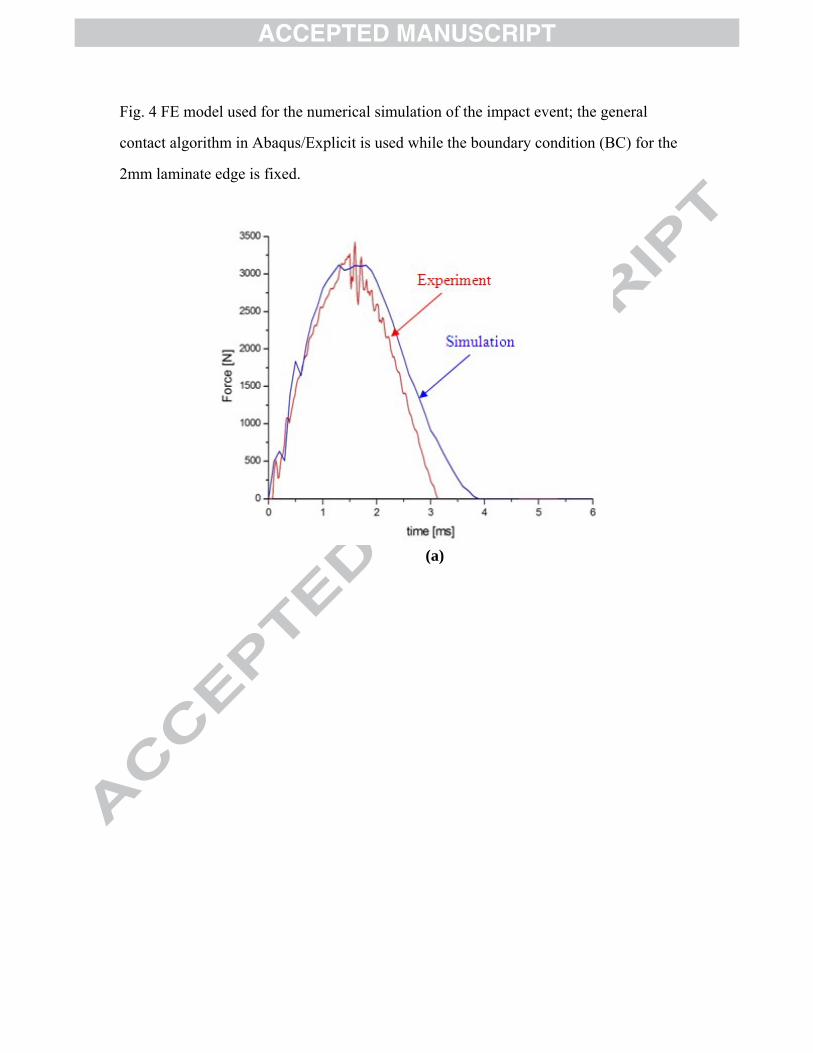
In Fig. 5a the force-time history for the 7.35 J impact test is shown. In the initial phase of contact some oscillations can be seen in the time interval of 0 ms to approximate 0.7 ms due to the elastic vibration induced by the initial contact between the impactor and the composite laminate. After that, intense oscillations occur near the peak force value that indicates initiation of damage. The impactor then bounces back and the load is reduced to zero. A good agreement is obtained between the numerical result and experiment, especially while the load is increasing. The maximum force of 3230 N obtained experimentally closely matches the predicted value of 3116 N. After the peak load is reached and the impactor starts to rebound the numerical result shows a slightly higher value of load than the experimental and takes a longer time to reach zero. This phenomenon may be due to contact forces between the delaminated plies after the cohesive elements have been removed from the simulation as the composite plate returns to its original shape. The force-time for the 11.03 J impact test is plotted in Fig. 5b, where the important features are accurately captured by the numerical modelling although the maximum force is still slightly under predicted at 3338 N compared to 3765 N measured in the experiment. Fig. 5c shows the force-time response under a 14.7 J impact. The numerical analysis gives a good prediction during the load phase and the estimated maximum force is 3917 N, only slightly lower than that of the test value (4605 N). More intense oscillations, highs and drops of force are experimentally observed near the peak, and at approximately 2.2 ms the larger force reduction seen can be attributed to the fibre
breakage. Due to the higher impact energy, more contact time is recorded that introduces more extensive damage in the composite.
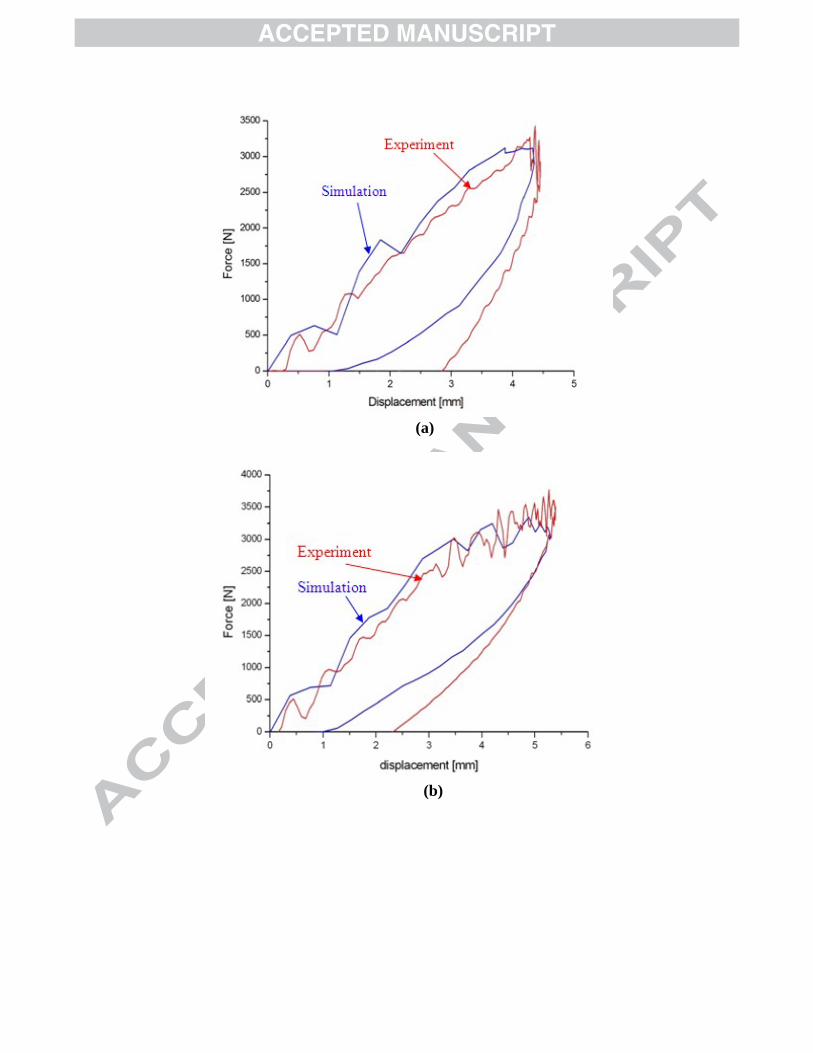
The F-t results presented in Fig. 5 are translated into force-displacement curves shown in Fig. 6; experimental and numerically predicted curves are compared. In the initial phase of the impact event, there is a similar slope until the maximum impact force is reached and this is in better agreement with increasing impact energy. However, during the unloading phase the composite plate returns back to its original state more slowly and less completely than simulated, especially in the case of the lowest energy, 7.35 J impact, Fig. 6a. It should be noted that in the experiment the displacement measured corresponds to that of the rebounding impactor, while the numerical value is obtained from the mid-point of the plate’s back face. This difference and factors like the assumed friction coefficient between the projectile and plate may have an effect that lead to numerical predictions which show a faster plate recovery than the one measured experimentally. Also in Fig. 6c the predicted force is not reduced to zero since at this impact energy (14.7 J) the element in the FE model has completely failed and ‘removed’ so no force value is recorded.
4.2 Impact energy
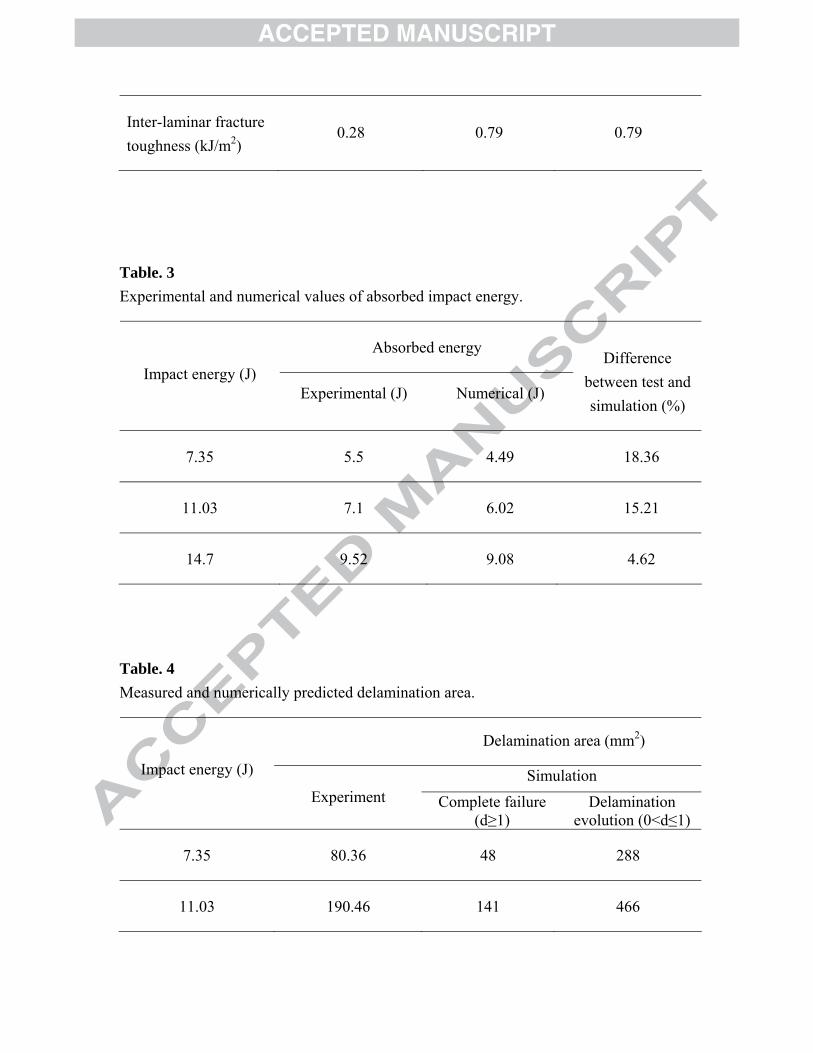
The impact energy-time relationship is presented in Fig. 7. In Fig. 7a the initial kinetic energy of the impactor (7.35 J) is transferred to the composite plate once contact is made. During the impact event, part of this energy is the absorbed energy by the plate in the form of elastic deformation (elastic energy), while a larger amount is dissipated in the form of intra-laminar damage, delamination and the friction between projectile/laminate and among neighbouring ply within the laminate. The kinetic energy of the impactor is completely transferred to the plate when its velocity reaches zero. After this point, the elastic energy stored by the plate is transferred back to the impactor which causes it to rebound. Finally, the energy absorbed by the composite reaches a stable value resulting from the damage and friction. Compared to the experimental result in Fig. 7a, the initial impact energy is captured very accurately by the numerical model. However, the inaccuracy in modelling of the rebound phase of the impact leads to inaccuracy in the final value of energy absorbed. The final absorbed energy with different impact energies is listed in Table 3. It shows that the final absorbed energy predicted by the numerical model is about 4.49 J for the impact energy of 7.35 J, approximately 18 % lower than the experimental result (5.5 J). Figs. 7 (b-c) show impact energy-time histories for 11.03 and 14.7 J impacts respectively. A better prediction is obtained for these two cases as seen in Table 3; for the 11.03 J impact the final energy absorbed by the composite in the form of damage and friction is 7.1 J obtained experimentally compared to 6.02 J predicted, while for the case of 14.7 J, the predicted value of 9.08 J comes closer to the measured value of 9.52 J, an error of 15 % and 4.6 % respectively. It appears that the difference between experimental and numerical values gets smaller with increasing impact energy, especially less than 5% for the 14.7 J case, suggesting that the assumptions made in the failure
criteria can represent relatively accurately the experimental set up, at least in the case of higher energy impacts.
4.3 Experimentally detected and numerically predicted damage
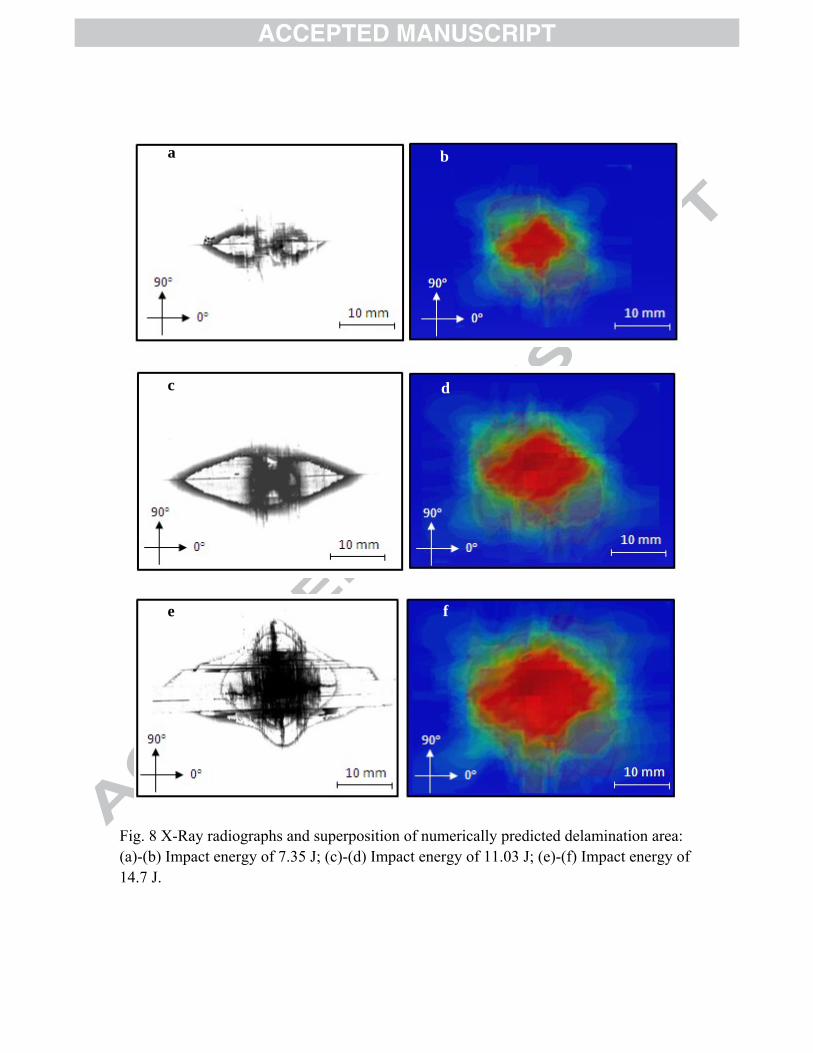
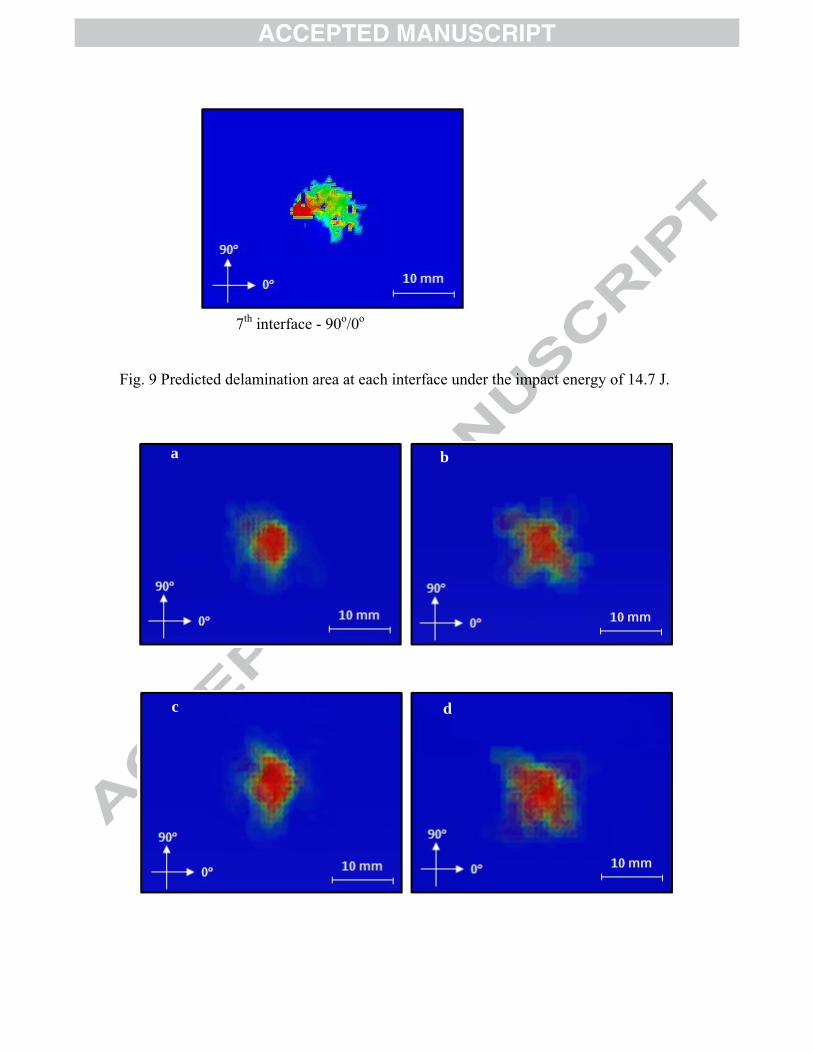
Visually, it was observed that a shallow dent (of the order of 0.25 mm) was created on the front face and slight fibre/matrix splitting on the back face. Non-destructive evaluation (NDE) of the composite panel by penetrant-enhanced X-Ray radiography, showed transverse ply cracking, splitting and almost “peanut” shaped delaminations, as illustrated in Fig. 8a. The predicted overall damage is shown for comparison in Fig. 8b, where all the delaminations are represented in rainbow colour (while in print in different shades of grey); dark regions (red) indicate that the material has failed completely while in the lighter grey areas the material comes closer to failure (failure criterion hasn’t yet been reached). The delaminated region shown in Fig. 8a is larger than that predicted, which indicates the damage model underestimated the energy absorbed shown in Fig. 7a. Similar radiographs and predicted damage patterns are shown in Figs. 8 (c-f) for the other two impact cases (11.03 and 14.7 J). The amount of damage introduced is more extensive with increasing impact energy, as expected. The damage area obtained experimentally and numerically has been calculated and is presented in Table 4. The predicted area of complete failure is always smaller than that of the measured delamination area for all impact energies. However, the delamination evolution area which includes the complete and partially failed region is larger than the experiment. The images shown by Figs. 8 (b, d, f) illustrate the severity of damage by different colours (or shades of grey); very dark corresponds to the complete delamination region while lighter shade of grey indicates the interface hasn’t yet delaminated but the material has been locally weakened that contributes to the energy dissipation. Fig. 9 shows the predicted delamination at each ply interface for the case of 14.7 J impact energy. It can be seen that the largest area of complete delamination is found to occur at the 90o/90o mid-plane interface, something that could change if axial splitting (fibre/matrix interface) was taken explicitly into account in the analysis.
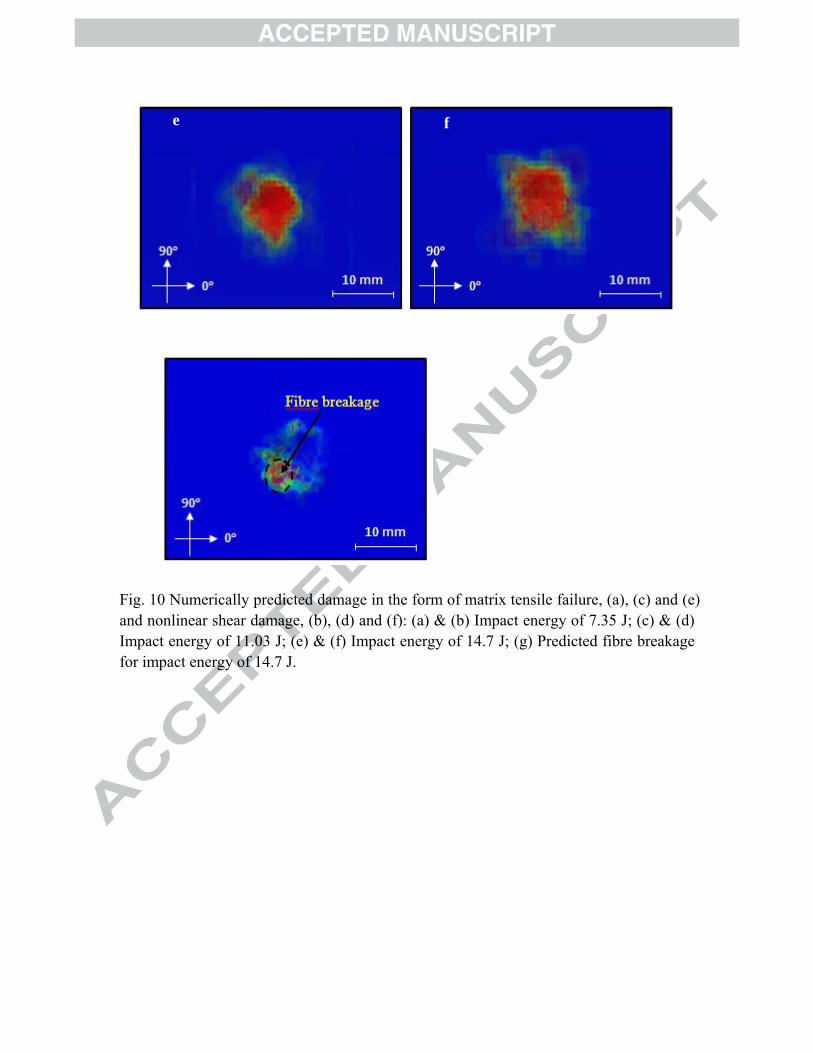
Matrix tensile and shear damage are also important damage mechanisms that absorb energy and can be predicted as shown in Figs. 10 (a-f); in these images, the matrix tensile failure and in-plane shear damage of each ply are superimposed. The matrix tensile failure in Fig. 10a is initially small and gets larger under increased impact energy, Figs. 10 c and e. In-plane shear damage in each ply is superimposed in Fig. 10b and develops at approximately ±45o to the 0º fibre direction. A larger amount of shear damage is introduced at a high impact energy level, Figs. 10d and f. This damage might lead to a small permanent indentation after the impact event. Moreover, fibre breakage in Fig. 10g was predicted by the damage model when the load in the fibre direction is exceeding its strength, like in the case of the 14.7 J impact. Fibre breakage was also observed experimentally and can be seen in Figs. 8c and e as the darker regions (zinc iodide solution has completely penetrated the damaged plate).
Fig. 11 shows the permanent indentation predicted by the numerical model with the delamination at different ply interfaces. The predicted post-impact indentation is similar in depth to the actual damage observed after the impact test. The permanent indentation is formed due to the nonlinear shear damage behaviour of the polymer matrix, where the inelastic shear strain results in a permanent indentation and this indentation could play an important role on the performance of the compression after impact event. In addition, delamination predicted at different ply interfaces can be seen in Fig. 11 that shows a through-thickness section of the simulated laminate.
5. Concluding remarks
In this paper the impact response and impact induced damage for a simple cross-ply [0/90]2s composite laminate have been investigated experimentally and numerically under three different impact energy levels. A stress based failure criterion was used to predict damage initiation while damage propagation in the form of intra- and inter-laminar cracking (delamination) was simulated by energy based criteria. The method was implemented via the user subroutine VUMAT of the Abaqus/Explicit commercially available code. Delamination is considered as one of the critical failure mechanisms that can substantially reduce the residual strength of the composite plate, especially under compression [38, 39], which makes its accurate prediction crucial in the design of composite structures. In this analysis, delamination was modelled by inserting cohesive element layers between all plies where an appropriate traction law and damage initiation and evolution criteria were applied. The nonlinear shear response of the composite was also considered by using the Soutis et al. shear model [14] and damage progression compared favourably with the experimental results and observations. While the peak force, energy and displacement were all accurately captured in the numerical simulations, the material behaviour during the projectile rebound was less accurately predicted. The model under-predicted the energy absorbed by the laminate and the degree of permanent deformation during the 7.35 J impact, but the discrepancy kept decreasing with increasing impact energy. This discrepancy is most likely to be due to material properties variability, specimen quality/imperfections introduced during the manufacturing process and/or inaccuracies in the friction coefficient assumed between the projectile and plate or between individual plies. The type, location and extent of damage were also identified by the model and overall damage area was in good agreement with observations and X-ray radiography images. At higher energy levels, especially at 14.7 J, a very good agreement was found between the experimental and numerically predicted delaminated area. In addition, the permanent indentation on the impacted face and fibre breakage were also successfully predicted for the 14.7 J impact case, further supporting the modelling approach and
assumptions made. In the near future other multi-directional lay-ups will be attempted, especially thick laminates where a volume effect (scaling effect) may be an issue [40, 41]. In addition, residual strength prediction under uniaxial compressive loading and compression after impact (CAI), often a limiting design parameter in the aircraft construction with composites [42, 43], will be studied. Also, the X-Ray radiography in this work was performed after the impact event, when the plate was unloaded. This of course implies that many of the resin cracks and delaminations, especially at the lower impact levels, might close making it difficult for the zinc iodide solution to penetrate and reveal the real extent of damage, which resulted in overestimating the size of the weakened (delaminated) region, Table 4. Real time structural health monitoring techniques [15, 16] will be required for more accurate comparisons between damage sizes of prediction and measurement.
Reference
1. Abrate S. Impact on composite structures. Cambridge University Press, Cambridge, UK, 1998. 2. Davies GAO, Olsson R. Impact on composite structures. Aeronaut J 2004; 108(1089):541–63. 3.Matthews FL, Davies GAO, Hitchings D, Soutis C. Finite element modelling of composite materials and structures. Woodhead Publishing Ltd, 2000. 4. Donadon MV, Iannucci L, Falzon BG, Hodgkinson JM, Almeida SFM. A progressive failure model for composite laminates subjected to low velocity impact damage. Comput Struct 2008; 86: 1232-52. 5. Faggiani A, Falzon BG. Predicting low-velocity impact damage on a stiffened composite panel. Composites Part A 2010; 41: 737-49. 6. Iannucci L, Ankersen J. An energy based damage model for thin laminated composites. Compos Sci Technol 2006; 66: 934-51. 7. Yokoyama NO, Donadon MV, Almeida SFM. A numerical study on the impact resistance of composite shells using an energy based failure model. Compos Struct 2010; 93: 142-52. 8. Kachanov LM. On the creep rupture time. Izv AN SSSR Otd Tekhn Nauk 1958; 8: 26-31. 9. Rabotnov YN. On the equations of state for creep. Progress in Applied Mechanics, Prager Anniversary Volume. NewYork: Macmillan; 1963. 10. Kashtalyan M, Soutis C. The effect of delaminations induced by transverse cracks and splits on stiffness properties of composite laminates. Composites Part A 2000; 31: 107-19. 11. Kashtalyan M, Soutis C. Analysis of local delaminations in composite laminates with angle-ply matrix cracks. Int J Solids Struct 2002; 39: 1515-37.
12. Zhang J, Fan J, Soutis C. Analysis of multiple matrix cracking in composite
laminates. Part 1: in-plane stiffness properties. Composites 1992; 23(5):291–8. 13. Berbinau P, Soutis C, Goutas P, Curtis PT. Effect of off-axis ply orientation on 0o-fibre microbuckling. Composites Part A 1999; 30: 1197-207. 14. Berbinau P, Soutis C, Guz IA. Compressive failure of 0o unidirectional carbon-fibre-reinforced plastic (CFRP) laminates by fibre micobuckling. Compos Sci Technol 1999; 59: 1451-55. 15. Diaz Valdes SH and Soutis C. Health monitoring of composites using lamb waves generated by piezo-electric devices. Plastics, Rubber and Composites 2000; 29(9): 496-502. 16. Diaz Valdes SH and Soutis C. Real-time non-destructive evaluation of fibre composite laminates using low-frequency lamb waves. J Acc. Soc. America 2002; 111(5): 2026-33. 17. Anderson TL. Fracture mechanics – fundamentals and applications. New York: CRC Press, 1995. 18. Kashtallyan MY, Soutis C. Mechanisms of internal damage and their effect on the behaviour and properties of cross-ply composite laminates. Int Appl Mech 2002; 38(6): 641-57. 19. Zhang J, Soutis C, Fan J. Strain energy release rate associated with local delamination in cracked composite laminates. Composites 1994; 25(9): 851-62. 20. Tita V, de Carvalho J, Vandepitte D. Failure analysis of low velocity impact on thin composite laminates: Experimental and numerical approaches. Compos Struct 2008; 83: 413-28. 21. Hashin Z, Rotem A. A fatigue failure criterion for fiber-reinforced materials. J Compos Mater 1973; 7: 448-64. 22. Hashin Z. Failure criteria for uni-directional fibre composites. J. Appl. Mech 1980; 47(1): 329–34. 23. Puck A, Schurmann H. Failure Analysis of FRP Laminates by means of physically based phenomenological models. Compos Sci Technol 1998; 58(10): 1045–67. 24. Bažant ZP, Oh BH. Crack band theory for fracture of concrete. Mater Struct 1983; 16: 155–77. 25. Lapczyk I, Hurtado JA. Progressive damage modelling in fiber-reinforced materials. Composites Part A 2007; 38: 2333-41. 26. Camanho PP, Dávila CG. Mixed-Mode decohesion finite elements for the simulation of delamination in composite materials. Tech. Rep. NASA/TM-2002-211737, 2002. 27. ABAQUS. ABAQUS Version 6.10, Dessault systemes. Providence, RI; 2010. 28. Khan SA, Huang S. Continuum theory of plasticity. John Wiley and Sons, New York, 1995. 29. Lemaitre J, Chaboche JL. Mechanics of solid materials. Cambridge University Press, Cambridge, UK, 1990. 30. Danesi R, Luccioni B, Oller S. Coupled plastic-damaged model. Comput Methods Appl Mech Eng 1996; 129(1-2): 81-9.
31. ASTM D7136/D7136M-07. Standard test method for measuring the damage resistance of a fibre-reinforced polymer matrix composite to a drop-weight impact event. Philadelphia: American Society for Testing and Materials, 2007. 32. Jumahat A, Soutis C, Hodzic A. A graphical method predicting the compressive strength of toughened unidirectional composite laminates. Appl Compos Mater 2011; 18: 65-83. 33. Chang FK, Shahid IS. An accumulative damage model for tensile and shear failures of laminated composite plates. J Compos Mater 1995; 29(7): 926–81. 34. Pinho ST, Iannucci L, Robinson P. Fracture toughness of the tensile and compressive fibre failure modes in laminated composites. Compos Sci Technol 2006; 66(13): 22069–79. 35. Sung N, Suh N. Effect of fiber orientation on friction and wear of fiber reinforced polymeric composites. Wear 1979; 53: 129–41. 36. Schon J. Coefficient of friction of composite delamination surfaces. Wear 2000; 237: 77–89. 37. Bing Q, Sun CT. Effect of transverse normal stress on mode II fracture toughness in fiber composites. In: 16th International conference on composite materials, Kyoto, Japan; 2007. 38. Soutis C, Guz IA. Fracture of layered composites by internal fibre instability: Effect of interlaminar adhesion. The Aeronautical Journal 2006; 110(1105): 185-95. 39. Soutis C, Smith FC, Matthews FL. Predicting the compressive engineering performance of carbon fibre-reinforced plastics. Composites Part A 2000; 31(6): 531-36. 40. Lavoie JA, Soutis C, Morton J. Apparent strength scaling in continuous fiber composite laminates. Compos Sci Technol 2000; 60(2): 283-99. 41. Lee J, Soutis C. A study on the compressive strength of thick carbon fibre/epoxy laminates. Compos Sci Technol 2007; 67(10): 2015-26. 42. Curtis PT, Hawyes VJ, Soutis C. Effect of impact damage on the compressive response of composite laminates. Composites Part A 2001; 32(9): 1263-70. 43. Soutis C, Curtis PT. Prediction of the post-impact compressive strength of CFRP laminated composites. Compos Sci Technol 1996; 56(6): 677-84.
Figure captions Fig. 1 Fracture plane for matrix compressive failure relative to material coordinate system. Fig . 2 Typical traction-opening or sliding displacement. Fig. 3 Nonlinear shear behaviour using the Soutis model: (a) Experimental and analytical
results [13-14] and (b) Numerical curve with non-linear shear damage variable for the
present composite system. Fig. 4 FE model used for the numerical simulation of the impact event; the general contact algorithm in Abaqus/Explicit is used while the boundary condition (BC) for the laminate edge is fixed. Fig. 5 Experimental and numerical impact force-time histories: (a) Impact energy of 7.35 J; (b) Impact energy of 11.03 J; (c) Impact energy of 14.7 J. Fig. 6 Experimental and numerical impact force-displacement histories: (a) Impact energy of 7.35 J; (b) Impact energy of 11.03 J; (c) Impact energy of 14.7 J. Fig. 7 Experimental and numerical impact energy-time histories: (a) Impact energy of 7.35 J; (b) Impact energy of 11.03 J; (c) Impact energy of 14.7 J. Fig. 8 X-Ray radiographs and superposition of numerically predicted delamination area: (a)-(b) Impact energy of 7.35 J; (c)-(d) Impact energy of 11.03 J; (e)-(f) Impact energy of 14.7 J.
Fig. 9 Predicted delamination area at each interface under the impact energy of 14.7 J. Fig. 10 Numerically predicted damage in the form of matrix tensile failure, (a), (c) and (e) and nonlinear shear damage, (b), (d) and (f): (a) & (b) Impact energy of 7.35 J; (c) & (d) Impact energy of 11.03 J; (e) & (f) Impact energy of 14.7 J; (g) Predicted fibre breakage for impact energy of 14.7 J. Fig. 11 Permanent indentation and delamination damage predicted by the numerical model that accounts for the nonlinear shear behaviour: (a) Impacted face and (b) Delamination locations through the thickness of the laminate.
Table captions Table. 1: Material properties of the carbon fibre/epoxy unidirectional laminate [5, 32]. Table. 2: Material parameters used in the interface cohesive element [33, 34]. Table. 3: Experimental and numerical values of absorbed impact energy. Table. 4: Measured and numerically predicted delamination area.
Fig.1 Fracture plane for matrix compressive failure relative to material coordinate system.
Fig .2 Typical traction-opening or sliding displacement.
3
1
2
α σNN
σTN
σLN
T
L
N
Fig. 3 Nonlinear shear behaviour using the Soutis model: (a) Experimental and analytical
results [13-14] and (b) Numerical τ-γ curve with non-linear shear damage variable for the
present composite system.
(a) (b)
z
y
x Fixed edge
Contact between surfaces of impactor and top laminate surface
Impactor: Fixed except z axis Initial velocity along z
Ø= 75 mm
Ø= 15 mm
Fig. 4 FE model used for the numerical simulation of the impact event; the general
contact algorithm in Abaqus/Explicit is used while the boundary condition (BC) for the
2mm laminate edge is fixed.
(a)
Fig. 5 Experimental and numerical impact force-time histories: (a) Impact energy of 7.35 J; (b) Impact energy of 11.03 J; (c) Impact energy of 14.7 J.
(b)
(c)
(a)
(b)
Fig. 6 Experimental and numerical impact force-displacement histories: (a) Impact energy of 7.35 J; (b) Impact energy of 11.03 J; (c) Impact energy of 14.7 J.
(c)
(a)
Fig. 7 Experimental and numerical impact energy-time histories: (a) Impact energy of 7.35 J; (b) Impact energy of 11.03 J; (c) Impact energy of 14.7 J.
(b)
(c)
Fig. 8 X-Ray radiographs and superposition of numerically predicted delamination area: (a)-(b) Impact energy of 7.35 J; (c)-(d) Impact energy of 11.03 J; (e)-(f) Impact energy of 14.7 J.
a b
c d
e f
1st interface - 0o/90o 2nd interface - 90o/0o
3rd interface - 0o/90o 4th interface - 90o/90o
5th interface - 90o/0o 6th interface - 0o/90o
Fig. 9 Predicted delamination area at each interface under the impact energy of 14.7 J.
a b
c d
7th interface - 90o/0o
Fig. 10 Numerically predicted damage in the form of matrix tensile failure, (a), (c) and (e) and nonlinear shear damage, (b), (d) and (f): (a) & (b) Impact energy of 7.35 J; (c) & (d) Impact energy of 11.03 J; (e) & (f) Impact energy of 14.7 J; (g) Predicted fibre breakage for impact energy of 14.7 J.
e f
g
Fig. 11 Permanent indentation and delamination damage predicted by the numerical model that accounts for the nonlinear shear behaviour: (a) Impacted face and (b) Delamination locations through the thickness of the laminate.
z
x y
Table. 1 Material properties of the carbon fibre/epoxy unidirectional laminate [5, 32].