33
Modelling effects of climate on site productivity of white pine plantations

Modelling effects of climate on site productivity of white pine plantations


Modelling effects of climate on site productivity of white pine plantations
M. Sharma1 and J. Parton2
1 Ontario Forest Research Institute, Ministry of Natural Resources and Forestry, 1235 Queen St. East, Sault Ste. Marie, ON P6A 2E5 2 Biodiversity and Monitoring Section, Ministry of Natural Resources and Forestry, South Porcupine, ON P0N 1H0
2018
Science and Research Branch Ontario Ministry of Natural Resources and Forestry

© 2018, Queen’s Printer for Ontario Printed in Ontario, Canada
Cette publication hautement spécialisée, Modelling Effects of Climate on Site Productivity of White Pine Plantations, n’est disponible qu’en anglais en vertu du Règlement 671/92 qui en exempte l’application de la Loi sur les services en français. Pour obtenir de l’aide en français, veuillez communiquer avec le ministère des Richesses naturelles au [email protected].
Some of the information in this document may not be compatible with assistive technologies. If you need any of the information in an alternate format, please contact [email protected].
Cite this report as: Sharma, M. and J. Parton. 2018. Modelling effects of climate on site productivity of white pine plantations. Ontario Ministry of Natural Resources and Forestry, Science and Research Branch, Peterborough, ON. Climate Change Research Report CCRR-49. 21 p.

Climate Change Research Report CCRR-49 iii
Summary Site productivity depends on environmental factors such as biotic, edaphic, and
climatic conditions and in forestry is represented by site index (SI) or height at a given
base age. Traditional SI equations are built on the assumption that climate remains
constant. As climate is not constant and its variability is predicted to increase, climate
variables were incorporated into stand height/site index equations developed for white
pine (Pinus strobus) plantations.
Three dominant or co-dominant white pine trees were sampled from 93 plots in
even-aged monospecific plantations at 31 sites across Ontario, Canada. Stem analysis
data collected from these trees was used to develop and evaluate SI equations. The
effects of climate on site productivity were examined by regressing site index against
climate variables. Results indicated that site specific attributes explained 52% of the
variability in white pine site productivity estimates.
Significant in the regression were growing season total precipitation (GSTP),
growing season mean temperature (GSMT), August mean monthly precipitation
(AugMP), and total climatic moisture index (TCMI). Significant climate variables were
incorporated into the stand height growth models but only GSTP and GSMT were
significant. Including climate variables significantly improved the fit statistics of the stand
height model for white pine trees. A covariance structure (AR(1)) was used to address
autocorrelation in the data.
Using the stand height growth model with climate variables incorporated, stand
heights were predicted for 4 areas (middle, easternmost, westernmost and
southernmost parts of Ontario where white pine were sampled) for the period 2021 to
2080 under 2 emissions trajectories known as representative concentration pathways
(RCPs), with each reflecting different levels of heat at the end of the century (i.e., 2.6
and 8.5 watts m-2). At the end of the 2021 to 2080 growth period, projected heights were
shorter under both climate change scenarios compared to those under a no change
scenario for 3 areas (eastern, western, and southern Ontario). Under both climate
change scenarios, the decrease in height growth was more pronounced in the south
than in the east and west, and was negligible in the centre of the province.
Climate Change Research Report CCRR-49 iv
The resulting height growth models can be used to estimate stand heights for
white pine plantations in a changing climate. Using the same model, site index of a
plot/stand can be estimated by calculating height at a given base (index) age. In the
absence of climate data, the model fitted without climate variables can be used to
estimate stand heights and site indices.
Sommaire Modélisation des effets du climat sur la productivité des stations de plantations de pins blancs
La productivité d’une station dépend de facteurs environnementaux comme les
conditions biotiques, édaphiques et climatiques; en foresterie, elle est représentée par
l’indice de qualité de station (IQS) ou la hauteur à un âge de référence donné. Les
équations traditionnelles de l’IQS reposent sur l’hypothèse d’un climat constant. Or, vu
que le climat n’est pas constant et que sa variabilité tend à augmenter, des variables
climatiques ont été intégrées aux équations hauteur dominante/indice de qualité de
station formulées pour des plantations de pins blancs (Pinus strobus).
Trois pins blancs dominants ou codominants ont été échantillonnés à partir de
93 parcelles-échantillons dans des plantations monospécifiques équiennes situées
dans 31 stations en Ontario, au Canada. Les données d’analyses de tiges recueillies
avec ces arbres ont été utilisées pour établir et évaluer des équations d’IQS. Les effets
du climat sur la productivité des stations ont été étudiés en fonction d’une régression de
l’indice de qualité de station par rapport à des variables climatiques. Selon les résultats,
52 % de la variabilité liée aux estimations de la productivité des stations de pins blancs
étaient attribuables à des caractéristiques propres aux stations.
Les précipitations totales pendant la saison de croissance (PTSC), la
température moyenne pendant la saison de croissance (TMSC), les précipitations
mensuelles moyennes en août (PMMA) et l’indice d’humidité climatique totale (IHCT)
ont joué un rôle significatif dans la régression. Des variables climatiques importantes
ont été introduites dans les modèles de croissance de la hauteur dominante, mais
seules les PTSC et la TMSC étaient représentatives dans ces modèles. Notons que
l’intégration de variables climatiques a amélioré considérablement les statistiques
d’ajustement du modèle de hauteur dominante pour les pins blancs. Une structure de

Climate Change Research Report CCRR-49 v
covariance (AR(1)) a par ailleurs été utilisée pour aborder l’autocorrélation dans les
données.
À l’aide du modèle de croissance de la hauteur dominante intégrant les variables
climatiques, les hauteurs dominantes ont été prédites pour quatre régions (régions au
milieu de la province et celles tout à l’est, tout à l’ouest et tout au sud, où des pins
blancs ont été échantillonnés) pour la période s’échelonnant de 2021 à 2080 selon
deux trajectoires d’émissions appelées « profils représentatifs d’évolution de
concentration (RCP) ». Chacune reflétait des niveaux de chaleur différents à la fin du
siècle (2,6 et 8,5 W/m²). À la fin de la période de croissance s’échelonnant de 2021 à
2080, les hauteurs prévues étaient moins élevées selon les deux scénarios de
changement climatique que selon un scénario statique pour trois régions (Est, Ouest et
Sud de l’Ontario). Selon les deux scénarios de changement climatique, la diminution de
la croissance en hauteur était plus marquée au Sud de l’Ontario par rapport à l’Est et à
l’Ouest, et elle était négligeable dans le centre de la province.
Les modèles de croissance en hauteur obtenus peuvent être utilisés pour
estimer la hauteur dominante de plantations de pins blancs dans un climat en évolution.
Le même modèle peut servir à l’évaluation de l’indice de qualité d’une parcelle ou d’un
peuplement grâce au calcul de la hauteur à un âge de référence (indice) donné. En
l’absence de données climatiques, le modèle ne recourant pas aux variables
climatiques peut aider à estimer les hauteurs dominantes et les indices de qualité de
station.

Climate Change Research Report CCRR-49 vi
Acknowledgements This study was supported by the Ontario Ministry of Natural Resources and Forestry and its Climate Change Program. The authors are grateful to Daniel McKenney and Pia Papadopol, Canadian Forest Service, for providing estimates of climate variables for study sites. Special thanks to Lisa Buse, MNRF’s Ontario Forest Research Institute, for editing a previous version of this report.

Climate Change Research Report CCRR-49 vii
Contents
Summary ..................................................................................................................... iii Sommaire ....................................................................................................................iv
Acknowledgements ..................................................................................................... vii 1.0 Introduction ........................................................................................................ 1
2.0 Methods ............................................................................................................. 2
2.1 Height and age data .......................................................................................... 2
2.2 Climate data ...................................................................................................... 5
2.3 Effects of climate on site productivity ................................................................ 5
2.4 Stand height/site index models ......................................................................... 6
2.5 Model fitting and evaluation ............................................................................... 7
3.0 Results ............................................................................................................... 8
4.0 Discussion ........................................................................................................ 15
5.0 Conclusions...................................................................................................... 17
6.0 Literature cited ................................................................................................. 19

Climate Change Research Report CCRR-49 viii

Climate Change Research Report CCRR-49 1
1.0 Introduction
Site index (SI) is a measure of site productivity. It helps predict the pattern of stand
height development over time. Therefore, it is a critical variable in most growth and yield
models. It is also a key driver used in the prediction of stand and forest volume,
biomass, and carbon content. Carbon budget models such as CBM-CFS3 (Kurz et al.
2009) and FORCARB2 (Heath et al. 2010) rely heavily on forest growth and yield
forecasts making SI equations an integral component.
Site productivity is influenced by environmental factors such as biotic, edaphic, and
climatic conditions (Clutter et al. 1983). However, most traditional SI equations assume
that climate remains constant and are strictly a function of tree age. Growth and yield
models based on these SI models are used to forecast rates and patterns of stand
development over long periods.
The climate is changing and is predicted to be generally warmer and more
variable, with more frequent and longer hot periods in summer and cold periods in
winter. Similarly, precipitation extremes are projected to become more frequent.
Anticipated changes in Ontario’s climate repudiate reliance on static SI curves even
further. Summer temperatures for 2071–2100 predicted using one of the scenarios
approved by the Intergovernmental Panel on Climate Change that is based on
projections of changes in human population and greenhouse gas concentrations in the
atmosphere indicate Ontario summer temperatures may rise by 3 to 6 °C by the end of
the 21st century, with more pronounced differences in the north. These changes are
likely to significantly affect tree growth rates.
Including climate variables in SI models will not only make them more realistic but
will add dynamic predictive abilities to the models in which they are used such as
benchmark yield curves, density management diagrams, and tree-scale models such as
FVSOntario. Sharma et al. (2015) analyzed climate effects on site productivity of jack pine
(Pinus banksiana) and black spruce (Picea mariana) plantations and reported that
projected changes in climate would reduce site productivity of both species, with greater
effects on black spruce than jack pine. Similarly, Sharma and Parton (2018a, b)

Climate Change Research Report CCRR-49 2
examined climate effects on site productivity of red pine (Pinus resinosa) and white
spruce (Picea glauca) plantations. They found that warming climate would negatively
affect the site productivity of both species, with effects more pronounced in southern
than northern Ontario for red pine and more in eastern than western and southern
Ontario for white spruce.
The objectives of this study were to investigate the effects of climate on the SI of
white pine (Pinus strobus) plantations, and to develop base-age invariant stand
height/SI models that directly incorporate site and climate variables to improve model
predictions and explore the effect of a changing climate on stand height and associated
SI.
2.0 Methods
2.1 Height and age data Data used to develop the site index models were collected from plantation-grown
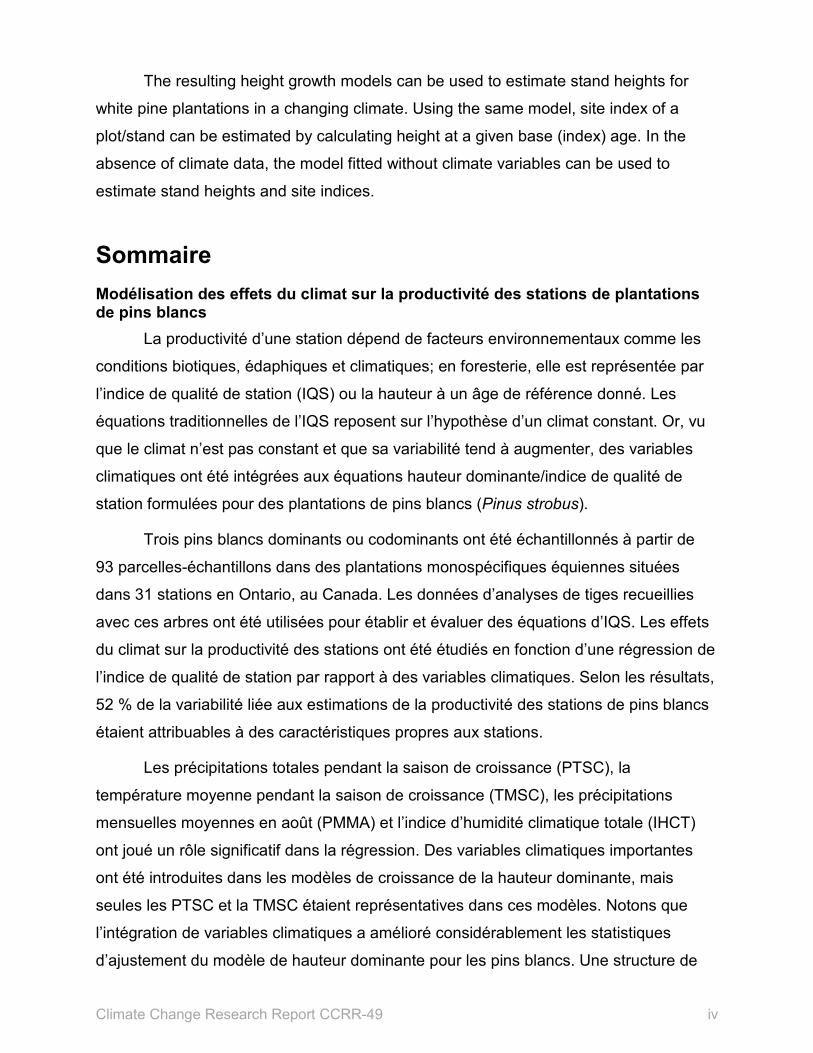
white pine trees. Thirty-one even-aged monospecific plantations were sampled from
across the species’ range in Ontario (Figure 1). At each plantation, three 100 m2 circular
temporary sample plots were established. In each plot, 1 planted largest diameter (at
breast height) non-veteran tree that did not exhibit visible deformities, such as forks,
major stem injuries, dead or broken tops, was selected and sampled. From each
sampled tree, disks were cut at 0.15, 0.5, 0.9, and 1.3 m from ground level. The
remaining height of the tree (between breast height and tip) was then divided by 10 and
disks were cut at the resulting interval to yield 13 disks per tree.
Each sampled tree and disk was assigned a unique code. All disks from a tree
were placed in a large breathable bag, transported, and stored at -10 °C until 24 hours
before they were prepared for analysis, which involved sanding the surface of the disk.
At time of analysis, geometric mean radius (r) was calculated from the diameters
obtained from the major (r1) and minor (r2) axes on each disk (i.e., r = (r1.r2)0.5). On each
section, 2 radii matching this geometric mean were located and marked. All
measurements were to the inner bark. All disks were scanned and the resulting images
Climate Change Research Report CCRR-49 3
saved at a minimum resolution of 720 dpi. Using WINDENDROTM software, images were
analyzed for diameter growth and ring number along the radii marked from the pith.
Figure 1. Distribution of white pine plantations sampled across Ontario, Canada. Models were developed using data from sites marked by all circles (green and red) and evaluated using that from sites marked by red circles.
Height of each tree at a given age along the bole was determined using Graves’
(1906) method, which Subedi and Sharma (2010) reported as more accurate than other
available methods for identifying where annual height growth ended. Annual height
growth was then calculated for each tree. Observed stand heights and ages were
plotted to form height-age curves for each tree. These curves were inspected for

Climate Change Research Report CCRR-49 4
indications of early height growth suppression, top breakage, or dieback. None of the
trees sampled showed any defects so data from all 93 trees was analyzed. To avoid the
erratic height growth that often occurs before trees reach breast height, height above
breast height and breast height age (BHA) were used in this study. Therefore, unless
otherwise specified, reported heights and ages refer to stand heights from breast height
and BHA, respectively.
To obtain site-scale observations of stand height, growth series from each plot
were averaged to provide a mean plot growth curve. For plots that contained trees of
different ages, series were truncated to the age of the youngest tree. This resulted in 31
total height-age series. For each series, average height was calculated at every 5-year
non-overlapping interval starting at age 1 (from breast height) to minimize serial
autocorrelation among observations and measurement errors in the ring data. Similarly,
site index was calculated as the average height of 3 dominant/codominant trees
sampled from a site at BHA 25 years. Summary statistics of sampled trees used in this
study are presented in Table 1.
Table 1. Summary statistics (N = number of samples; SD = standard deviation) for total age, total height, breast height age (BHA), site index (SI), growing season total precipitation (GSTP), growing season mean temperature (GSMT), August mean monthly precipitation (AugMMP) and total climatic moisture index (TCMI) for white pine trees from Northern Ontario, Canada, used in this study.
Variable N Mean SD Min Max Total age (year) 93 61.37 17.18 26 90 Total height (m) 93 22.63 5.84 10.25 37.60 BHA (year) 93 56.45 17.30 21 87 SI (m) 29 10.50 2.29 6.85 15.85 GSTP 31 500.56 50.86 366.45 577.53 GSMT 31 13.78 0.54 12.62 15.13 AugMMP 31 78.45 4.05 69.92 84.68 TCMI 31 32.18 8.65 14.99 47.69

Climate Change Research Report CCRR-49 5
2.2 Climate data None of the sample plots were near weather stations. Therefore, Canadian climate
models (McKenney et al. 2011) were used to estimate a suite of climate variables for
each plot location. These models were generated from continuous climate grids using
ANUSPLINE based on corrected Canadian weather station data (Mekis and Vincent
2011, Vincent et al. 2012), which includes many stations in Ontario. Estimates of long-
term average values of these variables at each plot location were calculated for the
period of tree growth (from the year when the sampled trees reached breast height to
2015).
A total of 68 variables were calculated, including mean, minimum, and maximum
air temperatures and total precipitation, estimated for each month of the year, for each
quarter (consecutive 3-month periods), and annually. As well, climate data included
estimates for start, end, and length of the growing season and the sum of growing
degree days using a base temperature of 5 °C. Growing season was defined as the
length of time between the day after March 1 when mean daily temperature was ≥5 °C
for 5 consecutive days and the day after August 1 when minimum daily temperature
was ≤-2 °C. The 68 variables also included 3 site related ones (longitude, latitude, and
elevation).
In addition to the climate variables, climatic moisture index (CMI), obtained by
subtracting monthly potential evapotranspiration (PET) from mean monthly precipitation
(MMP) (see Hogg 1994), was estimated for each month for each year. Total climatic
moisture index (TCMI) was then calculated by summing the 12 month values of CMI for
each year for each site. Estimates for all climate variables were provided by Dan
McKenney (Canadian Forest Service, 2018, pers. comm.).
2.3 Effects of climate on site productivity
Climatic effects on site productivity were determined by regressing SI against
climate variables. The stepwise regression method was applied in SAS (SAS Institute
Inc. 2004) using FORWARD, BACKWARD, and MAXR (maximum R2) selection criteria
to examine the importance of each site and climate variable in the regression. However,
BACKWARD selection resulted in better fit statistics than other criteria. Given the limited
Climate Change Research Report CCRR-49 6
number of SI values (29) as trees from 2 sites were younger than 25 BHA, climate data
was grouped into site, periodic temperature, periodic precipitation, monthly temperature,
and monthly precipitation related variables. Site index was regressed against the site
and climate variables within a group and significant variables from each group were
pooled. Finally, SI was regressed against pooled site and climate variables.
2.4 Stand height/site index models
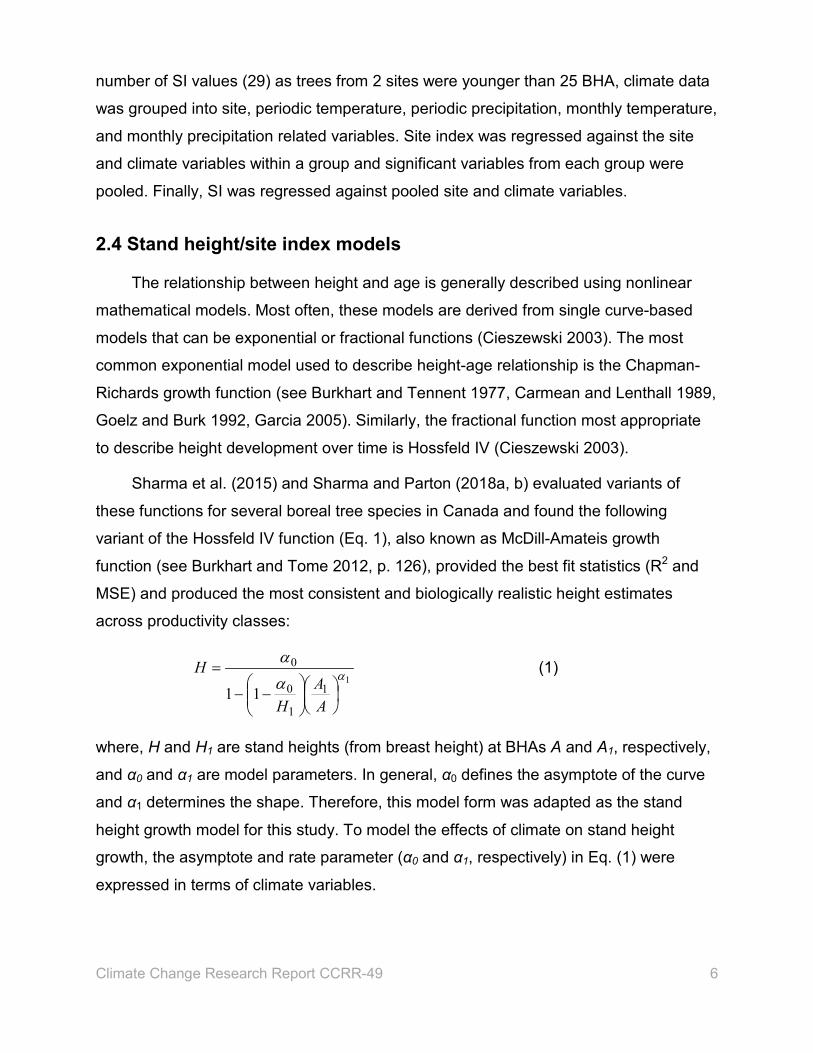
The relationship between height and age is generally described using nonlinear
mathematical models. Most often, these models are derived from single curve-based
models that can be exponential or fractional functions (Cieszewski 2003). The most
common exponential model used to describe height-age relationship is the Chapman-
Richards growth function (see Burkhart and Tennent 1977, Carmean and Lenthall 1989,
Goelz and Burk 1992, Garcia 2005). Similarly, the fractional function most appropriate
to describe height development over time is Hossfeld IV (Cieszewski 2003).
Sharma et al. (2015) and Sharma and Parton (2018a, b) evaluated variants of
these functions for several boreal tree species in Canada and found the following
variant of the Hossfeld IV function (Eq. 1), also known as McDill-Amateis growth
function (see Burkhart and Tome 2012, p. 126), provided the best fit statistics (R2 and
MSE) and produced the most consistent and biologically realistic height estimates
across productivity classes:
11
1
0
0
11αα
α
−−
=
AA
H
H (1)
where, H and H1 are stand heights (from breast height) at BHAs A and A1, respectively,
and α0 and α1 are model parameters. In general, α0 defines the asymptote of the curve
and α1 determines the shape. Therefore, this model form was adapted as the stand
height growth model for this study. To model the effects of climate on stand height
growth, the asymptote and rate parameter (α0 and α1, respectively) in Eq. (1) were
expressed in terms of climate variables.

Climate Change Research Report CCRR-49 7
2.5 Model fitting and evaluation
Stem analysis was used to acquire the data used in this study. To obtain height-
age series for a site, multiple measurements were made on individual sample trees,
resulting in hierarchical data sets (i.e., height-age series within sites). This resulted in 2
sources of variation: among sites and within a site. Observations among sites are
independent but observations within a site (height-age series) are dependent
(correlated) as they originate from the same trees. Within a sampling unit, mixed-effects
modelling (Meng et al. 2009; Subedi and Sharma 2011, 2013), correlation structure
(Diéguez-Aranda et al. 2006), or a combination of both approaches (Trincado and
Burkhart 2006, Subedi and Sharma 2013) can be used to address the autocorrelation
problem.
NLINMIX macro in SAS was used to fit Eq. (1) to the data with 2 random effects
parameters associated with the asymptote and the rate parameter first. To address
problems associated with autocorrelation, the model was fitted using the covariance
structure AR(1). Climate and site related variables were then introduced sequentially
from each group. Initially, all precipitation-related variables were introduced into the
model one by one. The variable that was significant (alpha=0.05) and resulted in the
best fit was selected as the first climate (precipitation) variable to be included in the
model.
All temperature-related variables were then introduced into the model one by one
in the presence of the first climate (precipitation) variable. The one that was significant
and resulted in the least AIC value was selected as the second climate (temperature)
variable to be incorporated. All other climate and site variables, including quadratic
transformations and 2-way interactions, were introduced one by one in the presence of
the first 2 variables. The climate and site variables selected were those that were both
significant and improved model fit.
Random effects parameters were added sequentially to the fixed-effects
coefficients of climate variables as necessary. The model with random effects was
evaluated based on goodness-of-fit criteria such as log-likelihood (twice the negative
log-likelihood) ratio, assessment of model residuals, and Akaike’s Information Criterion

Climate Change Research Report CCRR-49 8
(AIC) (Akaike 1978). The model with the smallest goodness-of-fit value was considered
best. The structure that resulted in the smallest value of AIC was used in the final
model. To check for possible heteroscedasticity, estimates of residuals (observed −
predicted) from stand height growth were calculated (with the covariance structure in
the model) for all 5-year growth periods for each growth series and plotted against
predicted stand height growth.
Climatic effects on future stand height growth were evaluated by estimating stand
heights of white pine trees using the model with climate variables for 4 areas (the
middle (near Hearst) and the most eastern (near Ottawa), southern (near Chatham),
and western (near Kenora) parts of Ontario where the trees were sampled (shown in
Figure 1) under 2 emissions trajectories (2.6 and 8.5 Watts m-2). These trajectories,
known as representative concentration pathways (RCPs), produce different levels of
warming at the end of the century using the Canadian model (McKenney et al. 2011,
2013). The projected values of climate variables (from McKenney et al. 2013) that were
significant in expressing the asymptote and rate parameter in Eq. (1) were used in
evaluating climate effects. Height growth curves were generated for the 60-year growth
period (2021–2080).
3.0 Results Parameter estimates for Eq. (1) fitted using NLINMIX macro in SAS are displayed
in Table 2. Random effects parameters were not significant. Therefore, the model was
fit only with AR(1) covariance structure. The model fit the data well but does not include
climate variables.
To examine the effects of climate on site productivity, the site index (SI) was
regressed against 35 site and climate variables along with their quadratic and
exponential transformations and interactions using stepwise regression analysis in SAS.
Four climate variables: wettest period mean temperature (WPMT), precipitation of
wettest quarter (PWQ), August mean monthly precipitation (AugMMP), and total climatic
moisture index (TCMI) explained 65% of variability in SI. However, PWQ and TCMI
were highly correlated (correlation coefficient = 0.943) and the variance inflation factor

Climate Change Research Report CCRR-49 9
(VIF) associated with PWQ was 10.48. A variable with VIF greater than 10 is assumed
to be highly influential in the regression. As a result, interpretation of the regression
coefficients could be misleading. Therefore, climate variables that were not severely
correlated but can explain the variation in SI were investigated.
Table 2. Parameter estimates, standard errors (SE), and fit statistics (MSE (σe2), twice
the negative log-likelihood (-2ln(L)), Akaike’s Information Criterion (AIC), and autocorrelation (ρ) for the model without climate variables (Eq. 1) for white pine trees from Northern Ontario, Canada. (N/A = not applicable)
Parameters Estimates SE
α0 89.0296 8.3753
α1 1.0362 0.0243
σe2 2.4807 N/A
-2Ln(L) −11536.5 N/A
AIC −11540.5 N/A
ρ 0.7354 N/A
R2 0.9608 N/A
The best model found to express SI for white pine plantations in terms of climate
variables that were not highly correlated was:
𝑆𝑆𝑆𝑆 = 𝑎𝑎0 + 𝑎𝑎1 𝐺𝐺𝑆𝑆𝐺𝐺𝐺𝐺 + 𝑎𝑎2 𝐺𝐺𝑆𝑆𝐺𝐺𝐺𝐺 + 𝑎𝑎3 𝐴𝐴𝐴𝐴𝐴𝐴𝐺𝐺𝐺𝐺𝐺𝐺 + 𝑎𝑎4 𝐺𝐺𝑇𝑇𝐺𝐺𝑆𝑆 + 𝜀𝜀 (2)
where,
GSTP = growing season total precipitation,
GSMT = growing season mean temperature,
𝑎𝑎0 - 𝑎𝑎4 are regression parameters, ε is the error term, and other variables are as defined
earlier. All climate variables were significant (p < 0.05) in the regression and explained
more than 52% of the variability in SI (Table 3). These variables were not highly

Climate Change Research Report CCRR-49 10
correlated (highest value of the correlation coefficient was 0.68 between GSTP and
TCMI and of VIF was 7.608 for GSTP).
These results indicated that the SI of white pine stands is significantly affected by
climate. However, as adjacent sites in the same climate zone could have different site
productivity, climate variables are not the only drivers of site productivity. Therefore, a
model for stand height growth/site index with parameters expressed in terms of climate
variables would be more appropriate to determine site productivity in a changing
climate. As a result, the asymptote and rate parameter (α0 and α1, respectively) in Eq.
(1) were expressed in terms of climatic variables.
Table 3. Parameter estimates, standard errors (SE), and fit statistics including mean square error (MSE), and variance inflation factor (VIF) for site index (SI) expressed in terms of climate variables (Eq. 2) for white pine trees from Northern Ontario, Canada. (N/A = not applicable)
Parameters Estimates SE t-value p-value VIF 𝑎𝑎0 -22.3616 7.5242 -2.97 0.0039 0
𝑎𝑎1 0.0218 0.0098 2.22 0.0296 7.6080
𝑎𝑎2 0.9093 0.4114 2.21 0.0297 3.7215
𝑎𝑎3 0.1851 0.0385 4.80 <0.0001 2.1016
𝑎𝑎4 -0.1591 0.0391 -4.07 0.0001 4.2364 R2 0.5276 N/A N/A N/A N/A
Adj. R2 0.5033 N/A N/A N/A N/A MSE 3.2016 N/A N/A N/A N/A
Climate variables that explained significant (alpha=0.05) variation in height growth
of dominant and co-dominant white pine trees were growing season total precipitation
(GSTP) and growing season mean temperature (GSMT). Other climate variables that
were significant in the SI regression were not significant in the presence of GSTP and
GSMT. However, both parameters could not be expressed in terms of both climate
variables. The asymptote and the rate parameter expressed as a linear function of
GSTP and GSMT, respectively, resulted in the best model. Therefore, the model form
that included climate variables was:
Climate Change Research Report CCRR-49 11
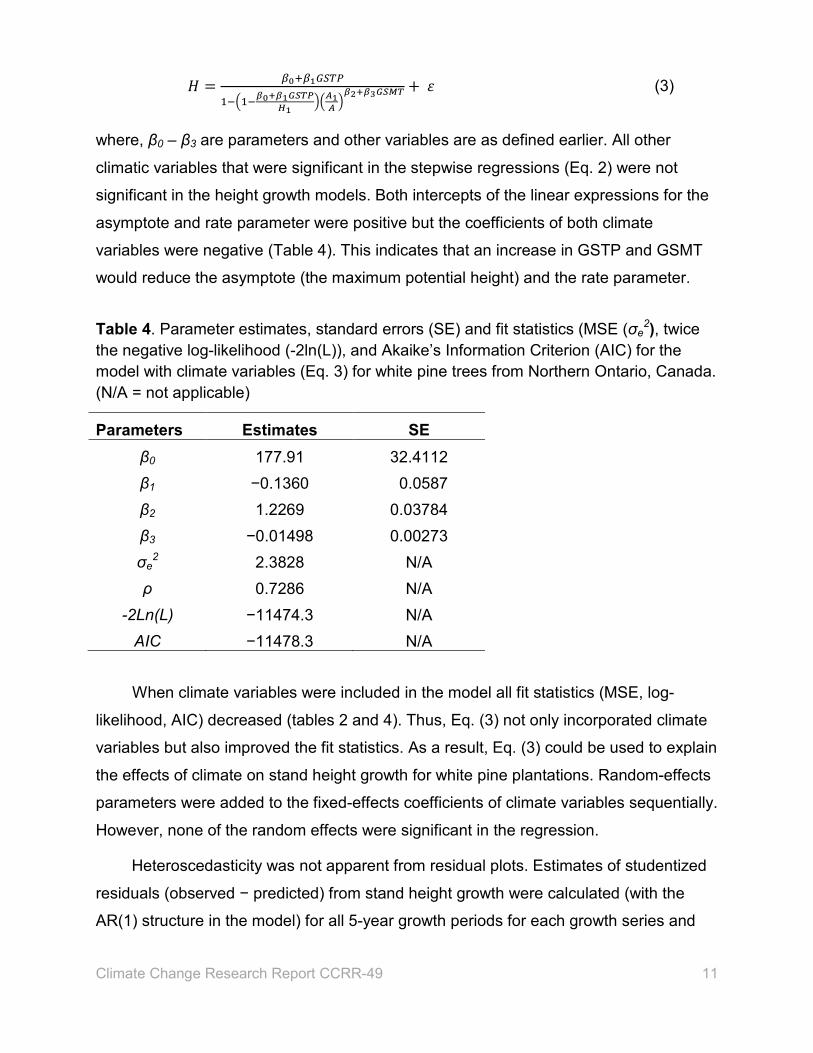
𝐻𝐻 = 𝛽𝛽0+𝛽𝛽1𝐺𝐺𝐺𝐺𝐺𝐺𝐺𝐺
1−�1−𝛽𝛽0+𝛽𝛽1𝐺𝐺𝐺𝐺𝐺𝐺𝐺𝐺𝐻𝐻1��𝐴𝐴1𝐴𝐴 �
𝛽𝛽2+𝛽𝛽3𝐺𝐺𝐺𝐺𝐺𝐺𝐺𝐺 + 𝜀𝜀 (3)
where, β0 – β3 are parameters and other variables are as defined earlier. All other
climatic variables that were significant in the stepwise regressions (Eq. 2) were not
significant in the height growth models. Both intercepts of the linear expressions for the
asymptote and rate parameter were positive but the coefficients of both climate
variables were negative (Table 4). This indicates that an increase in GSTP and GSMT
would reduce the asymptote (the maximum potential height) and the rate parameter.
Table 4. Parameter estimates, standard errors (SE) and fit statistics (MSE (σe2), twice
the negative log-likelihood (-2ln(L)), and Akaike’s Information Criterion (AIC) for the model with climate variables (Eq. 3) for white pine trees from Northern Ontario, Canada. (N/A = not applicable)
Parameters Estimates SE β0 177.91 32.4112 β1 −0.1360 0.0587 β2 1.2269 0.03784 β3 −0.01498 0.00273 σe
2 2.3828 N/A ρ 0.7286 N/A
-2Ln(L) −11474.3 N/A AIC −11478.3 N/A
When climate variables were included in the model all fit statistics (MSE, log-
likelihood, AIC) decreased (tables 2 and 4). Thus, Eq. (3) not only incorporated climate
variables but also improved the fit statistics. As a result, Eq. (3) could be used to explain
the effects of climate on stand height growth for white pine plantations. Random-effects
parameters were added to the fixed-effects coefficients of climate variables sequentially.
However, none of the random effects were significant in the regression.
Heteroscedasticity was not apparent from residual plots. Estimates of studentized
residuals (observed − predicted) from stand height growth were calculated (with the
AR(1) structure in the model) for all 5-year growth periods for each growth series and

Climate Change Research Report CCRR-49 12
plotted against predicted stand height growth (not shown). Trends in error structure did
not suggest autocorrelation or heteroscedasticity. The first order autoregressive
autocorrelation structure (ρ) indicated that model error terms were positively correlated
with the residual of the prediction from the previous period.
Equation (4) was further evaluated by calculating bias. For each height and age
class, residuals (observed − predicted) from height predictions were obtained and bias
(average residual) and its standard deviation were calculated (Table 5). Bias and its
standard deviation in estimating stand height across both classes (height and age)
depended on height and age classes; bias was slightly higher for small and young trees
than for taller and older trees.
Table 5. Bias (observed – predicted) and its standard deviation (SD), and minimum and maximum of the residuals for height class and age class that resulted from fitting Eq. (3) for white pine trees in Northern Ontario, Canada.
Height class (m) N Bias SD Min Max 0–5 55 −0.1484 0.3511 −1.2602 0.5645
5–10 73 0.1261 0.3771 −0.9616 1.3097 10–15 70 0.1205 0.3593 −0.9532 1.1539 15–20 60 0.0506 0.5372 −2.4535 0.9292 20–25 41 0.0575 0.4055 −0.7689 1.1079
>25 17 −0.0422 0.3031 −0.5270 0.8586 Age class (yr) N Bias SD Min Max
<10 29 −0.2812 0.3928 −1.2602 0.5645 10–20 60 0.0483 0.3586 −0.9616 1.3097 20–30 59 0.1340 0.3177 −0.5529 0.8308 30–40 55 0.0662 0.4561 −0.9532 1.1539 40–50 46 −0.0002 0.5090 −2.4535 0.8463 50–60 30 0.0448 0.3743 −0.5365 0.6810 60–70 20 0.2487 0.4443 −0.3772 1.1079
>70 17 0.0911 0.2431 −0.1633 0.8433
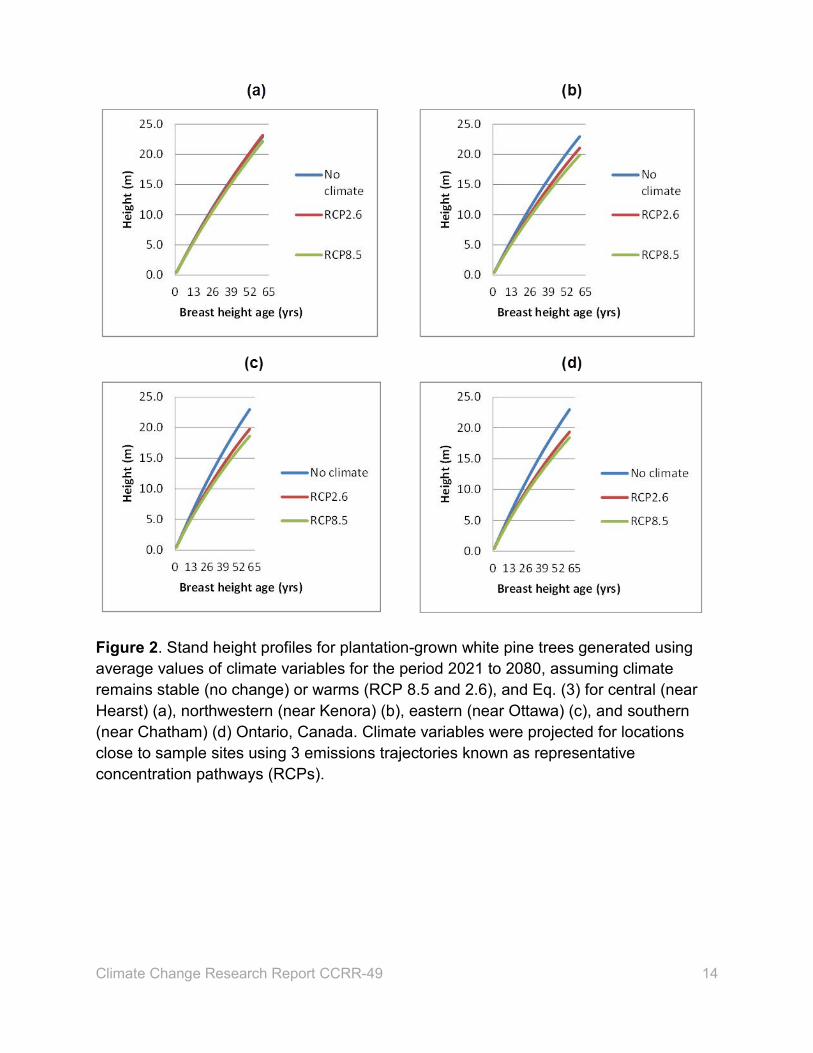
To predict future stand height growth under a changing climate, white pine stand
heights were estimated using Eq. (3) for 4 areas in Ontario under 2 emissions
trajectories (Figure 2), using climate projections from a Canadian climate model

Climate Change Research Report CCRR-49 13
(McKenney 2013). These trajectories are known as representative concentration
pathways (RCPs), referring to the level of heat produced at the end of the century (8.5
and 2.6 Watts m-2). Average height at BHA 1 year (0.44 m) was used as the initial
height for generating height-age curves. Average values of 2 climate variables (GSTP
and GSMT) were calculated for the 60-year growth period (2021–2080) and used to
estimate future stand heights for both climate scenarios. For the same period, stand
heights were estimated using the model fitted without climate variables. As illustrated in
the figure, for both climate scenarios, stand height growths at age 60 are slower relative
to those for no climate change scenario except in the centre of Ontario.
Under RCP 2.6, height growth was not affected by climate change for plantations
in the centre of Ontario and the difference in height growth between the no climate
change and the RCP 8.5 scenario at the end of growth period was very small (3.4%).
For other areas, height growth was reduced under both climate scenarios. The
difference in height growth between the RCP scenarios was less pronounced than that
between the no climate change and the RCP scenarios for all areas. Under the climate
change scenarios, height growth decreased from the outset. The least and the most
pronounced differences in height growth were in western and southern Ontario,
respectively. At age 60, stand heights in the west were shorter by 8.3% and 13.3%, for
RCP 2.6 and 8.5 scenarios, respectively, relative to those for the no climate change
scenario. Similarly, stand heights in the south were shorter by 15.8% and 19.75% under
the RCP 2.6 and 8.5 scenarios, respectively, relative to the no climate change scenario.
Finally, stand height over age curves were generated using Eq. (1) for the
observed range of site productivity of white pine stands (Figure 3). To generate these
curves, stand heights at the index age of 25 years were used as site indices. These
curves were very consistent and realistic across all productivity classes.
Climate Change Research Report CCRR-49 14
Figure 2. Stand height profiles for plantation-grown white pine trees generated using average values of climate variables for the period 2021 to 2080, assuming climate remains stable (no change) or warms (RCP 8.5 and 2.6), and Eq. (3) for central (near Hearst) (a), northwestern (near Kenora) (b), eastern (near Ottawa) (c), and southern (near Chatham) (d) Ontario, Canada. Climate variables were projected for locations close to sample sites using 3 emissions trajectories known as representative concentration pathways (RCPs).

Climate Change Research Report CCRR-49 15
Figure 3. Stand height/site index (SI) profiles generated using Eq. (1) for the range of site productivity of plantation-grown white pine trees in Northern Ontario, Canada.
4.0 Discussion As Clutter et al. (1983) stated, the productivity of a site depends on environmental
conditions (biotic, edaphic, and climatic) at a particular location. Similarly, Latta et al.
(2010) mentioned that forest productivity is directly influenced by changes in
temperature and precipitation regimes. Results from this study indicated that climate
variables (temperature and precipitation) are important in determining the productivity of
a site. To make them climate sensitive, these variables could be incorporated in existing
height growth models. This can be accomplished, at least in the McDill-Amateis growth
function, by expressing the parameters (often referred to as the asymptote and rate
parameter) in terms of climate variables.
The variation in stand height growth of white pine trees in this study could be
explained using the climate variables GSTP and GSMT. These variables are very
intuitive and can be easily interpreted when explaining the growth of any tree species.
0.0
5.0
10.0
15.0
20.0
25.0
30.0
35.0
40.0
45.0
0 20 40 60 80 100
Heig
ht (m
)
Breast height age (yrs)
SI=7
SI=9
SI=11
SI=13
SI=15

Climate Change Research Report CCRR-49 16
Including climate variables significantly improved the fit statistics of the stand height
growth model.
These results are consistent with findings of previous studies. For example, Wang
et al. (2007) and Bravo-Oviedo et al. (2008) reported that including climate variables
improved the fit and predictive accuracy of the model in their studies. Newton (2012)
reported that jack pine yields on low-to-medium quality sites would largely be unaffected
by climate change by the end of a 60-year growth period (2011–2070) but that, under
the B1 and A2 scenarios, the mean dominant height growth on good-to-excellent quality
sites would be reduced by 6.6% and 12%, respectively. Similarly, Sharma et al. (2015)
found that stand height growth of jack pine and black spruce trees would be reduced
under changing climate. They projected 16 and 28% reductions in height growth under
the A2 scenario for jack pine and black spruce, respectively, at age 30. Under the B2
scenario, reductions were 2% and 16% for jack pine and black spruce, respectively, at
age 30.
In other studies, Sharma and Parton (2018a, b) found that warming climate would
negatively affect the site productivity of red pine and white spruce, with effects more
pronounced in southern than northern Ontario for red pine, and in eastern more than
western and southern Ontario for white spruce. For red pine, stand heights in the
northeast were shorter by 10.8% and 12.5% under the 2.6 and 8.5 RCP scenarios,
respectively, than under the no climate change scenario at the end of 2011–2040
growth period. Similarly, stand heights in the south were shorter by 25.1% and 30.5%
under the 2.6 and 8.5 RCPs scenarios, respectively, than under the no climate change
scenario at the end of the same growth period.
For white spruce, stand heights were shorter in the south, east, and west by
43.8%, 38.2%, and 27.8%, respectively, under the 2.6 RCP relative to the no climate
change scenario at the end of 2041–2070 growth period. Similarly, stand heights were
shorter in the east, west, and south by 74.4%, 72.1%, and 64.6%, respectively, under
the 8.5 RCP relative to the no climate change scenario at the end of the same growth
period.
Climate Change Research Report CCRR-49 17
Similarly, Way and Sage (2008) conducted an experiment in 2004 and 2005 in
which black spruce was grown at low and high temperatures. They found that the
dominant height of black spruce grown under high temperature was shorter by 20%
compared to that of dominant trees grown under low temperature. Recently, more
studies have been published that report the effects of changing climate on the growth of
jack pine and black spruce trees (e.g., Huang et al. 2010, 2013; Subedi and Sharma
2013). However, since those studies were focused on radial rather than height growth,
the results are not directly comparable with those of this study.
With models developed by expressing SI directly in terms of climate variables,
Albert and Schmidt (2010) found that biophysical variables (latitude, longitude, soil, and
climate) explained 39 and 34% of the variability in SI for Norway spruce (Picea abies)
and common beech (Fagus sylvatica), respectively. Weiskittel et al. (2011) reported that
68% of the variability in SI was accounted for by variations in climate-related variables
across western U.S. forests. In this study, the coefficient of determination (R2) for the SI
model with climate variables (Eq. 2) was 52%.
Some of the white pine trees sampled for this study were as old as 87 years from
breast height. Even at this age, no trees showed any signs of senescence. Therefore,
the estimate for the asymptote (89.02 m) for the model without climate variables (Eq. 1)
seemed slightly higher than expected. In practice, the estimated asymptote, which is the
maximum potential height a tree could achieve, is never achieved. However, the stand
heights projected for a relatively poor and the best sites in this study (SI = 7 and 15 m,
respectively, at BHA 25 years) using Eq. (1) were 23.51 and 40.96 m, respectively, at
BHA 100 years. The projected heights at BHA 200 years at these sites were 37.75 and
56.63 m, respectively. According to Wikipedia, 57.55 m tall white pine trees have been
measured in North America east of the Rocky Mountains. Therefore, these projected
heights seemed to be reasonable estimates.

Climate Change Research Report CCRR-49 18
5.0 Conclusions The models developed here can be used to estimate stand height at any age,
given height at a point in time and relevant climate variables, and will support more
informed forest management decisions. In addition, since height estimated at the base
age will provide the site index value, the models can also serve as site index equations.
As well, when climate variables are unavailable, the equation fitted to height-age pair
data can be used as a stand height/site index equation for white pine plantations in
temperate forests.
Climate Change Research Report CCRR-49 19
6.0 Literature cited Akaike, H. 1978. A Bayesian analysis of the minimum AIC procedure. Annals of the
Institute of Statistical Mathematics. 30: 9–14. Albert, M. and M. Schmidt. 2010. Climate-sensitive modelling of site-productivity
relationships for Norway spruce (Picea abies (L.) Karst.). Forest Ecology and Management 259: 739–749.
Bravo-Oviedo, M. Tomé, F. Bravo, G. Montero and M. del Rio. 2008. Dominant height growth equations including site attributes in the generalized algebraic difference approach. Canadian Journal of Forest Research 38: 2348–2358.
Burkhart, H.E. and R.B. Tennent. 1977. Site index equations of radiata pine in New Zealand. New Zealand Journal of Forest Science 7: 408–416.
Burkhart, H.E. and M. Tome. 2012. Modeling Forest Trees and Stands. Springer, Dordrecht, NL. 457 p.
Carmean, W.H. and D.J. Lenthall. 1989. Height-growth and site index curves for jack pine in north central Ontario. Canadian Journal of Forest Research 19: 215–224.
Cieszewski, C.J. 2003. Developing a well-behaved dynamic site equation using a modified Hossfeld IV function Y3=(axm)/(c+xm-1), A simplified mixed-model and scant subalpine fir data. Forest Science 49: 539–554.
Clutter, J.L., J.C. Fortson, L.V. Pienaar, G.H. Brister and R.L. Bailey. 1983. Timber Management: A Quantitative Approach. Krieger Publishing Company, Malabar, FL.
Diéguez-Aranda, U, H.E. Burkhart and R.L. Amateis. 2006. Dynamic site model for loblolly pine (Pinus taeda L.) plantations in the United States. Forest Science 52: 262–272.
Garcia, O. 2005. Comparing and combining stem analysis data and permanent sample plot data in site index models. Forest Science 51: 277–283.
Goelz, J.C.G. and T.E. Burk. 1992. Development of well-behaved site index equations: jack pine in north central Ontario. Canadian Journal of Forest Research 22: 776–784.
Graves, H.S. 1906. Forest Mensuration. John Wiley & Sons, New York, NY. 458 p. Heath, L.S., M.C. Nichols, J.E. Smith and J.R. Mills. 2010. FORCARB2: An updated
version of the U.S. Forest Carbon Budget Model. U.S. Department of Agriculture, Forest Service, Northern Research Station. Newtown Square, PA: General Technical Report NRS-67. 52 p.
Hogg, E.H. 1994. Climate and the southern limit of the western Canadian boreal forest. Canadian Journal of Forest Research 24: 1835–1845.
Huang, J.G., J.C. Tardif, Y. Bergeron, B. Denneler, F. Berninger and M.P. Girardin. 2010. Radial growth response of four dominant boreal tree species to climate along a latitudinal gradient in the eastern Canadian boreal forest. Global Change Biology 16: 711–731.

Climate Change Research Report CCRR-49 20
Huang, J. G., Y. Bergeron, F. Berninger, L. Zhai, J.C. Tardif, and B. Denneler. 2013. Impact of future climate on radial growth of four major boreal tree species in the eastern Canadian boreal forest. PLoS ONE (8)2: e56758.
Kurz, W.A., C.C. Dymond, T.M. White, G. Stinson, C.H. Shaw, G.J. Rampley, C.E. Smyth, B.N. Simpson, E.T. Neilson, J.A. Trofymow, J.M. Metsaranta and M.J. Apps. 2009. CBM-CFS3: A model of carbon-dynamics in forestry and land-use change implementing IPCC standards. Ecological Modelling 220: 480–504.
Latta, G., H. Temesgen, D. Adams and T. Barrett. 2010. Analysis of potential impacts of climate change on forests of the United States Pacific Northwest. Forest Ecology and Management 259: 720–729.
McKenney, D. W., M.F. Hutchinson, P. Papadopol, K. Lawrence, J. Pedlar, K., Campbell, E. Milewska, R.F. Hopkinson, D. Price and T. Owen. 2011. Customized spatial climate models for North America. Bulletin of the American Meteorological Society 92: 1611–1622.
Mekis, É. and L.A. Vincent. 2011. An overview of the second generation adjusted daily precipitation dataset for trend analysis in Canada. Atmosphere-Ocean 49: 163–177.
Meng, S.X., S. Huang, Y. Yang, G. Trincado and C.L. VanderSchaaf. 2009. Evaluation of population-averaged and subject-specific approaches for modelling the dominant or codominant height of lodgepole pine trees. Canadian Journal of Forest Research 39: 1148–1158.
Newton, P. 2012. Simulating site-specific effects of a changing climate on jack pine productivity using a modified variant of the CROPLANNER model. Open Journal of Forestry 2(1): 23–32.
SAS Institute. 2004. SAS user guide. SAS Institute Inc. Cary, NC. Sharma, M. and J. Parton 2018a. Climatic effects on site productivity of red pine
plantations. Forest Science doi: 10.1093/forsci/fxy013 Sharma, M. and J. Parton 2018b. Analyzing and modelling effects of climate on site
productivity of white spruce plantations. Forestry Chronicle 93:173–182. Sharma, M., N. Subedi, M. Ter-Mikaelian and J. Parton. 2015. Modeling climatic effects
on stand height/site index of plantation-grown jack pine and black spruce trees. Forest Science 61: 25–34.
Subedi, N. and M. Sharma. 2010. Evaluating height-age determination methods for jack pine and black spruce plantations using stem analysis data. Northern Journal of Applied Forestry 27: 50–55.
Subedi. N. and M. Sharma. 2011. Individual-tree diameter growth model for black spruce and jack pine plantations in northern Ontario. Forest Ecology and Management 261: 2140–2148.
Subedi, N. and M. Sharma. 2013. Climate-diameter growth relationships of black spruce and jack pine trees in boreal Ontario, Canada. Global Change Biology 19(2): 505–516.

Climate Change Research Report CCRR-49 21
Trincado, G. and H.E. Burkhart. 2006. A generalized approach for modeling and localizing stem profile curves. Forest Science 52: 670–682.
Vincent, L.A., X.L. Wang, E.J. Milewska, H. Wan, F. Yang and V. Swail. 2012. A second generation of homogenized Canadian monthly surface air temperature for climate trend analysis. Journal of Geophysical and Atmospheric Research 117: D18110. doi: 10.1029/2012JD017859.
Wang, Y., V.M. LeMay and T.G. Baker. 2007. Modelling and prediction of dominant height and site index of Eucalyptus globulus plantations using a nonlinear mixed-effects model approach. Canadian Journal of Forest Research 37: 1390–1403.
Way, D.A. and R.F. Sage. 2008. Elevated growth temperatures reduce the carbon gain of black spruce [Picea mariana (Mill.) B.S.P]. Global Change Biology 14: 624–636.
Weiskittel, A.R, N.L. Crookston, and P.J. Radtke. 2011. Linking climate, gross primary productivity, and site index across forests of the western United States. Canadian Journal of Forest Research 41: 1710–1721.


(0.1k P.R., 18 10 02) ISBN 978-1-4868-2686-5 (print) ISBN 978-1-4868-2687-2 (pdf)


