Page 1
HERON Vol. 60 (2015) No. 1/2 93
Modelling mechanical and thermal performance of concrete products: A multi-level approach
Sandra Couto 1, André Assembleia 1, Jeanette Visser 2, Tiago Sotto Mayor 1, 3
1 CeNTI, Portugal
2 TNO, the Netherlands
3 EMPA, Switzerland
The performance of concrete products depends not only on the concrete compositions but also
on the dimensions and the environment they are placed in. Numerical simulations are
excellent tools to predict the performance of concrete products before actually making them
and thus serve as a tool for product design. The present numerical studies were focused,
firstly, on the prediction of the mechanical and thermal behaviour of concrete products when
applied in façade walls and, secondly, on the prediction of the energy efficiency of buildings
composed by such products.
Different concrete mixtures were considered, depending to their target application (blocks or
panels, e.g.). Façade walls were considered to be exposed to realistic weather conditions and
focus was put on the stresses resulting from thermal expansion. For the “house/building”
level, an energy efficiency analysis was performed for different types of buildings, which
were assumed to be exposed to typical cold winter and hot summer weather conditions. This
resulted in detailed information on the energy balance of the resulting structures such as
energy consumption with HVAC (heating, ventilating, and air conditioning) systems.
An integrated multi-level approach, from concrete components to building structures, was
developed, enabling to compare the performance of different concrete compositions.
Key words: Design, waste binder, waste aggregate, fresh concrete, finite element modelling,
FEM, energy efficiency, performance prediction, numerical simulation
Page 2
94
1 Introduction
Concrete is the most used building material in the world. Its constituents are widely
available and relatively cheap, and the concrete itself is durable and reliable [P.-C. Aı̈tcin,
2000; R. J. Flatt, N. Roussel, and C. R. Cheeseman, 2012]. The reliability stems from its
constant quality of performance that is assured by building codes such as EUROCODES.
With respect to the mechanical properties of concrete, the quality has been quantified by
means of the compressive strength class. All other mechanical properties have been linked
to this compressive strength by means of relationships developed on the basis of
experimental results (e.g. the relationship between tensile and compressive strength)
[J.H.M. Visser and A. V. Bigaj, 2014; M. N. Hassoun and A. Al-Manaseer, 2012; EN 1992-1-
1:2004, 2004].
When non-traditional concrete compositions are considered, the well-known material
relationships in the building codes may not be applicable and thus may not be used a
priori. In order to obtain proof of suitability and develop guidelines for non-traditional
concretes and concrete products, their behaviour has to be tested and the relationships in
the codes either proved or adjusted (Visser and Bigaj, 2014). Prior to starting such a time-
consuming and often costly approval route, however, the suitability of the new materials
can be analysed already under the (environmental) loads they are required to serve. If
they prove to be unsuitable for an environment, then these can be excluded a priori,
reducing cost and time.
To accelerate the experimental stage and reduce the number of experiments further,
numerical simulations also can be used to study the suitability of different compositions
for the intended applications. In addition, product design (shape and dimension) can be
optimized according to the specifications. This produces, at early development stage,
information on the potential performance and limitations in real applications.
Under the aim of SUS-CON project1, different concrete mixtures were formulated targeting
four different products: blocks, panels for façades, floor and floor screed underlay [J. Visser
et al., 2015]. In the present paper, the performance of some products made of traditional
and non-traditional concrete exposed to realistic environmental conditions, is investigated.
The performance of the envisaged concrete products depends not only on their
composition but also on the dimensions and on the environment they are placed in. Thus,
1 SUS-CON: ‘SUStainable, innovative and energy-efficient CONcrete based on the integration of
all waste materials’, 7th Framework Programme Grant 285463, http://www.sus-con.eu
Page 3
95
three levels of numerical studies are performed. At the first level, the thermal and
mechanical behaviour of concrete products, such as blocks and panels for façades, are
analysed. Different concrete compositions are considered (by varying the material and
volume fraction of aggregate) while the heterogeneity of the material is taken into account
and stress distribution in mortar and aggregate particles is studied. At the second level, the
mechanical and thermal performance of elements (façade walls) is assessed. At this level,
the material is considered homogeneous and attention is focused on the response of the
walls to time-varying external/ambient conditions. Finally, at the third level, an energy
efficiency study is performed for houses/buildings composed by these elements and
products. The responses of different concrete products are discussed with reference to the
best performing concrete mixture in the environments considered.
2 Products: blocks and panels for façades
2.1 Average concrete properties based on its composition
The average properties of concrete mixtures used in the present analysis were obtained
based on the spatial arrangement and properties of their constituents (following the
method reported in Visser et al. [2015]). By taking into account the particle packing
structure of concrete, instead of considering it a homogeneous medium with average
properties, one obtains important information on weak points/zones that may be prone to
failure when products (blocks and panels, e.g.) are loaded, as well as detailed information
on the influence of particle packing structure on the overall performance of the final
concrete.
Two types of concrete were considered, i.e. a lightweight concrete composed by PUR (rigid
polyurethane) and a normal concrete composed by gravel. Both were composed by a
Portland cement mortar (CEM I 42.5 N). The properties of the mortar and aggregates used
in the concrete mixtures are shown in Table 1. Both combinations were simulated for 25 %
and 50 % coarse aggregate fractions. The particles diameters ranged from 4 to 8 mm and
finer aggregate particles were considered to be part of the fluid mortar, as explained in
Visser et al. (2015). Also, the interfacial transition zone (ITZ) between aggregate and matrix
was not modelled in the present approach.
Using the properties of Table 1 and information on the particle packing structure , the two
different types of aggregates at two volume fractions (25% and 50%), resulted in four
concrete mixtures with different average mechanical and thermal properties (Table 2)
Page 4
96
(following Hooke’s law and the method described in Visser et al. [2015] [J. H. M. Visser et
al., 2015] and He [2010] [H. He, 2010]).
The Young’s modulus and thermal conductivity values of the gravel are higher than those
of the mortar (Table 1). Thus, adding gravel in the mix results in a higher Young’s modulus
and a higher thermal conductivity (lower thermal insulation) of the concrete mixture. The
Table 1: Properties of the aggregates and mortar composing the concrete mixtures
Lightweight
concrete
Normal
concrete
Units Mortar:
CEM I 42.5 N
Aggregate:
PUR
Aggregate:
Gravel
Density (fresh) kg/m3 2257 - -
Density (hardened) kg/m3 2321 330 2620
Viscosity Pa s 120 - -
Yield stress Pa 16 - -
Coefficient of friction - - 1.5 0.6
Coefficient of restitution - - 1 1
Young’s modulus GPa 38.8 0.8 70.5
Poisson’s ratio - 0.19 0.3 0.22
Thermal conductivity W/(m K) 0.65 0.026 4.8
Specific heat capacity J/(kg K) 735 1450 790
Coef. Thermal expansion 1/K 1.30 10-5 5 10-6 1.17 10-5
Table 2: Calculated mechanical and thermal concrete properties of concrete mixtures under study
Properties Units Mix 1 Mix 2 Mix 3 Mix 4
Aggregate PUR PUR Gravel Gravel
Volume fraction of aggregate 0.25 0.50 0.25 0.50
Density kg/m3 1825 1325 2405 2485
Specific heat capacity J/(kg K) 767 824 750 764
Coef. thermal expansion 1/K 1.29 10-5 1.28 10-5 1.25 10-5 1.22 10-5
Young’s modulus GPa 18.1 3.4 44.4 57.0
Poisson’s ratio 0.25 0.23 0.20 0.15
Thermal conductivity W/(m K) 0.40 0.12 0.962 2.05
Page 5
97
more gravel is added, the higher this difference. Note that, for the two considered volume
fractions of aggregate (0.25 and 0.50), the mortar remains a continuous phase in the
material. The opposite change in properties can be observed when the aggregate is PUR
(whose Young’s modulus and thermal conductivity are lower than those of mortar, Table
1).
Although the average properties of the concrete mixtures are of main concern when
evaluating its average behaviour, the local stress distribution is also of high importance in
spotting high stress zones in the concrete products that may be prone to failure. Since the
Young’s modulus of gravel is higher than that of the mortar, it is expected that the
aggregate particles carry more stress than the mortar. In contrast, when concrete is
composed by PUR particles, it is expected that the stress is mainly carried by the stiffer
mortar matrix. The local stress distribution in blocks and panels made of the four concrete
mixtures and the consequences for failure are discussed next.
2.2 Load bearing capacity of blocks and panels
Under the aim of SUS-CON project, different concrete mixtures, composed by non-
traditional aggregates and mortars, were formulated targeting different non-structural
products. On this basis, the simulated application for the blocks made of the mentioned
concrete mixtures (Table 2) is part of a non-structural wall (2.7 m high), positioned in the
bottom and carrying the weight of the wall (Figure 1). The panel (1.5 m high) was
considered to bear its own weight and the weight of another panel; in total this yields a 3
m high wall. The simulation domain included only the bottom part of the panel (Figure
1b), which is where higher stresses are expected, being the effect of the remaining part of
the wall considered as a load (Figure 1d), following the procedure used for the block made
wall. This allowed to minimize the computational cost without jeopardizing the
representativeness of the results.
The geometry of blocks and panels depends not only on their size (Figure 1) but also on the
simulated particle packing (Figure 2). Thus, meshes with 530 and 817 thousand triangular
elements were used.
No external loads (such as wind loads) were considered except temperature load. The
temperature was, on the inside of the wall, 21 ºC, being a comfortable temperature for
living. On the other side, a temperature of -2 ºC was considered as average minimum
monthly winter temperature, used in the climate simulation in section 3.
A summary of the simulated boundary conditions and geometries of panels and blocks is
shown in Figure 1.
Page 6
98
Figure 1: 2D Geometries of simulation domains and corresponding mechanical and thermal
boundary conditions (BC) (heightwall is 2.7 m for blocks made wall and 3 m for panels made wall)
The thermal expansions were taken proportional to the temperature change in relation to a
reference temperature (20 ºC), taken as the reference temperature for which the products
are considered to be in normal shape, i.e. stress-free with respect to the temperature [H.
Czichos, T. Saito, and L. R. Smith, 2006].
Two-dimensional simulations were performed on the cross-sections of blocks and panels
as shown in Figure 1, based on a plane strain assumption.
The failure criteria based on the maximum principal stress theory is suited to brittle
materials, such as concrete [E. Zahavi and D. M. Barlam, 2000]. Thus, the principal stresses
were analysed and the stress distribution for each considered cross-section of concrete
Page 7
99
products is shown in Figure 2 (first principal stress, corresponding to tensile stress) and
Figure 4 (third principal stress, corresponding to compressive stress). In Figure 3a and b, a
zoom-in is made on the stress values shown in Figure 2 and the colour range is focused on
an interval of tensile stress starting from -0.1 and -10 MPa, respectively, instead of 0 MPa.
Blocks Mix 1 Mix2 Mix 3 Mix 4
max. 50 MPa 30 40 90
Panels Mix 1 Mix2 Mix 3 Mix 4
max. 35 MPa 25 30 50
Figure 2: First principal stress (tensile stress) distribution in the cross-sections of blocks and panels,
for each concrete mixture, at the steady-state heat transfer (left = -2 ºC and right = +21 ºC) and
considering the wall self-weight (colour figures are available at www.heronjournal.nl)
-0.1
0.1
0.0
a) Mix 2 blocks b) Mix 4 blocks
Figure 3: Detail of Figure 2 with different scale ranges focusing positive and negative first principal
stress, showing, respectively, tension and compression zones
0
15
MPa
MPa
MPa
MPa
Page 8
100
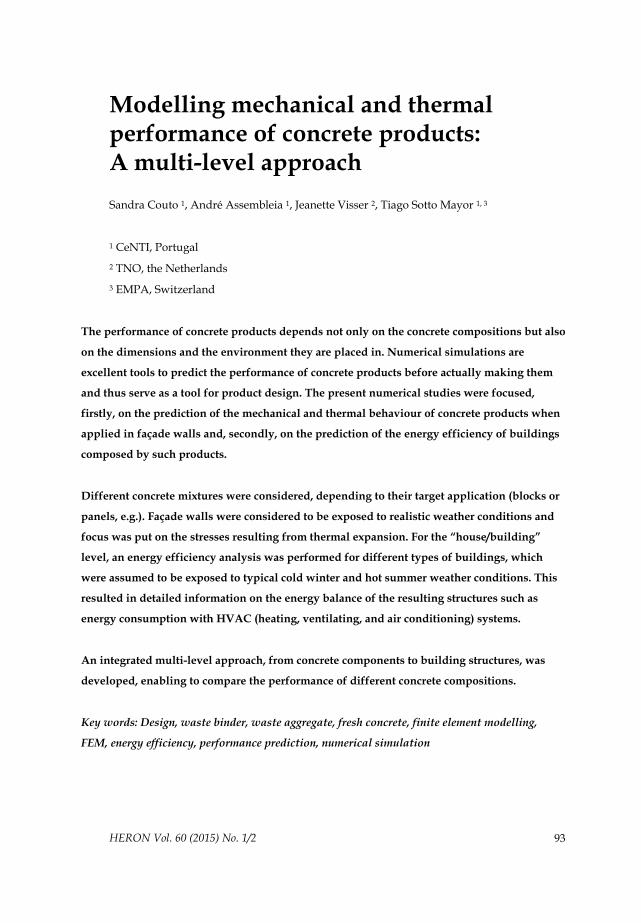
Blocks Mix 1 Mix 2 Mix 3 Mix 4
max. 23 MPa 24 6 11
Panels Mix 1 Mix 2 Mix 3 Mix 4
max. 15 MPa 16 5 13
Figure 4: Third principal stress (compressive stress) distribution in the cross-sections of blocks and
panels, for each concrete mixture, at the steady-state heat transfer (left = -2 ºC and right = +21 ºC)
and considering the wall self-weight
The stress differences in the concrete products of Figure 2 are mostly due to the thermal
expansion and thus mostly show a horizontal distribution. The expansion/shrinking is
larger at the outside wall (at -2 ºC), as it has been taken linearly varying with the
temperature change relative to 20 ºC, i.e. its stress-free reference temperature. Since near
the colder boundary the temperature is lower than the reference value, considerable
shrinking occurs, resulting in a stress distribution near this boundary (Figure 2).
The thermal expansion coefficient of PUR is slightly less than half of that of the mortar,
meaning that their thermal shrinkage is affected by the higher thermal shrinkage of the
mortar matrix. Moreover, the degree of shrinkage varies horizontally with the temperature
prevailing across the wall thickness, which adds to the effects of the different deformations
experienced by the materials in question and imposed loading conditions. Therefore,
different conditions affect the particles throughout the structure. For the case of PUR-based
mixtures (Mix 1 and 2), this results in some particles experiencing very slight compression
0
3 MPa
MPa
Page 9
101
(e.g. towards the cold outside wall, Figure 3a) and others experiencing very slight tension
(e.g. towards the centre-right and lower portions of the wall, Figure 3a). For the case of
gravel-based mixtures (Mix 3 and 4), this results in particles experiencing mostly tension
(Figure 2 and Figure 3b). Near the inside boundary (at 21 ºC), a very slight expansion
occurs although at 1 ºC difference with the stress-free condition (20 ºC), the expansion-
related stresses are negligible.
Overall, in Figure 2 and Figure 3, it can be seen that the PUR aggregates in Mix 1 and Mix 2
remain almost stress-free. The Young’s modulus (0.8 MPa) and the bulk modulus (at this
Poisson’s ratio) of the PUR aggregates are very small. Thus, regarding stress-bearing
capacity, PUR aggregates act quite like air, carrying hardly any stress. In such cases (Mix 1
and Mix 2), the stresses are mainly carried by the matrix (because the mortar is stiffer than
the aggregates). Moreover, as expected, for Mix 3 and Mix 4, the aggregate particles carry
more stress than the matrix, because gravel is stiffer than mortar.
Superimposed to the above mentioned expansion/shrinking effects, there are the stresses
due to the self-weight/weight of the wall. As this is a vertical, gravity-based load, the
highest stresses can be found at the bottom, as shown by the compressive stress
distribution, in Figure 4 . The results are stress concentrations in the lower left corners of
the walls.
Mix 4 is equivalent to normal concrete, made of gravel and Portland cement. Thus, if a
typical compressive strength of 50 MPa is considered for this mixture, no compressive
failure is expected to occur for blocks and panels subjected to the present loading
conditions (Figure 4). In Visser et al. (2015), the compressive strength of a non-traditional
concrete mixture composed by 50% PU (such as the present Mix 2, although with a mortar
matrix of PFA instead of CEM) is reported as 5.6 MPa. Assuming that the compressive
strength of Mix 2 is similar to that of the mentioned mixture, then compressive failure is
expected to occur for blocks and panels made of Mix 2, under the present loading
conditions (Figure 4).
The tensile strength of normal concrete mixtures can be obtained, from compressive
strength, by applying known rules, as explained in Visser et al. (2015). Thus, for Mix 4 and
for a compressive strength of 50 MPa, a tensile strength of 4 MPa is obtained. For Mix 2
(non-traditional mixture), assuming again it is similar to the mixture (50% PU + PFA)
reported in Visser et al. (2015), a tensile strength of 0.9 MPa is considered. These tensile
strengths (0.9 MPa and 4 MPa for Mix 2 and Mix 4, respectively) are much lower than the
maximum obtained tensile stresses (Figure 2). Thus, for the present simulated loading
Page 10
102
conditions and assumed tensile strengths, tensile failure is expected to occur in blocks and
panels made of Mix 2 and Mix 4.
It is important to note that the studies performed are based on the assumption of linear
elastic behaviour of the materials which is considered reasonable until a stress, equivalent
to the strength of the material, is achieved. Beyond that, a non-linear study should be
performed in order to obtain more realistic stress and deformation distribution in the
structure.
3 Elements: Façade walls
In order to predict the behaviour of the previously studied products in real building
elements, when exposed to time-varying realistic weather conditions, the thermal
performance and stress distribution in simple layer structures (façade walls) were assessed
(by FEM), based on the average properties obtained in previous section 2.1 for each
mixture (Table 2).
3.1 Geometry and material properties
A simple façade wall, composed by a layer of Mix 2 (50% PUR) or Mix 4 (50% Gravel), was
considered, with a thickness of 0.20 m and height of 2.7 m. A mesh of triangular elements
was used to discretize the wall domain, with a total of 2 thousand elements. The materials
were considered to be linear elastic and the average properties of the mixtures were used
according to Table 2.
3.2 Boundary conditions
In order to simulate a wall exposed to realistic weather conditions, the clear-sky model
[ASHRAE, 2009] was applied for obtaining the outdoor environment conditions, taking
into account solar irradiance contribution and both radiative and convective heat transfer
between wall and environment . This model was applied for two different locations,
resulting in two outdoor scenarios: a hot summer (in Évora/Portugal: 14.5 – 26.6 ºC) and a
cold winter (in Bragança/Portugal: -1.6 – 4.4 ºC). Thermal comfort conditions were
assumed for indoor environment, i.e. a constant indoor air temperature of 21 ºC and
convective and radiant heat transfer between walls and indoor environment (see details in
Table A1).
Page 11
103
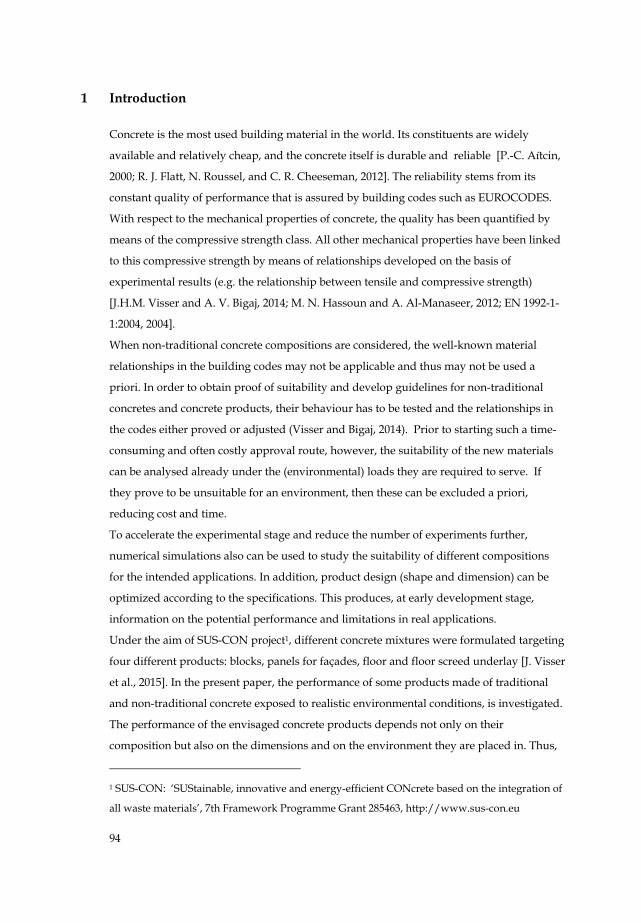
3.3 Thermal performance of façade walls
In the simulations of the façade walls, two thermal performance indicators have been
calculated: the thermal resistance (equation 1) and the thermal inertia (equation 2), the
latter giving an indication of the time-dependent behaviour of temperature, for the
boundary conditions discussed in section 3.2.
thermal resistance =thickness
thermal conductivity (1)
thermal inertia = × ×density thermal conductivity specific heat capacity (2)
The thermal resistance of a wall of Mix 2 is 1.67 m2K/W, which is approximately
seventeen-fold higher than a similar wall made of Mix 4 (0.10 m2K/W). Thus, a wall made
of Mix 2 can offer the same thermal resistance of one made of Mix 4 (0.20 m thick) while
being approximately 94% thinner (0.012 m instead of 0.20 m). A typical simple wall
containing a layer of normal concrete (0.20 m thick) and a layer of thermal insulation (EPS,
0.06 m thick) has a thermal resistance of about 2 m2K/W [C. A. P. dos Santos and L.
Matias, 2006]. This thermal resistance can be achieved with only one 0.24 m thick layer of
Mix 2, which is thinner than the typical considered wall (0.26 m) and eliminates the need of
the extra insulation layer. If Mix 4 were to be used instead of Mix 2, a thickness of 4.10 m
would be necessary to achieve the same thermal resistance of a simple wall. Thus, unlike
Mix 4, Mix 2 allows for a highly improved thermal resistance compared to typical simple
walls with insulation.
The variation of temperature over time on the interior of the wall is shown in Figure 5, for
each concrete mixture and for summer and winter ambient conditions (as detailed in Table
A1).
a) Summer b) Winter
Figure 5: Temperature in the interior surface of walls as a function of time for each concrete mixture
interior wall surface Mix 2, interior wall surface Mix 4, outdoor ambient temperature
Page 12
104
For summer and winter, Mix 4 results in higher temperature variations than Mix 2, in the
interior surface of the wall (4.6 - 10.2 ºC vs 0.3 - 1.7 ºC, Figure 5). Mix 2 can be considered to
have the best thermal performance, because its (seventeen-fold) higher insulation and
thermal inertia dampens and delays the heat transfer through its structure.
Load bearing capacity of façade walls
The stress distribution in the wall, including the wall self-weight in addition to the thermal
expansion has been calculated as well. The thermal expansion effect was introduced in the
mechanical analysis by including thermal strains proportional to temperature change
relative to a reference temperature (20 ºC), in the same way as in Section 3.2. The resulting
variation of stresses were analysed in the bottom centre of the concrete layer, the results of
which are shown in Figure 6. Temperature oscillations (relative to the reference
temperature of 20ºC) cause different degrees of expansion which affect the stress
distribution. Thus, thermal expansion phenomenon has more impact in the stress
distribution in winter than in summer because of the higher temperature variation relative
to the reference temperature of 20 ºC, thus resulting in higher expansion (Figure 6). If the
formerly mentioned (section 2.2) compressive strengths are assumed (5.6 MPa and 50 MPa
a) Summer b) Winter
Figure 6: Stress (solid lines) and horizontal displacement (dashed lines) as a function of time,
evaluated in the bottom center of the concrete layer
tensile Mix 2, tensile Mix 4, compressive Mix 2, compressive Mix 4
Page 13
105
for Mix 2 and Mix 4, respectively), no compressive failure is expected to occur in summer
or winter.
Assuming the same tensile strengths as previously (0.9 MPa and 4 MPa for Mix 2 and Mix
4, respectively), no tensile failure is expected in summer. In winter, the maximum obtained
tensile stress for Mix 2 is lower than its tensile strength. Thus, no tensile failure is expected
for this mixture. On the contrary, for Mix 4, the maximum obtained tensile stress in winter
is more than double of its tensile strength. So, Mix 4 is expected to fail due to tension,
under the present loading conditions.
The failure criteria used for walls in transient analysis are the same as used for blocks and
panels in the steady-state analysis (section 2.2). Yet, different results are obtained:
compressive and tensile failure is expected for blocks made of Mix 2 (section 2.2), while no
failure is expected, in winter, for a wall composed by the same blocks (this section). This is
a consequence of using average mixture properties for simulating walls, neglecting the
stresses due to interaction between aggregate particles and mortar matrix with different
properties. This indicates the importance of considering these interactions in the stress
distribution analyses in order to avoid misleading results.
4 House / Building
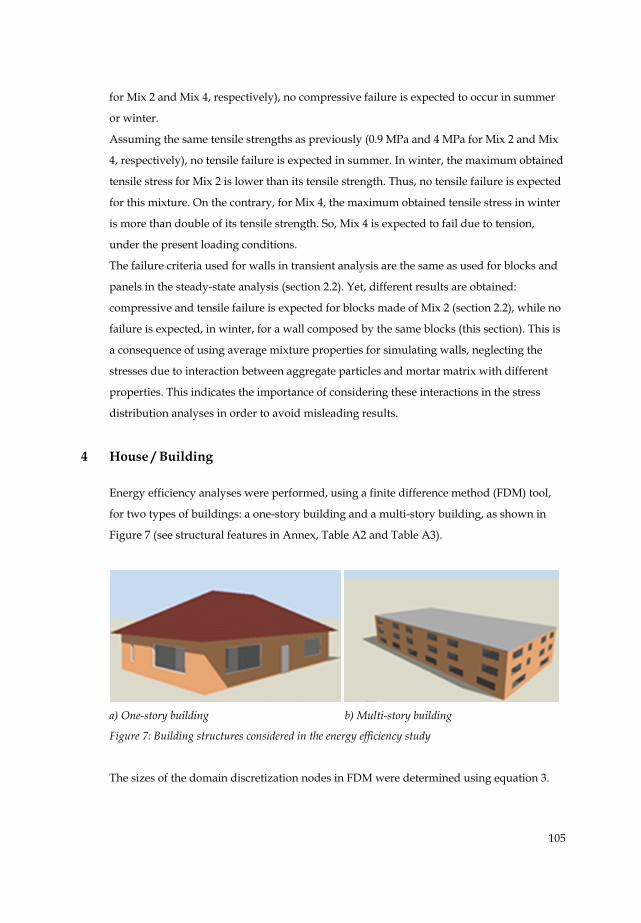
Energy efficiency analyses were performed, using a finite difference method (FDM) tool,
for two types of buildings: a one-story building and a multi-story building, as shown in
Figure 7 (see structural features in Annex, Table A2 and Table A3).
a) One-story building b) Multi-story building
Figure 7: Building structures considered in the energy efficiency study
The sizes of the domain discretization nodes in FDM were determined using equation 3.
Page 14
106
Δ α Δx= C t (3)
where a default value of 3 was used for the space discretization constant C and 15 minutes
was used for the time-step ∆t. The size of the node was calculated considering the thermal
diffusivity of each material α.
Representative scenarios were simulated, based on the Portuguese building regulation for
residential buildings [ITeCons, 2013]. One heat source of 4 W/m2 per room was assumed
for the one-story building and for the second and third floors of the multi-story building
(in this case the first floor was considered to be composed by warehouses, thus having no
heat-generating equipment). The temperatures for the onset of air-conditioning systems
were 18 ºC for heating and 25 ºC for cooling, in order to ensure thermal comfort; the air
renewal values were 0.6/h for April-September season and 0.4/h for October-March. The
HVAC system was specified to guarantee that the above conditions were met for each
building, depending on its location and weather conditions. Two weather scenarios were
considered, typical of hot summer (in Évora/Portugal) and cold winter (in Bragança/
Portugal). The annual energy consumption for heating or cooling the two types of building
is presented in Figure 8, for each considered location and concrete mixture used in the
façade walls.
For both locations, and as expected, more energy is needed for maintaining the indoor
temperatures within the thermal comfort range (i.e. 18 ºC – 25 ºC) in the multi-story
building than in the one-story building. The ratio between the envelope area (i.e. the area
of the heat transfer between building and the environment) and volume is lower for the
Figure 8: Annual energy consumption for each climate and for each concrete mixture, for one-story
and multi-story building
Page 15
107
multi-story building than for the one-story building. Thus, on a volume basis comparison,
the heat exchange between multi-story building and environment is lower while more heat
is generated because of the higher number rooms. As shown in Figure 8, lower energy
consumption is obtained when the façade walls are composed by a layer of Mix 2. When
Mix 2 is used in one-story building, an energy saving of 44% and 52% is obtained for
summer and winter, respectively. For the same mixture in the multi-story building,
savings in summer and winter are of 16% and 33%, respectively. This corroborates what
was found in previous analyses performed for products (blocks and panels) and elements
(façade walls), showing that Mix 2, composed by PUR aggregate particles, performs better
mechanically and thermally.
5 Conclusions
This paper presents a multi-level modelling strategy that allowed comparing the response
of different concrete products, composed by non-traditional concrete mixtures, when
exposed to different ambient conditions, providing information about the best performing
concrete mixtures from the aggregate level to the full house analysis.
At the aggregate level, the local stress distribution in blocks and panels, composed by
traditional and non-traditional concrete mixtures and exposed to loading conditions
corresponding to the wall self-weight and thermal stresses, were analysed. Based on the
studies performed, high stress zones were identified for blocks and panels so an
assessment of failure prone zones was performed. Components made of Mix 2 were found
to fail under compression and tension, while those made of Mix 4 were found to fail only
under tension, for the considered loading conditions and assumed tensile and compressive
strengths. The obtained results, based on the assumption of a linear elastic study, inform
about failure-prone zones in the tested materials/structures. Moreover, for the cases where
the obtained stresses exceed the material strength, it is important to consider a non-linear
study in order to determine more realistic stress and deformation distribution.
A comparative study of stress distribution and thermal performance of façade walls was
performed. It was found that, for façade walls, Mix 2 (non-traditional concrete made of
PUR aggregate) showed the best thermal performance by promoting lower temperature
fluctuations over time and a temperature closer to the comfort temperature of 21 ºC.
Concerning the mechanical performance, Mix 4 (traditional concrete made of gravel
aggregate) showed to experience higher stresses and higher stress variation with
temperature than Mix 2. For Mix 4, in winter, the tensile stresses were found to be higher
Page 16
108
than its estimated tensile strength. Thus, failure might occur for walls made of this
mixture, for the simulated loading conditions. No failure was found to occur in walls made
of Mix 2. These results diverge from those obtained for blocks/panel made of the same
mixtures. Yet, for walls, the concrete mixture was assumed to be homogeneous and
average properties were considered, while for blocks/panels, the interaction between
aggregate and mortar in a heterogeneous mixture were taken into consideration. This
indicates that the local stresses due to interaction between aggregate particles and mortar
matrix should not be disregarded.
Finally, an energy efficiency study was performed for houses/buildings (one-story and
multi-story) composed by the mentioned concrete mixtures for two locations characterized
by hot summer and cold winter. Lower energy consumption was obtained for façade walls
composed by a layer of Mix 2. This corroborates the findings obtained for walls and for
concrete products (blocks and panels). When compared to normal concrete, Mix 2 results
in energy saving between 16% and 52% (for multi-story building in summer and one-story
building in winter, respectively).
Page 17
109
Literature
Aı ̈tcin, P.-C. (2000). Cements of yesterday and today. Cement and Concrete Research 30 (9):
1349–59.
ASHRAE, ASHRAE®HANDBOOK: Fundamentals. Vol. 30329, 2009.
Bansal, R.K., A Textbook of Strength of Materials. Laxmi Publications, 2010.
Czichos, H., T. Saito and L.R. Smith, Springer Handbook of Materials Measurement Methods.
Springer Handbooks. Springer, 2006.
EN 1992-1-1:2004 (2004). European Standard - Eurocode 2: Design of concrete srtuctures -
Part 1-1: General rules and rules for buildings.
EnergyPlus Energy Simulation SoftwareWeather Data.
http://apps1.eere.energy.gov/buildings/energyplus/weatherdata_about.cfm.
Flatt, R.J., N. Roussel and C.R. Cheeseman (2012). Concrete: An eco material that needs to
be improved. Journal of the European Ceramic Society 32 (11): 2787–98.
Hassoun, M.N. and A. Al-Manaseer, Structural Concrete: Theory and Design, 2012.
He, H., Computational Modelling of Particle Packing in Concrete. TU Delft, Delft University of
Technology, 2010.
ITeCons (2013). Regulamento de desempenho energético dos edifícios de habitação (REH),
Síntese da regulamentação aplicável.
Santos, C.A.P. dos and L. Matias (2006). Coeficientes de transmissão térmica de elementos
da envolvente dos edíficios. Lisboa: ICT informação técnica; Edifícios - ITE 50.
Visser, J.H.M. and A.V. Bigaj (2014). Designing sustainable concrete on the basis of
equivalence performance: assessment criteria for safety. Proceedings of the 4th
International FIB Congress on Improving Performance of Concrete Structure. Mumbai, India,
1–11.
Visser, J.H.M., S. Couto, A. Gupta, I.L. Alvarez, V.C. Ligero, T.S. Mayor, R. Vinai, et al.
(2015). Sustainable concrete: design and testing. HERON, Vol. 60 (2015) No. 1/2, pp. 59-
91.
Zahavi, E. and D.M. Barlam, Nonlinear Problems in Machine Design. CRC Press, 2000.
Page 18
110
Annex
Table A1: Environment conditions applied for the walls performance evaluation [EnergyPlus
Energy Simulation Software, 2014][ASHRAE, 2009]
Scenario: summer winter
Location Évora Bragança
Time 18th July 18th January
Orientation of the wall South South
Outdoor temperature ºC
Solar heat gain W/m2
Heat transfer coefficient for outdoor conditions
W/(m2K)
14.8 10.4
Indoor temperature ºC 21 21
Heat transfer coefficient for indoor conditions
W/(m2K)
3.08 3.08
Emissivity of the wall surface 0.44 0.44
Page 19
111
Table A2: Floor and glass pane areas (m2) distribution
Floor
area
North/South glass pane East/West glass pane
OSB MSB OSB MSB
Kitchen 17.81 5.02 - 0.84 2.52 (type B)
Room 1 28 4.66 - - -
Room 2 24.95 - 4.66 (type A & B) 3.78 -
Room 3 38.95 5.02 5 (type A & B) 5.49 5.48 (type B)
Hall 19.93
WC 9.04
Total apartment 138.7
Warehouses 136.1
OSB: one-story building; MSB: multi-story building;
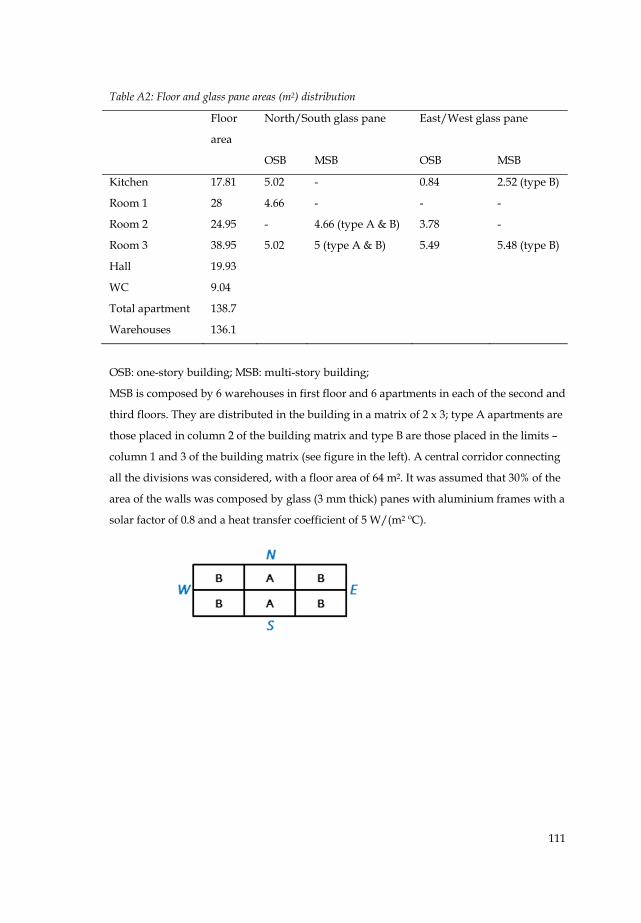
MSB is composed by 6 warehouses in first floor and 6 apartments in each of the second and
third floors. They are distributed in the building in a matrix of 2 x 3; type A apartments are
those placed in column 2 of the building matrix and type B are those placed in the limits –
column 1 and 3 of the building matrix (see figure in the left). A central corridor connecting
all the divisions was considered, with a floor area of 64 m2. It was assumed that 30% of the
area of the walls was composed by glass (3 mm thick) panes with aluminium frames with a
solar factor of 0.8 and a heat transfer coefficient of 5 W/(m2 ºC).
Page 20
112
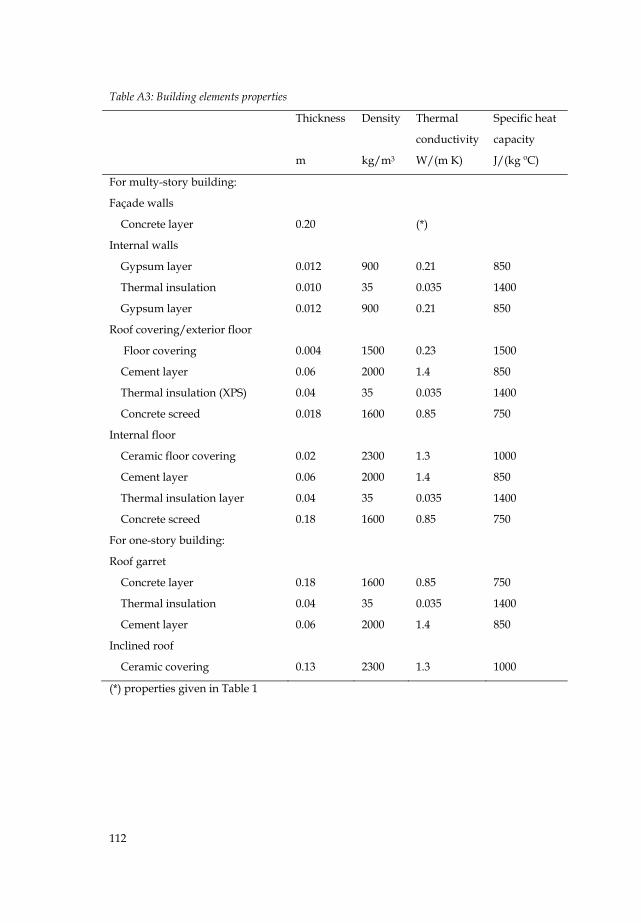
Table A3: Building elements properties
Thickness Density Thermal
conductivity
Specific heat
capacity
m kg/m3 W/(m K) J/(kg ºC)
For multy-story building:
Façade walls
Concrete layer 0.20 (*)
Internal walls
Gypsum layer 0.012 900 0.21 850
Thermal insulation 0.010 35 0.035 1400
Gypsum layer 0.012 900 0.21 850
Roof covering/exterior floor
Floor covering 0.004 1500 0.23 1500
Cement layer 0.06 2000 1.4 850
Thermal insulation (XPS) 0.04 35 0.035 1400
Concrete screed 0.018 1600 0.85 750
Internal floor
Ceramic floor covering 0.02 2300 1.3 1000
Cement layer 0.06 2000 1.4 850
Thermal insulation layer 0.04 35 0.035 1400
Concrete screed 0.18 1600 0.85 750
For one-story building:
Roof garret
Concrete layer 0.18 1600 0.85 750
Thermal insulation 0.04 35 0.035 1400
Cement layer 0.06 2000 1.4 850
Inclined roof
Ceramic covering 0.13 2300 1.3 1000
(*) properties given in Table 1