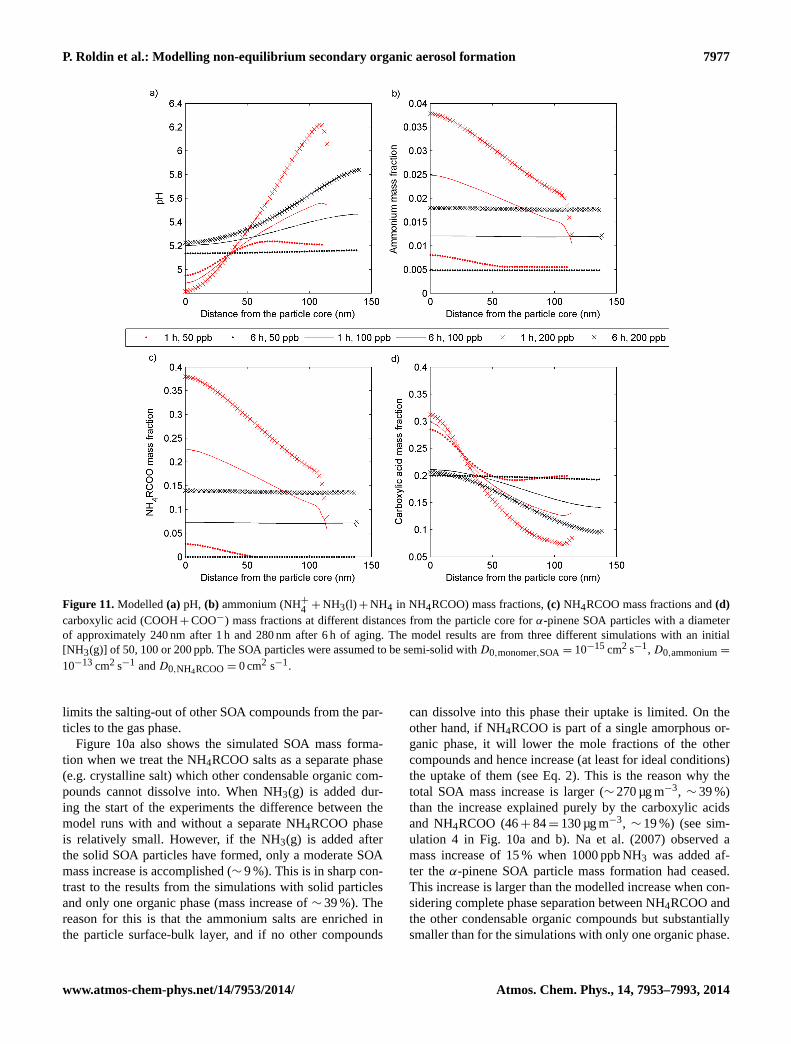
Modelling non-equilibrium secondary organic aerosol formationand evaporation with the aerosol dynamics, gas- and particle-phasechemistry kinetic multilayer model ADCHAM
P. Roldin1,3, A. C. Eriksson1, E. Z. Nordin2, E. Hermansson1, D. Mogensen3, A. Rusanen3, M. Boy3, E. Swietlicki1,B. Svenningsson1, A. Zelenyuk4, and J. Pagels2
1Division of Nuclear Physics, Lund University, P.O. Box 118, 221 00 Lund, Sweden2Ergonomics and Aerosol Technology, Lund University, P.O. Box 118, 221 00 Lund, Sweden3Department of Physics, P.O. Box 48, University of Helsinki, 00014 Helsinki, Finland4Pacific Northwest National Laboratory, P.O. Box 999, MSIN K8-88, Richland, WA 99354, USA
Received: 13 December 2013 – Published in Atmos. Chem. Phys. Discuss.: 10 January 2014Revised: 27 May 2014 – Accepted: 11 June 2014 – Published: 11 August 2014
Abstract. We have developed the novel Aerosol Dynam-ics, gas- and particle-phase chemistry model for laboratoryCHAMber studies (ADCHAM). The model combines thedetailed gas-phase Master Chemical Mechanism version 3.2(MCMv3.2), an aerosol dynamics and particle-phase chem-istry module (which considers acid-catalysed oligomeriza-tion, heterogeneous oxidation reactions in the particle phaseand non-ideal interactions between organic compounds, wa-ter and inorganic ions) and a kinetic multilayer module fordiffusion-limited transport of compounds between the gasphase, particle surface and particle bulk phase. In this arti-cle we describe and use ADCHAM to study (1) the evap-oration of liquid dioctyl phthalate (DOP) particles, (2) theslow and almost particle-size-independent evaporation ofα-pinene ozonolysis secondary organic aerosol (SOA) parti-cles, (3) the mass-transfer-limited uptake of ammonia (NH3)and formation of organic salts between ammonium (NH+
4 )and carboxylic acids (RCOOH), and (4) the influence ofchamber wall effects on the observed SOA formation in smogchambers.
ADCHAM is able to capture the observedα-pinene SOAmass increase in the presence of NH3(g). Organic salts ofammonium and carboxylic acids predominantly form duringthe early stage of SOA formation. In the smog chamber ex-periments, these salts contribute substantially to the initialgrowth of the homogeneously nucleated particles.
The model simulations of evaporatingα-pinene SOA par-ticles support the recent experimental findings that these par-
ticles have a semi-solid tar-like amorphous-phase state. AD-CHAM is able to reproduce the main features of the ob-served slow evaporation rates if the concentration of low-volatility and viscous oligomerized SOA material at the par-ticle surface increases upon evaporation. The evaporationrate is mainly governed by the reversible decomposition ofoligomers back to monomers.
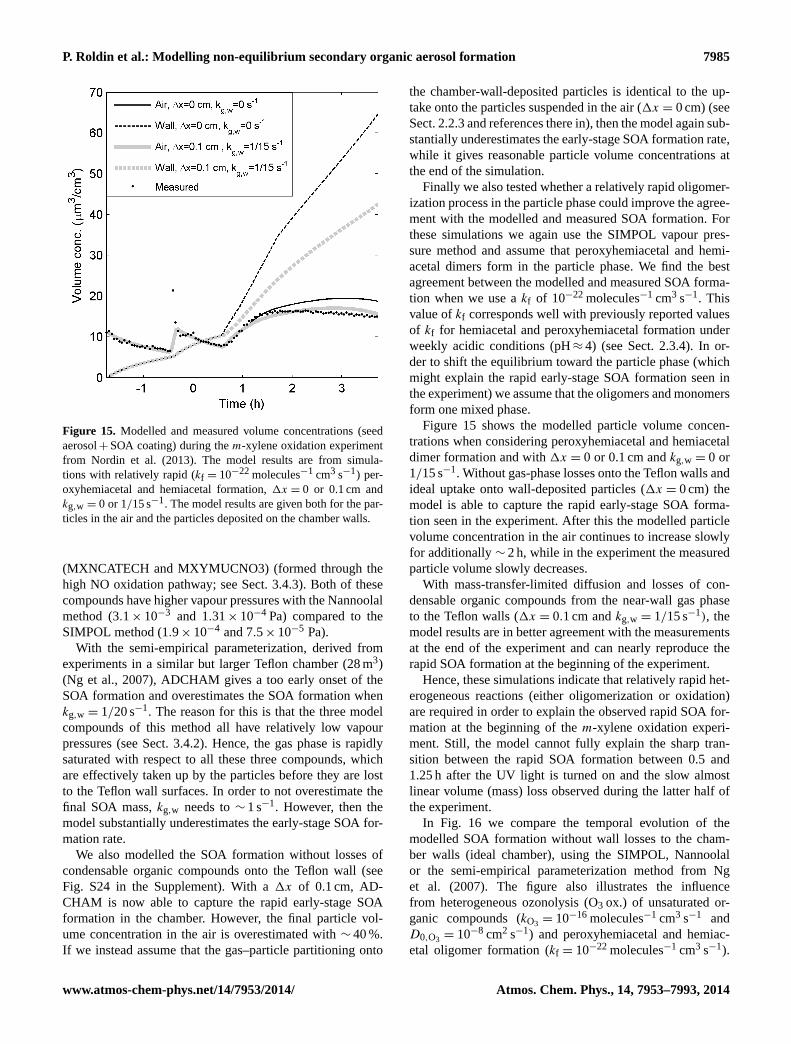
Finally, we demonstrate that the mass-transfer-limited up-take of condensable organic compounds onto wall-depositedparticles or directly onto the Teflon chamber walls of smogchambers can have a profound influence on the observedSOA formation. During the early stage of the SOA forma-tion the wall-deposited particles and walls themselves serveas an SOA sink from the air to the walls. However, at the endof smog chamber experiments the semi-volatile SOA mate-rial may start to evaporate from the chamber walls.
With these four model applications, we demonstrate thatseveral poorly quantified processes (i.e. mass transport limi-tations within the particle phase, oligomerization, heteroge-neous oxidation, organic salt formation, and chamber walleffects) can have a substantial influence on the SOA forma-tion, lifetime, chemical and physical particle properties, andtheir evolution. In order to constrain the uncertainties relatedto these processes, future experiments are needed in whichas many of the influential variables as possible are varied.ADCHAM can be a valuable model tool in the design andanalysis of such experiments.
Published by Copernicus Publications on behalf of the European Geosciences Union.
7954 P. Roldin et al.: Modelling non-equilibrium secondary organic aerosol formation
1 Introduction
Aerosol particles in the atmosphere have substantial impacton the global climate, air quality, and public health. Mea-surements around the world have demonstrated that a largefraction of the submicron aerosol particles are composed oforganic compounds (Jimenez et al., 2009). To date, manyimportant biogenic and anthropogenic secondary organicaerosol (SOA) precursors have been identified. However, thescientific knowledge about the SOA formation mechanisms,the SOA composition and properties is still very uncertain(Kroll and Seinfeld, 2008; Hallquist et al., 2009).
Traditionally, the important SOA formation mechanismsare modelled as pure gas-phase oxidation processes fol-lowed by equilibrium partitioning between the gas and a liq-uid organic particle phase (e.g. Pankow, 1994; Donahue etal., 2011). However, during the last∼ 10 years, other pro-cesses occurring in the particle phase have also been iden-tified as important mechanisms for the formation and prop-erties of SOA. These include acid-catalysed oligomerization(e.g. Gao et al., 2004; Iinuma et al., 2004; Kalberer et al.,2004; Tolocka et al., 2004), heterogeneous oxidation reac-tions (e.g. Knopf et al., 2005; Nash et al., 2006; Rudich etal., 2007; Maksymiuk et al., 2009), organic salt formation(e.g. Na et al., 2007; Smith et al., 2010; Kuwata and Mar-tin, 2012; Yli-Juuti et al., 2013), organosulfate formation(e.g. Liggio and Li, 2006; Surratt et al., 2007) and salting-out effects (e.g. Smith et al., 2011; Bertram et al., 2011). Theterm salting-out refers to the process in which interactionswith dissolved ions (generally inorganic) drive nonpolar or-ganic compounds out of the mixed phase, either into a differ-ent organic-rich (liquid) phase or out to the gas phase (Zuendet al., 2011).
Several independent laboratory experiments have alsoshown that secondary organic aerosol particles can form asolid or semi-solid amorphous phase (e.g. Virtanen et al.,2010; Vaden et al., 2010; Vaden et al., 2011; Kuwata andMartin, 2012; Zelenyuk et al., 2012; Abramson et al., 2013;Zhou et al., 2013), at least for relative humidities (RH) below65 % (Saukko et al., 2012). Recently, Abramson et al. (2013)measured the evaporation rates of pyrene that was imbed-ded inside SOA particles formed fromα-pinene ozonolysisin the presence of pyrene vapour, based on which the authorsestimated a diffusion coefficient of 2.5× 10⁻¹⁷ cm2 s−1 forpyrene in the fresh SOA under dry conditions. For particlesaged for∼ 24 h the diffusivity was an additional∼ 3 timesslower. Using the Stokes–Einstein relation for the binary dif-fusion coefficients gives an SOA viscosity of∼ 108 Pa s forfresh SOA and∼ 3× 10⁸ Pa s for the aged particles. Thesehigh viscosity values are typical for tar- or pitch-like sub-stances (Koop et al., 2011). For a particle with a diameterof 100 nm, this gives a characteristic time of mass trans-port (e-folding time of equilibration) of∼ 28 h for freshSOA and∼ 84 h for the aged SOA particles (Seinfeld andPandis, 2006). A similar study was performed by Zhou et
al. (2013), who observed mass-transport-limited degradationof benzo[a]pyrene (BaP) with ozone when coated withα-pinene SOA. Based on kinetic double-layer model simula-tions the authors estimate that the BaP diffusion coefficients(in cm2 s−1) are 2× 10⁻¹⁴, 8× 10⁻¹⁴ and> 10−12 for dry(RH< 5 %), 50 % RH and 70 % RH, respectively. The es-timated diffusion coefficient of BaP inα-pinene SOA (un-der dry conditions) from Zhou et al. (2013) is∼ 3 orders ofmagnitude larger than the diffusion coefficient of pyrene es-timated by Abramson et al. (2013). One reason for this couldbe that theα-pinene SOA in Zhou et al. (2013) is very fresh(∼ 1 min), while in Abramson et al. (2013) the SOA particlesare aged for at least 1 h, thus having time to form a substantialfraction of viscous oligomers.
If a viscous phase is formed, the mixing within the parti-cle bulk will be kinetically limited and the gas–particle parti-tioning cannot be well represented by an equilibrium process(Pöschl, 2011; Shiraiwa and Seinfeld, 2012), which the tradi-tional partitioning theory assumes (Pankow, 1994). This maynot be evident from pure SOA mass formation experimentswhere the condensable organic compounds are continuouslyformed by gas-phase oxidation of different precursor com-pounds (see e.g. Odum et al., 1996; Hoffmann et al., 1997;Griffin et al., 1999; Ng et al., 2007; Pathak et al., 2007). How-ever, in the atmosphere the aerosol particles are present witha broad size range and are exposed to more variable concen-tration, temperature and humidity conditions. Hence, atmo-spheric aerosol particles will never be entirely in equilibriumwith the gas phase. Dzepina et al. (2009) showed that theirequilibrium partitioning model substantially overestimate theevaporation of SOA in the Mexico City metropolitan area.
In well-controlled laboratory experiments, Grieshop etal. (2007) and Vaden et al. (2011) illustrated that the evap-oration of SOA particles formed fromα-pinene ozonoly-sis is a slow process (hours to days). Vaden et al. (2011)showed that this is orders of magnitude slower than expectedfrom the seven-product volatility basis set (VBS) parame-terization from Pathak et al., 2007. This parameterizationis based on a large number of smog chamber experimentsof α-pinene ozonolysis, which resemble the experiments byVaden et al. (2011). This VBS parameterization lacks sub-stantial fraction of low-volatility material. The slow evapo-ration of SOA can be due to the presence of low-volatilityoligomers in combination with mass transfer limitations andmixing effects (Grieshop et al., 2007; Vaden et al., 2011).Saleh et al. (2013) did not observe a strong evaporation in-hibition because of diffusion limitations in the particle phaseof α-pinene SOA particles. However, in Saleh et al. (2013)only ∼ 20 % of the SOA particle mass (corresponding toa few monolayers) was evaporated in their thermodenuder.This early-stage evaporation of freshly formed SOA parti-cles may indeed not be strongly diffusion-limited becauselow-volatility bulk-phase oligomers may not have formed acomplete monolayer thick surface coverage, which inhibitsfurther evaporation of monomers.
P. Roldin et al.: Modelling non-equilibrium secondary organic aerosol formation 7955
Vaden et al. (2011) illustrated that the evaporation of am-bient SOA particles is even slower than for the pureα-pineneSOA and better resembles the evaporation of agedα-pineneSOA particles in the presence of different hydrophobic or-ganic compounds. If the ambient SOA particles studied byVaden et al. (2011) are representative of typical atmosphericSOA particles, then the evaporation due to dilution in the at-mosphere (e.g. in urban plumes downwind from the source)will be almost negligible. This can increase the lifetime andconcentrations of SOA (and, for example, NH4NO3) in theatmosphere (Vaden et al., 2011).
For the past decade, large discrepancies between field-measured and model-predicted SOA loadings have stimu-lated intense research that was mostly focused on the searchfor additional SOA precursors. However, these models haveall treated SOA assuming it to be a semi-volatile equili-brated solution. A recent study (Shrivastava et al., 2013) hasshown that it is possible to improve agreement between mea-sured and modelled SOA loadings by treating SOA, in accordwith experimental data as a non-volatile semi-solid. Simi-larly, considering the highly viscous, non-volatile nature ofSOA offers a simple explanation for the observed long-rangetransport of persistent organic pollutants by atmospheric par-ticles (Zelenyuk et al., 2012).
A number of model studies have been performed to ex-plore detailed gas-phase reaction mechanisms which can beresponsible for the SOA formation of known biogenic andanthropogenic SOA precursors (e.g. Bloss et al., 2005a, b;Johnson et al., 2005, 2006; Li et al., 2007; Hu et al., 2007;Metzger et al., 2008; Rickard et al., 2010; Camredon et al.,2010; Valorso et al., 2011). However, relatively few attemptshave been made to perform detailed process-based modellingon the influence of phase state (Shiraiwa et al., 2010, 2011,2012; Pfrang et al., 2011), oligomerization (Vesterinen et al.2007; Pun and Seigneur, 2007; Li et al., 2007; Hu et al.,2007; Ervens and Volkamer, 2010), heterogeneous oxida-tion mechanisms (Shiraiwa et al., 2010; 2011, 2012; Pfranget al., 2011), organic–inorganic interactions (e.g. salting-outeffects, acidity effects) (Zuend et al., 2010; Zuend and Sein-feld, 2012), organic salt formation (Barsanti et al., 2009), andnon-equilibrium gas–particle partitioning and aerosol dy-namics (e.g. Korhonen, et al., 2004; Vesterinen et al., 2007;Boy et al., 2006; Roldin et al., 2011a, b) on the SOA forma-tion and properties, and to our knowledge no one has previ-ously included all these processes in the same model.
In this article we describe and apply the newly developedAerosol Dynamics, gas- and particle-phase chemistry modelfor laboratory CHAMber studies (ADCHAM). As the nameimplies the model is primarily aimed to be used as a flexi-ble tool for evaluation and design of controlled experimentsin smog chambers (e.g. Nordin et al., 2013), thermodenuders(e.g. Riipinen et al., 2010), evaporation chambers (e.g. Vadenet al., 2011), flow-tube reactors (e.g. Jonsson et al., 2008) orhygroscopicity measurements set-ups (e.g. Svenningsson etal., 2006). However, the overall aim is to gain a better un-
derstanding of which processes (e.g. gas-phase chemistry,particle-phase reactions, particle-phase state, aerosol wateruptake, cloud droplet activation, and aerosol dynamics) arerelevant for the aerosol properties and formation in the atmo-sphere.
In ADCHAM the secondary aerosol formation is mod-elled by combining the Master Chemical Mechanism ver-sion 3.2 (MCMv3.2) (Jenkin et al., 1997, 2003; Saunders etal., 2003) and an updated version of the aerosol dynamicsand particle-phase chemistry module from ADCHEM (2-D-Lagrangian model for Aerosol Dynamics, gas-phase CHEM-istry and radiative transfer) (Roldin et al., 2011a), whichnow considers acid-catalysed oligomerization; oxidation re-actions in the particle phase (e.g. secondary ozonide forma-tion); and the diffusion-limited transport of compounds be-tween the gas phase, particle surface and particle bulk phase.In this work we test the capability of ADCHAM to simulate(1) the particle-size-dependent mass evaporation loss rates ofliquid dioctyl phthalate (DOP) particles, (2) the slow and al-most particle-size-independent evaporation ofα-pinene SOAparticles (Vaden et al., 2011), (3) the mass-transfer-limiteduptake of NH3 and formation of organic salts between am-monium and carboxylic acids (Na et al., 2007; Kuwata andMartin, 2012), and (4) the influence of heterogeneous reac-tions and chamber wall effects on the SOA formation andproperties.
Regional- and global-scale chemistry transport models(e.g. the EMEP model (Bergström et al., 2012) rely onsemi-empirical parameterizations for the SOA formation(e.g. VBS) derived from smog chamber experiments. Thisis one of many reasons why it is important to constrain theuncertainties related to specific chamber effects. Hence, as afinal application, we illustrate how ADCHAM can be usedto study the influence of chamber wall effects on the SOAmass formation, particle number size distribution and gas-phase chemistry during anm-xylene oxidation experimentby Nordin et al. (2013).
2 Model description
ADCHAM consists of
1. a detailed gas-phase kinetic code (in this work with re-actions from MCMv3.2);
2. an aerosol dynamics code (Roldin et al., 2011a) whichincludes Brownian coagulation, homogeneous nucle-ation, deposition to chamber walls and a detailed con-densation/evaporation algorithm;
3. a novel particle-phase chemistry module which isclosely connected to the condensation/evaporation algo-rithm;
7956 P. Roldin et al.: Modelling non-equilibrium secondary organic aerosol formation
4. and a kinetic multilayer model which treats the diffusionof compounds between the particle surface and severalbulk layers, analogous to Shiraiwa et al. (2012).
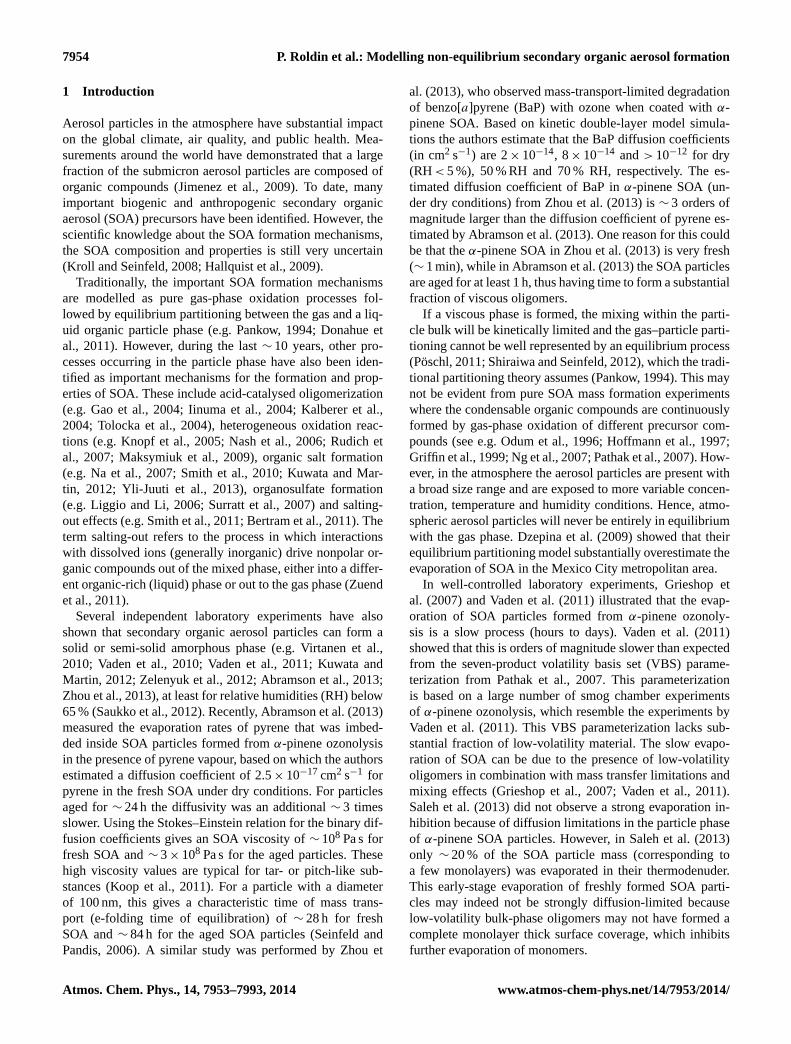
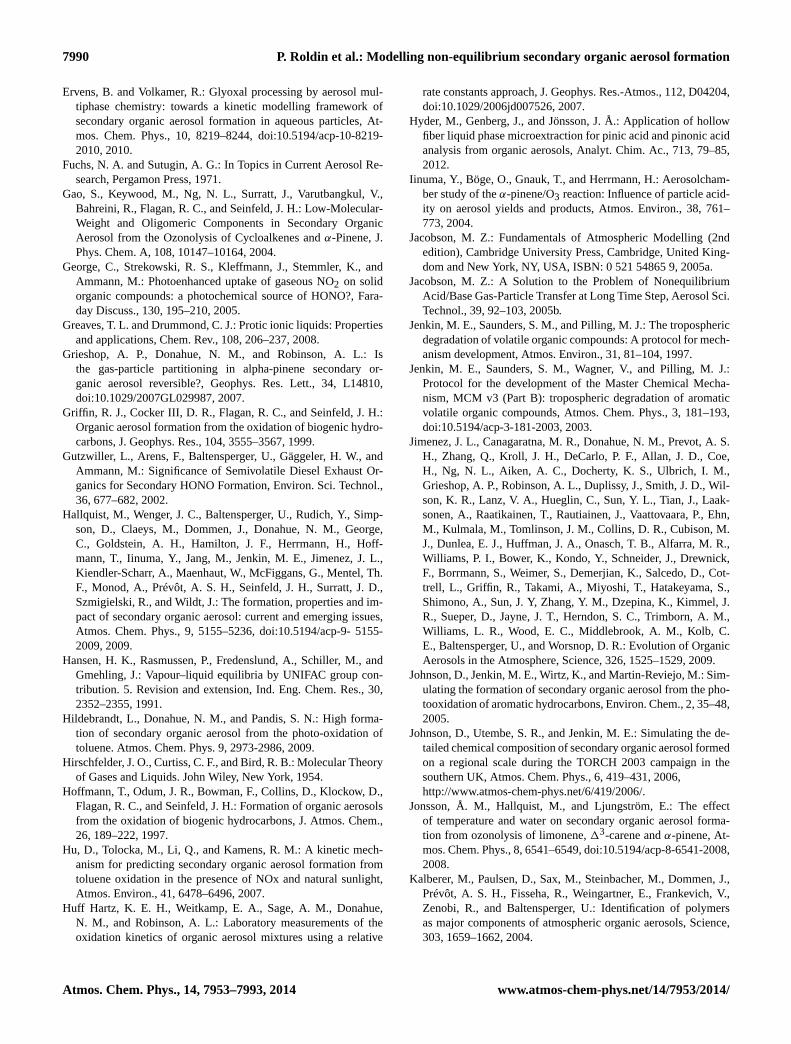
Figure 1 shows a schematic picture of the ADCHAM modelstructure. The model explicitly treats the bulk diffusion ofall compounds (including oxidation agents (Zox) such asOH, O3 and NO2) between different particle layers and bulkreactions. For all compounds exceptZox, the gas–surfacepartitioning is by default modelled as an absorption (disso-lution) process with the condensation/evaporation equation(Eq. 1, Jacobson, 2005a). Equation (1) considers the gas-surface diffusion limitations and potentially non-unity prob-ability of adsorption (sticking) and dissolution into the par-ticle surface-bulk layer (surface-bulk accommodation). Thesurface-bulk layer we define as the monolayer thick parti-cle surface layer where the condensing compounds dissolve(absorb). In each particle layer the model considers acid-catalysed oligomerization, equilibrium reactions between in-organic and organic salts and their dissolved ions, and het-erogeneous oxidation of SOA.
In ADCHAM the different processes are solved withseparate modules using operator splitting. For each mainmodel time step (in this work 10 s), ADCHAM considers ho-mogeneous nucleation, followed by deposition of particles(Sect. 2.2.3) and potentially gases, emissions of gases andparticles, gas-phase chemistry (Sect. 2.1) and coagulation(Sect. 2.2.2). After this ADCHAM handles the condensa-tion and evaporation of all organic and inorganic compounds(Sect. 2.2.1) and the reversible adsorption, diffusion and re-actions ofZox in the different particle layers (Sect. 2.4.2).In between these processes ADCHAM uses operator split-ting with a much shorter time step (in this work 1–10 ms).For the reversible adsorption, diffusion and reactions of thedifferent oxidation agents in the particle phase, a kineticmultilayer model (Sect. 2.4.2) is used. This model consistsof a coupled ordinary differential equation system whichis solved using the MATLAB ode15s solver with adaptiveand error-tolerance-controlled internal time steps. The gas–particle partitioning relies upon updated activity coefficients(Sect. 2.3.1), hydrogen ion concentrations (Sect. 2.3.2), wa-ter content, concentrations of inorganic and organic salts(Sect. 2.3.3) and their corresponding anion and cations.Therefore, the gas–particle partitioning is usually the mosttime demanding process in ADCHAM. Finally, the modelconsiders the diffusion of organic and inorganic compoundsbetween all particle layers (Sect. 2.4.1) and acid-catalysedoligomerization (Sect. 2.3.4).
85
1
Figure 1. Schematic picture of the ADCHAM model structure. 2
MCM v3.2 gas-phase chemistry +
additional user specified reactions
Pure organic liquid
saturation vapour
pressures (SIMPOL or
the Nannoolal method)
Aerosol dynamics (ADCHEM)
Gas-particle partitioning
surface-bulk layer:
- Condensation and
evaporation of
HNO3, H2SO4 and
organic compounds
- Equilibrium water
and NH3 uptake
Brownian
coagulation
Deposition of
particles and
gases
Homogeneous
nucleation
Particle phase chemistry
Acid catalysed oligomerization and oligomer
degradation
AIOMFAC activity
coefficients
Particle acidity Solid salt – ion dissociation
equilibrium: NH4+, NO3
-,
SO4-2
, HSO4-, NH4HSO4(s) ,
(NH4)2SO4(s) , NH4NO3(s)
Diffusion of organic
and inorganic
compounds and
water between
surface and bulk
layers
O3 uptake, diffusion
between layers and
reactions with
unsaturated organic
compounds
Multi-layer model
Figure 1. Schematic picture of the ADCHAM model structure.
2.1 Gas-phase chemistry
To be able to implement the detailed MCMv3.2 gas-phasechemistry together with user-specified reactions and reactionrates (e.g. chamber wall effects) in a computationally effi-cient way in MATLAB, we constructed a program whichautomatically creates a system of equations which can beused to calculate the concentrations of the user-specifiedcompounds. The only required input to the program is theMCMv3.2 names of the compounds, which can be down-loaded athttp://mcm.leeds.ac.uk/MCM. The output from theprogram is a set of coupled ordinary differential equations(one for each compound) and the Jacobian matrix, whichis used by the ode15s solver in MATLAB. The constructedcode can either be used as a standalone code for separate gas-phase chemistry simulations or used as a module in the AD-CHEM or ADCHAM model. The ode15s solver in MATLABis intended to be used for stiff ordinary differential equationsystems. The solver uses an adaptive and error-tolerance-controlled internal time step in order to solve the gas-phasechemistry.
In Sects. 3.2 and 3.3 we simulate the SOA formation fromozonolysis ofα-pinene in the presence of CO or cyclohexaneas an OH scavenger. We constructed an equation system con-sisting of all MCMv3.2 reactions involving inorganic gas-phase chemistry and all oxidation products ofα-pinene andcyclohexane (in total 668 compounds and 2093 reactions).In Sect. 3.4 we also model the SOA formation oxidation of
P. Roldin et al.: Modelling non-equilibrium secondary organic aerosol formation 7957
m-xylene with the MCMv3.2 gas-phase chemistry (273 com-pounds and 878 reactions).
2.2 Aerosol dynamics
The aerosol dynamics module in ADCHAM is based on theaerosol dynamics code from the ADCHEM model (Roldin etal., 2011a). A shorter description with focus on the importantupdates is given below.
2.2.1 Condensation and evaporation
In ADCHAM the gas–particle partitioning depends on thechemical composition in the particle surface-bulk layer.Analogous to Jacobson (2005b) the dissolution of ammo-nia into the particle surface-bulk layer water- and/or organicphase is treated as an equilibrium process, considered af-ter the diffusion-limited condensation/evaporation of HNO3,H2SO4 and organic compounds (Eq. 1, Seinfeld and Pandis,2006) (of which carboxylic acids influence the particle acid-ity and hence the ammonia dissolution).
Ii = 2DiDpfi
(Kni,αs,i
)(Ci,∞ − Ci,s
), (1)
fi
(Kni,αs,i
)=
0.75αs,i (1− Kni)
Kn2i + Kni + 0.283Kniαs,i + 0.75αs,i
In Eq. (1) Ii is the contributions of speciesi to the particlemolar growth rates,fi is the Fuchs–Sutugin correction factorin the transition region,Ci,∞ is the gas-phase concentrationof speciesi far from the particle surface (mol m−3 air), Ci,sis the saturation gas-phase concentration at the particle sur-face (mol m−3 air), Di is the gas-phase diffusion coefficient(m2 s−1), Dp is the particle diameter (m),Kni is the non-dimensional Knudsen number andαs,i is the surface-bulk ac-commodation coefficient.
In this work we estimate the pure-liquid saturation vapourpressures (p0) of the MCMv3.2 oxidation products using ei-ther the group contribution method SIMPOL (Pankow andAsher, 2008) or the method by Nannoolal et al. (2008) (herereferred to as the Nannoolal method). The correspondingequilibrium vapour pressures (ps,i,j ) for each particle sizebin (j) are derived with Raoult’s law, using the mole frac-tions of each organic compound (xi,j ), the activity coeffi-cients (γi,j ) calculated with the AIOMFAC thermodynamicmodel (Zuend et al., 2008, 2011) (Sect. 2.3.1), and the Kelvineffect (Cki,j
) (Eq. 2). The surface tension (σi) of the organiccompounds was assumed to be 0.05 N m−1 following Riip-inen et al. (2010).
ps,i,j = p0,ixi,jγi,jCki,j,Cki,j
= e
(4Miσi
RTρpDp,j
)(2)
T is the temperature in kelvin,R is the universal gas constant(J mol−1 K−1), Mi is the molar mass of compoundi andρpis the density of the phase which the compound partitions to.
The mole fraction for compoundi in Eq. (2) is themole fraction of the organic compound in the surface-bulk layer organic phase which compoundi partitionsinto (dissolves). In this work we either treat all SOAs(monomers+ dimers+ organic salts) as one phase or as twocompletely separate phases, with monomers as one phase andthe dimers and organic salts as a second phase. This phaseseparation is not modelled explicitly (as in Zuend and Sein-feld, 2012). Instead we simply assume that either the phaseseparation does occur or it does not. In future model applica-tions, we intend to implement a simple approach to calculateliquid–liquid phase separation (e.g. Topping et al., 2013). Ifthe described phase separation occurs, then the monomerswill not dissolve in the phase made up of dimers and/or or-ganic salts. Thus, their saturation vapour pressures are notlowered by dimerization or organic salt formation, which re-sults in less SOA mass in the model compared to simulationswithout phase separation (Topping et al., 2013).
In this work the condensation and evaporation mechanismincludes all organic compounds with modelled pure-liquidsaturation vapour pressures less than 1 Pa. For theα-pineneoxidation experiments which we model in Sects. 3.2 and 3.3,this involves 154 non-radical MCMv3.2 organic compounds,while for them-xylene SOA formation experiment modelledin Sect. 3.4, we consider 112 condensable organic MCMv3.2compounds.
2.2.2 Coagulation
ADCHAM also includes a Brownian coagulation algorithm(Roldin et al., 2011a). The particle mass and number concen-trations of the formed particles are split between the exist-ing particle size bins using a fully stationary method. It stillremains a challenge to combine the coagulation algorithmwith the kinetic multilayer model when the number of par-ticle layers depends on the particle size. In this first versionof ADCHAM it is only possible to treat coagulation betweenparticles composed of maximum three layers (e.g. a surfacemonolayer layer, a bulk layer and a seed aerosol core). Whentwo particles composed of such a layer structure collide, thelayers are simply assumed to merge together, forming a newspherical particle with a surface-bulk layer, a bulk layer anda seed aerosol core. Because the surface area of the formedparticle is always less than the sum of the surface areas of thetwo original particles, the width of the surface-bulk layer in-creases. Hence, in order to keep the width of the surface-bulklayer at approximately the thickness of one monolayer, partof the surface-bulk layer material is transferred to the particlebulk.
2.2.3 Deposition and chamber wall effects
It is well known that deposition losses of particles onto thechamber walls have a large influence on many chamber ex-periments (see e.g. Pierce et al., 2008). A commonly used
7958 P. Roldin et al.: Modelling non-equilibrium secondary organic aerosol formation
method (see e.g. Hildebrandt et al., 2009; Loza et al., 2012)is to scale the measured SOA mass with the measured rel-ative seed aerosol (typically ammonium sulfate) loss rate.With this method it is assumed that the particles depositedon the chamber walls continue to take up condensable gas-phase compounds as if they were still present in the gasphase. A second method which was also used by Hildebrandtet al. (2009) and Loza et al. (2012) is to assume that the gas–particle partitioning stops once the particles have depositedon the chamber walls. These two correction methods can beconsidered to be two extremes, where the first method givesan upper bound of the SOA mass formed during the exper-iments whereas the second method gives a lower bound ofthe SOA formed during the experiments (at least if the SOAparticles on the chamber walls are not evaporating and thegas-phase losses directly to the chamber walls are negligi-ble).
ADCHAM considers the deposition of particles ontochamber walls and also keeps track of the particles depositedon the walls. The model also treats the mass-transfer-limitedgas–particle partitioning between the gas phase and the wall-deposited particles. Hence, ADCHAM can be used to studythe influence of chamber wall effects on the SOA mass for-mation and help to constrain the uncertainties of the formedSOA mass (SOA mass yield).
For non-charged particles, ADCHAM uses the indoor de-position loss rate model from Lai and Nazaroff (2000),which accounts for different deposition loss rates on upward-, downward- and vertically facing surfaces. However, if aconsiderable fraction of the particles are charged (e.g. atBoltzmann charge equilibrium) the effective deposition lossrate of particles can be considerably enhanced (Pierce et al.,2008). Hence, in order to be able to model realistic deposi-tion loss rates of charged particles, ADCHAM keeps track ofthe fraction of particles suspended in the air with zero, one,two or three elemental charges in each particle size bin. Thefirst-order deposition loss rate (s−1) due to charge (kcharge)is calculated with Eq. (3), whereνe is the characteristic av-erage deposition velocity due to electrostatic forces (m s−1)(McMurry and Rader, 1985). The deposition loss rates de-pend on the friction velocity and for charged particles also onthe mean electrical field strength within the chamber (E′′).Unfortunately both of these parameters are usually poorlyknown and need to be constrained with model simulationsof seed aerosol deposition experiments (see Sect. 3.4). Mc-Murry and Rader (1985) found thatE′′ was∼ 45 V cm−1 inan almost spherical∼ 0.25 m3 Teflon chamber. On the cham-ber surfaces they measured a negative electrical field strengthof −300± 150 V cm−1. They attributed the lower empiri-cally derived electric field within the chamber to the fact thatthe particles in the chamber will be influenced by a net elec-trical field, which has contributions from all points on thechamber surfaces. Hence, the shape and size of the chamberwill also influence the mean electrical field.
kcharge=Achamberve
Vchamber,ve =
neCcE′′
3πµDp; (3)
Achamberis the chamber surface area,Vchamberis the chambervolume,n is the number of elemental charges of the parti-cle, e is the elementary charge,Cc is the Cunningham slipcorrection factor andµ is the dynamic viscosity of air.
The mass-transfer-limited uptake of gases to and from thechamber walls needs to be considered in order to take intoaccount the potential uptake (dissolution) of organic com-pounds in the SOA particles deposited on the chamber walls(Hildebrandt et al., 2009), as well as direct uptake of gas-phase molecules onto the Teflon chamber surfaces (Mat-sunaga and Ziemann, 2010). For the condensation uptakeor evaporation of SOA from the particles deposited on thewalls, we assume that the particles deposited on the wallsbehave as if they were still suspended in (direct contact with)a thin (by default 1 mm thick) air layer adjacent to the cham-ber walls. As more particles get deposited on the walls, theSOA concentration on the chamber wall will increase. Thecondensable organic compounds in the thin air layer next tothe chamber walls then have an increased probability to dis-solve into the organic particle phase on the walls. However,semi-volatile organic compounds may also evaporate fromthe particles on the walls when the gas-phase concentrationsin the chamber are reduced. The gas–particle partitioning be-tween the wall-deposited particles and the thin air layer nextto the chamber walls is modelled with the condensation andevaporation module described in Sect. 2.2.1.
ADCHAM also considers the adsorption and desorption ofcondensable organic compounds onto the Teflon surface film.This is modelled as a reversible process in accordance withMatsunaga and Ziemann (2010). The adsorption of gas-phaseorganic compounds onto the chamber walls is representedby a first-order loss rate from the near-wall gas phase to thewalls (kg,w). The desorption rate from the Teflon surfacesout to the thin layer next to the chamber walls (kw,g,i) de-pends on the pure-liquid saturation vapour pressures (p0,i) ofthe adsorbed compounds (Eq. 4) (Matsunaga and Ziemann,2010). Equations (5) and (6) describe the rate of change ofthe organic compound (Xi) (due to adsorption and desorp-tion) on the chamber walls and in the air layer adjacent tothe wall, respectively. [Xi,g,w] is the concentrations of com-poundXi in the thin layer adjacent to the chamber walls.The concentration at the chamber wall ([Xi,w]) is given asan effective chamber volume concentration (total number ofXi molecules on the walls divided by the total chamber vol-ume (Vchamber)). Vwall is the air volume of the thin (1 mm)layer adjacent to the chamber walls,Cw is an effective wall-equivalent mass concentration which the organic compoundscan dissolve into,Mw is the average molar mass of the Teflonfilm, andγw,i is the activity coefficient of compoundi in theTeflon film.
P. Roldin et al.: Modelling non-equilibrium secondary organic aerosol formation 7959
Because ADCHAM calculates the gas–wall uptake fromthe thin layer (volume) adjacent to the Teflon walls and notfrom the total chamber volume, thekg,w values used in themodel need to be substantially larger than the (experimen-tally quantifiable) effective total chamber volume loss ratek∗
g,w (e.g. from Matsunaga and Ziemann, 2010). If the masstransport across the laminar layer adjacent to the chamberwalls does not pose a strong limitation on the gas–wall up-take (1x ≈ 1 mm), thekg,w value used in ADCHAM canbe derived from the experimentally determined effective lossrate by scalingk∗
g,w with the ratio between the total cham-ber volume and the air volume adjacent to the chamberwalls (Vchamber/Vwall). However, if 1x is relatively large(e.g. 10 mm),kg,w needs to be increased in order to match theexperimentally derived gas–wall losses. In the supplemen-tary material we illustrate this with a few examples. Here wealso illustrate that the modelled gas–wall uptake is not sensi-tive to the absolute width of the thin air layer adjacent to thechamber walls as long askg,w is scaled withVchamber/Vwall(see Supplement Fig. S1).
k∗g,w andCw/
(Mwγw,i
)in Eq. (4) were experimentally de-
termined by Matsunaga and Ziemann (2010) for a 5.9 m3
Teflon chamber. Forn-alkanes, 1-alkenes, 2-alcohols and 2-ketones,Cw/
(Mwγw,i
)was 9, 20, 50 and 120 µmol m−3, re-
spectively.k∗g,w varied between 1/3600 and 1/480 s−1 de-
pending on the type of compound.
kw,g,i =kg,w
(RT/p0,iCw/(Mwγw,i
) (4)
d[Xi,w
]dt
=(kg,w
[Xi,g,w
]− kw,g,i
[Xi,w
]) Vwall
Vchamber(5)
d[Xi,g,w
]dt
= −kg,w[Xi,g,w
]+ kw,g,i
[Xi,w
](6)
According to Eq. (4), a compound withp0 = 2.5× 10⁻² PaandCw/
(Mwγw,i
)= 10 µmol m−3 partitions∼ 50 % to the
gas phase and∼ 50 % to the chamber walls at equilib-rium and room temperature. At equilibrium, compoundswith a vapour pressure< 10−3 Pa andCw/
(Mwγw,i
)>
10 µmol m−3 will almost exclusively be found at the wallsif they are not able to form SOA rapidly enough. Hence, theSOA formation in the smog chamber will depend on (1) theformation rate of condensable organic compounds, (2) theparticle deposition losses, (3) the magnitude of the conden-sation sink to the particles in the air and onto the chamberwalls, and (4) the diffusion-limited uptake onto the chamberwalls and particles on the walls.
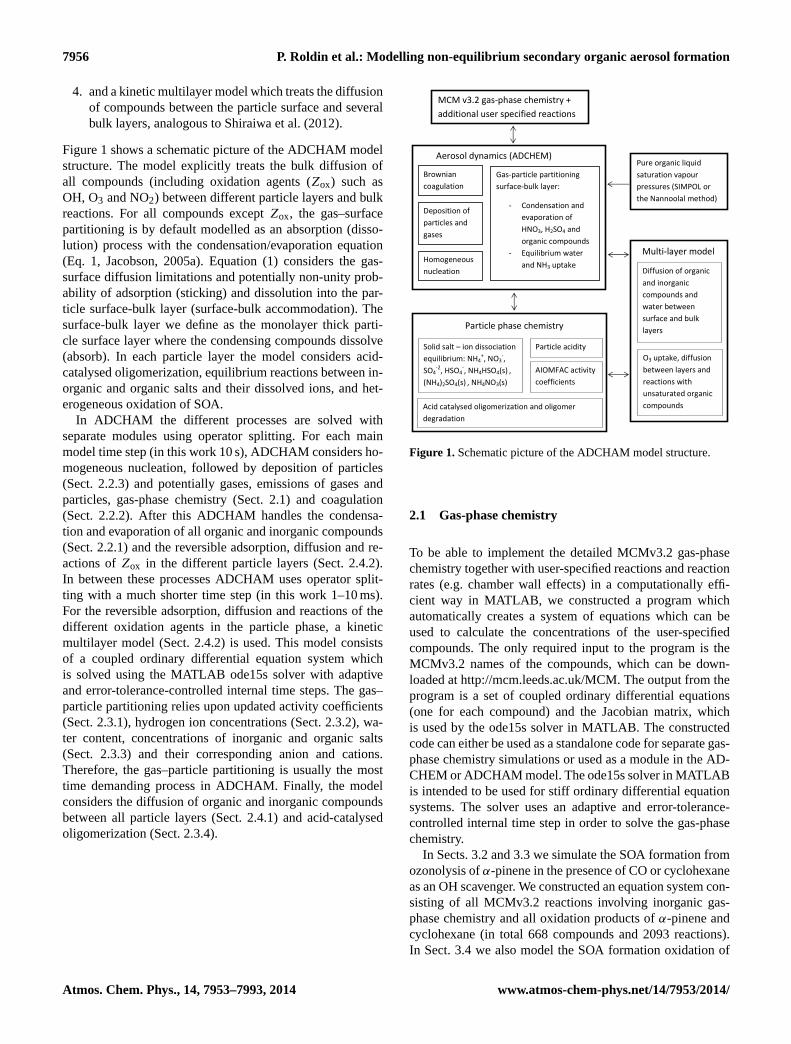
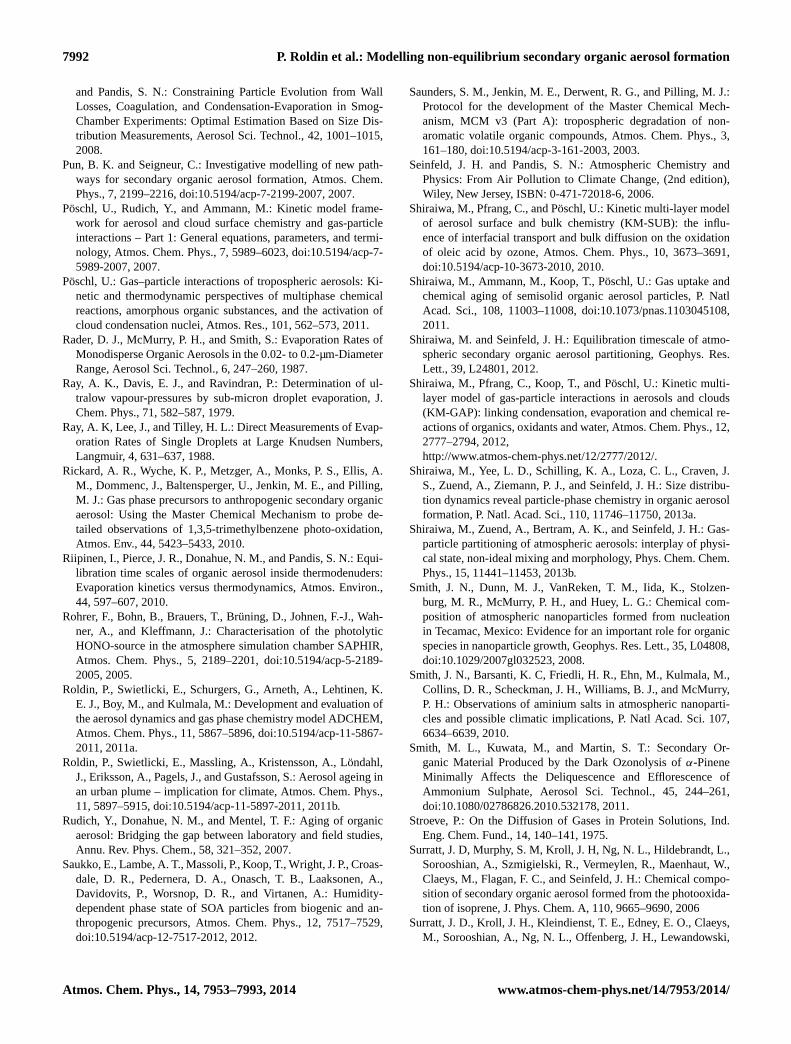
The concentration gradient in the laminar layer adjacentto the chamber walls generally drives condensable gas-phasecomponents from the well-mixed chamber volume to thechamber walls (thin model layer next to the wall). We explic-itly model this mass transfer with Fick’s first law of diffusion,assuming a linear concentration gradient across the laminarlayer next to the chamber wall (see Fig. 2).
86
1
Figure 2. Schematic figure which illustrates how ADCHAM treat the diffusion limited mass 2
transfer of gas phase compounds across a laminar layer next to the chamber walls. The thin (1 3
mm thick) air layer next to the chamber walls is treated as a separate volume which exchange gas 4
phase compounds with the well mixed chamber and the walls + wall deposited particles. 5
Laminar
layer
1 mm layer in direct
contact with the
chamber walls and the
particles deposited on
the walls
Well mixed
chamber volume
Concentration gradient
Figure 2. Schematic figure which illustrates how ADCHAM treatsthe diffusion-limited mass transfer of gas-phase compounds acrossa laminar layer next to the chamber walls. The thin (1 mm thick)air layer next to the chamber walls is treated as a separate volumewhich exchanges gas-phase compounds with the well-mixed cham-ber and the walls+ wall-deposited particles.
In Sect. 3.4 we study how different values of the laminarlayer width influence the model results. The gas-phase chem-istry and the gas–particle mass transfer (condensation) in thewell-mixed chamber volume and in the thin layer adjacent tothe chamber wall were solved using operator splitting witha model time step of 10 ms. The mass transfer between thewell-mixed chamber volume and the thin layer next to thechamber wall was modelled with a time step of 0.1 ms. Themodel needs to take short time steps because of the large con-densation sink (or evaporation source) of the wall-depositedparticles and the Teflon surfaces, which may rapidly alter theconcentrations in the thin air layer next to the chamber walls.
In Sect. 3.2 we evaluate the potential influence of the re-versible uptake of organic compounds to the smog chamberTeflon walls on the volatility and evaporation rates of SOAparticles. In Sect. 3.4 we test the capability of ADCHAM tosimulate the losses of organic compounds from the gas phaseto the Teflon walls and wall-deposited particles.
2.2.4 Size distribution structures
Analogous to ADCHEM (Roldin et al., 2011a) ADCHAMinclude several methods (fully stationary, fully moving andmoving centre) in order to treat the changes in the parti-cle number size distribution upon condensation/evaporationor coagulation. These methods are all mass- and number-conserving and have different advantages and disadvantages(Korhonen, et al. 2004; Jacobson, 2005a; Roldin et al.,2011a). For all simulations performed in this article, we haveused the fully moving method for condensation and evapo-ration. With this method the diameter grid moves with theparticles. Hence, this method has no numerical diffusionproblems when particles grow by condensation or shrinkby evaporation. Homogeneous nucleation is considered byadding new particle size bins when new particles are formed
7960 P. Roldin et al.: Modelling non-equilibrium secondary organic aerosol formation
(Sects. 3.2 and 3.3). For coagulation we use a fully station-ary method in which the formed particles mass and numberconcentrations are split between the existing diameter bins(Sect. 2.2.2).
2.3 Particle-phase chemistry
2.3.1 Activity coefficients and organic–inorganicinteractions
The AIOMFAC model is based on the UNIFAC (UNIquacFunctional group Activity Coefficients) model for organicmixtures but also considers organic–inorganic interactionwhich allows us to study salt effects on the SOA formation.AIOMFAC (Aerosol Inorganic-Organic Mixtures Functionalgroups Activity Coefficients) considers interactions between12 different ions (including NH+4 , NO−
3 , H+, SO−24 and
HSO−
4 ) and alkyls, hydroxyls, carboxyls, ketones, aldehydes,ethers, esters, alkenyls, aromatic carbon alcohols and aro-matic hydrocarbons (Zuend et al., 2008, 2011). For other im-portant functional groups, i.e. nitrates, nitros, PANs and per-oxides, we only consider organic–organic functional groupinteractions. In total the model considers 52 different UNI-FAC functional subgroups, with interaction parameters fromHansen et al. (1991), except for alcohols (Marcolli and Pe-ter, 2005) and nitrates, PANs and peroxides, for which weuse the parameterization from Compernolle et al. (2009).In ADCHAM, the activity coefficients are calculated be-fore the condensation algorithm is used and when updatingthe hydrogen ion concentration ([H+]) for the acid-catalysedoligomerization.
2.3.2 Acidity and dissociation of inorganic compoundsin organic-rich phases
The hydrogen ion concentration is calculated in the con-densation algorithm and when considering acid-catalysedoligomerization. Analogous to the procedure in ADCHEM(Roldin et al., 2011a), [H+] in the particle water or particlewater+ organics phase is calculated by solving the ion bal-ance equation (Eq. 7). In ADCHAM we have extended theion balance equation with dissociation products of carboxylicacids (RCOO−). In this work we assume that all carboxylicacids have identical dissociation constants (see Sect. 3.2).Hence, [RCOO−] in Eq. (7) represents the total concentra-tion (mol kg−1 solvent) of dissociated carboxylic acids.
[H+]+
[NH+
4
]+[Na+
]=[NO−
3
]+2
[SO2−
4
]+
[HSO−
4
](7)
+[Cl−] + [OH−] +
[HCO−
3
]+ 2
[CO2−
3
]+ [RCOO−
]
In order to calculate [H+], all concentrations exceptthe hydrogen ion concentration in Eq. (7) are replacedwith known equilibrium coefficients, activity coeffi-cients from AIOMFAC, and the total concentration
of dissolved dissociated and non-dissociated com-pounds, ([RCOOH]+ [RCOO−]), ([NH3(aq)]+ [NH+
4 ]),([SO2−
4 ] + [HSO−
4 ]), ([HNO3] + [NO−
3 ]) and ([HCl(aq)]+[Cl−]). In this work the uptake of CO2 in the particles wastreated as an equilibrium process. The HCO−
3 and CO2−
3concentrations depend on the hydrogen ion concentrationand the CO2 partial pressure (390 ppbv). When all unknownion concentrations have been replaced with the knownparameters, Eq. (7) becomes an eight-order polynomialwith [H+] as the only unknown variable. The hydrogen ionconcentration is given by the maximum real root of thispolynomial.
To treat the CO2 uptake as an equilibrium process maynot be realistic if the particles are very viscous (see Sect. 1).However, the estimated diffusion coefficients of other small“guest” molecules (e.g. O3, OH and H2O) in an amorphousglassy organic matrix is of the order of 10−10–10−12 cm2 s−1
at room temperature (Koop et al., 2011; Zobrist et al., 2011).This gives corresponding e-folding times of equilibration forsubmicron particles in the range of seconds.
All experiments which we model in this paper were per-formed under dry conditions (RH≤ 5 %). For theα-pineneSOA experiments (Sects. 3.2–3.3), the modelled particle wa-ter mass content is only∼ 0.4 % at an RH of 5 %. For theseparticles the solvent will therefore mainly be the organiccompounds and not water. Hence, in this work the concen-trations of the inorganic ions (including H+) is not given forthe aqueous phase but for the combined organics and wa-ter phase. Henry’s law coefficients (KH) of inorganic com-pounds and dissociation rates (Ka) of inorganic compoundsand carboxylic acids are (if at all) usually only available foraqueous solutions. However, there is often a relationship be-tween the1pKa (−log10(Ka,base) + log10(Ka,acid)) and theproton transfer between the Brønsted acid and the Brønstedbase in protic ionic liquids (Greaves and Drummond, 2008).Thus, for most of the simulations we will use the aqueous dis-sociation rates and Henry’s law coefficients for the organicamorphous SOA and water mixtures, and take into accountthe non-ideal interactions between the ions, organic solventsand water using AIOMFAC (Sect. 2.3.1). However, we willalso test to model the ammonium uptake with 10-times-lowerHenry’s law coefficients, which may be more appropriate fororganic solvents.
With these assumptions in mind, the modelled absolutevalues of [H+] should be interpreted with caution. However,we believe that the model can give a realistic representationof the relative influence of different types of dissolved com-pounds on the particle acidity. For instance, carboxylic acidswill most likely increase [H+] also in an organic-rich phase,while dissolved ammonia will decrease [H+]. For all otherorganic compounds except the carboxylic acids, the disso-ciation rates were assumed to be equal to that of pure wa-ter (pKa = 14). Hence, equivalent to aqueous solutions, the
P. Roldin et al.: Modelling non-equilibrium secondary organic aerosol formation 7961
acidity will mainly be governed by the carboxylic acids andinorganic compounds.
2.3.3 Inorganic and organic salt formation
In ADCHAM the inorganic salts (NH4)2SO4, NH4HSO4 andNH4NO3 and the organic salts of ammonium and differentcarboxylic acids (NH4RCOO) can be considered to form.All these salts contain NH+4 , and which of these salts willbe formed depends on the solubility constants, the ammo-nium concentration, the concentration of the different anionsand the activity coefficients. Because all these salts containammonium, the salt which forms first will limit the forma-tion of other salts. In this work, we only simulate experi-ments performed on pure organic particles or organic parti-cles which take up NH3(g). Hence, NH4RCOO(s) was theonly (solid) salt which was considered to be formed in theparticle organics–water phase. The solid salt concentrationsare updated iteratively at every time step in which the con-densation/evaporation algorithm is used.
When updating the NH4RCOO(s) concentration, AD-CHAM starts by estimating the activity coefficients andthe hydrogen ion concentration (Eq. 7). After this, non-equilibrium NH+
4 and RCOO− concentrations ([NH+4 ]∗ and[RCOO−]∗) can be derived, and the total concentrationsof NH4 ([NH4,tot] = [NH+
4 ]∗+[NH4RCOO]t−1) and RCOO([RCOOtot] = [RCOO−]∗ + [NH4RCOO]t−1) are estimated.These values are then inserted into the solubility prod-uct equation (Eq. 8). Rearranging Eq. (8) gives a second-order polynomial where the new NH4 RCOO concentration([NH4RCOO]t ) is given by the smallest positive real root. Fi-nally the NH+
4 and RCOO− concentrations are updated andthe iteration starts from the beginning by deriving the hydro-gen ion concentration again. The iteration proceeds until therelative change in the NH+4 , RCOO− and H+ concentrationsall are less than 10−3 within one iteration step. The activitycoefficient of the dissociated carboxylic acids (γRCOO) wasassumed to be equal to the activity coefficient of undissoci-ated pinonic acid.
KNH4RCOO=γNH4γRCOO[NH+
4
][RCOO−
] (8)
=γNH4γRCOO([NH4,tot] − [NH4RCOO]
)(RCOOtot − [NH4RCOO])
2.3.4 Acid-catalysed oligomerization
Any oligomerization mechanisms in the gas phase (g) or par-ticle phase (p) (including different functional groups, ozonol-ysis, acid-catalysed reactions, and radicals) can easily be im-plemented in ADCHAM. For the applications in this work,we only consider the reactions between monomers whichform dimers and not the possible reactions between dimersand dimers with monomers. The acid-catalysed formationrate of a dimer in the particle phase can generally be con-sidered to be proportional to the hydrogen ion concentra-tion (see e.g. schemes by Tolocka et al., 2004, and Iinuma
et al., 2004). In contrast to thermodynamic equilibrium mod-els (e.g. Barsanti and Pankow, 2004), ADCHAM explicitlytreats the kinetics of reversible dimerization with separateReactions (R1) and (R2) for the formation and the degra-dation of dimers back to monomers. Based on observations,several different particle-phase oligomerization mechanismshave been suggested. These include (i) esters formed from re-actions between carboxylic acids and alcohols (e.g. Surratt etal., 2006), (ii) hemiacetal formation from reactions betweencarbonyls and alcohols (e.g. Iinuma et al., 2004), (iii) aldolreaction products formed from carbonyl–carbonyl reactions(Casale et al., 2007) and (iv) peroxyhemiacetals formed fromreactions between hydroperoxides and carbonyls (e.g. To-bias and Ziemann, 2000). Dimers can also form when car-bonyls react with ozone in the particle phase and form sec-ondary ozonides (Reaction R3) which then rapidly react withother organic compounds and form dimers (Maksymiuk etal., 2009). Based on thermodynamic calculations of differ-ent organic mixtures, it has been suggested that ester for-mation (Barsanti and Pankow, 2006) and peroxyhemiacetalformation (DePalma et al., 2013) can be thermodynamicallyfavourable, while hemiacetal formation is not (Barsanti andPankow, 2004 and DePalma et al., 2013).
If peroxyhemiacetal and hemiacetal formation are ther-modynamically favourable, then these mechanism are prob-ably rapid enough to form substantial dimer mass onshort timescales (minutes to hours). The second-orderrate constants (kf) for uncatalysed reactions of differ-ent hydroperoxides and aldehydes to form peroxyhemi-acetals range from 0.5 to 70 M−1 h−1 (2.3× 10⁻²⁵–3.2×
10−23 molecules−1 cm3 s−1) (Ziemann and Atkinson, 2012).According to Ziemann and Atkinson (2012) peroxyhemiac-etal formation can probably be acid-catalysed. Thus, for acidparticles,kf may be larger than the values reported by Zie-mann and Atkinson (2012). Shiraiwa et al. (2013a) foundthat in order for the KM-GAP model to capture the tempo-ral evolutions of the SOA formation and shape of the particlenumber size distribution during an dodecane photooxidationexperiment, the peroxyhemiacetal formation rate needs to be12 M−1 s−1 (2×10⁻²⁰ molecules−1 cm3 s−1). This high for-mation rate can be attributed to the presence of carboxylicacids (Shiraiwa et al., 2013a). The formation of hemiac-etal from the reaction between acetaldehyde and methanol isacid-catalysed with a third-order reaction-specific formationrate constant (kf,H+) equal to 4.9× 10⁶ M−2 h−1 (Ziemannand Atkinson, 2012). With a pH of 4, this corresponds to akfof 2.3× 10⁻²² molecules−1 cm3 s−1.
7962 P. Roldin et al.: Modelling non-equilibrium secondary organic aerosol formation
(e.g. Kroll and Seinfeld, 2008; Ng et al., 2008) (Reac-tion R4). Recently, Ehn et al. (2014) also showed that ex-tremely low volatility organic compounds (ELVOC) canform during ozonolysis ofα-pinene. The authors proposethat ELVOC is formed from RO2, which rapidly takes up O2after intramolecular hydrogen abstraction in several steps.
RO2(g) + RO2(g) −→ ROOR-type peroxides(g) (R4)
The acid-catalysed dimer formation rates in the parti-cle phase (Ff(p)) between monomer (denoted by indexi and j) depend on the monomer concentrations,kf,H+
(molecules−2 cm6 s−1) and the hydrogen ion concentration(cH+) (Eq. 9). If the dimerization process is uncatalysed,the formation rate depends on the monomer concentrationsand a second-order rate constant (kf (molecules−1 cm3 s−1)).The degradation rate (Fd(p)) of a dimer (denoted by in-dex q) simply depends on the dimer concentration and adimer-specific first-order degradation reaction rate constant(kd (s−1)) (Eq. 10).
Ff,i,j (p) = kf,H+ (p)cH+ (p)cm,i (p)cm,j (p) (9)
Fd,q (p) = kd (p)cd,q (p) (10)
The temporal evolution of the dimer and the monomer con-centrations (cd andcm) in the particle bulk layers and surface-bulk layer are derived with a kinetic model. This codesolves a coupled ordinary differential equation system, con-sisting of one ordinary differential equation for each SOAmonomer (Eq. 11) and one ordinary differential for eachdimer (Eq. 12). The equations are given by the sum of alldimer degradation and formation rates for the individual re-actions which each monomer compound is involved in.
dcm,i
dt=
Z∑q=1
(Fd,qxm,i,q) −
N∑j=1
Ff,i,j (11)
dcd,q
dt= −Fd,q +
M∑i=1
(
N∑j=1
Ff,i,j )xd (12)
xm,i,q =
N∑j=1
Ff,i,j/
M∑i=1
(
N∑j=1
Ff,i,j ) (13)
In order to not end up with an enormous coupled ordinarydifferential equation system, the different dimers are classi-fied into different categories (types) depending on the dimer-ization mechanism (e.g. esters or peroxyhemiacetal forma-tion). Secondary ozonide formation (Reaction R3) is treatedby the kinetic multilayer module for heterogeneous oxidation(see Sect. 2.4.2). In order to be mass-conserving, the numberof moles of dimer formed is corrected with the molar ratio(xd) between the molar mass of the product(s) and the sum ofthe molar masses of the reacting compounds. In ADCHAMall dimers have by default a molar mass of 400 g mol−1.
When we lump the dimers into different categories, the in-formation about their exact chemical composition and originis lost. This can be a problem when considering the reversiblereactions back to monomers. In this work we have assumedthat a dimer is converted back to the monomers it is formedfrom, with fractions (xm) corresponding to the (current timestep) relative contribution of each monomer to the dimer for-mation (Eq. 13). This can be a reasonable assumption if themonomer SOA composition does not change substantially ona timescale longer than the lifetime of the dimer. However, ifthis is not the case it can distort the modelled particle compo-sition. With this method we do not take into account that spe-cific compounds of the same type of dimer (e.g. esters) mayhave substantially different formation and degradation rates,e.g. depending on other functional groups in the molecules(Ziemann and Atkinson, 2012). However, in principle themethod still enables an unlimited number of different dimertypes and dimer-specific formation and degradation rates.
The modelled relative amount and composition ofoligomer SOA in each particle layer depends on (1) themonomer SOA composition, (2) the hydrogen ion concen-tration, (3) the dimer formation rates, (4) the oligomer degra-dation reaction rates, (5) possible evaporation and condensa-tion of monomers and dimers (vapour pressures), (6) the mix-ing between different particle layers (diffusion coefficients ofmonomers and dimers), (7) the ozone uptake at the particlesurface, (8) the ozone diffusion rate within the particle bulkphase, (9) the reaction rates of ozone with unsaturated or-ganic compounds in the particle phase, and (10) the time ofaging. Points 1–9 all bear large uncertainties which need tobe constrained in order to represent oligomerization in an ac-curate way. For the model applications in this work we willnot explicitly model the influence of particle acidity on thedimer formation rates because these values are very uncer-tain regardless.
2.4 Kinetic multilayer model
To be able to model the diffusion-limited mass transfer ofozone from the gas–particle interface to the particle core,and the reaction between ozone and the organic compoundsin the particle phase, Shiraiwa et al. (2010) developed thekinetic multilayer model KM-SUB, which is based on thePRA (Pöschl–Rudich–Ammann) concept of gas–particle in-teractions (Pöschl et al., 2007; Ammann and Pöschl, 2007).This model divides the particles into a sorption layer, a quasi-static surface layer, near-surface bulk, and multiple bulk lay-ers and considers the gas-surface transport, reversible adsorp-tion, surface layer reactions, surface-bulk transport, bulk dif-fusion and bulk reactions. Recently, Shiraiwa et al. (2012)extended the kinetic multilayer model to also include con-densation, evaporation and heat transfer (KM-GAP), thermo-dynamics (Shiraiwa et al., 2013b), and simplified gas- andparticle-phase chemistry (Shiraiwa et al., 2013a).
P. Roldin et al.: Modelling non-equilibrium secondary organic aerosol formation 7963
For the oxidation agents we model the uptake to the sorp-tion layer as a reversible adsorption process, followed by dif-fusion to and from the particle surface-bulk and bulk lay-ers. In this work, the partitioning of organic and inorganiccompounds to and from the monolayer thick particle surface-bulk layer is modelled as a condensation/evaporation pro-cess (Eq. 1), taking into account the possibility of non-unitysurface-bulk accommodation (Sect. 2.2.1). However, in prin-ciple ADCHAM could also model the gas–particle partition-ing of organic and inorganic compounds as a reversible ad-sorption process. Analogous to KM-SUB and KM-GAP, AD-CHAM explicitly treats the bulk diffusion of all compoundsbetween the different layers using first-order mass transportrate equations.
The kinetic multilayer model in ADCHAM consists oftwo separate modules. The first module (Sect. 2.4.1) treatsthe diffusion of all organic and inorganic compounds (exceptZox) between the different bulk layers. The second module(Sect. 2.4.2) considers the uptake, diffusion and reactions ofZox with the organic compounds in the particle phase. Themain reason why these processes are treated by two sepa-rate modules is that the uptake, diffusion and reaction of O3and other oxidation agents generally occur on substantiallyshorter timescales than the diffusion of the organic com-pounds.
2.4.1 Diffusion of organic and inorganic compounds
The transport velocity of compoundXi between the bulk lay-ers or the surface and first bulk layer is given by Eq. (14). DXi
is the diffusion coefficient of compoundXi , andδk andδk+1represent the width of the two adjacent layers (k andk + 1)whichXi is transported between.
kk+1,k,Xi= kk,k+1,Xi
=4DXi
π (δk+1 + δk)/2(14)
The transport of compound Xi between the particle layers(including the exchange between the surface- and first bulklayer) is modelled with Eq. (15). Ak is the area of exchangebetween layerk−1 andk.
[VXi
]k
is the absolute volume con-centration (m3) and[Xi ]k is the relative volume concentra-tion (volume fraction) of compoundXi in layerk. The totalvolume of each particle layer (Vk) is given by the sum ofthe absolute volume concentrations of all compounds. Equa-tion (16) contains no terms for the chemical formation anddegradation ofXi because this is considered by separatemodules for oligomerization (Sect. 2.3.4), heterogeneous ox-idation (Sect. 2.4.2) and organic salt formation (Sect. 2.3.3).
d[VXi
]k
dt= (kk−1,k [Xi ]k−1 − kk,k−1 [Xi ]k)Ak (15)
+(−kk,k+1 [Xi ]k + kk+1,k [Xi ]k+1
)Ak+1
The equations describing the concentration change of allcompounds in all layers (Eq. 15) comprise a system ofN ×
87
1
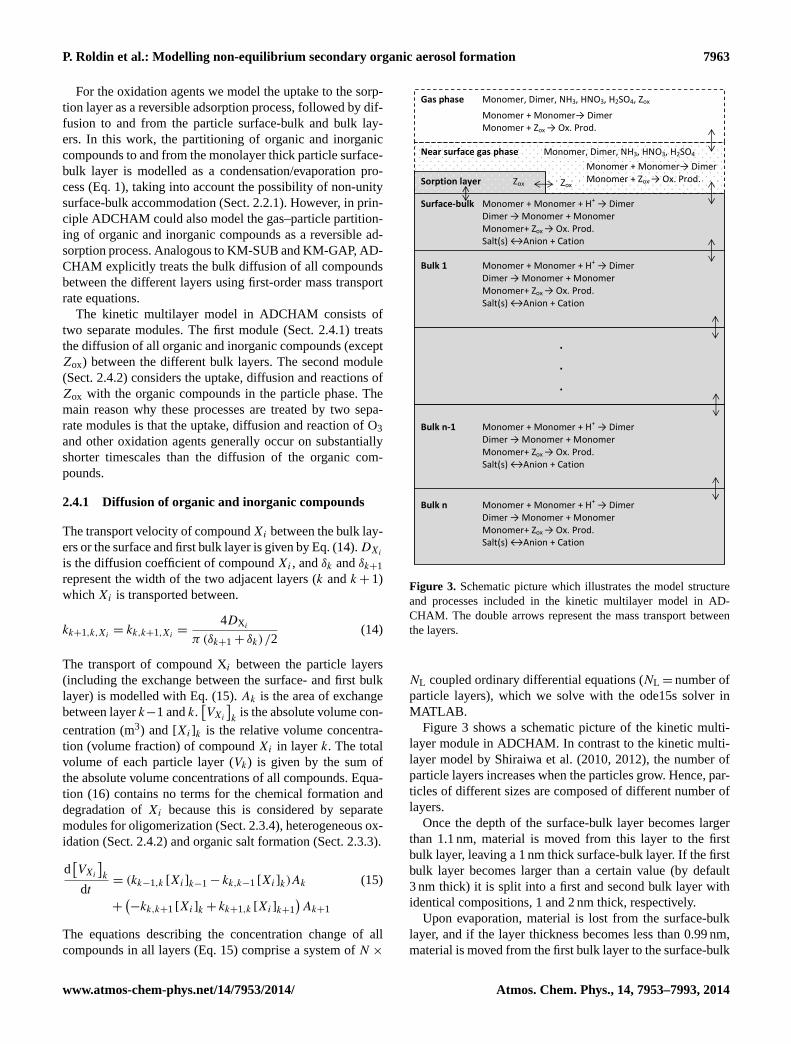
Figure 3. Schematic picture which illustrates the model structure and processes included in the 2
kinetic multilayer model in ADCHAM. The double arrows represent the mass transport between 3
the layers. 4
5
Gas phase Monomer, Dimer, NH3, HNO3, H2SO4, Zox
Near surface gas phase Monomer, Dimer, NH3, HNO3, H2SO4
Surface-bulk Monomer + Monomer + H+ → Dimer
Dimer → Monomer + Monomer
Monomer+ Zox → Ox. Prod.
Salt(s) ↔Anion + Cation
Sorption layer Zox
Monomer + Monomer→ Dimer
Monomer + Zox → Ox. Prod.
Monomer + Monomer→ Dimer
Monomer + Zox → Ox. Prod.
Bulk 1 Monomer + Monomer + H+ → Dimer
Dimer → Monomer + Monomer
Monomer+ Zox → Ox. Prod.
Salt(s) ↔Anion + Cation
.
.
.
Bulk n-1 Monomer + Monomer + H+ → Dimer
Dimer → Monomer + Monomer
Monomer+ Zox → Ox. Prod.
Salt(s) ↔Anion + Cation
Bulk n Monomer + Monomer + H+ → Dimer
Dimer → Monomer + Monomer
Monomer+ Zox → Ox. Prod.
Salt(s) ↔Anion + Cation
Zox
Figure 3. Schematic picture which illustrates the model structureand processes included in the kinetic multilayer model in AD-CHAM. The double arrows represent the mass transport betweenthe layers.
NL coupled ordinary differential equations (NL = number ofparticle layers), which we solve with the ode15s solver inMATLAB.
Figure 3 shows a schematic picture of the kinetic multi-layer module in ADCHAM. In contrast to the kinetic multi-layer model by Shiraiwa et al. (2010, 2012), the number ofparticle layers increases when the particles grow. Hence, par-ticles of different sizes are composed of different number oflayers.
Once the depth of the surface-bulk layer becomes largerthan 1.1 nm, material is moved from this layer to the firstbulk layer, leaving a 1 nm thick surface-bulk layer. If the firstbulk layer becomes larger than a certain value (by default3 nm thick) it is split into a first and second bulk layer withidentical compositions, 1 and 2 nm thick, respectively.
Upon evaporation, material is lost from the surface-bulklayer, and if the layer thickness becomes less than 0.99 nm,material is moved from the first bulk layer to the surface-bulk
7964 P. Roldin et al.: Modelling non-equilibrium secondary organic aerosol formation
layer in order to keep the surface-bulk layer width intact. Ifthe first bulk layer width becomes less than a certain value(by default 0.8 nm), this layer is merged together with thesecond bulk layer, and together they form a new first bulklayer. The rest of the particle bulk is divided into layerswith variable width. The layer width depends on the netmass transport to the adjacent layers and chemical reactions(e.g. between O3 and unsaturated hydrocarbons).
In each particle layer the model considers differentoligomerization reactions and the equilibrium reactions be-tween salts and their dissolved ions in the organic+ waterphase (Sects. 2.3.3 and 2.3.4). The formed oligomers andsalts make up a particle volume fraction (fp) with gen-erally substantially lower diffusivity than the rest of thecompounds. Hence, oligomerization and solid salt forma-tion increases the viscosity, which also limits the diffusionof the liquid compounds according to the obstruction the-ory (Stroeve, 1975). The treatment of the oligomers as solidnon-diffusing compounds which limit diffusion of the liquidcompounds was adopted from Pfrang et al. (2011), who usedKM-SUB to model degradation of an organic 12-componentmixture with ozone.
According to the obstruction theory the diffusivity of com-poundXi (DXi
) is a function of the fraction of solid or semi-solid material and the diffusivity (D0,Xi
) without any solidor semi-solid material (Eq. 16). The diffusivity of organiccompounds can vary from∼ 10−5 cm2 s−1 in a liquid to∼ 10−20 cm2 s−1 in a solid organic matrix (Shiraiwa et al.,2011).
DXi= D0,Xi
(2− 2fp
)/(2+ fp
)(16)
2.4.2 Diffusion of oxidation agents and reactionswith SOA
The diffusion of oxidation agents (Zox) between the particlebulk layers is similar to the treatment of other compounds(Eqs. 14 and 15), except that we do not consider that the dis-solvedZox in the particle phase takes up a bulk volume of itsown.
The uptake ofZox from the gas phase to the particle sur-face is treated as a reversible adsorption process (Fig. 3). Thisapproach was adopted from Shiraiwa et al. (2010). The sur-face accommodation coefficient ofZox is given by Eq. (17).θs,Zox is the relative coverage of adsorbedZox on the parti-cle surface. The adsorption ofZox from the near-surface gasphase (gs) to the sorption layer (so) and the desorption fromthe sorption layer to the near-surface gas phase are given byEqs. (18) and (19), respectively.ωZox is the mean thermalvelocity ofZox andτd,Zoxis the desorption lifetime ofZox.
The transport velocity ofZox from the surface-bulk layerto the sorption layer is given by Eq. (20). δs is the width ofthe monolayer thick surface-bulk layer anddZoxis the widthof the sorption layer. Hence,
(δs + dZox
)/2 in Eq. (20) repre-
sents the average travel distance between the sorption andsurface-bulk layer. The transport velocity ofZox from the
sorption layer to the surface-bulk layer can then be calcu-lated from Eq. (21). KH,Zox is the Henry’s law coefficient ofZox.
αs,Zox = αs,0,Zox
(1− θs,Zox
),θs,Zox =
[Zox]sod2Zox
π
4(17)
Jads,Zox = [Zox]gsωZoxαs,Zox/4 (18)
Jdes,Zox = τ−1d,Zox
[Zox]so (19)
ksu,so,Zox ≈4DZox
π(δs+ dZox
)/2
(20)
kso,su,Zox =4ksu,so,ZoxKH,Zoxτ
−1d,Zox
αs,ZoxωZox
T R (21)
Equations (22)–(24) form a differential equation systemwhich describes the rate of change of theZox concentrationin the particle sorption layer, particle surface-bulk layer, andparticle bulk layers. The chemical oxidation reactions be-tweenZox and the organic compounds (Xi) are representedby the last term in Eqs. (23) and (24), where the summation isover all compounds which react and consumeZox in the par-ticle phase. The module also calculates the temporal evolu-tion of the organic compounds (Xi) consumed byZox and theorganic compounds formed from the oxidation reactions (Yi)(Eqs. 25 and 26). The diffusion of these compounds is treatedby the kinetic multilayer module described in Sect. 2.4.1.
P. Roldin et al.: Modelling non-equilibrium secondary organic aerosol formation 7965
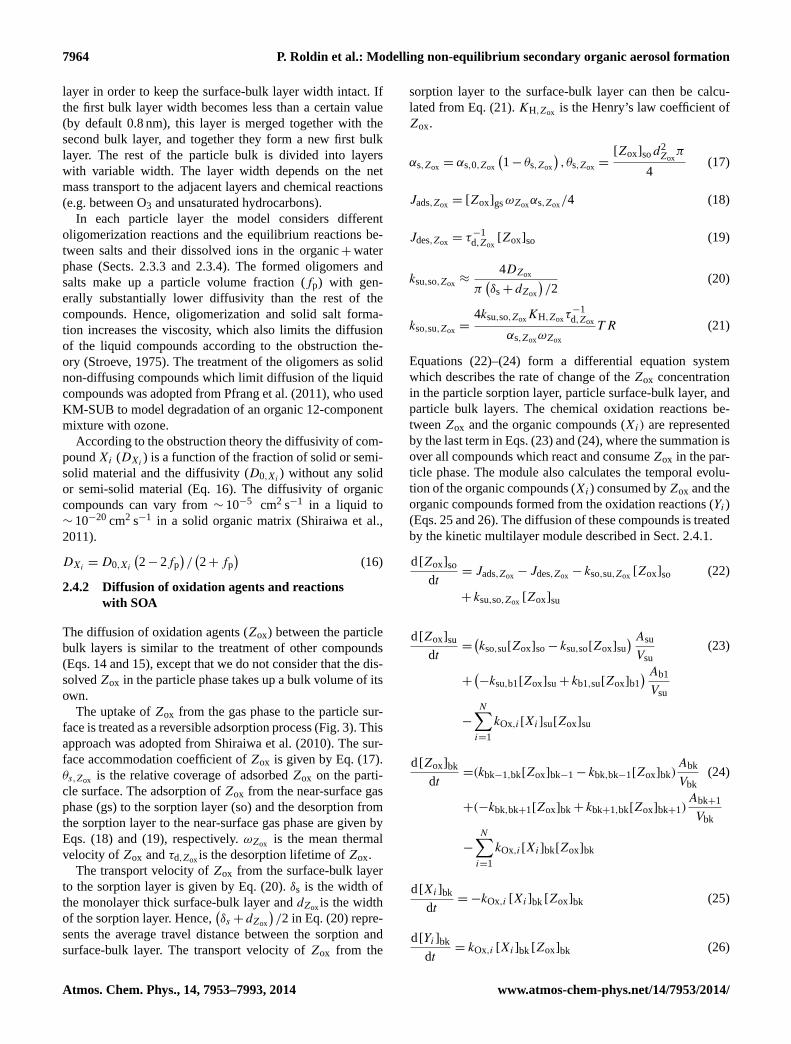
Table 1.Model parameters used in the multilayer module for O3 uptake, diffusion and reactions in the particle phase.
Parameter Definition Value
αs,0,O3 Surface accommodation coefficient of O3 on a free substrate 1a
τd,O3 O3 desorption lifetime 10−9a
KH,O3 (mol m3 Pa−1) Henry’s law coefficient of O3 4.7× 10⁻³a,b
D0,O3 (cm2 s−1) Bulk diffusion coefficient O3 without obstruction VariableωO3 (cm s−1) Mean thermal velocity O3 3.6× 10⁴a
dO3 (nm) Effective diameter cross section O3 0.4a
kO3 (mol−1 cm3 s−1) Reaction rate constant between O3 and organic comp. Variable
a Values from Pfrang et al. (2011).b Different unit than in Pfrang et al. (2011).
Table 1 gives the values of different parameters used in themultilayer module for ozone uptake, diffusion and reactionswithin the particle phase. Most of the values were adoptedfrom Table 1 in Pfrang et al. (2011).
The coupled ordinary differential equation system describ-ing the temporal evolution ofZox and the concentration ofcompounds which are consumed or formed from theZox ox-idation is solved with the ode15s solver in MATLAB.
3 Model applications
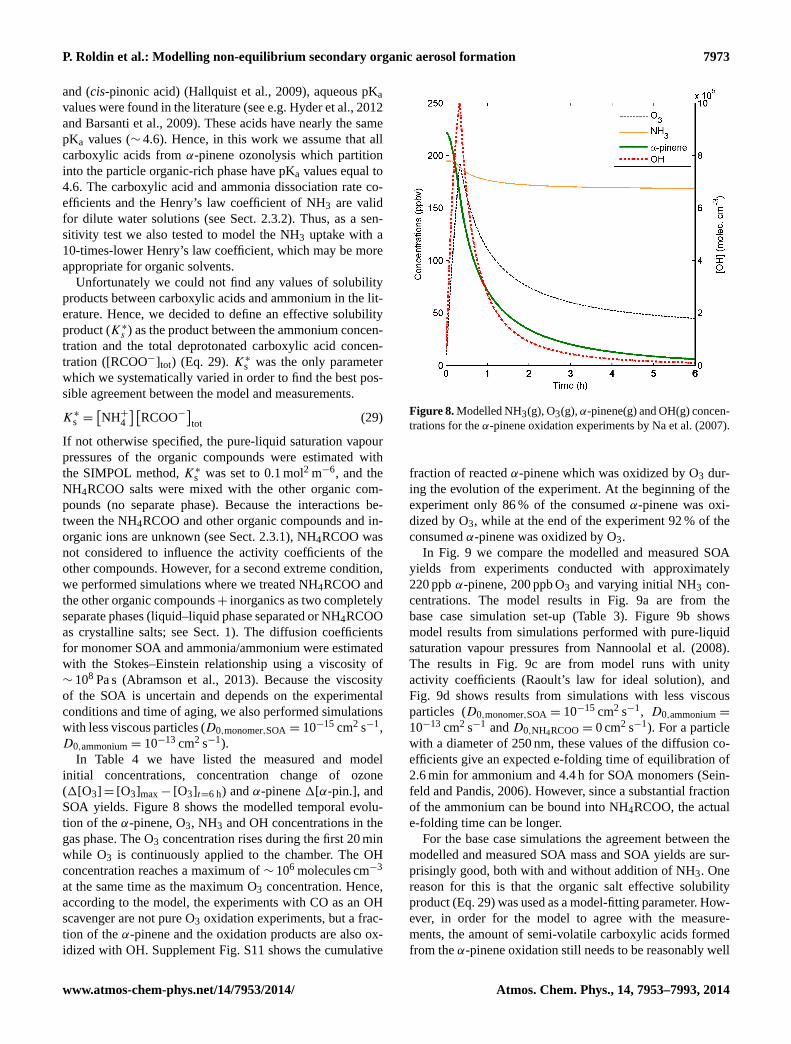
In order to test and illustrate the capability of ADCHAM, weapply the model to four types of published experimental re-sults. In Sect. 3.1 we model the evaporation experiments ofliquid DOP particles presented in Vaden et al. (2011), whichhave been modelled by Shiraiwa et al. (2012) with the KM-GAP model. In Sect. 3.2 we model the evaporation experi-ments ofα-pinene SOA particles by Vaden et al. (2011). InSect. 3.3 we model the SOA formation, ammonia uptake, andorganic salt (NH4RCOO) formation in theα-pinene–NH3–O3 experiments by Na et al. (2007). Finally, we apply AD-CHAM to anm-xylene oxidation experiment from Nordin etal., 2013 (Sect. 3.4). These examples serve to illustrate thewide applicability of ADCHAM.
For the simulations in Sects. 3.2–3.3 we model the conden-sational growth of particles formed by homogeneous nucle-ation using the condensation module described in Sect. 2.2.1using the fully moving method (see Sect. 2.2.4). We startwith one particle size and add new particle size bins duringthe early stage of particle formation. The new particles areassumed to be composed of non-volatile SOA material andare introduced into the model at an initial diameter of 5 nm.Hence, in this work we do not treat the initial activation andgrowth of the formed molecular clusters. The new particleformation rate (J5nm) is assumed to be constant during theexperiments. A new size bin is added for the time step whenthe smallest particle size grows larger than 10 nm in diameter.For the experiments which we simulate in this work, the SOAmass (condensation sink) increases rapidly during the earlystage of SOA formation. This effectively prevents the newly
formed particles from growing and thus generally keeps thenumber of model particle size bins down to∼ 20 (see Fig. S2in the Supplement).
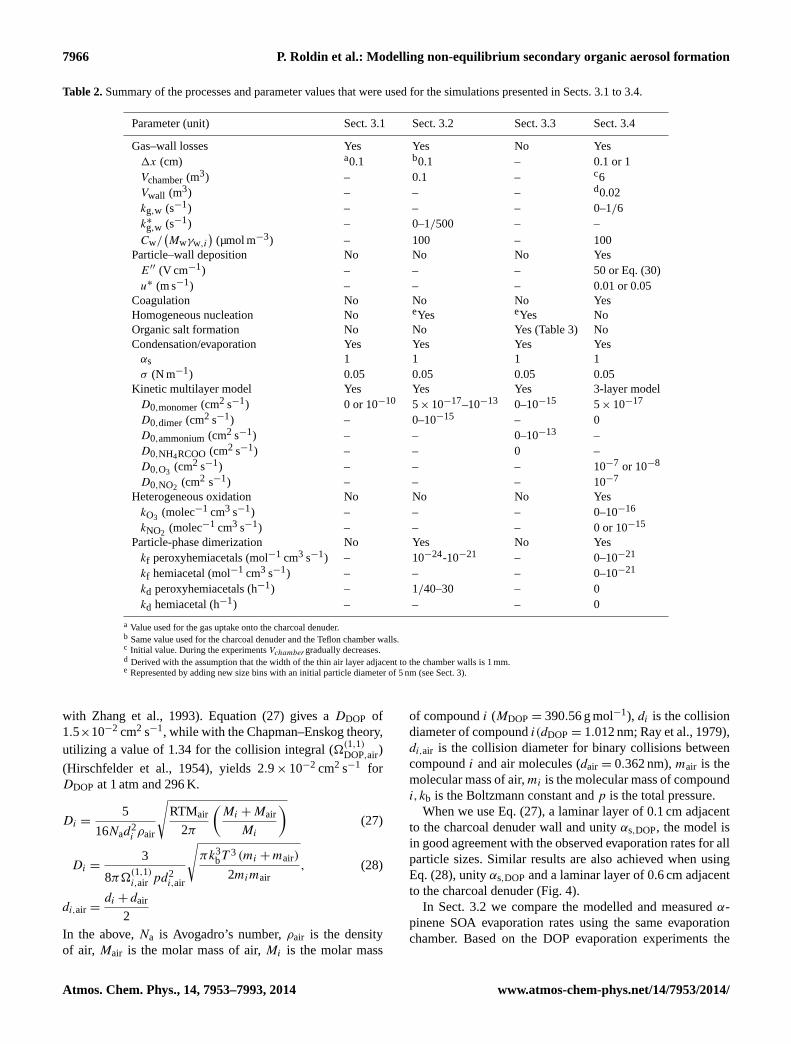
Table 2 summarizes the different processes and rangeof parameter values used for the different simulations inSects. 3.1–3.4.
3.1 Simulations of DOP particle evaporation
Before modelling complex multicomponent SOA particleformation, growth and evaporation, we test ADCHAM on theevaporation experiments of single-component, liquid DOPparticles (Vaden et al., 2011). In the study of Vaden et al.(2011), the particles were evaporated in a 7 L chamber with1 L of activated charcoal at the bottom of the chamber. Theparticle number concentration was kept low (∼ 150 cm−3)in order to keep the gas-phase concentration close to zero.Before the aerosol was introduced into the chamber, it waspassed through two charcoal denuders in order to removemost of the gas-phase DOP (Vaden et al., 2011).
Here we adopt the approach from Shiraiwa et al. (2012),who modelled the gas-phase loss to the charcoal denuder us-ing Fick’s first law, on a laminar layer (1x) adjacent to thecharcoal denuder on the bottom of the chamber. Since thelayer thickness is poorly known, we modelled the DOP(g)loss rate using different1x values. Coagulation and particlewall losses were not considered. In this small chamber, thewall losses can be substantial; however particles depositedon the chamber walls not coated with charcoal will likelycontinue to evaporate and contribute to the gas-phase DOP.Neglecting the particle wall losses has the same effect asassuming that the particles deposited on the walls continueto take up vapours as if they were still suspended in the air(Sect. 2.2.3).
Vaden et al. (2011) and Shiraiwa et al. (2012) used a binarydiffusion coefficient for DOP in air of 4.4× 10⁻² cm2 s−1
from Ray et al. (1988). This value was measured at a pres-sure of 98 Torr (0.13 atm), which is lower than the pressureused in experiments. We have therefore estimated the diffu-sion coefficient (DDOP) with Eq. (27) (Jacobson, 2005a) andwith Eq. (28) (Chapman and Cowling, 1970, in accordance
a Value used for the gas uptake onto the charcoal denuder.b Same value used for the charcoal denuder and the Teflon chamber walls.c Initial value. During the experimentsVchambergradually decreases.d Derived with the assumption that the width of the thin air layer adjacent to the chamber walls is 1 mm.e Represented by adding new size bins with an initial particle diameter of 5 nm (see Sect. 3).
with Zhang et al., 1993). Equation (27) gives aDDOP of1.5×10−2 cm2 s−1, while with the Chapman–Enskog theory,utilizing a value of 1.34 for the collision integral (�
(1,1)DOP,air)
(Hirschfelder et al., 1954), yields 2.9× 10⁻² cm2 s−1 forDDOP at 1 atm and 296 K.
Di =5
16Nad2i ρair
√RTMair
2π
(Mi + Mair
Mi
)(27)
Di =3
8π�(1,1)i,air pd2
i,air
√πk3
bT 3 (mi + mair)
2mimair, (28)
di,air =di + dair
2In the above,Na is Avogadro’s number,ρair is the densityof air, Mair is the molar mass of air,Mi is the molar mass
of compoundi (MDOP = 390.56 g mol−1), di is the collisiondiameter of compoundi(dDOP = 1.012 nm; Ray et al., 1979),di,air is the collision diameter for binary collisions betweencompoundi and air molecules (dair = 0.362 nm),mair is themolecular mass of air,mi is the molecular mass of compoundi,kb is the Boltzmann constant andp is the total pressure.
When we use Eq. (27), a laminar layer of 0.1 cm adjacentto the charcoal denuder wall and unityαs,DOP, the model isin good agreement with the observed evaporation rates for allparticle sizes. Similar results are also achieved when usingEq. (28), unity αs,DOP and a laminar layer of 0.6 cm adjacentto the charcoal denuder (Fig. 4).
In Sect. 3.2 we compare the modelled and measuredα-pinene SOA evaporation rates using the same evaporationchamber. Based on the DOP evaporation experiments the
P. Roldin et al.: Modelling non-equilibrium secondary organic aerosol formation 7967
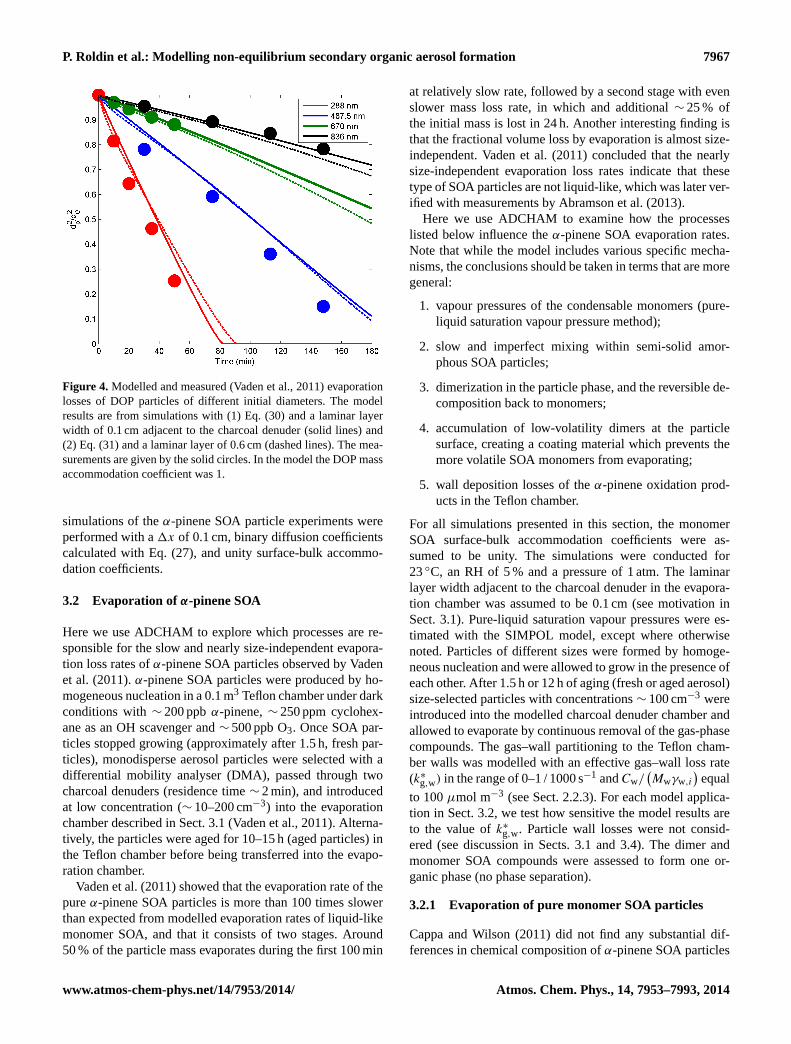
Figure 4. Modelled and measured (Vaden et al., 2011) evaporationlosses of DOP particles of different initial diameters. The modelresults are from simulations with (1) Eq. (30) and a laminar layerwidth of 0.1 cm adjacent to the charcoal denuder (solid lines) and(2) Eq. (31) and a laminar layer of 0.6 cm (dashed lines). The mea-surements are given by the solid circles. In the model the DOP massaccommodation coefficient was 1.
simulations of theα-pinene SOA particle experiments wereperformed with a1x of 0.1 cm, binary diffusion coefficientscalculated with Eq. (27), and unity surface-bulk accommo-dation coefficients.
3.2 Evaporation ofα-pinene SOA
Here we use ADCHAM to explore which processes are re-sponsible for the slow and nearly size-independent evapora-tion loss rates ofα-pinene SOA particles observed by Vadenet al. (2011).α-pinene SOA particles were produced by ho-mogeneous nucleation in a 0.1 m3 Teflon chamber under darkconditions with∼ 200 ppbα-pinene,∼ 250 ppm cyclohex-ane as an OH scavenger and∼ 500 ppb O3. Once SOA par-ticles stopped growing (approximately after 1.5 h, fresh par-ticles), monodisperse aerosol particles were selected with adifferential mobility analyser (DMA), passed through twocharcoal denuders (residence time∼ 2 min), and introducedat low concentration (∼ 10–200 cm−3) into the evaporationchamber described in Sect. 3.1 (Vaden et al., 2011). Alterna-tively, the particles were aged for 10–15 h (aged particles) inthe Teflon chamber before being transferred into the evapo-ration chamber.
Vaden et al. (2011) showed that the evaporation rate of thepureα-pinene SOA particles is more than 100 times slowerthan expected from modelled evaporation rates of liquid-likemonomer SOA, and that it consists of two stages. Around50 % of the particle mass evaporates during the first 100 min
at relatively slow rate, followed by a second stage with evenslower mass loss rate, in which and additional∼ 25 % ofthe initial mass is lost in 24 h. Another interesting finding isthat the fractional volume loss by evaporation is almost size-independent. Vaden et al. (2011) concluded that the nearlysize-independent evaporation loss rates indicate that thesetype of SOA particles are not liquid-like, which was later ver-ified with measurements by Abramson et al. (2013).
Here we use ADCHAM to examine how the processeslisted below influence theα-pinene SOA evaporation rates.Note that while the model includes various specific mecha-nisms, the conclusions should be taken in terms that are moregeneral:
1. vapour pressures of the condensable monomers (pure-liquid saturation vapour pressure method);
2. slow and imperfect mixing within semi-solid amor-phous SOA particles;
3. dimerization in the particle phase, and the reversible de-composition back to monomers;
4. accumulation of low-volatility dimers at the particlesurface, creating a coating material which prevents themore volatile SOA monomers from evaporating;
5. wall deposition losses of theα-pinene oxidation prod-ucts in the Teflon chamber.
For all simulations presented in this section, the monomerSOA surface-bulk accommodation coefficients were as-sumed to be unity. The simulations were conducted for23◦C, an RH of 5 % and a pressure of 1 atm. The laminarlayer width adjacent to the charcoal denuder in the evapora-tion chamber was assumed to be 0.1 cm (see motivation inSect. 3.1). Pure-liquid saturation vapour pressures were es-timated with the SIMPOL model, except where otherwisenoted. Particles of different sizes were formed by homoge-neous nucleation and were allowed to grow in the presence ofeach other. After 1.5 h or 12 h of aging (fresh or aged aerosol)size-selected particles with concentrations∼ 100 cm−3 wereintroduced into the modelled charcoal denuder chamber andallowed to evaporate by continuous removal of the gas-phasecompounds. The gas–wall partitioning to the Teflon cham-ber walls was modelled with an effective gas–wall loss rate(k∗
g,w) in the range of 0–1 / 1000 s−1 andCw/(Mwγw,i
)equal
to 100µmol m−3 (see Sect. 2.2.3). For each model applica-tion in Sect. 3.2, we test how sensitive the model results areto the value ofk∗
g,w. Particle wall losses were not consid-ered (see discussion in Sects. 3.1 and 3.4). The dimer andmonomer SOA compounds were assessed to form one or-ganic phase (no phase separation).
3.2.1 Evaporation of pure monomer SOA particles
Cappa and Wilson (2011) did not find any substantial dif-ferences in chemical composition ofα-pinene SOA particles
7968 P. Roldin et al.: Modelling non-equilibrium secondary organic aerosol formation
upon evaporation in a thermodenuder. Hence, according totheir study these particles do not seem to obey absorptive par-titioning theory upon evaporation. This could possibly be ex-plained by a diffusion-limited transport of the organic com-pounds within an amorphous (glassy) particle phase (Cappaand Wilson, 2011). However, in a similar study, Kuwata etal. (2011) observed a substantial change of the CCN prop-erties ofα-pinene SOA particles after thermodenuder treat-ment, which indicates a relative enrichment of low-volatilityoligomers after evaporation. In Vaden et al. (2011) it is notedthat the mass spectral peak atm/z = 201 rapidly disappearson evaporation and that the only other change is a gradualincrease in relative intensity of peaks at higherm/z. Thus,their study also suggests an increase in the relative oligomercontent, which could indicate that the smaller, higher vapourpressure molecules evaporate and oligomerization continuesat a slow rate during evaporation, consistent with the ob-served SOA hardening (Abramson et al. 2013).
To set the stage, we start by calculating whether the evap-oration rates can be explained by the volatility distribution ofthe condensing monomers formed in the gas phase, in com-bination with non-perfect mixing within a semi-solid amor-phous particle phase. The evaporation of the more volatileorganic compounds will then be controlled by the evapora-tion rate of the least volatile organic compounds enriched inthe particle surface-bulk layer, and not by their own species-specific saturation vapour pressures. The measured massspectra and densities of small and large SOA particles formedby ozonolysis ofα-pinene are undistinguishable (Zelenyuket al., 2008). Despite this fact, we use the model to evaluatewhether it gives a relative enrichment of the least volatilemonomer SOA compounds in the smaller particles duringtheir formation and growth (see e.g. Roldin et al., 2011b),and whether this can explain the observed size-independentSOA evaporation.
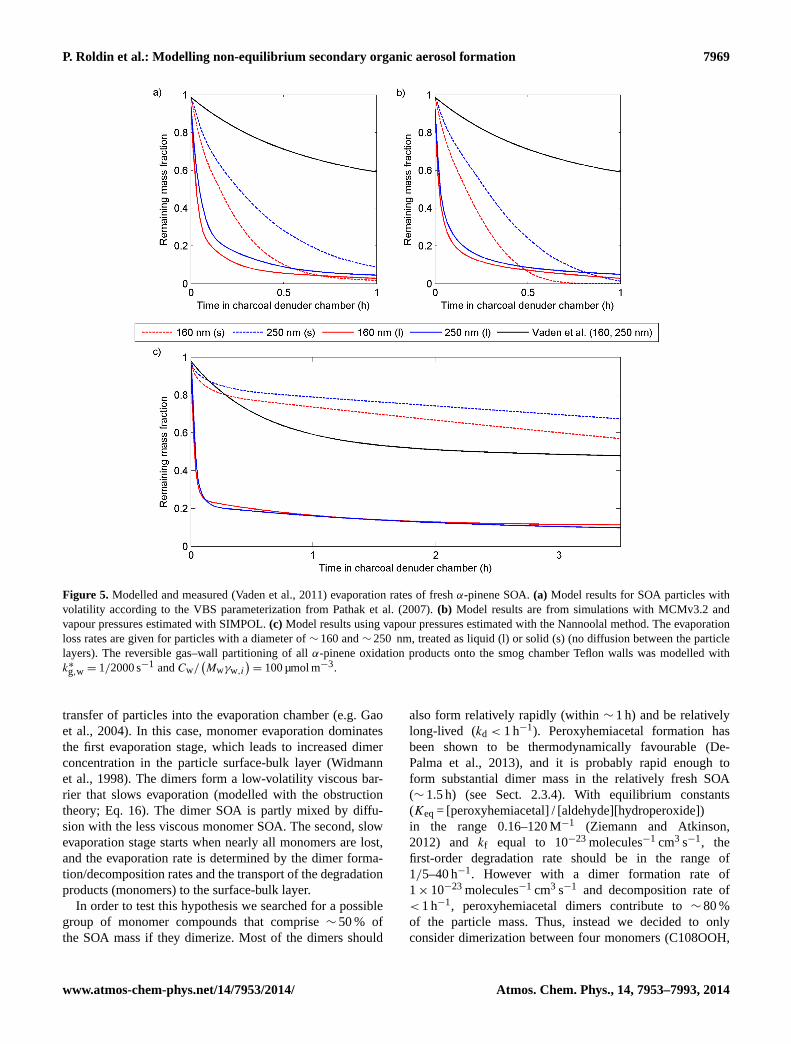
The pure-liquid saturation vapour pressures were calcu-lated with the SIMPOL (Pankow and Asher, 2008); the Nan-noolal et al. (2008) vapour pressure methods; or with thesemi-empirical seven-product model (VBS) parameteriza-tion from Pathak et al. (2007), which was also used by Vadenet al. (2011). Here we evaluate its influence on the mod-elled evaporation rates of∼ 160 and∼ 250 nm particles.The model results presented in Fig. 5 are from simulationswith k∗
g,w = 1/2000 s−1 and liquid-like SOA (Dmonomer=
10−10 cm2 s−1) or solid-like SOA particles with negligiblemixing (Dmonomer= 0 cm2 s−1). In Fig. 5a the results arefrom simulations with the VBS from Pathak et al. (2007),Fig. 5b shows the results when we use SIMPOL and Fig. 5cresults from simulations with the Nannoolal method. In Sup-plement Fig. S3 we compare the modelled evaporation lossesfor simulations with or without reversible gas–wall partition-ing onto the smog chamber Teflon walls. The figure illus-trates that the uptake ofα-pinene oxidation products ontothe smog chamber walls lowers the volatility of the formed
SOA particles. But this does not substantially improve theagreement between the modelled and measured evaporationrates.
In all model runs except with the Nannoolal method andsolid-like amorphous particles, the evaporation rates are or-ders of magnitude faster than the observations. According tothe curve fitted to the measurements, only∼ 3 % of the SOAmass is lost during the first 2 min. In the model runs 7–80 %is lost, depending on the vapour pressure method used, theparticle size, the value ofk∗
g,w and if the SOA is treated asliquid- (l) or solid- (s) like.
Another difference is that the observed evaporation lossrate is almost linear for the first 30 min while in all modelruns the loss rate is first very rapid and then graduallyslows down. This is because in the model the SOA is com-posed of molecules with different volatility. Hence, the mostvolatile molecules are lost early and the remaining com-pounds that are less volatile evaporate later and slower, in-consistent with observations by Cappa and Wilson (2011)and Vaden et al. (2011). Moreover, all calculated evapora-tion rates are size-dependent, similarly inconsistent with theobserved SOA evaporation (Vaden et al., 2011; Zelenyuk etal., 2012).
When the SOA is treated as a solid, the evaporation ratesare much slower with the Nannoolal method compared tothe other two methods, even though most of the other SOAmass (without wall losses) is somewhat more volatile thanwith the SIMPOL method (see Supplement Fig. S4). This ismainly because of two low-volatility MCMv3.2 compoundscalled C922OOH and C813OOH, which before evaporationtogether make up 10± 3 and 7.5± 2 % of the particle massin the 160 and 250 nm particles, respectively (see modelledmass spectrum in Supplement Fig. S5). These compoundshave vapour pressures of 4.8× 10⁻⁸ and 5.3× 10⁻⁸ Pa (at296 K) when calculated with the Nannoolal method, whileaccording to SIMPOL their vapour pressures are 1.7× 10⁻⁶
and 1.8× 10⁻⁶ Pa (at 296 K). Hence, if the SOA particlesare considered to be solid or semi-solid, and the Nannoolalmethod is used, these compounds accumulate in the parti-cle surface-bulk layer upon evaporation and limit the loss ofother more volatile compounds.
From the discrepancies between the model and measure-ment results in Fig. 5, we can conclude that it is unlikely thatthe observed evaporation rates can be explained purely byincomplete mixing and the vapour-pressure-controlled evap-oration of SOA monomers. We note, however, that when anearly non-volatile component is introduced and the SOAis treated as solid-like, the evaporation rate significantly de-creases.
3.2.2 Evaporation governed by mass-transport-limitedmixing and dimer degradation
Here we evaluate a hypothesis where dimers comprise a sig-nificant fraction (∼ 50 %) of the particles’ mass prior to the
P. Roldin et al.: Modelling non-equilibrium secondary organic aerosol formation 7969
Figure 5. Modelled and measured (Vaden et al., 2011) evaporation rates of freshα-pinene SOA.(a) Model results for SOA particles withvolatility according to the VBS parameterization from Pathak et al. (2007).(b) Model results are from simulations with MCMv3.2 andvapour pressures estimated with SIMPOL.(c) Model results using vapour pressures estimated with the Nannoolal method. The evaporationloss rates are given for particles with a diameter of∼ 160 and∼ 250 nm, treated as liquid (l) or solid (s) (no diffusion between the particlelayers). The reversible gas–wall partitioning of allα-pinene oxidation products onto the smog chamber Teflon walls was modelled withk∗g,w = 1/2000 s−1 andCw/
(Mwγw,i
)= 100 µmol m−3.
transfer of particles into the evaporation chamber (e.g. Gaoet al., 2004). In this case, monomer evaporation dominatesthe first evaporation stage, which leads to increased dimerconcentration in the particle surface-bulk layer (Widmannet al., 1998). The dimers form a low-volatility viscous bar-rier that slows evaporation (modelled with the obstructiontheory; Eq. 16). The dimer SOA is partly mixed by diffu-sion with the less viscous monomer SOA. The second, slowevaporation stage starts when nearly all monomers are lost,and the evaporation rate is determined by the dimer forma-tion/decomposition rates and the transport of the degradationproducts (monomers) to the surface-bulk layer.
In order to test this hypothesis we searched for a possiblegroup of monomer compounds that comprise∼ 50 % ofthe SOA mass if they dimerize. Most of the dimers should
also form relatively rapidly (within∼ 1 h) and be relativelylong-lived (kd < 1 h−1). Peroxyhemiacetal formation hasbeen shown to be thermodynamically favourable (De-Palma et al., 2013), and it is probably rapid enough toform substantial dimer mass in the relatively fresh SOA(∼ 1.5 h) (see Sect. 2.3.4). With equilibrium constants(Keq= [peroxyhemiacetal] / [aldehyde][hydroperoxide])in the range 0.16–120 M−1 (Ziemann and Atkinson,2012) and kf equal to 10−23 molecules−1 cm3 s−1, thefirst-order degradation rate should be in the range of1/5–40 h−1. However with a dimer formation rate of1× 10−23 molecules−1 cm3 s−1 and decomposition rate of< 1 h−1, peroxyhemiacetal dimers contribute to∼ 80 %of the particle mass. Thus, instead we decided to onlyconsider dimerization between four monomers (C108OOH,
7970 P. Roldin et al.: Modelling non-equilibrium secondary organic aerosol formation
C922OOH, C97OOH and C813OOH), which all contain atleast one carbonyl and one hydroperoxide functional group.With this assumption, the dimer particle content is∼ 50 %for particles aged 1.5 h. The dimer mass fraction is nearly thesame for all particle sizes (see Supplement Fig. S6). Thus,for the results presented in this section we will assume thatonly these four monomers contribute to the dimer formation.
For the diffusion coefficients of monomers and dimers weassume thatDdimer are 2 orders of magnitude smaller thanD0,monomer, and calculateDmonomerwith the obstruction the-ory. The dimers and monomers were assumed to be com-posed of one well-mixed organic phase.
In order to fit the model to the observed evaporationrates we variedD0,Xi
for the monomers and dimers in therange of 1× 10⁻¹⁶–1× 10⁻¹³ cm2 s−1 and 1× 10⁻¹⁸–1×
10−15 cm2 s−1, respectively. With these values ofD0,Xithe
dimers are enriched in the particle surface-bulk layer uponevaporation, but mass-transport-limited monomer evapora-tion across the viscous surface-bulk layer is still possible.The dimer formation and degradation rate was varied inthe range of 10−22–10−24 molecules−1 cm3 s−1 and 1/20–1 h−1, respectively. We also tested to run the model withor without gas–wall partitioning to the smog chamber walls(k∗
g,w = 1/2000 s−1 or k∗g,w = 0 s−1).
With a D0,monomer of 2× 10⁻¹⁴ cm2 s−1 in agreementwith Zhou et al. (2013),Ddimer of 2× 10⁻¹⁶ cm2 s−1, kf of10−23 molecules−1 cm3 s−1, kd of 1/10 h−1, no phase sep-aration andk∗
g,w of 1/2000 s−1, the model reproduced themain features of the observed evaporation behaviour of freshSOA particles (Fig. 6). However, other combinations of val-ues of these parameters reproduces the observations equallywell (e.g. withDmonomer≈ 2× 10⁻¹⁵ cm2 s−1, Ddimer ≈ 2×
1/20 h−1). For aged particles, the model somewhat under-estimates the evaporation losses. This is because the rela-tive dimer content in the particles increases with aging. Thiseffect is most pronounced when considering chamber walllosses in the smog chamber (Supplement Fig. S6). Thus,when we run the model without reversible gas–wall parti-tioning to the smog chamber Teflon walls, the aging effecton the modelled evaporation rates is negligible (SupplementFig. S7).
In the simulations the early evaporation rate is governedby the monomer diffusion rate to the surface. The small par-ticles have a shorter characteristic time of mass transportthan the large particles (see Sect. 1). This is the reason whythe loss rate during the first hour is somewhat larger for the∼ 160 nm particles than the∼ 250 nm particles. When mostof the monomers have evaporated (after∼ 3 h for the mod-elled 160 nm particles and∼ 6 h for the 250 nm particles)(Supplement Fig. S8), the second, slow evaporation-stagebegins. This stage is determined by dimer degradation andformation and by the diffusion of monomer to the particlesurface-bulk layer. Again, because of the shorter characteris-
Figure 6. Measured (Vaden et al., 2011) and modelled evap-oration losses for particles composed of approximately equalamount of dimer and monomer SOA prior to introduction tothe charcoal denuder chamber. The saturation vapour pressureswere calculated with SIMPOL,D0,monomer= 2× 10⁻¹⁴cm2 s−1,Ddimer= 2×10⁻¹⁶cm2 s−1, kf = 10−23molecules−1 cm3 s−1,kd = 1/10 h−1, no phase separation andk∗
g,w = 1/2000 s−1. Theresults are given both for fresh and aged particles with a diameterof ∼ 160 and∼ 250 nm, respectively.
tic time of mass transport for the small particles, the evapora-tion losses of the small particles are somewhat larger (steeperslope of the curves in Fig. 6). This is not completely consis-tent with the measurements.
From these simulations we can conclude that the modelcan reproduce the main features of the observed evaporationrates for fresh and agedα-pinene SOA particles if the re-versible gas–wall partitioning in the smog chamber only hasa small influence on the particle composition. However, theobserved nearly size-independent evaporation rates can prob-ably not be explained by an particle-phase mass-transfer-limited evaporation of the monomer SOA, followed by a slowdecomposition of the remaining (∼ 50 % by mass) oligomerSOA.
3.2.3 Evaporation controlled by the degradation ofshort- and long-lived dimers in semi-solid tar-likeSOA particles
Here we examine whether the observed slow evaporation ratecan be explained by nearly solid-like SOA in combinationwith two types of dimers: the first being relatively short-lived (lifetime of a few minutes) and a second long-lived
P. Roldin et al.: Modelling non-equilibrium secondary organic aerosol formation 7971
(lifetime of more than a day). For this paradigm the dimerswill accumulate and stay in the particle surface-bulk layerupon evaporation. Thus, the size-independent evaporationrates will mainly be controlled by the decomposition rateof dimers back to monomers in the surface-bulk layer. Wealso test whether gas–wall losses can contribute to an enrich-ment of dimers in the particle surface-bulk layer already inthe smog chamber, thus helping to explain the observed rela-tively slow and size-independent first evaporation stage ofα-pinene SOA. The evaporation is then first controlled by thedegradation of the relatively short-lived dimers, which aregradually replaced by long-lived but less numerous dimersfrom the particle bulk.
In order to test the general mechanism principle, weconsider that the dimers are peroxyhemiacetals, which, asin Sect. 3.2.2, are formed from the monomers C108OOH,C922OOH, C97OOH and C813OOH. However, the long-lived dimer is only assumed to be formed from the leastvolatile MCMv.3.2 oxidation products C922OOH. With thisassumption and because of the Kelvin effect, the rela-tive amount of long-lived dimer increases with decreas-ing particle sizes (Supplement Fig. S9). For the short-liveddimers we varied the values ofkf and kd in the range of1×10−22–1×10⁻²⁴ molecules−1 cm3 s−1 and 30–6 h−1, re-spectively. For the long-lived dimer we used akf of 1×
10−22 molecules−1 cm3 s−1 and varied thekd values in therange of 1/20–1/40 h−1. The monomer SOA was treated as asemi-solid tar-like mixture (D0,monomer= 5×10⁻¹⁷ cm2 s−1)according to Abramson et al. (2013) and the dimer SOAas solid (Ddimer = 0 cm2 s−1). The gas–wall partitioningwas modelled withk∗
g,w in the range of 0–1/500 s−1 and
Cw/(Mwγw,i
)equal to 100 µmol m−3.
In Fig. 7, we compare the modelled and observedevaporation rates of fresh and agedα-pinene SOA parti-cles for simulations withkf and kd values of 1× 10−23,1× 10−22 molecules−1 cm3 s−1 and 12, 1/30 h−1 for theshort- and long-lived dimers, respectively.k∗
g,w was set to
1/1000 s−1. During the first∼ 20 min of evaporation, beforethe surface-bulk layer has been entirely filled with a mix-ture of short- and long-lived dimers, the modelled evapora-tion rates are size-dependent. However, once the surface-bulklayer has been filled with dimers, the evaporation is con-trolled by the dimer degradation and becomes nearly size-independent. After∼ 2 h of evaporation almost all short-lived dimers in the surface-bulk layer are lost and replacedby the long-lived dimers (see Supplement Fig. S9). This iswhen the second, slow evaporation stage starts. If the long-lived dimer mass fraction had been size-independent, a sub-stantially larger mass fraction of the small particles wouldhave needed to evaporate before they reach this stage. Thus,in order for the model to capture the observed nearly size-independent evaporation, the long-lived dimers need to beformed from the least volatile monomers or formed in the gas
Figure 7. Measured (Vaden et al., 2011) and modelled evapora-tion loss rates for semi-solid tar-like particles (D0,monomer= 5×
10−17cm2 s−1 andDoligomer= 0 cm2 s−1). The fresh SOA parti-cles are composed of short-lived dimers (∼ 20 mass %) and long-lived dimers (2.19 and 1.44 mass % for 160 and 250 nm particles, re-spectively) (see Fig. S9) before they are introduced into the charcoalevaporation chamber. The saturation vapour pressures were calcu-lated with SIMPOL andk∗
g,w = 1/1000 s−1.
phase (e.g. by peroxy radical termination reactions or hydro-gen abstraction; see Sect. 2.3.4).
For the aged particles the model substantially underes-timates the early-stage evaporation losses. This is becauseof the modelled gas–wall losses in the smog chamber. InSupplement Fig. S10 we compare the modelled evapora-tion losses with or without chamber wall losses (k∗
g,w = 0
or 1/1000 s−1) and with or without aging. Without chamberwall losses the effect of aging in the smog chamber becomesnegligible, but at the same time the model substantially over-estimates the mass fraction loss during the first evaporationstage. This is because (for this set-up) the bulk mass fractionof long-lived dimers is too small and∼ 65 mass % instead ofthe desired∼ 50 mass % needs to evaporate before the long-lived dimer has formed a monolayer thick surface-bulk layercoverage. With a doubling of the long-lived dimer content,this model and measurement discrepancy disappears.
From these simulations we can conclude that ADCHAMis able to reproduce the main features of the measured nearlysize-independent evaporation losses of SOA particles fromVaden et al. (2011) in the following cases:
1. If relatively short-lived dimers are present in and nearthe particle surface-bulk layer before the particles areintroduced into the evaporation chamber.
7972 P. Roldin et al.: Modelling non-equilibrium secondary organic aerosol formation
2. If a relatively small mass fraction of long-lived dimersaccumulate in the particle surface-bulk layer upon evap-oration.
3. If the long-lived dimer mass fraction is higher in thesmall particles compared to the large ones. As illus-trated by the model simulations, this is possible (be-cause of the Kelvin effect) if the dimer preferentiallyis formed from the least volatile monomer compounds.But it could also be explained by ELVOC (e.g. dimers)formed in the gas phase.
4. The reversible gas–wall losses to the smog chamberTeflon walls have only small influences on the particlecomposition.
3.3 Modelling of organic salt formation betweencarboxylic acids and ammonia
Here we model the SOA formation in theα-pinene–NH3–O3 experiments by Na et al. (2007) in a dark indoor 18 m3
Teflon chamber. In the experiments CO (∼ 200 ppm) wasused as an OH scavenger. The chamber was operated ata temperature of 21± 1◦C and under dry conditions. Forthe simulations we use an RH of 5 % and a temperature of21◦C. Once theα-pinene and NH3 initial target concentra-tions were reached, the experiments started with injection ofO3 for approximately 20 min to produce an O3 concentra-tion of 200± 5 ppb. In the model, emissions correspondingto 250 ppb unreacted O3 were added during the first 20 minin order to simulate the experimental target O3 concentra-tions.
In the experiments Na et al. (2007) observed a substan-tially higher SOA formation when NH3(g) was present. Theauthors also performed experiments oncis-pinonic acid (acommonα-pinene oxidation product) and found a dramaticincrease in particle number and volume concentration whenNH3 was added to the system. From these experiments theyconcluded that most of the observed SOA mass enhancementin the presence of NH3 could be explained by acid–base reac-tions, which drive the carboxylic acids into the particle phase.Similar organic salt formation in the presence of NH3 wasobserved both under dry and humid conditions (RH = 50 %).
Several experiments were performed at initial NH3(g) con-centration between 0 and 400 ppb and anα-pinene concen-tration of ∼ 220 ppb (see Table 1 in Na et al., 2007). Theformed aerosol particle mass increased when more NH3 wasadded. However, when the ammonia concentration exceeded200 ppb, no substantial additional mass formation was ob-served. The reason for this could be that, in principle, allgas-phase carboxylic acids already had formed particle massat 200 ppb NH3 (Na et al., 2007).
Recently, Kuwata and Martin (2012) conducted experi-ments with an aerosol mass spectrometer (AMS) on SOAformed from ozonolysis ofα-pinene at low and high rela-tive humidity (RH< 5 % and RH> 94 %). In these experi-
ments, theα-pinene SOA particles were formed under dryconditions before they were exposed to varying degrees ofhumidification and ammonia (see Fig. 1 in Kuwata and Mar-tin, 2012). An∼ 10 times greater uptake of ammonia was ob-served at high RH compared to low RH, which was attributedto a more rapid diffusion uptake of ammonia in the less vis-cous humidified aerosol particles. Because the gas phase wasnot removed from the aerosol between the generation and theexposure to ammonia, part of the ammonia uptake could beattributed to reactive uptake of NH3 and organic acids fromthe gas phase (Kuwata and Martin, 2012).
In this work, we model the organic salt formation be-tween ammonium and carboxylic acids as a process occur-ring in the particle surface-bulk layer and particle bulk, anal-ogous to inorganic salt formation (e.g. NH4NO3). The par-titioning of carboxylic acids and ammonia between the gasphase and particle surface-bulk layer are modelled as sepa-rate pH-dependent dissolution processes using the conden-sation/evaporation module (Sect. 2.2.1). The amount of or-ganic acids, ammonia/ammonium and organic salts whichexists in the particles depends on the pure-liquid saturationvapour pressures or Henry’s law constant (KH), acid dis-sociation constants (Ka), activity coefficients, surface ten-sion (Barsanti et al., 2009) and the solubility product ofthe formed salts (Ks) (Reactions R5–R9). The aerosol parti-cle formation will be favoured by low pure-liquid saturationvapour pressures of the carboxylic acids, the large solubil-ity (Henry’s law coefficient) of NH3, the large difference be-tween the carboxylic acids and NH+
4 Ka values (Greaves andDrummond, 2008) and the low solubility of the formed salts(Ks).
RCOOH(g) ↔ RCOOH(l) (R5)
RCOOH(l) ↔ RCOO−+ H+,Ka (R6)
=
[RCOO−
][H+
]γH+γRCOO−
[RCOOH] γRCOOH
NH3 (g) ↔ NH3 (l) ,KH =[NH3 (l)] γNH3
pNH3
(R7)
NH3 (l) + H+↔ NH+
4 , (R8)
1
Ka,NH+
4
= KNH3 =
[NH+
4
]γNH+
4
[NH3 (l)][H+
]γNH3γH+
NH+
4 + RCOO−↔ NH4RCOO(s) , (R9)
Ks =[NH+
4
][RCOO−
]γNH+
4γRCOO−
Table 3 lists different model parameter values used for thebase case simulations in this section. TheKa values are un-known for most carboxylic acids, even in aqueous solutions.However, for two major ozonolysis products (cis-pinic acid)
P. Roldin et al.: Modelling non-equilibrium secondary organic aerosol formation 7973
and (cis-pinonic acid) (Hallquist et al., 2009), aqueous pKavalues were found in the literature (see e.g. Hyder et al., 2012and Barsanti et al., 2009). These acids have nearly the samepKa values (∼ 4.6). Hence, in this work we assume that allcarboxylic acids fromα-pinene ozonolysis which partitioninto the particle organic-rich phase have pKa values equal to4.6. The carboxylic acid and ammonia dissociation rate co-efficients and the Henry’s law coefficient of NH3 are validfor dilute water solutions (see Sect. 2.3.2). Thus, as a sen-sitivity test we also tested to model the NH3 uptake with a10-times-lower Henry’s law coefficient, which may be moreappropriate for organic solvents.
Unfortunately we could not find any values of solubilityproducts between carboxylic acids and ammonium in the lit-erature. Hence, we decided to define an effective solubilityproduct (K∗
s ) as the product between the ammonium concen-tration and the total deprotonated carboxylic acid concen-tration ([RCOO−]tot) (Eq. 29).K∗
s was the only parameterwhich we systematically varied in order to find the best pos-sible agreement between the model and measurements.
K∗s =
[NH+
4
][RCOO−
]tot (29)
If not otherwise specified, the pure-liquid saturation vapourpressures of the organic compounds were estimated withthe SIMPOL method,K∗
s was set to 0.1 mol2 m−6, and theNH4RCOO salts were mixed with the other organic com-pounds (no separate phase). Because the interactions be-tween the NH4RCOO and other organic compounds and in-organic ions are unknown (see Sect. 2.3.1), NH4RCOO wasnot considered to influence the activity coefficients of theother compounds. However, for a second extreme condition,we performed simulations where we treated NH4RCOO andthe other organic compounds+ inorganics as two completelyseparate phases (liquid–liquid phase separated or NH4RCOOas crystalline salts; see Sect. 1). The diffusion coefficientsfor monomer SOA and ammonia/ammonium were estimatedwith the Stokes–Einstein relationship using a viscosity of∼ 108 Pa s (Abramson et al., 2013). Because the viscosityof the SOA is uncertain and depends on the experimentalconditions and time of aging, we also performed simulationswith less viscous particles (D0,monomer,SOA = 10−15 cm2 s−1,D0,ammonium= 10−13 cm2 s−1).
In Table 4 we have listed the measured and modelinitial concentrations, concentration change of ozone(1[O3] = [O3]max− [O3]t=6 h) andα-pinene1[α-pin.], andSOA yields. Figure 8 shows the modelled temporal evolu-tion of theα-pinene, O3, NH3 and OH concentrations in thegas phase. The O3 concentration rises during the first 20 minwhile O3 is continuously applied to the chamber. The OHconcentration reaches a maximum of∼ 106 molecules cm−3
at the same time as the maximum O3 concentration. Hence,according to the model, the experiments with CO as an OHscavenger are not pure O3 oxidation experiments, but a frac-tion of theα-pinene and the oxidation products are also ox-idized with OH. Supplement Fig. S11 shows the cumulative
Figure 8.Modelled NH3(g), O3(g),α-pinene(g) and OH(g) concen-trations for theα-pinene oxidation experiments by Na et al. (2007).
fraction of reactedα-pinene which was oxidized by O3 dur-ing the evolution of the experiment. At the beginning of theexperiment only 86 % of the consumedα-pinene was oxi-dized by O3, while at the end of the experiment 92 % of theconsumedα-pinene was oxidized by O3.
In Fig. 9 we compare the modelled and measured SOAyields from experiments conducted with approximately220 ppbα-pinene, 200 ppb O3 and varying initial NH3 con-centrations. The model results in Fig. 9a are from thebase case simulation set-up (Table 3). Figure 9b showsmodel results from simulations performed with pure-liquidsaturation vapour pressures from Nannoolal et al. (2008).The results in Fig. 9c are from model runs with unityactivity coefficients (Raoult’s law for ideal solution), andFig. 9d shows results from simulations with less viscousparticles (D0,monomer,SOA = 10−15 cm2 s−1, D0,ammonium=
10−13 cm2 s−1 andD0,NH4RCOO= 0 cm2 s−1). For a particlewith a diameter of 250 nm, these values of the diffusion co-efficients give an expected e-folding time of equilibration of2.6 min for ammonium and 4.4 h for SOA monomers (Sein-feld and Pandis, 2006). However, since a substantial fractionof the ammonium can be bound into NH4RCOO, the actuale-folding time can be longer.
For the base case simulations the agreement between themodelled and measured SOA mass and SOA yields are sur-prisingly good, both with and without addition of NH3. Onereason for this is that the organic salt effective solubilityproduct (Eq. 29) was used as a model-fitting parameter. How-ever, in order for the model to agree with the measure-ments, the amount of semi-volatile carboxylic acids formedfrom theα-pinene oxidation still needs to be reasonably well
7974 P. Roldin et al.: Modelling non-equilibrium secondary organic aerosol formation
Table 3.Base case model set-up values for the simulation of organic salt formation between carboxylic acids and dissolved ammonium ions.
Parameter Definition Valuea
pKa,COOH Logarithm of carboxylic acid dissociation constant 4.6pKa,NH3 Logarithm of NH+
4 dissociation constant 9.25b
K∗s (mol2 m−6) Effective solubility product (see Eq. 32) 0.1
KH (mol m−3 atm−1) Henry’s law coefficient for NH3 57.6c
p0,i Pure-liquid saturation vapour pressure comp.i SIMPOLγi Activity coefficient for compoundi AIOMFACD0,monomer,SOA (cm2 s−1) Diffusion coefficient for SOA monomers 5× 10⁻¹⁷d
D0,ammonium(cm2 s−1) Diffusion coefficient for NH3 / NH+
4 1.3× 10⁻¹⁶d
DNH4RCOO (cm2 s−1) Diffusion coefficient of organic salts 0
a Base case simulation value.b Lide (2008) (CRC Handbook of Chemistry and Physics) at 298 K.c Jacobson (2005a).d Based on the Stokes–Einstein relationship and an SOA viscosity of 108 Pa s (Abramson et al., 2013).
Table 4. Initial conditions and results from theα-pinene–O3–NH3–CO experiments (Na et al., 2007) and base case model simulations.
Date Initial Initial 1[O3] 1[α-pin.] Yield Initial 1[O3] 1[α-pin.] Yield[α-pin.] NH3 exp. exp. exp. (%) [α-pin.] model model model
exp. (ppb) (ppb) (ppb) model (ppb) (ppb) (ppb) (%)
predicted, which seems to be the case. It is also importantto mention that for these model simulations we did not con-sider any chamber wall losses. Supplement Fig. S12 showsthe modelled temporal evolution of the total carboxylic acidconcentration (gas+ particle phase).
We find the largest difference between the model runs,as well as between the model and measurements, when weuse the pure-liquid saturation vapour pressure method fromNannoolal et al. (2008) instead of SIMPOL (Pankow andAsher, 2008) (Fig. 9b). The model then underestimates theSOA mass with∼ 200 µg m−3 (∼ 30 %), irrespective of theamount of NH3 added.
Supplement Fig S4 shows a comparison of the VBS pa-rameterization from Pathak et al. (2007) and VBS parameter-izations which we have derived from the MCMv3.2 condens-able α-pinene oxidation products using either the methodfrom Nannoolal et al. (2008) or SIMPOL. The MCMv3.2α-pinene oxidation product VBS parameterizations are givenboth for CO and cyclohexane as an OH scavenger. The VBSparameterizations show large differences both between thevapour pressure methods and the type of OH scavenger used.By comparing the VBS parameterizations we can concludethat SIMPOL gives the largest SOA mass at highα-pineneconcentrations (this work). However, at low (atmospheri-cally more realistic)α-pinene concentrations the Nannoolalmethod will give the least volatile SOA and highest SOAmass.
Barley and McFiggans (2010) showed that the uncertain-ties of the calculated pure-liquid saturation vapour pres-sures are large, especially for low-volatility compounds withseveral functional groups. However, because of other largeuncertainties, e.g. oligomerization processes and gas-phasechemistry mechanisms (see Sect. 1), we cannot predict whichof the two liquid saturation vapour pressure methods givesthe most realistic vapour pressures. In Sect. 3.2 we illustratedhow the estimated volatility of theα-pinene gas-phase oxi-dation products can have substantial effects on the particleevaporation loss rates.
In contrast to the vapour pressures, the modelled activ-ity coefficients have only a small influence on the simulatedSOA mass formation (compare Fig. 9a and c). This is con-sistent with the conclusions from McFiggans et al. (2010)and Zuend and Seinfeld (2012) for conditions without dis-solved inorganic ions and low relative humidity. The massdifference between the model runs ([OAideal]-[OAactivity]) issmall without added NH3, but increases when the free par-ticle ammonium concentration increases. The reason for thisis that the dissolved ammonium ions generally increase theorganic molecule activity coefficients (salting-out effect). Atatmospherically more realistic relative humidities (> 30 %),salt effects, which either cause liquid–liquid phase separa-tion or drive the organic compounds out from the particles,may have large effects on SOA formation (see e.g. Zuend andSeinfeld, 2012).
P. Roldin et al.: Modelling non-equilibrium secondary organic aerosol formation 7975
Figure 9. Comparison of modelled and measured SOA mass and mass yields at different initial levels of NH3(g). In (a) the model results arefrom simulations with vapour pressures from SIMPOL, activity coefficients from AIOMFAC and very slow mixing between the particle layers(base case); in(b) the results are from simulations with vapour pressures from Nannoolal et al. (2008), activity coefficients from AIOMFACand very slow mixing between particle layers; in(c) the results are from simulations with vapour pressures from SIMPOL, unity activitycoefficients (ideal solution) and very slow mixing between the particle layers; and in(d) the model results are from simulations with vapourpressures from SIMPOL, activity coefficients from AIOMFAC and semi-solid less viscous particles withD0,monomer,SOA = 10−15cm2 s−1,D0,ammonium= 10−13cm2 s−1 andD0,NH4RCOO= 0 cm2 s−1.
If we assume that the SOA is less viscous (Fig. 9d),then the mass yields are slightly larger (60.7 % comparedto 57.5 % without NH3 addition, and 69.1 % compared to67.0 % when 200 ppb NH3 is added at the start of the experi-ments).
Figure S13 in the Supplement shows the total SOA massand NH4RCOO mass for varying initial NH3 concentration,K∗
s = 0.01 or 0.1 mol2 m−6 and semi-solid SOA particles.As expected, the NH4RCOO mass concentration and the to-tal particle mass increase whenK∗
s is lowered. However, for200 ppb NH3 the difference becomes negligible since almostall carboxylic acids are found in the particle phase regard-less. The results also reveal a moderate salting-out effect ofthe ammonium on the SOA (see the decrease in the total par-ticle mass with increasing NH3 whenK∗
s = 0.01 mol2 m−6).
We also performed simulations with 10-times-lowerHenry’s law coefficients andK∗
s = 0.01 or 0.1 mol2 m−6
(Supplement Figs. S14 and S15). WithK∗s = 0.1 mol2 m−6,
no NH4RCOO is formed even if 200 ppb NH3 is added. How-ever, the added NH3 still contributes to an enhanced dissoci-ation and uptake of the carboxylic acids. When 200 ppb NH3is added andK∗
s is 0.1 mol2 m−6, the model gives an SOAmass increase of 11 % and the measurements an increaseof 22 %. If we decreaseK∗
s to 0.01 mol2 m−6, a substantialamount of NH4RCOO is formed and the model is nearlyable to capture the observed SOA mass increase with in-creasing NH3 concentrations (a 17 % increase in mass when200 ppb NH3 is added) (Supplement Fig. S15).
In order to test which processes are responsible for theobserved NH3 uptake inα-pinene SOA particles (Kuwata
7976 P. Roldin et al.: Modelling non-equilibrium secondary organic aerosol formation
Figure 10. Modelled SOA mass formation forα-pinene–O3–NH3–CO experiments with 200 ppb NH3 added at the start or after 6 h ofaging. For all simulations, SIMPOL was used to estimate the vapour pressures of the organic compounds. The SOA particles were eithertreated as completely solid (no mixing between particle layers) (simulation 1–4) or semi-solid withD0,monomer,SOA = 10−15cm2 s−1,D0,ammonium= 10−13cm2 s−1 andD0,NH4RCOO= 0 cm2 s−1 (simulation 5). For simulations 2 and 3 we assume that the NH4RCOO saltsform a separate phase which other organic compounds cannot dissolve into.
and Martin, 2012; Na et al., 2007), we also performed sim-ulations where the SOA particles were allowed to age for6 h before they were exposed to 200 ppb NH3(g). To test theeffect of mass-transfer-limited uptake of NH3, the particleswere either treated as glassy solids (no mixing) or semi-solid and less viscous (D0,monomer,SOA = 10−15 cm2 s−1,D0,ammonium= 10−13 cm2 s−1).
In Fig. 10a the temporal evolution of the modelled SOAmass from these simulations is shown. As a comparison, theresults from simulations with 200 ppb NH3(g) added at thestart of the experiments are also plotted. After the addition ofNH3, the SOA mass increases rapidly both with and withoutmass-transfer-limited diffusion uptake in the particles (semi-sold or solid particles). This indicates that the rapid uptake ofNH3(g) by the particles is mainly caused by reactive uptakeof carboxylic acids(g) and NH3(g) and not by the diffusionof NH3 / NH+
4 into the particle bulk. However, the temporalevolution of the formed NH4RCOO salts and dissociated andnon-dissociated carboxylic acids (Fig. 10b) reveals that themass of NH4RCOO salts formed in the semi-solid particles is
twice as high, and the carboxylic acid mass concentration issubstantially lower than if treating the SOA as solid. This dif-ference is attributed to the mass-transfer-limited uptake andreaction of NH3 / NH+
4 with the carboxylic acids found in thesemi-solid particle bulk interior.
However, although the NH4RCOO concentration becomeshigher if the particles are semi-solid (less viscous), the totalaerosol mass 3 h after the addition of ammonium is lowerthan if the particles are solid (compare simulation 4 and 5 inFig. 10a). The reason for this is the salting-out effect of NH+
4 ,which causes the nonpolar organic compounds to evaporate.For these simulations, the salting-out effect is mainly impor-tant if both the NH3 / NH+
4 and the organic compounds can betransported between the bulk and particle surface-bulk layer.In the laboratory experiments (see Fig. 2a in Na et al., 2007),no SOA mass loss could be seen after the NH4RCOO forma-tion. This experiment continued less than 1 h after the addi-tion of NH3, but it at least indicates that the mixing of organiccompounds within the particle phase is mass-transfer-limitedand/or that the NH4RCOO salts form a separate phase, which
P. Roldin et al.: Modelling non-equilibrium secondary organic aerosol formation 7977
Figure 11.Modelled(a) pH, (b) ammonium (NH+4 + NH3(l) + NH4 in NH4RCOO) mass fractions,(c) NH4RCOO mass fractions and(d)carboxylic acid (COOH+ COO−) mass fractions at different distances from the particle core forα-pinene SOA particles with a diameterof approximately 240 nm after 1 h and 280 nm after 6 h of aging. The model results are from three different simulations with an initial[NH3(g)] of 50, 100 or 200 ppb. The SOA particles were assumed to be semi-solid withD0,monomer,SOA = 10−15cm2 s−1, D0,ammonium=
10−13cm2 s−1 andD0,NH4RCOO= 0 cm2 s−1.
limits the salting-out of other SOA compounds from the par-ticles to the gas phase.
Figure 10a also shows the simulated SOA mass forma-tion when we treat the NH4RCOO salts as a separate phase(e.g. crystalline salt) which other condensable organic com-pounds cannot dissolve into. When NH3(g) is added dur-ing the start of the experiments the difference between themodel runs with and without a separate NH4RCOO phaseis relatively small. However, if the NH3(g) is added afterthe solid SOA particles have formed, only a moderate SOAmass increase is accomplished (∼ 9 %). This is in sharp con-trast to the results from the simulations with solid particlesand only one organic phase (mass increase of∼ 39 %). Thereason for this is that the ammonium salts are enriched inthe particle surface-bulk layer, and if no other compounds
can dissolve into this phase their uptake is limited. On theother hand, if NH4RCOO is part of a single amorphous or-ganic phase, it will lower the mole fractions of the othercompounds and hence increase (at least for ideal conditions)the uptake of them (see Eq. 2). This is the reason why thetotal SOA mass increase is larger (∼ 270 µg m−3, ∼ 39 %)than the increase explained purely by the carboxylic acidsand NH4RCOO (46+ 84= 130 µg m−3, ∼ 19 %) (see sim-ulation 4 in Fig. 10a and b). Na et al. (2007) observed amass increase of 15 % when 1000 ppb NH3 was added af-ter theα-pinene SOA particle mass formation had ceased.This increase is larger than the modelled increase when con-sidering complete phase separation between NH4RCOO andthe other condensable organic compounds but substantiallysmaller than for the simulations with only one organic phase.
7978 P. Roldin et al.: Modelling non-equilibrium secondary organic aerosol formation
This may indicate that, in reality, there will neither be perfect(ideal) mixing between NH4RCOO and the other condens-able organic compounds nor a complete phase separation.
Figure 11 shows (a) the modelled pH, (b) the total ammo-nium mass fraction (free and bonded in ammonium salts),(c) the NH4RCOO mass fraction and (d) the carboxylic acidmass fraction ([RCOO−] + [RCOOH]) for a semi-solid SOAparticle at different distances from the particle core. Thefigure includes results from the three simulations with ini-tial NH3(g) concentrations of 50, 100 and 200 ppb, respec-tively, and at 1 or 6 h of aging. A large fraction of the SOAformed early during the experiments are due to condensationof carboxylic acids. This explains the large mass fractionsof carboxylic acids and the lower pH in the particle cores(Fig. 11a and b). For the simulations with 200 ppb NH3, alarge fraction of the carboxylic acids and ammonium formsalts (Fig. 11c), while when only 50 ppb NH3 is added, am-monium salts are only present during the early stage of par-ticle formation, when the carboxylic acid mass fraction islarge. Because of the assumed relatively rapid mixing ofammonium (e-folding time of a few minutes), the free am-monium concentration (not bound in organic salts) is al-most constant in all particle layers. Hence, the differencesin the NH4RCOO concentrations between different layersare largely caused by differences in the carboxylic acid con-centrations, which even after 6 h of aging are not uniformlymixed.
It has been suggested that organic salt formation betweencarboxylic acids and NH3 or ammines could possibly be re-sponsible for the early growth of nanometre-sized particles inthe atmosphere (e.g. Smith et al., 2008; Barsanti et al, 2009;Smith et al., 2010; Yli-Juuti et al., 2013). In order to be ableto draw any conclusions from our simulations concerning thepotential effect of NH4RCOO formation in the atmosphere,we performed simulations where we decreased theα-pineneconcentration to 50 ppb and varied the NH3 concentration inthe range 0–2 ppb. We used 50 ppbα-pinene, because in themodel∼ 30 ppbα-pinene needs to react before the particleswith an initial diameter of 5 nm start to grow. Furthermore,the model simulations do not consider inorganic salt forma-tion between NH3 and the strong acids H2SO4 or HNO3. Yli-Juuti et al. (2013) showed that, for typical conditions overboreal forest, NH3 will preferentially form inorganic saltswith H2SO4 and not with carboxylic acids. In our simula-tions, very little NH4RCOO is formed even if the NH3 con-centration is 2 ppb and the average growth rate between 5 and20 nm is only amplified by∼ 7 % (see Supplement Fig. S16).
From the simulations in this section we can conclude thatADCHAM (with the pure-liquid saturation vapour pressuresfrom SIMPOL and activity coefficients from AIOMFAC)is able to reproduce the observed SOA formation at differ-ent concentrations of NH3(g). With NH3 present during theformation, reactive uptake of carboxylic acids contributessubstantially to the modelled early growth of the particlesformed by homogeneous nucleation. However, this is proba-
bly not the case for atmospherically more relevant NH3 andα-pinene concentrations.
3.4 SOA formation from oxidation of m-xylene
Here we model the SOA formation from anm-xylene ox-idation experiment (experiment P2 in Nordin et al., 2013).The experiment was conducted in a 6 m3 Teflon chamberin the Aerosol Laboratory at Lund University. The exper-iment started with dark conditions by adding (NH4)2SO4seed aerosol into the chamber (∼ 20 µg m−3), followedby ∼ 40 ppb NO and∼ 240 ppbm-xylene. Approximately30 min before the UV lights were turned on (∼ 90 min afterthe start of the experiment), (NH4)2SO4 particles were addeda second time in order to achieve the target (NH4)2SO4 massof ∼ 20 µg m−3.
The seed aerosol was formed by nebulizing an(NH4)2SO4–water solution and then drying the droplets.Before the dry (NH4)2SO4 particles were introduced intothe chamber they were passed through a bipolar charger inorder to achieve a well-defined nearly Boltzmann-distributedcharge distribution (Wiedensohler et al., 2012). The experi-ment was performed at a temperature of 22◦C± 2◦C, underdry conditions (RH of 3–5 %) and in the presence of UVlight with an experimentally derived NO2 photolysis rateof 0.2 min−1. The experimental set-up has been describedin detail by Nordin et al. (2013). The measured UV-lightspectrum (320–380 nm) is given in the supplementarymaterial of Nordin et al. (2013).
In the model we used a temperature of 21◦C and an RHof 5 %. The photolysis rates were calculated with the recom-mended cross sections and quantum yields from MCMv3.2and the measured 1 nm resolution UV spectrum from Nordinet al. (2013), with a total light intensity of 23 W m−2, whichgives a NO2 photolysis rate of 0.20 min−1.
3.4.1 Particle deposition loss rates
To be able to quantify the effect of deposition on the esti-mated SOA formation from chamber experiments, the depo-sition losses of particles to the chamber walls need to be eval-uated. The deposition depends on the friction velocity (u∗),the particle size and charge distributions, the mean electricalfield strength (E′′) in the chamber, and the chamber surface-area-to-volume ratio (see Sect. 2.2.3).E′′ andu∗ are com-monly not known, but can be estimated by fitting the modelto particle number size distribution measurements. For thispurpose an experiment was performed with (NH4)2SO4 seedparticles but without condensable organic compounds.
As the experiments in the chamber proceed, the chambersurface-area-to-volume ratio increased because of instrumentsampling and leakage out from the chamber due to a smallover pressure inside the chamber (see Nordin et al., 2013).We estimate the chamber volume loss rates (1V/1t) duringthe experiments to be 0.8± 0.2 m3 h−1.
P. Roldin et al.: Modelling non-equilibrium secondary organic aerosol formation 7979
Figure 12.Modelled deposition and coagulation losses of (NH4)2SO4 seed aerosol particles in the Lund University 6 m3 Teflon chamber. Weused a friction velocity of 0.05 m s−1 and a mean electrical field strength of 50 V cm−1. The chamber volume loss rate was set to 0.8 m3 h−1.The shown model results are both for the particle concentrations in the air (with or without coagulation) and on the particle walls.(a) showsthe modelled and measured particle number size distributions,(b) effective wall loss rates (modelled),(c) number concentration and(d)volume concentration.
In Supplement Fig. S17 we compare the modelled andmeasured temporal evolution of the particle number con-centration and particle volume concentration for simula-tions with different values ofE′′ and u∗. With a 1V/1t
of 0.8 m3 h−1, and an E′′ of 50 V cm−1 and a u∗ of0.05 m s−1, ADCHAM is able to nearly reproduce themeasured (NH4)2SO4 particle number size distributions(Fig. 12a), the temporal evolution of the total particle num-ber (Fig. 12c) and volume concentrations (Fig. 12d). Thecoagulation has no direct influence on the particle volumeconcentration but is important for the particle number con-
centration at the end of the experiment. At the beginning ofthe experiment the charged smallest particles are rapidly de-posited to the chamber walls, resulting in a high effectivewall deposition loss rate (kw (s−1)) (Fig. 12b). But, as theexperiment proceeds, the fraction of charged particles (es-pecially the small ones) decreases in the air. At the sametime the surface-area-to-volume ratio increases in the cham-ber, which in turn increases the deposition loss rates of allparticle sizes (see the gradual upward displacement of thecurves in Fig. 12b). Recharging of particles by collision withair ions was not considered in the model.
7980 P. Roldin et al.: Modelling non-equilibrium secondary organic aerosol formation
After the tuning of the deposition loss rates on the pureseed aerosol experiments, we used ADCHAM to simulatethe SOA formation experiment withm-xylene as a precursor(Nordin et al., 2013). However, if we use the same (1V/1t),E′′ andu∗ as in the pure seed particle deposition experiment,the model underestimates the seed aerosol mass loss (espe-cially during the first 2 h after the UV lights are turned on),but substantially overestimates the particle number concen-tration losses before the UV lights are turned on.
The heating of the air by the UV lights and the air condi-tion units which blow on the outer chamber walls can pro-duce an increased mixing within the chamber. Therefore, be-fore the UV lights are turned on,u∗ may be smaller. By de-creasingu∗ to 0.01 m s−1 before the UV lights are turned on,the model better captures the measured initial particle num-ber concentration losses.
Another important difference between the pure seed parti-cle experiment and them-xylene precursor experiment is thatthe latter experiment was performed over almost twice thelength of time (∼ 6 h). Hence, the effect of particle recharg-ing when colliding with air ions may be more important toconsider. Furthermore, the chamber volume during the endof them-xylene experiment was substantially smaller (1.5–2 m3). This might have increased the effective mean electri-cal field strength within the chamber (see Sect. 2.2.3). In themodel we try to account for this by calculatingEt (at timet) as the quotient between the initial mean electrical fieldstrengthE0 (50 V cm−1) and the relative change of the ap-proximate distance between the roof and ceiling (h) of thechamber (ht/h0)(which is approximately equal to the rela-tive chamber volume change (Vt/V0)) (Eq. 30).
Et =E0
ht/h0≈
E0
Vt/V0(30)
Figure S18 in the Supplement compares the modelled andmeasured (with AMS and scanning mobility particle sizer(SMPS)) temporal evolution of the sulfate seed particle massconcentration, particle number concentration and particlenumber size distribution, and the modelled initial and finaleffective deposition loss rates. The model results are fromsimulations withEt = 50 V cm−1 andu∗
= 0.05 m s−1 or Et
calculated with Eq. (30) and withu∗= 0.01 m s−1 before the
UV lights are turned on. With the latter values the modelshows substantially better agreement with the measured tem-poral evolutions of the sulfate seed aerosol mass concentra-tion. However, the model still overestimates the particle num-ber concentration loss rates (especially after the UV lightsare turned on). For the model simulations presented belowwe will use Eq. (30) to estimateEt , andu∗
= 0.01 m s−1 be-fore the UV lights are turned on, andu∗
= 0.05 m s−1 afterthe UV lights are turned on.
3.4.2 Gas–particle partitioning and heterogeneousreactions
Since them-xylene experiment was performed under dryconditions, the (NH4)2SO4 seed particles will initially be ina solid crystalline phase. Therefore, we assume that no mate-rial is mixed between the crystalline solid salt cores and theSOA coating (see e.g. Fig. 1a in Bertram et al., 2011). Hence,in the model there will be no salting-out effect (increase ofthe nonpolar organic compound activity coefficients causedby NH+
4 , SO−24 and HSO−
4 from the seed aerosol particles)(see discussion in Sect. 3.3 on possible salting-out effects ofNH+
4 ).In total we considered 112 potentially condensable (p0 <
1 Pa) non-radical organic MCMv3.2 compounds. The pure-liquid saturation vapour pressures were calculated with ei-ther SIMPOL (Pankow and Asher, 2008) or the methodfrom Nannoolal et al. (2008). We also used a third (semi-empirical) method to model the SOA formation. This methodconsiders a total of three oxidation products with vapourpressures and molar-based stoichiometric yields (αi) de-rived from the parameterizations for low and high NO con-ditions from Ng et al. (2007). For this we assume thatthe condensable organic compounds have a molar mass of200 g mol−1. The two most volatile compounds (p0,1 = 6.4×
10−6 Pa,α1 = 0.021 andp0,2 = 1.7× 10⁻⁴ Pa,α2 = 0.061)represent the volatility distribution of the condensable oxida-tion products formed through the RO2 + NO pathway. Thethird non-volatile product (p0,3 = 0 Pa,α3 = 0.245) repre-sent the generally less volatile organic compounds formedthrough the RO2 + HO2 pathway. The gas phase was stillmodelled with the MCMv3.2. The fraction of condens-able organic compounds which was formed through theRO2 + HO2 pathway (product 3) was derived with the ra-tio (kRO2+HO2[HO2] / (kRO2+NO[NO] + kRO2+HO2[HO2]) asproposed by Ng et al. (2007).
The partitioning of the condensable organic compounds tothe wall-deposited particles and the Teflon walls was mod-elled according to the procedure described in Sect. 2.2.3. Theuptake onto the Teflon film and the particles deposited on thechamber walls depends on the laminar layer width adjacentto the chamber walls (1x). The uptake (adsorption) on theTeflon film also depends on the first-order loss rate from thenear-wall gas phase to the walls (kg,w) and the desorptionrate from the Teflon surfaces out to the thin layer next to thechamber walls (kw,g,i) (Eq. 4). In Sect. 3.4.4 we test differentvalues of1x, kg,w andkw,g,i in order to find the best possi-ble agreement between the modelled and the measured SOAformation.
Because coagulation has a considerable influence on themodelled particle number size distribution (see Fig. 12), wewill consider this process as well. However, with the cur-rent version of ADCHAM coagulation cannot be combinedwith the complete kinetic multilayer model (see Sect. 2.2.2).Hence, for the simulations presented in this section, the
P. Roldin et al.: Modelling non-equilibrium secondary organic aerosol formation 7981
particles were only divided into a solid seed particle core anda second (well-mixed) bulk layer and a surface monolayer,which are composed of the condensable organic compounds.Additionally (if specified) we also consider the adsorptionand desorption of O3 and NO2, the mass-transfer-limited dif-fusion of O3 and NO2 from the sorption layer into the particlebulk, and the particle-phase reactions between O3 and unsat-urated organic compounds (see Sect. 2.4.2) or between NO2and oxidized aromatic compounds (see Sect. 3.4.3).
Table 1 in Sect. 2.4.2 gives the model parameter val-ues used for O3 uptake. For the simulations presentedhere, the diffusion coefficient of ozone (D0,O3) was setto values between 10−7 and 10−8 cm2 s−1 (semi-solidSOA (see e.g. Table 1 in Shiraiwa et al., 2011), andthe reaction rate constants between ozone and the un-saturated (non-aromatic carbon–carbon double bond) or-ganic compounds (kO3) were varied between 10−16 and10−17 molecules−1 cm3 s−1. This can be compared with themeasuredkO3 of 10−16 molecules−1 cm3 s−1 for the het-erogeneous ozonolysis of oleic and palmitoleic acid (HuffHartz et al., 2007). Berkemeier et al. (2013) used the KM-SUB model to constrain the kinetic parameter values whichlimit the ozonolysis of oleic acid. According to their modelsimulations, kO3 should be somewhere in the range of1.7× 10−15–1.7× 10⁻¹⁷ molecules−1 cm3 s−1. The formedparticle-phase oxidation products were assumed to be non-volatile, which is likely an acceptable assumption if the ox-idation products rapidly react and form dimer SOA (seee.g. Maksymiuk et al., 2009). Apart from increasing the SOAmass formation and changing the chemical composition ofthe SOA, these heterogeneous reactions may also serve asan additional ozone sink (which is not accounted for by theMCMv3.2 gas-phase chemistry mechanism).
Additionally, we will also test peroxyhemiacetal and hemi-acetal dimer formation in the particle phase.
3.4.3 Gas-phase chemistry and influence from chamberwalls and heterogeneous reactions
Bloss et al. (2005a, b) have previously shown that theMCMv3.1 (without particle SOA formation and particle-phase chemistry) generally overestimates the ozone con-centration and underestimates the OH concentration dur-ing oxidation of light aromatic compounds (e.g. xylene andtoluene). Hence, for these systems MCM also tends to un-derestimate the NO and hydrocarbon oxidation (loss) rates.In order to account for the missing OH source, Bloss etal. (2005b) had to include an artificial OH source of 4×
108 molecules cm−3 s−1 when modelling a toluene oxidationexperiment from the EUPHORE chamber.
Conversion of NO2 to HONO on the organic particlesurfaces may partly explain the discrepancy between themodelled and measured particle-phase chemistry (Bloss etal., 2005b). These reactions have been observed on dieselexhaust particles (Gutzwiller et al., 2002) and on organic
aerosol surfaces, for example, by George et al. (2005). Met-zger et al. (2008) instead proposed that the NO2 is primarilyconverted to HONO on the Teflon chamber walls.
In this work we will test the heterogeneous NO2-to-HONOconversion mechanism. Bloss et al. (2005b) modelled thismechanism using a constant reaction probability (γHONO) of0.025 for the NO2 molecules which collide with a particle. Inthis work we model this proposed mechanism in a more de-tailed way by considering the adsorption, diffusion and reac-tion of NO2 with specific organic compounds in the particlephase. NO2 has approximately the same Henry’s law coef-ficient for dissolution in water (Seinfeld and Pandis, 2006)and molecule size as O3. Hence, for these simulations, wewill use the same parameter values for NO2 (e.g. Henry’slaw coefficient and diffusion coefficient) as specified for O3in Sect. 3.4.2 and in Table 1.
Gutzwiller et al. (2002) suggested that the organic com-pounds which react with NO2 in the particle phase and formHONO are oxygenated aromatics (e.g. 2-methoxyphenol).Hence, we assume that it is only the compounds that containan aromatic ring which will be oxidized by NO2 and formHONO. The organic oxidation products formed from theseheterogeneous reactions were assumed to be non-volatile.
The NO2 to HONO conversion mechanism was consid-ered both on the particles deposited on the chamber wallsand in the air. We will also test an additional photo-enhancedbackground reactivity caused by HONO release from thechamber walls (Rohrer et al., 2005). The strength of theHONO emissions (from the walls to the near-surface gasphase) in the Lund Teflon chamber (Nordin et al, 2013)was estimated to be 4.6×10⁸ molecules cm−2 s−1. This valueis based on the estimated HONO wall production rate of9.1× 106 molecules cm−3 s−1 in Metzger et al. (2008) andtheir chamber volume to surface area characteristics (Paulsenet al., 2005).
Analogous to the MCM light aromatic model simulationsby Bloss et al. (2005a, b), we underestimate the OH and over-estimate the maximum O3 concentration without tuning theMCM gas-phase chemistry (Fig. 13). MCMv3.2 also under-estimate the initial O3 formation rate, the amount of reactedm-xylene, and the rapid NO-to-NO2 conversion which startsapproximately 20 min after the UV lights were turned on.Therefore, analogous to Bloss et al. (2005b), we decided toinclude an artificial OH source, in our case with a rate of108 cm−3 s−1 from 20 min after the UV lights were turnedon until the end of the experiment. This substantially im-proves the agreement between the modelled and measuredNO, NO2, O3 and m-xylene concentrations. However, themodel still substantially overestimates the maximum O3 con-centration.
The poor agreement between the modelled and measuredNO2 in the latter half of the experiment (Fig. 13b) is becauseof the interference from peroxyacyl nitrates (PAN), HNO3,HONO, N2O5 and other nitrate-containing compounds in the
7982 P. Roldin et al.: Modelling non-equilibrium secondary organic aerosol formation
Figure 13.Modelled and measured gas-phase concentrations from them-xylene oxidation experiment by Nordin et al. (2013).(a–d)give themodelled and measured NO, NO2, O3 andm-xylene concentration, respectively.(e–f) show the modelled OH and HONO concentrations.The model results are from simulations with (1) the original MCMv3.2 gas-phase chemistry, (2) with MCMv3.2 gas-phase chemistry and anartificial OH source of 108 cm3 s−1, and (3) with MCMv3.2 gas-phase chemistry, the artificial OH source and wall emissions of HONO.
chemiluminescence instrument used (see Nordin et al., 2013,and references therein).
Figure 13 also shows the results from a simulation wherewe additionally include HONO emissions from the cham-ber walls. Because the surface-area-to-volume ratio increasesduring the experiments (∼ 5 times) these emissions have anincreasing influence on the modelled gas-phase chemistry.With HONO emissions and the OH source, the OH concen-tration at the end of the model run is 1.5× 106 cm−3, whilewithout these emissions but with the OH source the concen-
tration is 7× 105 cm−3. Hence, with HONO wall emissions,more m-xylene reacts in the simulation than what is indi-cated by the gas chromatography–mass spectrometry (GC-MS) measurements. Additionally, the model O3 concentra-tion becomes even higher.
In order to be able to compare the modelled and mea-sured SOA formation during the experiment, it is crucial thatwe are able to accurately simulate both the amount ofm-xylene which is consumed and the fraction of RO2 whichreacts with HO2 and NO (see e.g. Ng et al., 2007 and Kroll
P. Roldin et al.: Modelling non-equilibrium secondary organic aerosol formation 7983
and Seinfeld, 2008). Hence, if not otherwise specified, we in-cluded the artificial OH source but not any HONO emissionsfrom the chamber walls. With this model set-up, the cumu-lative fraction of them-xylene first-generation RO2 oxida-tion products which have reacted with HO2 at the end of theexperiment is about∼ 65 %. When we also include HONOwall emissions this value is∼ 50 %, and with the non-tunedMCMv3.2 chemistry we get a value of∼ 35 % (see Supple-ment Fig. S19).
In order to test whether HONO formation from het-erogeneous reactions between NO2 and oxidized aro-matic compounds can improve the agreement betweenthe modelled and measured O3 concentration, we per-formed a simulation with what we believe are upper es-timates of the reaction rates between NO2 and the oxi-dized aromatic compounds and the NO2 diffusion coef-ficient (kNO2 = 10−15 molecules−1 cm3 s−1 and D0,NO2 =
10−7 cm2 s−1). With these values,∼ 60 % of the aromaticSOA was oxidized by NO2. The formed (in the model non-volatile) oxidation products comprise 20 % of the total SOAmass at the end of the simulation (Supplement Fig. S20a).Still, this has only a moderate influence on the HONO con-centration (Supplement Fig. S20b) and the NO2 and O3 de-crease is equal to or less than∼ 1 % (Fig. S20c–d).
Figure S20d also shows the modelled O3(g) con-centration when including heterogeneous reactions be-tween O3 and the unsaturated organic compounds (kO3 =
10−16 molecules−1 cm3 s−1 andD0,O3 = 10−7 cm2 s−1). Forthis simulation,∼ 98 % of the unsaturated organic com-pounds in the particle phase were oxidized by O3 and theformed non-volatile SOA products comprise 37 % of the to-tal SOA mass. However, comparable to the heterogeneousNO2 to HONO conversion, this has a very small influence onthe modelled O3(g) concentration (∼ 1 % decrease). Hence,we can conclude that it seems unlikely that heterogeneousreactions between NO2 and oxidized aromatic compoundsand/or between O3 and the unsaturated organic compoundscan explain why measurements generally give much lowerO3(g) concentrations than MCM. However, as will be shownin Sect. 3.4.4, these heterogeneous reactions can still be im-portant for the amount and type of SOA which is formed.
3.4.4 SOA formation, properties and the potentialinfluence from chamber wall effects andheterogeneous reactions
In Fig. 14 we compare the modelled and measured parti-cle volume concentrations during them-xylene experiment.The model results are from simulations with the SIMPOLvapour pressure method. The desorption of condensable or-ganic compounds from the chamber walls was modelledwith Cw/
(Mwγw,i
)in Eq. (4) equal to 100 µmol m−3. This
value is between those measured by Matsunaga and Ziemann(2010) for 2-alcohols and 2-ketones (see Sect. 2.2.3). Forthe model results in Fig. 14a we used a1x of 0.1 cm and
kg,w was set to 1/20 s−1, while for the results in Fig. 14bwe used a1x of 1.0 cm andkg,w was set to 1/6 s−1. Hence,the model simulation in Fig. 14a represents conditions withonly relatively small mass transfer limitations for the gas ex-change between the air and the chamber walls and particleson the walls, and a relatively slow uptake of organic com-pounds directly onto the Teflon walls. The model simula-tion in Fig. 15b instead represents conditions where the masstransfer limitations between the air and the chamber wallsand particles on the walls are substantial while the uptake ofgases directly onto the Teflon walls is relatively effective.
The simulations were performed both with and withoutheterogeneous oxidation of unsaturated organic compoundsusing kO3 and D0,O3 as model-fitting parameters. The ox-idation products (ox. prod.) from these reactions were as-sumed to form one organic semi-solid phase together with theother organic compounds (D0,monomer= 5× 10⁻¹⁷ cm2 s−1
andDox. prod. = 0 cm2 s−1).In the model simulations presented in Fig. 14 it is shown
that the model is able to capture the volume loss rates of theseed aerosol and the onset of the SOA formation in the ex-periment (∼ 0.5 h after UV lights were turned on). With akO3
of 10−16 molecules−1 cm3 s−1 and aD0,O3 of 10−8 cm2 s−1
the model shows the best agreement with the observed parti-cle volume concentration more than 1.5 h after the UV lightsare turned on. However, for all simulations in Fig. 14, AD-CHAM underestimates the observed rapid SOA formationbetween 0.5 and 1.25 h for the particles suspended in air. Ad-ditionally, ADCHAM overestimates the total particle volumeloss rates of the suspended particle at the end of the experi-ments, especially without heterogeneous ozonolysis and rel-atively rapid uptake of organic compounds onto the Teflonwalls (Fig. 15b). According to this simulation the particlelosses are caused not only by deposition but also evapora-tion. Heterogeneous ozonolysis or other particle-phase reac-tions allows for more gas-phase monomers to partition intothe particle phase and delay the time when the evaporationand deposition losses dominates over the SOA formation (seeSupplement Fig. S21). Additionally, the SOA formed fromthese particle-phase reactions is less volatile (in the modelnon-volatile) and will therefore decrease the evaporation lossrates (see Sect. 3.2).
Opposite to the simulation results in Fig. 14b, themaximum particle volume is larger without heterogeneousozonolysis in Fig. 14a. For these simulations the SOA forma-tion onto the wall-deposited particles is more efficient (1x =
0.1 cm) and the gas uptake onto the Teflon walls smaller.The wall-deposited particles may not always serve as a sinkof SOA but can also become a source of condensable or-ganic compounds from the walls to the air. This is especiallythe case if the formed SOA is relatively volatile. The morevolatile the SOA is, the smaller the SOA fraction found onthe wall-deposited particles will be. Hence, while the formedtotal SOA mass (air+ walls) is larger with heterogeneous
7984 P. Roldin et al.: Modelling non-equilibrium secondary organic aerosol formation
Figure 14. Modelled and measured volume concentrations of (seed aerosol+ SOA coating) during them-xylene oxidation experiment byNordin et al. (2013). The model results are given both for the particles in the air and for those that have deposited on the chamber walls. Theresults in(a) are from simulations with a laminar layer width (1x) of 0.1 cm adjacent to the chamber walls and a first-order loss rate fromthe near-wall gas phase to the walls (kg,w) of 1/20 s−1. The results in(b) are from simulations with a1x of 1.0 cm and akg,w of 1/6 s−1.The figures show both the results from simulations without or with heterogeneous reactions between O3 and unsaturated organic compounds(kO3 = 10−16molecules−1 cm3 s−1 andD0,O3 = 10−8 cm2 s−1).
reactions in Fig. 14a, the SOA mass formed on the particlesin the air is smaller (see also Fig. S22 in the Supplement).
Figure S23 in the Supplement compares the modelledparticle volume from simulations with the SIMPOL andNannoolal vapour pressure method or the semi-empiricaltwo product model parameterization (see Sect. 3.4.2). Themodel simulations were performed with a1x of 0.1 cm andkg,w = 1/20 s−1. For the simulations with the SIMPOL and
the Nannoolal method, heterogeneous ozonolysis was alsoconsidered (kO3 = 10−16 molecules−1 cm3 s−1 andD0,O3 =
10−8 cm2 s−1). From this figure it is evident that both meth-ods give almost identical SOA mass formation at the end ofthe experiment. However, with the Nannoolal method the on-set of the SOA formation is approximately 15 min too late.The reason for this is that the modelled early-stage SOAformation is dominated by two MCM oxidation products
P. Roldin et al.: Modelling non-equilibrium secondary organic aerosol formation 7985
Figure 15. Modelled and measured volume concentrations (seedaerosol+ SOA coating) during them-xylene oxidation experimentfrom Nordin et al. (2013). The model results are from simula-tions with relatively rapid (kf = 10−22molecules−1 cm3 s−1) per-oxyhemiacetal and hemiacetal formation,1x = 0 or 0.1 cm andkg,w = 0 or 1/15 s−1. The model results are given both for the par-ticles in the air and the particles deposited on the chamber walls.
(MXNCATECH and MXYMUCNO3) (formed through thehigh NO oxidation pathway; see Sect. 3.4.3). Both of thesecompounds have higher vapour pressures with the Nannoolalmethod (3.1× 10⁻³ and 1.31× 10⁻⁴ Pa) compared to theSIMPOL method (1.9× 10⁻⁴ and 7.5× 10⁻⁵ Pa).
With the semi-empirical parameterization, derived fromexperiments in a similar but larger Teflon chamber (28 m3)(Ng et al., 2007), ADCHAM gives a too early onset of theSOA formation and overestimates the SOA formation whenkg,w = 1/20 s−1. The reason for this is that the three modelcompounds of this method all have relatively low vapourpressures (see Sect. 3.4.2). Hence, the gas phase is rapidlysaturated with respect to all these three compounds, whichare effectively taken up by the particles before they are lostto the Teflon wall surfaces. In order to not overestimate thefinal SOA mass,kg,w needs to∼ 1 s−1. However, then themodel substantially underestimates the early-stage SOA for-mation rate.
We also modelled the SOA formation without losses ofcondensable organic compounds onto the Teflon wall (seeFig. S24 in the Supplement). With a1x of 0.1 cm, AD-CHAM is now able to capture the rapid early-stage SOAformation in the chamber. However, the final particle vol-ume concentration in the air is overestimated with∼ 40 %.If we instead assume that the gas–particle partitioning onto
the chamber-wall-deposited particles is identical to the up-take onto the particles suspended in the air (1x = 0 cm) (seeSect. 2.2.3 and references there in), then the model again sub-stantially underestimates the early-stage SOA formation rate,while it gives reasonable particle volume concentrations atthe end of the simulation.
Finally we also tested whether a relatively rapid oligomer-ization process in the particle phase could improve the agree-ment with the modelled and measured SOA formation. Forthese simulations we again use the SIMPOL vapour pres-sure method and assume that peroxyhemiacetal and hemi-acetal dimers form in the particle phase. We find the bestagreement between the modelled and measured SOA forma-tion when we use akf of 10−22 molecules−1 cm3 s−1. Thisvalue ofkf corresponds well with previously reported valuesof kf for hemiacetal and peroxyhemiacetal formation underweekly acidic conditions (pH≈ 4) (see Sect. 2.3.4). In or-der to shift the equilibrium toward the particle phase (whichmight explain the rapid early-stage SOA formation seen inthe experiment) we assume that the oligomers and monomersform one mixed phase.
Figure 15 shows the modelled particle volume concen-trations when considering peroxyhemiacetal and hemiacetaldimer formation and with1x = 0 or 0.1 cm andkg,w = 0 or1/15 s−1. Without gas-phase losses onto the Teflon walls andideal uptake onto wall-deposited particles (1x = 0 cm) themodel is able to capture the rapid early-stage SOA forma-tion seen in the experiment. After this the modelled particlevolume concentration in the air continues to increase slowlyfor additionally∼ 2 h, while in the experiment the measuredparticle volume slowly decreases.
With mass-transfer-limited diffusion and losses of con-densable organic compounds from the near-wall gas phaseto the Teflon walls (1x = 0.1 cm andkg,w = 1/15 s−1), themodel results are in better agreement with the measurementsat the end of the experiment and can nearly reproduce therapid SOA formation at the beginning of the experiment.
Hence, these simulations indicate that relatively rapid het-erogeneous reactions (either oligomerization or oxidation)are required in order to explain the observed rapid SOA for-mation at the beginning of them-xylene oxidation experi-ment. Still, the model cannot fully explain the sharp tran-sition between the rapid SOA formation between 0.5 and1.25 h after the UV light is turned on and the slow almostlinear volume (mass) loss observed during the latter half ofthe experiment.
In Fig. 16 we compare the temporal evolution of themodelled SOA formation without wall losses to the cham-ber walls (ideal chamber), using the SIMPOL, Nannoolalor the semi-empirical parameterization method from Nget al. (2007). The figure also illustrates the influencefrom heterogeneous ozonolysis (O3 ox.) of unsaturated or-ganic compounds (kO3 = 10−16 molecules−1 cm3 s−1 andD0,O3 = 10−8 cm2 s−1) and peroxyhemiacetal and hemiac-etal oligomer formation (kf = 10−22 molecules−1 cm3 s−1).
7986 P. Roldin et al.: Modelling non-equilibrium secondary organic aerosol formation
We have also included the measured wall-loss-correctedSOA mass (SOA mass scaled with the measured relative sul-fate loss rate from the time when the UV lights are turned on)(see Sect. 2.2.3).
The simulation with SIMPOL and no heterogeneous re-actions gives best agreement with the measured final SOAmass formation (70 and 65 µg m−3, respectively). However,this simulation substantially underestimates the SOA forma-tion during the start of the experiment. The best agreementbetween the model and measurements at the beginning ofthe experiment is instead reached when we include relativelyrapid oligomerization in the particle phase. The results fromthis simulation also show surprisingly good agreement withthe model simulation using the semi-empirical parameteriza-tions from Ng et al. (2007). This again indicates that hetero-geneous reactions are likely to be important for the SOA for-mation. The larger SOA formation from these model simula-tions compared to the measurements can likely be attributedto substantial gas-phase losses directly onto the Teflon wallsin the chamber. This effect will be especially pronounced atthe end of the experiment, when the surface-area-to-volumeratio is large (see Sect. 3.4.1). Hence for this experiment, themodel simulations indicate that the wall corrections (whichassume continued uptake of condensable organic compoundsonto the wall-deposited particles) do not give an upper esti-mate of the actual (atmospheric relevant) SOA formation (seeSect. 2.2.3).
4 Summary and conclusions
We have developed the novel Aerosol Dynamics, gas- andparticle-phase chemistry model for laboratory CHAMberstudies (ADCHAM). ADCHAM combines the detailed gas-phase chemistry from MCMv3.2; a kinetic multilayer mod-ule for diffusion-limited transport of compounds betweenthe gas phase, particle surface and particle bulk phase; andan aerosol dynamics and particle-phase chemistry modulewhich is based on the ADCHEM model (Roldin et al., 2011a)but with important updates, among others process-based al-gorithms for non-ideal interactions (salt effects) betweenwater, organic and inorganic compounds, acidity-catalysedoligomerization, and oxidation of organic compounds in theparticle phase.
In this work we have illustrated the usefulness of AD-CHAM in studying potentially influential but poorly knownprocesses, i.e. different dimerization mechanisms; organicsalt formation; salting-out effects; and heterogeneous oxi-dation reactions and mass transfer limitations between thegas–particle phase, between the particle surface and particlebulk phase, and within the particle bulk phase. All these pro-cesses influence the modelled SOA formation and chemicaland physical properties (e.g. volatility, phase state, oxidationstate and hygroscopicity).
Figure 16. Modelled and measured (wall-loss-corrected) SOAmass during them-xylene oxidation experiment by Nordin etal. (2013). The model results are from simulations without walllosses to the chamber walls. The simulations were performed withthe SIMPOL vapour pressure method without or with heteroge-neous reactions between O3 and the unsaturated organic compounds(kO3 = 10−16molecules−1 cm3 s−1 andD0,O3 = 10−8 cm2 s−1),the Nannoolal vapour pressure method and heterogeneous reac-tions between O3 and the unsaturated organic compounds, the semi-empirical parameterizations from Ng et al. (2007), and the SIM-POL vapour pressure method and peroxyhemiacetal and hemiacetaldimer formation (kf = 10−22molecules−1 cm3 s−1).
Additionally, we have also shown how ADCHAM can beused to study the influence of the chamber wall effects on theSOA mass formation, evaporation properties, particle num-ber size distribution and gas-phase chemistry. These effectsare important to constrain because current knowledge con-cerning SOA formation in the atmosphere is to a large ex-tent based on smog chamber experiments, and global climatemodels and chemistry transport models rely on simplifiedsemi-empirical parameterizations of SOA formation derivedfrom these experiments.
The most important findings from the model simulationsperformed in this article are as follows:
1. Our simulations of theα-pinene SOA evaporation ex-periments from Vaden et al. (2011) support the recentexperimental findings that these particles are very vis-cous (tar-like amorphous SOA) (Virtanen et al., 2010;Vaden et al., 2010, 2011; Kuwata and Martin, 2012;Zelenyuk et al., 2012; Abramson et al., 2013; Zhouet al., 2013). In these particles low-volatility dimerscan accumulate in the particle surface-bulk layer upon
P. Roldin et al.: Modelling non-equilibrium secondary organic aerosol formation 7987
evaporation. With this dimer coating, ADCHAM is ableto reproduce the main features of the observed slowevaporation rates if it is controlled by the reversibledegradation of dimers back to monomers. The modelsimulations illustrate that the mass fraction of long-liveddimers needs to increase with decreasing particle size toexplain the nearly size-independent evaporation rates.Because of the Kelvin effect, this can be accomplishedif a considerable fraction of the dimers are formed in thegas phase or if they are formed in the particle phase fromthe least volatile monomer compounds. The model sim-ulations also reveal that the dimer particle content andthus the observed evaporation rates ofα-pinene SOAparticles may not only depend on chemical aging butalso on the wall losses in the chamber where the parti-cles are formed.
2. The effect of NH3(g) on theα-pinene SOA propertiesand formation depends on (1) the reactive uptake of car-boxylic acids and NH3(g) from the gas phase, (2) theviscosity of the SOA particles (ammonium and organiccompound diffusion rates) and (3) the salting-out effectsof NH+
4 . In order to distinguish between these effects werecommend future experiments with AMS, in which theSOA particles are exposed to NH3 in the absence of gas-phase carboxylic acids. In the model simulations the or-ganic salts between ammonium and carboxylic acids areinvolved in the initial growth of the particles. However,for atmospherically more relevant NH3(g) andα-pineneconcentrations, NH3 has only a minor influence on theuptake of carboxylic acids to the particle phase. Thusanalogous to Yli-Juuti et al. (2013), our simulations in-dicate that it is unlikely that NH3 and carboxylic acidsfrom α-pinene oxidation are responsible for the initialgrowth of nanometre-sized particles over the boreal for-est.
3. Mass transfer limitations between the smog chamber airvolume and the chamber walls because of a thin lami-nar layer adjacent to the walls have a large influenceon the uptake of gases onto the wall-deposited parti-cles or directly onto the walls. If the formed SOA ma-terial is semi-volatile, the SOA particles on the cham-ber walls may even start to evaporate and hence becomea source of SOA at the end of smog chamber exper-iments. Paradoxically, heterogeneous reactions whichgive less volatile SOA and generally more SOA masscan increase the fraction of SOA which is found on thechamber walls and can thus even decrease the detectableSOA mass suspended in the chamber air volume.
4. In order to capture the rapid SOA formation observedduring the oxidation ofm-xylene in the Lund Univer-sity smog chamber, we need to consider relatively rapiddimerization and/or some other heterogeneous reactions(e.g. ozonolysis of unsaturated organic compounds).When considering peroxyhemiacetal and hemiacetaldimer formation in the particle phase, ADCHAM is ableto capture the observed early-stage rapid SOA forma-tion in our ownm-xylene experiment and gives almostidentical SOA mass formation to the semi-empirical pa-rameterizations from Ng et al. (2007). This indicatesthat heterogeneous particle-phase reactions are not onlyimportant for the SOA properties (e.g. volatility) butalso for the concentration and formation rates.
Another more general conclusion which can be drawn fromthe simulations performed in this work is that many of theparameters (processes) with large uncertainties (e.g. SOAviscosity, oligomerization rates and mechanisms, pure-liquidsaturation vapour pressures, surface tension and chamberwall effects) have a large influence on the SOA formationand/or the chemical and physical properties of the SOA. Tobe able to constrain the uncertainties related to these pa-rameters (processes), the experiments need to be designedin such a way that as many variables as possible are varied(e.g. time of aging, temperature, RH, concentrations, dilu-tion, oxidation agents and light intensities). In addition tofrom evaluating experimental results, ADCHAM can be usedas a valuable model tool when planning, designing and se-lecting which experiments and instrumentation are needed inorder to be able to answer specific research questions. Them-xylene experiment studied in Sect. 3.4 is part of a largerexperiment campaign designed in order to study aging of an-thropogenic SOA precursors and petrol car exhausts (Nordinet al., 2013). In that experiment campaign an early versionof ADCHAM was used to study chamber wall effects, gas-phase chemistry and SOA formation before the experimentswere performed. Currently we are applying ADCHAM tostudy the aging of gasoline car exhausts and ELVOC for-mation fromα-pinene ozonolysis. We have also started toimplement many of the detailed processes (e.g. the kineticmultilayer model, different dimerization processes and thedetailed MCMv3.2 gas-phase chemistry) in the ADCHEMmodel (Roldin et al., 2011a), which we use for detailed at-mospheric process studies.
7988 P. Roldin et al.: Modelling non-equilibrium secondary organic aerosol formation
Appendix A
Table A1. Nomenclature.
Symbol Description
αs Surface-bulk accommodation coefficientα0,s Surface accommodation coefficient of surface free from
adsorbing materialγ Activity coefficientγw,i Activity coefficient of compoundi in a Teflon wall filmδk Width of particle layerk1x Laminar layer width adjacent to chamber walls or char-
coal denuderθs Relative surface coverage of the adsorbed speciesµ Dynamic viscosity of airρair Density of airρp Particle-phase densityσ Surface tension of organic compoundsτd,Zox Desorption lifetime ofZoxωZox Mean thermal velocity ofZoxνe Characteristic average deposition velocity due to elec-
trostatic forces
�(1,1)AB
Collision integral between moleculesA andB
Ak Area of exchange between particle layerk−1 andk
Achamber Chamber surface areacd Dimer particle-phase concentrationcH+ Hydrogen ion concentrationcm Monomer particle-phase concentrationCc Cunningham slip correction factorCk Kelvin effectC∞ Gas-phase concentration far from the particle surfacesCs Saturation gas-phase concentration at the particle sur-
faceCw Effective wall-equivalent mass concentrationdZox Width of theZox sorption layerdi Collision diameter of compoundidair Collision diameter of compound air moleculesdi,air Collision diameter for binary collisions between com-
poundi and air moleculesDp Particle diameterDva Vacuum aerodynamic diameterD0,Xi
Diffusivity coefficient of compoundXi without ob-structing material
DXiDiffusion coefficient of compoundXi
e Elementary charge of a single protonE′′ Mean electrical field strengthE0 Initial mean electrical field strengthF Fuchs–Sutugin correction factor in the transition regionfp Particle volume fraction of solid or semi-solid obstruct-
ing materialFf (p) Dimer formation rates in the particle phaseh Distance between the roof and ceiling of the chamberI Molar condensation growth rateJads,Zox Adsorption rate ofZox to the sorption layerJdes,Zox Desorption rate ofZox from the sorption layerkb The Boltzmann constantkcharge First-order deposition loss rate due to charge
Transport velocity of compoundXi between the layersk and layerk + 1.
kOx Oxidation reaction rate constant in the particle phasekso,su,Zox Transport velocity ofZox from the sorption layer to the
surface-bulk layerksu,so,Zox Transport velocity ofZox from the surface-bulk layer to
the sorption layerkg,w First-order loss rate from the near-wall gas phase to the
wallskw,g Desorption rate from the chamber wall Teflon surfaceskw Effective particle wall deposition loss rateKa Acid dissociation constantKH Henry’s law constantKs Solubility product of saltK∗
s Effective solubility product of organic saltsKn Non-dimensional Knudsen numbermi Molecular mass of compoundimair Average air molecular massMi Molar mass of compoundiMw Average molar mass of a Teflon wall filmN Number of elemental charges of a particleNa Avogadros’s numberp Total pressurep0 Pure-liquid saturation vapour pressureps Equilibrium vapour pressurepH Negative 10-logarithm of the hydrogen ion concentra-
tionpKa Negative 10-logarithm of the acid dissociation constantR Universal gas constant (8.3145 J K−1 mol−1)RH Relative humidity in percentt TimeT Temperature in kelvinu∗ Friction velocityVk Volume of particle layerkVchamber Chamber volumeVwall Air volume of a thin layer adjacent to the chamber walls[VXi
]k
Absolute volume concentration of compoundXi in par-ticle layerk.
x Mole fractionsxk Ratio between the smaller and larger of the two volume
fluxes acrossAk
X Condensable organic compound[Xi
]k
Relative volume concentration of compoundXi in par-ticle layerk.
[Xi,g,w] Concentrations of compoundXi in the thin layer adja-cent to the chamber walls
[Xi,w] Concentration of compoundXi on the chamber wallY Organic compound formed by particle-phase oxidation
reactionZox Oxidation agent in the particle phase (e.g. OH, O3, NO3
P. Roldin et al.: Modelling non-equilibrium secondary organic aerosol formation 7989
Acknowledgements.This work was supported by the strategic re-search area MERGE at Lund University; the Swedish ResearchCouncil for Environment, Agricultural Sciences and Spatial Plan-ning FORMAS through projects 2007-1205, 2008-1467, 2009-615and 2010-1678; the Swedish Research Council through project2006-5940; and by Metalund, the Centre for Medicine and Tech-nology for Working Life and Society, a competence centre at LundUniversity, Sweden, supported by FAS, the Swedish Council forWorking Life and Social Research. Support for A. Zelenyuk wasprovided by US Department of Energy (DOE), Office of Science,Office of Basic Energy Sciences (BES), Chemical Sciences, Geo-sciences, and Biosciences Division.
The authors would like to thank Prof. Gordon McFiggans’research group at the University of Manchester, and especiallyDr. David Topping, for helpful discussions and for providing thePython script (now a publicly available function called Comp-SysProp:http://ratty.cas.manchester.ac.uk/informatics/) to calculateNannoolal-based sub-cooled liquid saturation vapour pressures forall organic compounds included in this paper.
Edited by: D. Topping
References
Abramson, E., Imre, D., Beránek, J., Wilson, J., Zelenyuk, A.: Ex-perimental determination of chemical diffusion within secondaryorganic aerosol particles, Phys. Chem. Chem. Phys., 15, 2983–2991, 2013
Ammann, M. and Pöschl, U.: Kinetic model framework for aerosoland cloud surface chemistry and gas-particle interactions – Part2: Exemplary practical applications and numerical simulations,Atmos. Chem. Phys., 7, 6025–6045, doi:10.5194/acp-7-6025-2007, 2007.
Barley, M. H. and McFiggans, G.: The critical assessment of vapourpressure estimation methods for use in modelling the formationof atmospheric organic aerosol, Atmos. Chem. Phys., 10, 749–767, doi:10.5194/acp-10-749-2010, 2010.
Barsanti, K. C. and Pankow, J. F: Thermodynamics of the for-mation of atmospheric organic particulate matter by accretionreactions—Part 1: aldehydes and ketones, Atmos. Environ., 38,4371–4382, 2004.
Barsanti, K. C. and Pankow, J. F: Thermodynamics of the formationof atmospheric organic particulate matter by accretion reactions– Part 3: Carboxylic and dicarboxylic acids, Atmos. Environ., 40,6676–6686, 2006.
Barsanti, K. C., McMurry, P. H., and Smith, J. N.: The potential con-tribution of organic salts to new particle growth, Atmos. Chem.Phys., 9, 2949–2957, doi:10.5194/acp-9-2949-2009, 2009.
Bergström, R., Denier van der Gon, H. A. C., Prévôt, A. S. H., Yt-tri, K. E., and Simpson, D.: Modelling of organic aerosols overEurope (2002–2007) using a volatility basis set (VBS) frame-work: application of different assumptions regarding the for-mation of secondary organic aerosol, Atmos. Chem. Phys., 12,8499–8527, doi:10.5194/acp-12-8499-2012, 2012.
Berkemeier, T., Huisman, A. J., Ammann, M., Shiraiwa, M.,Koop, T., and Pöschl, U.: Kinetic regimes and limiting cases ofgas uptake and heterogeneous reactions in atmospheric aerosolsand clouds: a general classification scheme, Atmos. Chem. Phys.,13, 6663–6686, doi:10.5194/acp-13-6663-2013, 2013.
Bertram, A. K., Martin, S. T., Hanna, S. J., Smith, M. L.,Bodsworth, A., Chen, Q., Kuwata, M., Liu, A., You, Y., andZorn, S. R.: Predicting the relative humidities of liquid-liquidphase separation, efflorescence, and deliquescence of mixed par-ticles of ammonium sulphate, organic material, and water us-ing the organic-to-sulphate mass ratio of the particle and theoxygen-to-carbon elemental ratio of the organic component,Atmos. Chem. Phys., 11, 10995–11006, doi:10.5194/acp-11-10995-2011, 2011.
Bloss, C., Wagner, V., Bonzanini, A., Jenkin, M. E., Wirtz, K.,Martin-Reviejo, M., and Pilling, M. J.: Evaluation of detailedaromatic mechanisms (MCMv3 and MCMv3.1) against environ-mental chamber data, Atmos. Chem. Phys., 5, 623–639, 2005a,http://www.atmos-chem-phys.net/5/623/2005/.
Bloss, C., Wagner, V., Jenkin, M. E., Volkamer, R., Bloss, W. J.,Lee, J. D., Heard, D. E., Wirtz, K., Martin-Reviejo, M., Rea, G.,Wenger, J. C., and Pilling, M. J.: Development of a detailedchemical mechanism (MCMv3.1) for the atmospheric oxidationof aromatic hydrocarbons, Atmos. Chem. Phys., 5, 641–664,doi:10.5194/acp-5-641-2005, 2005b.
Boy, M., Hellmuth, O., Korhonen, H., Nilsson, E. D., ReVelle, D.,Turnipseed, A., Arnold, F., and Kulmala, M.: MALTE – modelto predict new aerosol formation in the lower troposphere, At-mos. Chem. Phys., 6, 4499–4517, doi:10.5194/acp-6-4499-2006,2006.
Camredon, M., Hamilton, J. F., Alam, M. S., Wyche, K. P., Carr, T.,White, I. R., Monks, P. S., Rickard, A. R., and Bloss, W. J.: Dis-tribution of gaseous and particulate organic composition duringdarkα-pinene ozonolysis, Atmos. Chem. Phys., 10, 2893–2917,doi:10.5194/acp-10-2893-2010, 2010.
Cappa, C. D. and Wilson, K. R.: Evolution of organic aerosol massspectra upon heating: implications for OA phase and partitioningbehavior, Atmos. Chem. Phys., 11, 1895–1911, doi:10.5194/acp-11-1895-2011, 2011.
Casale, M. T, Richman, A. R., Elrod, M. J., Garland, R. M., BeaverM. R., and Tolbert, M. A.: Kinetics of acid-catalyzed aldol con-densation reactions of aliphatic aldehydes Atmos. Environ., 41,6212–6224, 2007.
Chapman, S. and Cowling, T. G.: The Mathematical Theory ofNonuniform Gases, Cambridge University Press, Cambridge,1970.
Compernolle, S., Ceulemans, K., and Müller, J.-F.: Influence ofnon-ideality on condensation to aerosol, Atmos. Chem. Phys.,9, 1325–1337, doi:10.5194/acp-9-1325-2009, 2009.
DePalma, J. W., Horan, A. J., Hall, W. A., and Johnston, M. V.:Thermodynamics of oligomer formation: implications for sec-ondary organic aerosol formation and reactivity, Phys. Chem.Chem. Phys., 15, 6935–6944, 2013.
Donahue, N. M., Epstein, S. A., Pandis, S. N., and Robinson, A. L.:A two-dimensional volatility basis set: 1. organic-aerosol mix-ing thermodynamics, Atmos. Chem. Phys., 11, 3303–3318,doi:10.5194/acp-11-3303-2011, 2011.
Dzepina, K., Volkamer, R. M., Madronich, S., Tulet, P., Ul-brich, I. M., Zhang, Q., Cappa, C. D., Ziemann, P. J., andJimenez, J. L.: Evaluation of recently-proposed secondary or-ganic aerosol models for a case study in Mexico City, At-mos. Chem. Phys., 9, 5681–5709, doi:10.5194/acp-9-5681-2009,2009.
7990 P. Roldin et al.: Modelling non-equilibrium secondary organic aerosol formation
Ervens, B. and Volkamer, R.: Glyoxal processing by aerosol mul-tiphase chemistry: towards a kinetic modelling framework ofsecondary organic aerosol formation in aqueous particles, At-mos. Chem. Phys., 10, 8219–8244, doi:10.5194/acp-10-8219-2010, 2010.
Fuchs, N. A. and Sutugin, A. G.: In Topics in Current Aerosol Re-search, Pergamon Press, 1971.
Gao, S., Keywood, M., Ng, N. L., Surratt, J., Varutbangkul, V.,Bahreini, R., Flagan, R. C., and Seinfeld, J. H.: Low-Molecular-Weight and Oligomeric Components in Secondary OrganicAerosol from the Ozonolysis of Cycloalkenes andα-Pinene, J.Phys. Chem. A, 108, 10147–10164, 2004.
George, C., Strekowski, R. S., Kleffmann, J., Stemmler, K., andAmmann, M.: Photoenhanced uptake of gaseous NO2 on solidorganic compounds: a photochemical source of HONO?, Fara-day Discuss., 130, 195–210, 2005.
Greaves, T. L. and Drummond, C. J.: Protic ionic liquids: Propertiesand applications, Chem. Rev., 108, 206–237, 2008.
Grieshop, A. P., Donahue, N. M., and Robinson, A. L.: Isthe gas-particle partitioning in alpha-pinene secondary or-ganic aerosol reversible?, Geophys. Res. Lett., 34, L14810,doi:10.1029/2007GL029987, 2007.
Griffin, R. J., Cocker III, D. R., Flagan, R. C., and Seinfeld, J. H.:Organic aerosol formation from the oxidation of biogenic hydro-carbons, J. Geophys. Res., 104, 3555–3567, 1999.
Gutzwiller, L., Arens, F., Baltensperger, U., Gäggeler, H. W., andAmmann, M.: Significance of Semivolatile Diesel Exhaust Or-ganics for Secondary HONO Formation, Environ. Sci. Technol.,36, 677–682, 2002.
Hallquist, M., Wenger, J. C., Baltensperger, U., Rudich, Y., Simp-son, D., Claeys, M., Dommen, J., Donahue, N. M., George,C., Goldstein, A. H., Hamilton, J. F., Herrmann, H., Hoff-mann, T., Iinuma, Y., Jang, M., Jenkin, M. E., Jimenez, J. L.,Kiendler-Scharr, A., Maenhaut, W., McFiggans, G., Mentel, Th.F., Monod, A., Prévôt, A. S. H., Seinfeld, J. H., Surratt, J. D.,Szmigielski, R., and Wildt, J.: The formation, properties and im-pact of secondary organic aerosol: current and emerging issues,Atmos. Chem. Phys., 9, 5155–5236, doi:10.5194/acp-9- 5155-2009, 2009.
Hansen, H. K., Rasmussen, P., Fredenslund, A., Schiller, M., andGmehling, J.: Vapour–liquid equilibria by UNIFAC group con-tribution. 5. Revision and extension, Ind. Eng. Chem. Res., 30,2352–2355, 1991.
Hildebrandt, L., Donahue, N. M., and Pandis, S. N.: High forma-tion of secondary organic aerosol from the photo-oxidation oftoluene. Atmos. Chem. Phys. 9, 2973-2986, 2009.
Hirschfelder, J. O., Curtiss, C. F., and Bird, R. B.: Molecular Theoryof Gases and Liquids. John Wiley, New York, 1954.
Hoffmann, T., Odum, J. R., Bowman, F., Collins, D., Klockow, D.,Flagan, R. C., and Seinfeld, J. H.: Formation of organic aerosolsfrom the oxidation of biogenic hydrocarbons, J. Atmos. Chem.,26, 189–222, 1997.
Hu, D., Tolocka, M., Li, Q., and Kamens, R. M.: A kinetic mech-anism for predicting secondary organic aerosol formation fromtoluene oxidation in the presence of NOx and natural sunlight,Atmos. Environ., 41, 6478–6496, 2007.
Huff Hartz, K. E. H., Weitkamp, E. A., Sage, A. M., Donahue,N. M., and Robinson, A. L.: Laboratory measurements of theoxidation kinetics of organic aerosol mixtures using a relative
rate constants approach, J. Geophys. Res.-Atmos., 112, D04204,doi:10.1029/2006jd007526, 2007.
Hyder, M., Genberg, J., and Jönsson, J. Å.: Application of hollowfiber liquid phase microextraction for pinic acid and pinonic acidanalysis from organic aerosols, Analyt. Chim. Ac., 713, 79–85,2012.
Iinuma, Y., Böge, O., Gnauk, T., and Herrmann, H.: Aerosolcham-ber study of theα-pinene/O3 reaction: Influence of particle acid-ity on aerosol yields and products, Atmos. Environ., 38, 761–773, 2004.
Jacobson, M. Z.: Fundamentals of Atmospheric Modelling (2ndedition), Cambridge University Press, Cambridge, United King-dom and New York, NY, USA, ISBN: 0 521 54865 9, 2005a.
Jacobson, M. Z.: A Solution to the Problem of NonequilibriumAcid/Base Gas-Particle Transfer at Long Time Step, Aerosol Sci.Technol., 39, 92–103, 2005b.
Jenkin, M. E., Saunders, S. M., and Pilling, M. J.: The troposphericdegradation of volatile organic compounds: A protocol for mech-anism development, Atmos. Environ., 31, 81–104, 1997.
Jenkin, M. E., Saunders, S. M., Wagner, V., and Pilling, M. J.:Protocol for the development of the Master Chemical Mecha-nism, MCM v3 (Part B): tropospheric degradation of aromaticvolatile organic compounds, Atmos. Chem. Phys., 3, 181–193,doi:10.5194/acp-3-181-2003, 2003.
Jimenez, J. L., Canagaratna, M. R., Donahue, N. M., Prevot, A. S.H., Zhang, Q., Kroll, J. H., DeCarlo, P. F., Allan, J. D., Coe,H., Ng, N. L., Aiken, A. C., Docherty, K. S., Ulbrich, I. M.,Grieshop, A. P., Robinson, A. L., Duplissy, J., Smith, J. D., Wil-son, K. R., Lanz, V. A., Hueglin, C., Sun, Y. L., Tian, J., Laak-sonen, A., Raatikainen, T., Rautiainen, J., Vaattovaara, P., Ehn,M., Kulmala, M., Tomlinson, J. M., Collins, D. R., Cubison, M.J., Dunlea, E. J., Huffman, J. A., Onasch, T. B., Alfarra, M. R.,Williams, P. I., Bower, K., Kondo, Y., Schneider, J., Drewnick,F., Borrmann, S., Weimer, S., Demerjian, K., Salcedo, D., Cot-trell, L., Griffin, R., Takami, A., Miyoshi, T., Hatakeyama, S.,Shimono, A., Sun, J. Y, Zhang, Y. M., Dzepina, K., Kimmel, J.R., Sueper, D., Jayne, J. T., Herndon, S. C., Trimborn, A. M.,Williams, L. R., Wood, E. C., Middlebrook, A. M., Kolb, C.E., Baltensperger, U., and Worsnop, D. R.: Evolution of OrganicAerosols in the Atmosphere, Science, 326, 1525–1529, 2009.
Johnson, D., Jenkin, M. E., Wirtz, K., and Martin-Reviejo, M.: Sim-ulating the formation of secondary organic aerosol from the pho-tooxidation of aromatic hydrocarbons, Environ. Chem., 2, 35–48,2005.
Johnson, D., Utembe, S. R., and Jenkin, M. E.: Simulating the de-tailed chemical composition of secondary organic aerosol formedon a regional scale during the TORCH 2003 campaign in thesouthern UK, Atmos. Chem. Phys., 6, 419–431, 2006,http://www.atmos-chem-phys.net/6/419/2006/.
Jonsson, Å. M., Hallquist, M., and Ljungström, E.: The effectof temperature and water on secondary organic aerosol forma-tion from ozonolysis of limonene,13-carene andα-pinene, At-mos. Chem. Phys., 8, 6541–6549, doi:10.5194/acp-8-6541-2008,2008.
Kalberer, M., Paulsen, D., Sax, M., Steinbacher, M., Dommen, J.,Prévôt, A. S. H., Fisseha, R., Weingartner, E., Frankevich, V.,Zenobi, R., and Baltensperger, U.: Identification of polymersas major components of atmospheric organic aerosols, Science,303, 1659–1662, 2004.
P. Roldin et al.: Modelling non-equilibrium secondary organic aerosol formation 7991
Knopf, D. A., Anthony, L. M., and Bertram, A. K.: Reactive uptakeof O3 by multicomponent and multiphase mixtures containingoleic acid, J. Phys. Chem. A, 109, 5579–5589, 2005.
Koop, T., Bookhold, J., Shiraiwa, M., and Pöschl, U.: Glass tran-sition and phase state of organic compounds: dependency onmolecular properties and implications for secondary organicaerosols in the atmosphere, Phys. Chem. Chem. Phys., 13,19238–19255, 2011.
Korhonen, H., Lehtinen, K. E. J., and Kulmala, M.: Multicompo-nent aerosol dynamics model UHMA: model development andvalidation, Atmos. Chem. Phys., 4, 757–771, doi:10.5194/acp-4-757-2004, 2004.
Kroll, J., and Seinfeld, J. H.: Chemistry of secondary organicaerosol: Formation and evolution of low-volatility organics in theatmosphere, Atmos. Env., 42, 3593–3624, 2008.
Kuwata, M. and Martin, S., T.: Phase of atmospheric secondaryorganic material affects its reactivity, P. Natl. Acad. Sci., 109,17354–17359, doi:10.1073/pnas.1209071109, 2012.
Lai, A. and Nazaroff, W. W.: Modelling indoor particle depositionfrom turbulent flow onto smooth surfaces, J. Aerosol Sci., 31,463–476, 2000.
Li, Q., Hu, D., Leungsakul, S., and Kamens, R. M.: Large outdoorchamber experiments and computer simulations: (I) Secondaryorganic aerosol formation from the oxidation of a mixture of d-limonene andα-pinene, Atmos. Environ., 41, 9341–9352, 2007.
Lide, D. R. (Ed.): CRC Handbook of chemistry and physics, Taylorand Francis Group, Boca Raton, FL, USA, 88th Edition, 2008.
Liggio, J. and Li, S.-M.: Organosulfate formation during the up-take of pinonaldehyde in acidic sulphate aerosols, Geophys. Res.Lett., 33, L13808, doi:10.1029/2006GL026079, 2006.
Loza, C. L., Chhabra, P. S., Yee, L. D., Craven, J. S., Flagan, R. C.,and Seinfeld, J. H.: Chemical aging ofm-xylene secondary or-ganic aerosol: laboratory chamber study, Atmos. Chem. Phys.,12, 151–167, doi:10.5194/acp-12-151-2012, 2012.
Maksymiuk, C. S., Gayahtri, C., Gil, R. R., and Donahue, N. M.:Secondary organic aerosol formation from multiphase oxida-tion of limonene by ozone: mechanistic constraints via two-dimensional heteronuclear NMR spectroscopy, Phys. Chem.Chem. Phys., 2009, 11, 7810–7818, 2009.
Marcolli, C. and Peter, Th.: Water activity in polyol/water systems:new UNIFAC parameterization, Atmos. Chem. Phys., 5, 1545–1555, doi:10.5194/acp-5-1545-2005, 2005.
Matsunaga, A. and Ziemann, P. J.: Gas-Wall Partitioning of OrganicCompounds in a Teflon Film Chamber and Potential Effects onReaction Product and Aerosol Yield Measurements, Aerosol Sci.Technol., 44, 881–892, 2010.
McFiggans, G., Topping, D. O., and Barley, M. H.: The sensitiv-ity of secondary organic aerosol component partitioning to thepredictions of component properties – Part 1: A systematic eval-uation of some available estimation techniques, Atmos. Chem.Phys., 10, 10255–10272, doi:10.5194/acp-10-10255-2010, 2010.
McMurry, P. H. and Rader, D. J.: Aerosol wall losses in electricallycharged chambers. Aerosol Sci. Technol., 4, 249–268, 1985.
Metzger, A., Dommen, J., Gaeggeler, K., Duplissy, J., Prevot, A.S. H., Kleffmann, J., Elshorbany, Y., Wisthaler, A., and Bal-tensperger, U.: Evaluation of 1,3,5 trimethylbenzene degradationin the detailed tropospheric chemistry mechanism, MCMv3.1,using environmental chamber data, Atmos. Chem. Phys., 8,6453–6468, doi:10.5194/acp-8-6453-2008, 2008.
Na, K., Song, C., Switzer, C., and Cocker, D.: Effect of Ammonia onSecondary Organic Aerosol Formation fromα-Pinene Ozonoly-sis in Dry and Humid Conditions. Environ. Sci. Technol., 41,6096–6102, 2007.
Nannoolal, J., Rarey, J., and Ramjugernath, D.: Estimation of purecomponent properties Part 3. Estimation of the vapour pressureof non-electrolyte organic compounds via group contributionsand group interactions Fuild Phase Equilibria, 269, 117–133,2008.
Nash, D. G., Tolocka, M. P., and Baer, T.: The uptake ofO3 by myristic acid-oleic acid mixed particles: evidence forsolid surface layers, Phys. Chem. Chem. Phys., 8, 4468–4475,doi:10.1039/b609855j, 2006.
Ng, N. L., Kroll, J. H., Chan, A. W. H., Chhabra, P. S., Flagan,R. C., and Seinfeld, J. H.: Secondary organic aerosol formationfrom m-xylene, toluene, and benzene, Atmos. Chem. Phys., 7,3909–3922, doi:10.5194/acp-7-3909-2007, 2007.
Ng, N. L., Kwan, A. J., Surratt, J. D., Chan, A. W. H., Chhabra, P.S., Sorooshian, A., Pye, H. O. T., Crounse, J. D., Wennberg, P.O., Flagan, R. C., and Seinfeld, J. H.: Secondary organic aerosol(SOA) formation from reaction of isoprene with nitrate radicals(NO3), Atmos. Chem. Phys., 8, 4117–4140, doi:10.5194/acp-8-4117-2008, 2008.
Nordin, E. Z., Eriksson, A. C., Roldin, P., Nilsson, P. T., Carls-son, J. E., Kajos, M. K., Hellén, H., Wittbom, C., Rissler, J.,Löndahl, J., Swietlicki, E., Svenningsson, B., Bohgard, M., Kul-mala, M., Hallquist, M., and Pagels, J. H.: Secondary organicaerosol formation from idling gasoline passenger vehicle emis-sions investigated in a smog chamber, Atmos. Chem. Phys., 13,6101-6116, doi:10.5194/acp-13-6101-2013, 2013.
Odum, J. R., Hoffmann, T., Bowman, F., Collins, D., Flagan, R.C., and Seinfeld, J. H.: Gas/particle partitioning and secondaryorganic aerosol yields, Environ. Sci. Technol., 30, 2580–2585,1996.
Pankow, J. F.: An absorption-model of the gas aerosol partitioninginvolved in the formation of secondary organic aerosol, Atmos.Environ., 28, 189–193, 1994.
Pankow, J. F. and Asher, W. E.: SIMPOL.1: a simple groupcontribution method for predicting vapour pressures and en-thalpies of vaporization of multifunctional organic compounds,Atmos. Chem. Phys., 8, 2773–2796, doi:10.5194/acp-8-2773-2008, 2008.
Pathak, R. K., Presto, A. A., Lane, T. E., Stanier, C. O., Don-ahue, N. M., and Pandis, S. N.: Ozonolysis ofα-pinene: pa-rameterization of secondary organic aerosol mass fraction, At-mos. Chem. Phys., 7, 3811–3821, doi:10.5194/acp-7-3811-2007,2007.
Paulsen, D., Dommen, J., Kalberer, M., Prevot, A. S. H., Richter,R., Sax, M., Steinbacher, M., Weingartner, E., and Baltensperger,U.: Secondary organic aerosol formation by irradiation of 1,3,5-trimethylbenzene-NOx-H2O in a new reaction chamber for at-mospheric chemistry and physics, Environ. Sci. Technol., 39,2668–2678, 2005.
Pfrang, C., Shiraiwa, M., and Pöschl, U.: Chemical ageing andtransformation of diffusivity in semi-solid multi-component or-ganic aerosol particles, Atmos. Chem. Phys., 11, 7343–7354,doi:10.5194/acp-11-7343-2011, 2011.
Pierce, J. R., Engelhart, G. J., Hildebrandt, L., Weitkamp, E. A.,Pathak, R. K., Donahue, N. M., Robinson, A. L., Adams, P. J.,
7992 P. Roldin et al.: Modelling non-equilibrium secondary organic aerosol formation
and Pandis, S. N.: Constraining Particle Evolution from WallLosses, Coagulation, and Condensation-Evaporation in Smog-Chamber Experiments: Optimal Estimation Based on Size Dis-tribution Measurements, Aerosol Sci. Technol., 42, 1001–1015,2008.
Pun, B. K. and Seigneur, C.: Investigative modelling of new path-ways for secondary organic aerosol formation, Atmos. Chem.Phys., 7, 2199–2216, doi:10.5194/acp-7-2199-2007, 2007.
Pöschl, U., Rudich, Y., and Ammann, M.: Kinetic model frame-work for aerosol and cloud surface chemistry and gas-particleinteractions – Part 1: General equations, parameters, and termi-nology, Atmos. Chem. Phys., 7, 5989–6023, doi:10.5194/acp-7-5989-2007, 2007.
Pöschl, U.: Gas–particle interactions of tropospheric aerosols: Ki-netic and thermodynamic perspectives of multiphase chemicalreactions, amorphous organic substances, and the activation ofcloud condensation nuclei, Atmos. Res., 101, 562–573, 2011.
Rader, D. J., McMurry, P. H., and Smith, S.: Evaporation Rates ofMonodisperse Organic Aerosols in the 0.02- to 0.2-µm-DiameterRange, Aerosol Sci. Technol., 6, 247–260, 1987.
Ray, A. K., Davis, E. J., and Ravindran, P.: Determination of ul-tralow vapour-pressures by sub-micron droplet evaporation, J.Chem. Phys., 71, 582–587, 1979.
Ray, A. K, Lee, J., and Tilley, H. L.: Direct Measurements of Evap-oration Rates of Single Droplets at Large Knudsen Numbers,Langmuir, 4, 631–637, 1988.
Rickard, A. R., Wyche, K. P., Metzger, A., Monks, P. S., Ellis, A.M., Dommenc, J., Baltensperger, U., Jenkin, M. E., and Pilling,M. J.: Gas phase precursors to anthropogenic secondary organicaerosol: Using the Master Chemical Mechanism to probe de-tailed observations of 1,3,5-trimethylbenzene photo-oxidation,Atmos. Env., 44, 5423–5433, 2010.
Riipinen, I., Pierce, J. R., Donahue, N. M., and Pandis, S. N.: Equi-libration time scales of organic aerosol inside thermodenuders:Evaporation kinetics versus thermodynamics, Atmos. Environ.,44, 597–607, 2010.
Rohrer, F., Bohn, B., Brauers, T., Brüning, D., Johnen, F.-J., Wah-ner, A., and Kleffmann, J.: Characterisation of the photolyticHONO-source in the atmosphere simulation chamber SAPHIR,Atmos. Chem. Phys., 5, 2189–2201, doi:10.5194/acp-5-2189-2005, 2005.
Roldin, P., Swietlicki, E., Schurgers, G., Arneth, A., Lehtinen, K.E. J., Boy, M., and Kulmala, M.: Development and evaluation ofthe aerosol dynamics and gas phase chemistry model ADCHEM,Atmos. Chem. Phys., 11, 5867–5896, doi:10.5194/acp-11-5867-2011, 2011a.
Roldin, P., Swietlicki, E., Massling, A., Kristensson, A., Löndahl,J., Eriksson, A., Pagels, J., and Gustafsson, S.: Aerosol ageing inan urban plume – implication for climate, Atmos. Chem. Phys.,11, 5897–5915, doi:10.5194/acp-11-5897-2011, 2011b.
Rudich, Y., Donahue, N. M., and Mentel, T. F.: Aging of organicaerosol: Bridging the gap between laboratory and field studies,Annu. Rev. Phys. Chem., 58, 321–352, 2007.
Saukko, E., Lambe, A. T., Massoli, P., Koop, T., Wright, J. P., Croas-dale, D. R., Pedernera, D. A., Onasch, T. B., Laaksonen, A.,Davidovits, P., Worsnop, D. R., and Virtanen, A.: Humidity-dependent phase state of SOA particles from biogenic and an-thropogenic precursors, Atmos. Chem. Phys., 12, 7517–7529,doi:10.5194/acp-12-7517-2012, 2012.
Saunders, S. M., Jenkin, M. E., Derwent, R. G., and Pilling, M. J.:Protocol for the development of the Master Chemical Mech-anism, MCM v3 (Part A): tropospheric degradation of non-aromatic volatile organic compounds, Atmos. Chem. Phys., 3,161–180, doi:10.5194/acp-3-161-2003, 2003.
Seinfeld, J. H. and Pandis, S. N.: Atmospheric Chemistry andPhysics: From Air Pollution to Climate Change, (2nd edition),Wiley, New Jersey, ISBN: 0-471-72018-6, 2006.
Shiraiwa, M., Pfrang, C., and Pöschl, U.: Kinetic multi-layer modelof aerosol surface and bulk chemistry (KM-SUB): the influ-ence of interfacial transport and bulk diffusion on the oxidationof oleic acid by ozone, Atmos. Chem. Phys., 10, 3673–3691,doi:10.5194/acp-10-3673-2010, 2010.
Shiraiwa, M., Ammann, M., Koop, T., Pöschl, U.: Gas uptake andchemical aging of semisolid organic aerosol particles, P. NatlAcad. Sci., 108, 11003–11008, doi:10.1073/pnas.1103045108,2011.
Shiraiwa, M. and Seinfeld, J. H.: Equilibration timescale of atmo-spheric secondary organic aerosol partitioning, Geophys. Res.Lett., 39, L24801, 2012.
Shiraiwa, M., Pfrang, C., Koop, T., and Pöschl, U.: Kinetic multi-layer model of gas-particle interactions in aerosols and clouds(KM-GAP): linking condensation, evaporation and chemical re-actions of organics, oxidants and water, Atmos. Chem. Phys., 12,2777–2794, 2012,http://www.atmos-chem-phys.net/12/2777/2012/.
Shiraiwa, M., Yee, L. D., Schilling, K. A., Loza, C. L., Craven, J.S., Zuend, A., Ziemann, P. J., and Seinfeld, J. H.: Size distribu-tion dynamics reveal particle-phase chemistry in organic aerosolformation, P. Natl. Acad. Sci., 110, 11746–11750, 2013a.
Shiraiwa, M., Zuend, A., Bertram, A. K., and Seinfeld, J. H.: Gas-particle partitioning of atmospheric aerosols: interplay of physi-cal state, non-ideal mixing and morphology, Phys. Chem. Chem.Phys., 15, 11441–11453, 2013b.
Smith, J. N., Dunn, M. J., VanReken, T. M., Iida, K., Stolzen-burg, M. R., McMurry, P. H., and Huey, L. G.: Chemical com-position of atmospheric nanoparticles formed from nucleationin Tecamac, Mexico: Evidence for an important role for organicspecies in nanoparticle growth, Geophys. Res. Lett., 35, L04808,doi:10.1029/2007gl032523, 2008.
Smith, J. N., Barsanti, K. C, Friedli, H. R., Ehn, M., Kulmala, M.,Collins, D. R., Scheckman, J. H., Williams, B. J., and McMurry,P. H.: Observations of aminium salts in atmospheric nanoparti-cles and possible climatic implications, P. Natl Acad. Sci. 107,6634–6639, 2010.
Smith, M. L., Kuwata, M., and Martin, S. T.: Secondary Or-ganic Material Produced by the Dark Ozonolysis ofα-PineneMinimally Affects the Deliquescence and Efflorescence ofAmmonium Sulphate, Aerosol Sci. Technol., 45, 244–261,doi:10.1080/02786826.2010.532178, 2011.
Stroeve, P.: On the Diffusion of Gases in Protein Solutions, Ind.Eng. Chem. Fund., 14, 140–141, 1975.
Surratt, J. D, Murphy, S. M, Kroll, J. H, Ng, N. L., Hildebrandt, L.,Sorooshian, A., Szmigielski, R., Vermeylen, R., Maenhaut, W.,Claeys, M., Flagan, F. C., and Seinfeld, J. H.: Chemical compo-sition of secondary organic aerosol formed from the photooxida-tion of isoprene, J. Phys. Chem. A, 110, 9665–9690, 2006
Surratt, J. D., Kroll, J. H., Kleindienst, T. E., Edney, E. O., Claeys,M., Sorooshian, A., Ng, N. L., Offenberg, J. H., Lewandowski,
P. Roldin et al.: Modelling non-equilibrium secondary organic aerosol formation 7993
M., Jaoui, M., Flagan, R. C., and Seinfeld, J. H.: Evidence fororganosulfates in secondary organic aerosol, Environ. Sci. Tech-nol., 41, 517–527, 2007.
Svenningsson, B., Rissler, J., Swietlicki, E., Mircea, M., Bilde, M.,Facchini, M. C., Decesari, S., Fuzzi, S., Zhou, J., Mønster, J., andRosenørn, T.: Hygroscopic growth and critical supersaturationsfor mixed aerosol particles of inorganic and organic compoundsof atmospheric relevance, Atmos. Chem. Phys., 6, 1937–1952,doi:10.5194/acp-6-1937-2006, 2006.
Tobias, H. J. and Ziemann, P. J.: Thermal desorption mass spec-trometric analysis of organic aerosol formed from reactions of1-tetradecene and O-3 in the presence of alcohols and carboxylicacids, Environ. Sci. Technol., 34, 2105–2115, 2000.
Tolocka, M. P., Jang, M., Ginter, J. M., Cox, F. J., Kamens R. M.,and Johnston, M. V.: Formation of Oligomers in Secondary Or-ganic Aerosol, Environ. Sci. Technol., 38, 1428–1434, 2004.
Topping, D., Barley, M., and McFiggans, G.: Including phase sep-aration in a unified model to calculate partitioning of vapoursto mixed inorganic–organic aerosol particles, Faraday Discuss.,165, 273–288, 2013.
Vaden, T. D., Song, C., Zaveri, R. A., Imre, D., and Zelenyuk, A.:Morphology of mixed primary and secondary organic particlesand the adsorption of spectator organic gases during aerosol for-mation, P. Natl. Acad. Sci., 107, 6658–6663, 2010.
Vaden, T. D., Imreb, D., Beráneka, J., Shrivastavaa, M., and Ze-lenyuka, A.: Evaporation kinetics and phase of laboratory andambient secondary organic aerosol, P. Natl. Acad. Sci., 108,2190–2195, 2011.
Valorso, R., Aumont, B., Camredon, M., Raventos-Duran, T.,Mouchel-Vallon, C., Ng, N. L., Seinfeld, J. H., Lee-Taylor, J.,and Madronich, S.: Explicit modelling of SOA formation fromα-pinene photooxidation: sensitivity to vapour pressure estima-tion, Atmos. Chem. Phys., 11, 6895–6910, doi:10.5194/acp-11-6895-2011, 2011.
Vesterinen, M., Lehtinen, K. E. J., Kulmala, M., and Laaksonen, A.:Effect of particle phase oligomer formation on aerosol growth,Atmos. Environ., 41, 1768–1776, 2007.
Virtanen, A., Joutsensaari, J., Koop, T., Yli-Pirilä, P., Leskinen,J., Mäkelä, J. M., Holopainen, J. K., Pöschl, U., Kulmala, M.,Worsnop, D. R. and Laaksonen, A.: An amorphous solid state ofbiogenic secondary organic aerosol particles, Nature, 467, 824–827, 2010.
Widmann, J., Heusmann, C. M., and Davis, E. J.: The effect of apolymeric additive on the evaporation of organic aerocolloidaldroplets, Colloid and Polymer Science, 276, 197–205, 1998.
Wiedensohler, A., Birmili, W., Nowak, A., Sonntag, A., Wein-hold, K., Merkel, M., Wehner, B., Tuch, T., Pfeifer, S.,Fiebig, M., Fjäraa, A. M., Asmi, E., Sellegri, K., Depuy, R.,Venzac, H., Villani, P., Laj, P., Aalto, P., Ogren, J. A., Swi-etlicki, E., Williams, P., Roldin, P., Quincey, P., Hüglin, C., Fierz-Schmidhauser, R., Gysel, M., Weingartner, E., Riccobono, F.,Santos, S., Grüning, C., Faloon, K., Beddows, D., Harrison, R.,Monahan, C., Jennings, S. G., O’Dowd, C. D., Marinoni, A.,Horn, H.-G., Keck, L., Jiang, J., Scheckman, J., McMurry, P. H.,Deng, Z., Zhao, C. S., Moerman, M., Henzing, B., de Leeuw, G.,Löschau, G., and Bastian, S.: Mobility particle size spectrom-eters: harmonization of technical standards and data structure tofacilitate high quality long-term observations of atmospheric par-
ticle number size distributions, Atmos. Meas. Tech., 5, 657–685,doi:10.5194/amt-5-657-2012, 2012.
Yli-Juuti, T., Barsanti, K., Hildebrandt Ruiz, L., Kieloaho, A.-J., Makkonen, U., Petäjä, T., Ruuskanen, T., Kulmala, M., andRiipinen, I.: Model for acid-base chemistry in nanoparticlegrowth (MABNAG), Atmos. Chem. Phys., 13, 12507–12524,doi:10.5194/acp-13-12507-2013, 2013.
Zelenyuk, A., Yang, J., Song, C., Zaveri, R. A., and Imre, D.: ANew Real-Time Method for Determining Particles’ Sphericityand Density: Application to Secondary Organic Aerosol Formedby Ozonolysis ofα-Pinene, Environ. Sci. Technol., 42, 8033–8038, 2008.
Zelenyuk, A., Imre, D., Beránek, J., Abramson, E., Wilson, J., andShrivastava, M.: Synergy between Secondary Organic Aerosolsand Long-Range Transport of Polycyclic Aromatic Hydrocar-bons, Environ. Sci. Technol., 46, 12459–12466, 2012.
Zhang, S-H., Seifeld, J. H., and Flagan, R. C.: Determination ofParticle Vapour Pressures Using the Tandem Differential Mobil-ity Analyzer, Aerosol Sci. Technol., 19, 3–14, 1993.
Zhou, S., Shiraiwa, M., McWhinney, R., Pöschl, U., and Abbatt, J.P. D.: Kinetic limitations in gas-particle reactions arising fromslow diffusion in secondary organic aerosol, Faraday Discuss.,165, 391–406, 2013.
Zobrist, B., Soonsin, V., Luo, B. P., Krieger, U. K., Marcolli, C.,Peter, T., and Koop, T.: Ultra-slow water diffusion in aque-ous sucrose glasses, Phys. Chem. Chem. Phys., 13, 3514–3526,doi:10.1039/c0cp01273d, 2011.
Zuend, A., Marcolli, C., Luo, B. P., and Peter, T.: A thermodynamicmodel of mixed organic-inorganic aerosols to predict activity co-efficients, Atmos. Chem. Phys., 8, 4559–4593, doi:10.5194/acp-8-4559-2008, 2008.
Zuend, A., Marcolli, C., Peter, T., and Seinfeld, J. H.: Computa-tion of liquid-liquid equilibria and phase stabilities: implicationsfor RH-dependent gas/particle partitioning of organic-inorganicaerosols, Atmos. Chem. Phys., 10, 7795–7820, doi:10.5194/acp-10-7795-2010, 2010.
Zuend, A., Marcolli C., Booth , A. M., Lienhard, D. M., Soonsin, V.,Krieger, U. K., Topping, D. O., McFiggans G., Peter, T., and Se-infeld, J. H.: New and extended parameterization of the thermo-dynamic model AIOMFAC: calculation of activity coefficientsfor organic-inorganic mixtures containing carboxyl, hydroxyl,carbonyl, ether, ester, alkenyl, alkyl, and aromatic functionalgroups, Atmos. Chem. Phys., 11, 9155–9206, doi:10.5194/acp-11-9155-2011, 2011.
Zuend, A. and Seinfeld, J. H.: Modelling the gas-particle parti-tioning of secondary organic aerosol: the importance of liquid-liquid phase separation, Atmos. Chem. Phys., 12, 3857–3882,doi:10.5194/acp-12-3857-2012, 2012.