MODELLING SCHOLARLY COMMUNICATION OPTIONS: COSTS AND BENEFITS FOR UNIVERSITIES Report to the JISC February 2010 Prepared by: Alma Swan Key Perspectives Ltd 48 Old Coach Road Playing Place Truro TR3 6ET UK +44 1392 879702 Skype: almaswan [email protected]www.keyperspectives.co.uk
Transcript
MODELLING SCHOLARLY COMMUNICATION OPTIONS: COSTS AND BENEFITS FOR UNIVERSITIES
Report to the JISC
February 2010 Prepared by: Alma Swan Key Perspectives Ltd 48 Old Coach Road Playing Place Truro TR3 6ET UK +44 1392 879702 Skype: almaswan [email protected] www.keyperspectives.co.uk
1. Introduction 2 1.1 The context 2 1.2 Foundation work 2 1.3 The scope of this study 3
SECTION TWO: METHODOLOGICAL ASPECTS OF THE STUDY
2. Methodology 7 2.1 The scholarly communication process 7 2.2 The case studies 7 2.3 Data elements of the online model 8
2.4 Data collection: general points 10 2.5 Data collection research-related data 11 2.6 Data collection: library-related data 13 2.7 Data collection: repository-related data 16 3. Using the online model 18 3.1 Introduction 18 3.2 Library handling costs and savings model 18 3.3 Research activity costs model 20
3.4 Open Access publishing impacts model 20 3.5 Open Access self-archiving impacts model 22 3.6 Publisher costs 23
4. Scholarly communication system costs 26 4.1. Reading and writing articles 26 4.2 Publishing-related activities 26 4.3 Publisher-related activities 26 4.4 Scholarly communication-related costs for universities 27
SECTION FOUR: ECONOMIC BENEFITS FROM OPEN ACCESS
5. Economic benefits from Open Access: Publisher, system and societal savings 30 5.1 Publishers’ per article savings from shifts to open Access 30 5.2 Research system savings per article from shifts to Open Access 31 5.3 Whole-UK costs and savings 31 5.4 The economic return to the world’s R&D effort from Open Access 32
6. Economic benefits from Open Access: Communications system costs and savings for individual universities 35
6.1 Subscription savings from Open Access 35 6.2 Library handling savings from Open Access 35
6.3 Library handling savings from a shift to electronic-only journals 36 6.4 Publishing system savings from Open Access relative to individual universities 37 6.5 Research system savings for universities from Open Access 38 6.6 Savings for research for universities from Open Access 39
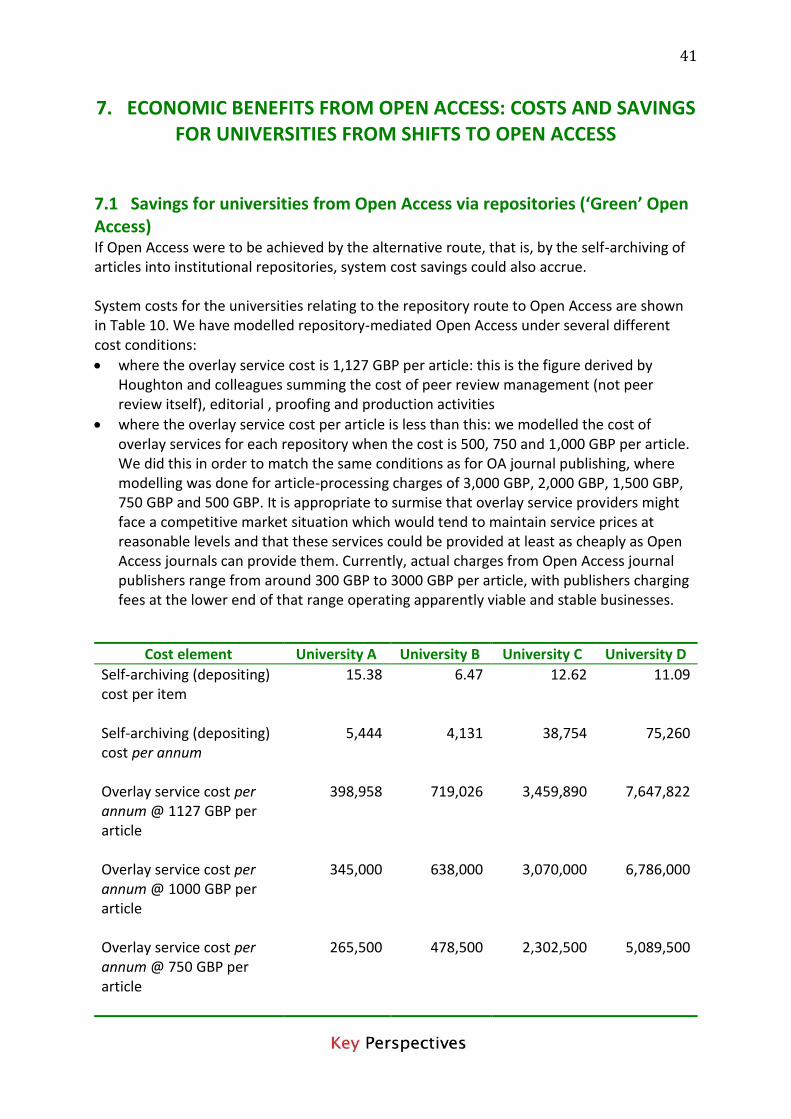
7. Economic benefits from Open Access: costs and savings for universities from shifts to Open Access 41
7.1 Savings for universities from moving to Open Access via repositories (‘Green’ Open Access) 41 7.1.1 Open Access repositories with parallel subscription publishing 42 7.1.2 Open Access repositories with overlay publishing services 44
7.2 Savings for universities from moving to publishing in Open Access journals (‘Gold’ Open Access) 46
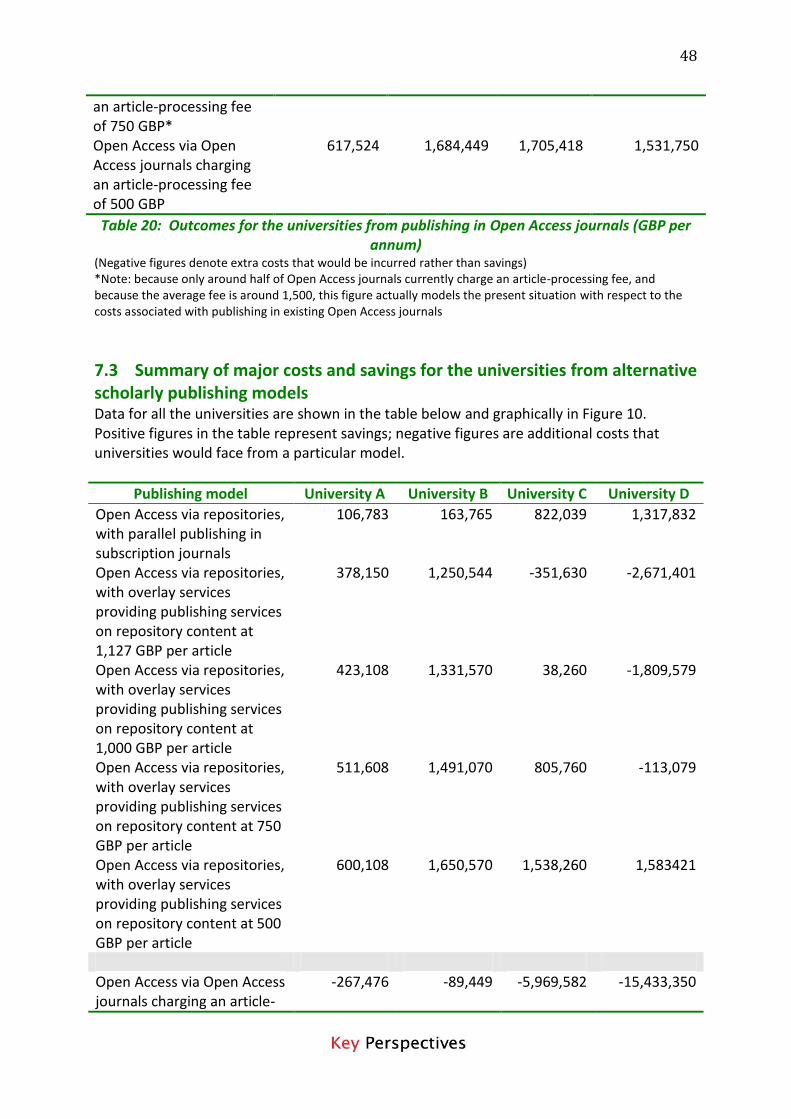
7.3 Summary of major costs and savings for universities from alternative scholarly publishing models 48
7.4 Summary of all costs and benefits to universities from alternative scholarly publishing models 49
8. Visibility and impact benefits from Open Access 51 8.1 Visibility and usage benefits from Open Access 51 8.2 Impact benefits from Open Access 52 9. Discussion: the benefits to universities of moving to Open Access 55 9.1 Electronic journals 56 9.2 Open Access via repositories 56
Tables Table 1: Library Handling Costs and Savings Model parameters and variables 19 Table 2: Research Activity Costs Model parameters and variables 20 Table 3: Open Access Publishing Impacts Model parameters and variables 22 Table 4: Open Access Self-Archiving Impacts Model parameters and variables 23 Table 5: Estimated average publisher costs per article by model and format (GBP) 24 Table 6: Estimated annual universities’ scholarly communication activity costs (GBP) 26 Table 7: Estimated annual universities’ scholarly communication-related costs (GBP) 27 Table 8: Publisher-related per article costs and savings, relating to the case study
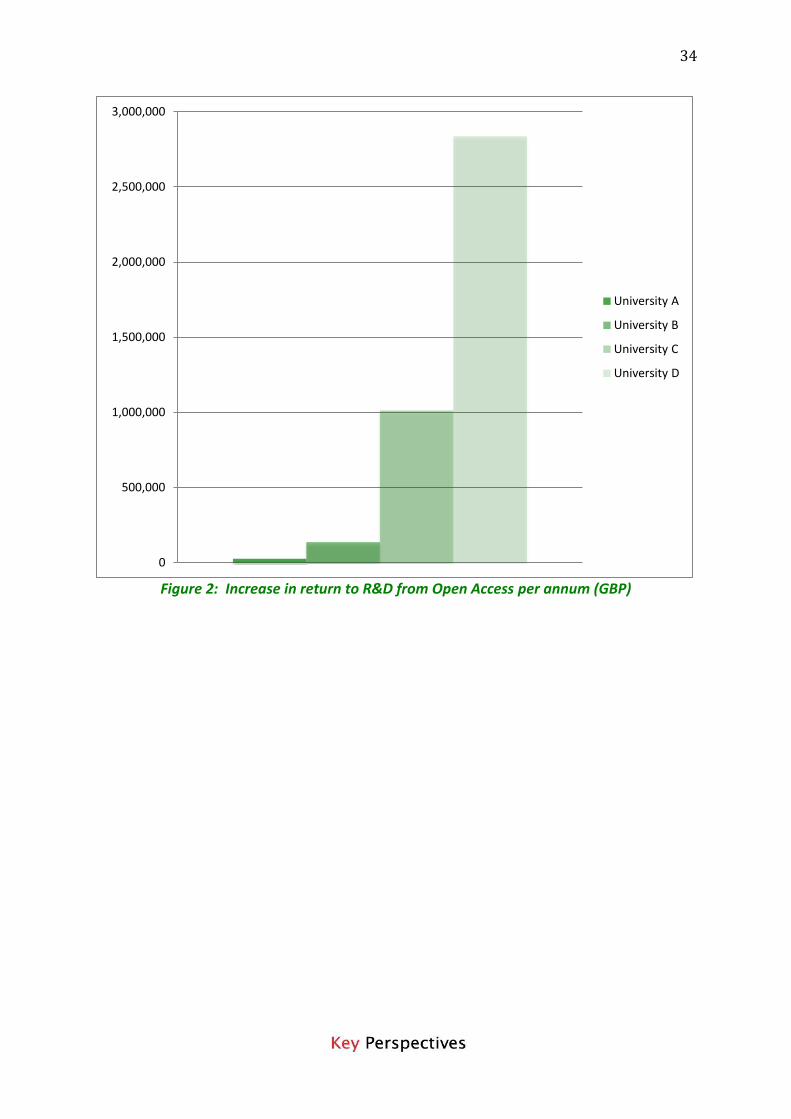
universities, from shifts in publishing model (GBP) 30 Table 9: Average publishing system costs per article (GBP) 31 Table 10: Increase in return to R&D from Open Access per annum (GBP) 33 Table 11: Subscription savings from Open Access per annum (GBP) 35 Table 12: Library handling savings from Open Access per annum (GBP) 35 Table 13: Library handling savings from all-electronic journals per annum (GBP) 36 Table 14: Savings per annum for publishers from Open Access relative to each
university (GBP) 37 Table 15: Research system savings from Open Access per annum (GBP) 38 Table 16: Savings for research from Open Access per annum (GBP) 39 Table 17: System costs for the universities for Open Access via repositories (GBP) 41 Table 18: Savings for universities from Open Access via repositories with a parallel
subscription-based journals system (GBP per annum) 43 Table 19: Savings per annum from Open Access via repositories with overlay
publishing services (GBP) 46 Table 20: Outcomes for universities from publishing in Open Access journals
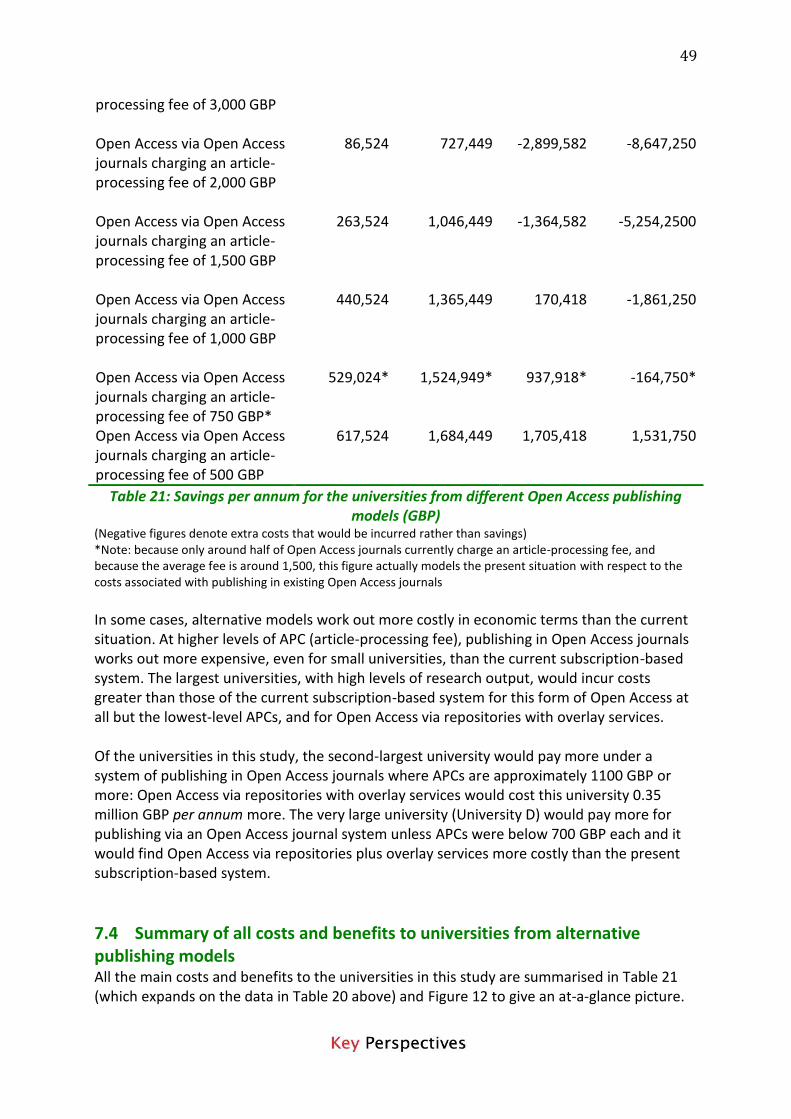
(GBP per annum) 47 Table 21: Savings per annum for the universities from different Open Access
publishing models (GBP) 49 Table 22: Summary of all major benefits to the universities from a
shift to Open Access 50 Table 23: Increase in research funding needed in a subscription-access world
to deliver the citation impact that Open Access delivers 53
Figures Figure 1: The scholarly communication process model 9 Figure 2: Increase in return to R&D from Open Access per annum (GBP) 33 Figure 3: Subscription savings from Open Access per annum (GBP) 35 Figure 4: Library handling savings from Open Access per annum (GBP) 36 Figure 5: Library handling savings from all-electronic journals per annum (GBP) 37 Figure 6: Savings for publishers from Open Access relative to each university
per annum (GBP) 38 Figure 7: Research system savings from Open Access per annum (GBP) 39 Figure 8: Savings for research from Open Access per annum (GBP) 40 Figure 9: Savings per annum (GBP) from Open Access via repositories with a parallel
subscription-based publishing system 44
Figure 10: Savings per annum for the universities from different publishing models (GBP) 49
Figure 11: Additional research funding needed per annum to realise the increased citation impact that Open Access can bring (modelled for increased impact of 25% and 50%) 54
Boxes Box 1: University profiles 8 Box 2: Data elements required for the online model 10 Box 3: Open Access impacts calculated using the Library Handling Costs sub-model 19 Box 4: Open Access impacts calculated using the Research Activity Costs sub-model 20 Box 5: Open Access impacts calculated using the Open Access Publishing Impacts
sub-model 21 Box 6: Open Access impacts calculated using the Self-Archiving Impacts sub-model 23 Box 7: How to calculate the annual savings from Open Access via repositories with
parallel subscription publishing 43 Box 8: How to calculate the annual savings from Open Access via repositories with
overlaid publishing services 45 Box 9: How to calculate the annual savings from publishing in Open Access journals 47
i
EXECUTIVE SUMMARY
The context for the study The scholarly communication landscape is changing, with profound implications for universities. Data and methodologies are now available that can provide university managers with information about these changing practices. These data will inform strategic decision-making in higher education institutions. Open Access may be achieved in more than one way and this study models the costs and benefits of Open Access by different routes and of other scholarly communication scenarios. In particular, the shift from print journals and books to electronic versions has been a major transformative factor in scholarly communication over the past couple of decades. Alongside modelling a shift to Open Access, this study models the economic effects of moving through the final stages to a world where journals in hard copy format are phased out completely. The move to Open Access for research outputs can at once both simplify access and complicate things by disrupting systems and processes that have been in place for a very long time. Such transformation appears worthwhile, even on purely economic terms and additional, academic returns help in outweighing the price of change. The JISC commissioned this study to model the costs and benefits of changing scholarly communication practices within UK HEIs (Higher Education Institutions). In particular, the study has been designed to achieve two key goals:
To provide information to institutional managers about the costs and benefits of changing scholarly communication practices, with a special focus on Open Access to research papers
To develop a methodology using case studies based on different types of higher education institution in the UK and employing real data and contextual information provided by these institutions. The intent was to produce a methodology that can be used by research-based institutions to model the economic effects of different scenarios in their own case.
The work does two things in terms of modelling: it identifies the costs and benefits of different scholarly communication scenarios; and it quantifies them, that is, it attaches actual values to cost elements in the processes involved and measures what economic outcomes emerge from modelling various scenarios.
The scope of the work The methodology was based upon the use of the economic model that Houghton and his colleagues (2009a) made available online for the use of those who wished to model the effects of Open Access at national or institutional level1. Four UK universities were used as case studies, varying in size from a relatively small ‘post-1992’ university to one of the UK’s elite establishments.
In summary, then, the study covered the following: We determined, for each university:
the costs to the library of the current system of toll (subscription) access to journal articles for each institution
the costs of the activities involved in the research communication process in each university
And we modelled, for each university the costs and benefits of:
a shift to electronic-only journals
a shift to full Open Access where authors deposit (‘self-archive’) their articles in their university Open Access repository and these articles are also published in parallel in traditional toll-access journals as is currently-developing practice. This model assumes that subscription cancellations would not take place under these conditions (which is the current, actual situation) and therefore in this scenario there are no savings to be had from publisher-related processes, library handling processes or reductions in subscriptions
a shift to Open Access via repositories which have overlay publishing services: that is, where authors deposit (‘self-archive’) their articles in their university repository, thereby providing the raw material for ‘overlay’ services that then carry out publishing functions such as peer review management, editing and, if required, branding
a shift to full Open Access where all articles are published in Open Access journals, and making the assumption that all these journals charge an article-processing fee for each article published
a shift to full Open Access for journal articles via the same route but basing the calculations on the actual, current situation, which is that only around half of Open Access journals charge an article-processing fee
Methodology The scholarly communication life cycle developed by Björk in 2007, using the formal process-modelling method IDEF0, is the basis for the economic studies by Houghton and colleagues, and also the basis for this present work. The model encompasses five scholarly communication process activities:
Fund research and its communication
Perform research and communicate the results
Publish research outputs
Facilitate dissemination, retrieval and preservation
Study publications and apply the knowledge derived Each of these consists of numerous sub-processes which Houghton and Björk identify in detail. The costs of these sub-processes underlie the modelling described in this report. The economic modelling tool developed by Houghton and colleagues (2009a) requires that values be entered for a number of data elements so that calculations of the costs and benefits of alternative scholarly communication systems can be determined. In addition, we
iii
incorporated some additional data that pertain in an institutional context. In all, the data elements used in our modelling process are shown in the box below.
Primary data were collected directly from the individual universities, from their RAE 2008 (UK Research Assessment Exercise 2008) submissions and from commercial bibliographic services. In a few cases, data were sourced from Houghton’s work, for which they had in turn been procured from the research literature.
Library-related data
Average annual salary of library staff in the institution
Subscriptions (number of serials titles)
Serials acquisition costs per annum
Share of journal subscriptions that are print-only
Share of journal subscriptions that are electronic-only
Share of subscriptions that are dual-mode (print plus electronic)
Handling time per year per journal (toll-access, print)
Handling time per year per journal (toll-access, electronic-only)
Handling time per year per journal (open access - electronic-only by definition)
Inter-library loan and article purchase costs
Research-related data
R&D spending (funding) per annum
Average annual salary of researchers in the institution
Number of publication-active researchers in the institution
Annual journal article output from the institution
Reading and writing articles:
Time spent reading journal articles (hours per annum)
Time spent writing journal articles (hours per annum)
Peer review activities:
Time to peer review articles (hours per review)
Average number of reviews per article
Average article rejection rate
Average resubmission rate
Editorial activities:
Percentage of researchers who are editors of journals
Percentage of researchers who are on journal editorial boards
Repository-related data
Annual operating cost of the repository
Time taken to deposit a journal article
Average annual salary of depositor
iv
Scholarly communication system costs By entering the data collected into Houghton’s model it is possible to determine the costs of each sub-activity in the scholarly communication process. The main findings from modelling this system for the four universities are:
The total scholarly communication system costs ranged from 4.9 million GBP per annum for the smallest university in the study to 104 million GBP per annum for the largest.
The annual cost of researchers reading journal articles varies from around 1 million GBP for the smallest university in the study to over 21 million GBP for the largest. The cost of writing journal articles per year ranges from around 2.2 million GBP to 50 million GBP for individual universities.
Researchers’ peer reviewing activities cost from around 0.5 million GBP to 13 million GBP per annum, and the costs of carrying out editorial and editorial board duties for journals range from 0.13 million GBP to over 3.5 million GBP per annum, for the universities in our study.
Journal handling costs in the universities’ libraries ranged from 0.21 million GBP to 0.46 million GBP per annum. The libraries would save from 0.03 million GBP to 0.17 million GBP per annum from a move from their current mix of journal formats to an all-electronic system. They would save from 0.13 million GBP to 0.28 million GBP per annum in handling costs from a move to Open Access.
Annual operating costs for the institutional repository, including the cost of depositing items, range from around 26,000 GBP to almost 210,000 GBP. The cost of depositing a single article varies from around 6.5 GBP to 15.4 GBP, with the annual cost of depositing into the repository all articles produced by each university ranging from just over 4,000 GBP to over 75,000 GBP.
Benefits of Open Access There are potential economic savings for universities from Open Access and this study has modelled these benefits in an Open Access world, that is, if all research were to be available on a freely-accessible basis. Economic savings accrue to universities according to the detail of how each operates its library services and its repository, and the level of research intensiveness of the institution.
The headline findings
Moving to Open Access as the basis for disseminating research outputs can bring economic and academic benefits for all universities, though the most research-intensive universities may face additional costs under some conditions.
Repository-based Open Access
If universities continue to pay for subscription-based journals while simultaneously making their outputs freely available through their repositories, as they currently do,
v
they are likely to make savings. The amount saved by the universities studied ranges from 0.1 million GBP to 1.32 million GBP per annum. Savings accrue from increased efficiencies in the research and library handling processes.
If universities switch to a system of using their repositories as the locus for collecting articles that are ready for publication, and use paid-for peer review and editorial services (overlay publishing services) to validate and control the quality of those articles, savings can be made by most universities. The two larger universities in our study may face costs above those of the current subscription-based system, the size of which would be dependent upon the charges made by the publishing services.
If the publishing service charge is around 1,127 GBP per article (the charge estimated by Houghton and colleagues to be adequate to cover publishing service costs and allow for a profit margin based on known publishing costs), there would be savings for the two smaller universities studied of around 0.38 million GBP and 1.25 million GBP per annum. The two larger universities would face extra economic costs of 0.35 million and 2.67 million GBP per annum.
When overlay service charges are less than 750 GBP per article, all universities would save money. Even the largest university in the study would, for example, save around 1.6 million GBP per annum if the overlay service charge is 500 GBP per article.
Open Access journals
If universities switch from the current subscription-based system to publishing all their articles in Open Access journals that charge an article-processing fee, there would be savings for all universities when the article-processing fee is 700 GBP per article or less. Where article-processing fees (APCs) are 500 GBP per article, even the largest university would save, in this case around 1.53 million GBP per annum. The maximum savings found in our modelling, accruing to a medium-sized university, were 1.7 million GBP per annum when the article-processing fee is 500 GBP per article.
If article-processing fees are 1000 GBP, all but the largest university in the study would save. Savings for three of the four universities in the study range from 0.17 million GBP to 1.4 million GBP per annum. The largest university studied would, however, face extra costs of around 1.86 million GBP per annum for this option.
When article-processing fees for Open Access journals are 2000 GBP per article, there would still be savings for two of the four universities studied. When APCs are more than 2000 GBP per article, it is likely that most universities would spend more money than for the current subscription-based system. As with all other article-processing fee price points under this option, though, the direct costs of APCs would not all fall to the universities: some of the costs may be covered by external research grants as is current practice.
Savings for research
Total research system savings arising from a move to Open Access (subscription savings, library handling savings, inter-library article purchase savings and savings accruing to researchers from easier access to journal articles for the purposes of reading, writing and
vi
peer reviewing) for the universities studied range from 0.8 million GBP to 5.1 million GBP per annum.
Savings through optimising elements of the research process (less time spent searching for, locating and accessing information, less time spent on permissions procedures, less duplication and so on) for the universities studied vary from 0.1 million GBP to 1.4 million GBP per annum.
Academic benefits from Open Access
Academic benefits from Open Access include increased visibility, usage and impact for their research outputs. If Open Access increases citation impact by 25%, the economic value of this new, additional impact to the universities in this study ranged from 0.4 million GBP to 40 million GBP.
Benefits for society
The value of the ‘return to R&D’ from Open Access – an economic measure of the value of the contribution to the research community as a whole (including to funders, institutions and researchers) arising from better accessibility of research information; savings derived from less duplication, reducing plagiarism, greater overall accessibility of information, facilitation of interdisciplinary research, and so forth – ranges from 0.3 million GBP to 2.8 million GBP per annum for the universities studied.
Other economic benefits from Open Access are those relating to easier access to information by SMEs (small and medium-sized enterprises) and by the professional and practitioner communities. These have not been modelled here but this should be a focus for future work. In addition, Open Access to research outputs contributes in more general ways to the cultural development of society and to the health of the knowledge economy.
The benefits of Open Access as a principle are unarguable. The money to pay for Open Access by any model is already in the Higher Education system in the UK (Houghton et al, 2009a). Not only is the money already there, but less of it would be needed: Houghton has also demonstrated that there are savings to be made nationally from a move to Open Access. The gains for research and society are also plain, in economic terms and in terms of a general enhancement of the knowledge base. This study has modelled the likely economic outcomes for moving to Open Access for a representative range of universities and has demonstrated that there are economic benefits to be enjoyed at institutional level, too, if the right conditions are in place. For some institutions, though, there will be significant cost implications in some circumstances. The sector as a whole, mindful of the overall benefit to be gained, will need to begin thinking about how best to address the issues of transition. The challenge now for the UK HE community is to work out how to make the change.
Acknowledgments During the course of this work we prevailed upon the time and energy of a number of contacts in each of the universities that participated in this study. They participated under promised conditions of anonymity and so cannot be identified here, but they know who they are and understand their importance to the project’s execution. It could not have been done without their careful dedication to the task, willingly and good-naturedly provided. As important as this hands-on help was the enthusiasm and support of the vice chancellors of the participating universities, who gave permission to use their institutions as case studies knowing that staff resources would need to be diverted to the task. We thank them all. Special gratitude is due to Professor John Houghton of Victoria University, Melbourne, Australia, who not only provided the tools with which to carry out much of this study, but who acted variously as trainer, mentor and pacifier during the course of the work. Among his many admirable attributes, generosity of spirit and a quest for independent and thorough academic inquiry rank very high.
1
SECTION ONE:
INTRODUCTORY MATERIAL
2
1. INTRODUCTION
1.1 The context The scholarly communication landscape is changing, with profound implications for universities. Data and methodologies are now available that can provide university managers with information about these changing practices. These data will inform strategic decision-making in higher education institutions. Open Access may be achieved in more than one way and this study models the costs and benefits of Open Access by different routes and of other scholarly communication scenarios. In particular, the shift from print journals and books to electronic versions has been a major transformative factor in scholarly communication over the past couple of decades. Attention is paid in this study to the economic effects of moving through the final stages to a world where journals in hard copy are phased out completely. The move to Open Access for research outputs can at once both simplify access and complicate things by disrupting systems and processes that have been in place for a very long time. Such transformation may be worthwhile on purely economic terms. There may also be additional returns that outweigh the price of change. The JISC commissioned this study to model the costs and benefits of changing scholarly communication practices within UK HEIs (Higher Education Institutions). In particular, the study has been designed to achieve two key goals:
To provide information to institutional managers about the costs and benefits of changing scholarly communication practices with a special focus on open access to research papers
To develop a methodology using case studies based on different types of higher education institution and employing real data and contextual information provided by these institutions. The idea was to produce a methodology that can be used by other institutions to model the economic effects of different scenarios in their own case.
The work does two things in terms of modelling: it identifies the costs and benefits of different scholarly communication scenarios; and it quantifies them, that is, it attaches actual values to cost elements in the processes involved and measures what economic outcomes emerge from modelling various scenarios.
1.2 Foundation work Two important economic investigations on the scholarly communication system have been carried out recently. One is the study carried out in 2008 by Cambridge Economic Policy Associates (CEPA) for the Research Information Network, and which identified the costs of each part of the research process, including the communication element, and tracked the flows of funding around this system (CEPA, 2008). The other is the set of studies by Houghton and co-workers to model the costs and benefits of different economic models of scholarly communication. The modelling was first applied in Australia, then in the UK (Houghton et al, 2009a), and then followed up by parallel studies in
3
the Netherlands (Houghton et al, 2009b) and Denmark (Houghton, 2009). This group’s work, built upon on a previous analysis by Björk (2007) of systems processes in scholarly communication, was able to attach costs and model the benefits of four scholarly communication systems – subscription publishing, Open Access publishing through Open Access journals (often referred to as ‘Gold’ Open Access) and Open Access provided by repositories while the subscription-based system persists alongside (often referred to as ‘Green’ Open Access); and Open Access provided through repositories with overlaid publishing (i.e. quality control and editorial) services. In addition, several other studies have been carried out on an institution-by-institution basis. Walters and Wilder (2007) examined the costs, for a number of institutions, of moving to an Open Access model for life science research where costs are covered by article-processing fees. Waaijers, Wesseling and Savenije (2008) looked at the same issue across all research outputs for two Dutch research institutions. While these studies have added some useful data to the field, comparing current library subscription costs with the costs that institutions would bear if all journal articles were published under conditions where an article-processing fee (APC) is charged for each accepted paper is too simplistic. Libraries do not just save the cost of subscriptions if all journals become Open Access: there are processing and other handling costs that could be saved as well. These savings should be even more pronounced in the case of print-only journals moving to Open Access, electronic-only delivery, where there are considerable handling cost savings from tasks that would be no longer needed, such as checking-in, shelving, stacks maintenance, binding and warehousing such journals. In addition, the cost of purchasing article supplies through inter-library loan services would also be eliminated. Moreover, there are efficiency savings to be gained in research activity as well as by the library from having the research literature freely available. In aggregate, these studies have provided a rich resource on which to base the work for this current project. In particular, Houghton has developed a model in Microsoft Excel format into which users can enter their own data in order to determine what sort of outcome, in cash terms, would pertain in the chosen case. Thus, modelling costs and benefits of Open Access can be done for any nation, sector or institution, provided that the appropriate data can be collected. It is this model that we employed here, gathering data from the case study institutions to populate it in order to derive information about the costs and benefits of the various Open Access scenarios for those universities.
1.3 The scope of this study The primary study covered four UK higher education institutions (HEIs), between them representing the range and types of HEIs in the country in terms of size, research base and mission. This range of institutions was selected to enable comparisons to be drawn between the economic situations that would prevail under Open Access for institutions of very different size and type of operation. Where exact data for the case study universities can be given without identifying those institutions, then this is done.
4
The universities used as case studies are described, but not identified, in the methodology section of this report (section 2). Two additional universities were included in the study as it progressed by request from those institutions. Data from these are not included in this report. The primary focus of the project was to model the costs and benefits arising from a move to Open Access for research papers (journal articles). The study by CEPA (2008) also specifically addressed the effects of other issues that might change, namely a shift to electronic-only journals, payment to reviewers for carrying out peer review processes and an increase in research funding. The Houghton Model does enable all these things to be modelled but, given the size of the current project, we omitted exploration of a shift to payment for peer review (because it is an unlikely scenario) and limited the types of research outputs to journal articles and conference papers only. The Houghton Model allows for the inclusion of research monographs but sourcing accurate data about monograph production from individual universities is very difficult. There is also, as yet, no clear, established business model for Open Access publication of monographs (though some are emerging), so modelling the movements of cash around an Open Access monograph publishing system remains speculative. In summary: (i) We determined, for each university:
the costs to the library of the current system of toll (subscription) access to journal articles for each institution
the costs of the research communication process in each university (ii) And we modelled, for each university, the costs and benefits of:
a shift to electronic-only journals
a shift to full Open Access where all articles are published in Open Access journals, making the assumption that all these journals charge an article-processing fee for each article published
a shift to full Open Access for journal articles via the same route but basing the calculations on the actual, current situation, which is that only around half of Open Access journals charge an article-processing fee
a shift to full Open Access where authors deposit (‘self-archive’) their articles in their university Open Access repository and these articles are also published in parallel in traditional toll-access journals as is currently-developing practice. This model assumes that subscription cancellations would not take place under these conditions (which is the current, actual situation) and therefore in this scenario there are no savings to be had from publisher-related processes, library handling processes or reductions in subscriptions
a shift to Open Access via repositories which have overlay publishing services: that is, where authors deposit (‘self-archive’) their articles in their university repository, thereby providing the raw material for ‘overlay’ services that then carry out publishing functions, such as peer review management, editing and, if required, branding
5
Finally, the Houghton and CEPA studies focused on the costs and benefits in cash terms of process issues in scholarly communication. Institutional return can also be measured by other criteria. Our analysis therefore includes some modelling for each institution of the impact benefits from Open Access at institutional level (whilst some elements of this ‘Open Access advantage’ will disappear in a fully Open Access world, not all will be eliminated). It is possible to explore this issue using a simple calculation based on institutional investment and expenditure and to come up with a future (cash) value and an institutional return measured on other bases. Recently-reported work by Bollen et al (2005, 2008, 2009) indicates the predictive value of downloads and work by a number of authors confirms the ‘Open Access advantage’ in terms of citations (OpCit Project). We integrate some analysis based on these findings to provide further information on institutional costs and benefits of Open Access in particular.
6
SECTION TWO:
METHODOLOGICAL ASPECTS OF THE STUDY
7
2. METHODOLOGY
2.1 The scholarly communication process The most comprehensive model for the whole scholarly communication life cycle was developed by Björk in 2007. He used the formal process-modelling method IDEF02, which is the standard tool used in business process re-engineering. The scholarly communication model derived by Björk was further refined by Houghton and Björk3 (see Figure 1 overleaf). It is the basis for the economic studies by Houghton and colleagues, and also the basis for this present work. The model encompasses five scholarly communication process activities:
Fund research and its communication
Perform research and communicate the results
Publish research outputs
Facilitate dissemination, retrieval and preservation
Study publications and apply the knowledge derived Each of these consists of numerous sub-processes which Houghton and Björk identify in detail. The costs of these sub-processes underlie the modelling described in this report.
2.2 The case studies The project involved four university case studies, selected to represent the broad range of UK universities on a number of bases. Their characteristics are described below and throughout this report they will be referred to as University A, University B, University C and University D. All four cover the major disciplinary areas of natural science, physical science, social science and humanities in both teaching and research, though emphasis varies from institution to institution. Research intensity varies, too: the largest university of the four has a research income that is around one hundred times that of the smallest. Two of the universities have medical schools, and one is in London: both these factors lead to relatively high operating costs for institutions. One university is one of the ‘G5’ super-elite UK universities and is among the world’s top 20 such institutions. All have an active institutional repository supported by senior management. The main characteristics of the case study universities are shown in Box 1.
2 IDEF0 Function Modelling Method: http://www.idef.com/IDEF0.html 3 http://www.cfses.com/EI-ASPM/SCLCM-V7/
Two other universities were also included as the study progressed, though these are not discussed in this report, nor used to calculate median values. One is very similar in profile to University C and the other very similar to University D. These were supplementary case studies which were specifically requested by the HEIs concerned. The original set of four universities suffices to show an illustrative range of examples. Data collection involved working with the administrative offices and libraries of the participating institutions. The data needed from the libraries were particularly complex, so a round-table discussion was held to explain the datum points, agree on ways of standardising the methodology as far as possible across the institutions, and clarify any misconceptions.
2.3 Data elements of the online model The online model provided by Houghton et al requires data about the library, research and repository operations of a university or research institution. Specifically, the data elements that the model uses are shown in Box 2: these will need to be collected by those wishing to apply this modelling methodology to their own institution.
University A: a relatively small, post-1992 institution with a strong vocational/professional focus and with a growing, good-quality research base. It provides a counterweight to the research-primacy of some of the other case studies. Research income: circa 2 million GBP per annum. University B: a pre-1992 university with a tradition of strength in applied research and a strong enterprise and innovation focus. Research income: circa 10 million GBP per annum. University C: a large, research-intensive Russell Group University. Research income: circa 75 million GBP per annum. University D: a large, very research-intensive, high-performing university. Research income: circa 200 million GBP per annum University X: the mean case
9
Figure 1: The scholarly communication process model Source: Houghton and Björk, and see: http://www.cfses.com/EI-ASPM/SCLCM-V7/
Box 2: Data elements required for the online model
2.4 Data collection: general points The 2008 RAE (Research Assessment Exercise)4 was a systematic national data collection exercise in which each university in the UK provided information on research staffing levels, research student numbers, external research income, and ‘factors of esteem’. The submissions from individual institutions were published on the RAE 2008 website in the spring of 2009 and these were used to obtain certain elements of the data we needed for the modelling exercise.
4 http://www.rae.ac.uk/
Library-related data
Average annual salary of library staff in the institution
Subscriptions (number of serials titles)
Serials acquisition costs per annum
Share of journal subscriptions that are print-only
Share of journal subscriptions that are electronic-only
Share of subscriptions that are dual-mode (print plus electronic)
Handling time per year per journal (toll-access, print)
Handling time per year per journal (toll-access, electronic-only)
Handling time per year per journal (open access - electronic-only by definition)
Inter-library loan and article purchase costs
Research-related data
R&D spending (funding) per annum
Average annual salary of researchers in the institution
Number of publication-active researchers in the institution
Annual journal article output from the institution
Reading and writing articles:
Time spent reading journal articles (hours per annum)
Time spent writing journal articles (hours per annum)
Peer review activities:
Time to peer review articles (hours per review)
Average number of reviews per article
Average article rejection rate
Average resubmission rate
Editorial activities:
Percentage of researchers who are editors of journals
Percentage of researchers who are on journal editorial boards
The RAE collects data from up to 67 ‘Units of Assessment’ (UoAs) in each institution: these UoAs are subject areas (examples are chemical engineering, education, business and management studies) but they do not correspond precisely to departments or schools. Data from institutions are therefore collected across departmental boundaries in many cases. Not all universities (in fact, only the very largest) submit data for every one of the 67 Units of Assessment. The RAE 2008 website publishes the submissions only under individual UoAs so retrieving data for whole institutions means collecting the figures for each UoA and summing them to get an institutional total. Other data elements were procured directly from the universities. Data on researcher salaries were obtained from central administrative departments in each case. Data relating to library operations were provided for us by the libraries themselves and repository-related data were obtained from the repository manager in each institution. Information about journal article outputs was sourced from the universities (where a publications database or research information system is in place) and from the Web of Science and Scopus databases. Finally, some data were sourced from Houghton’s previous work, which itself sourced them from international studies. All these data collection procedures are described in detail below.
2.5 Data collection: research-related data R&D spending (funding) per annum (GBP) R&D funding data were collected from the RAE submissions of each university. The submissions provide R&D funding amounts for each UoA for each of the years the RAE covered (from half-way through 2000 to 2007). We added the yearly figures for each UoA to get the external research income figure for the whole period and summed the individual UoA figures to get the whole-institution total. Then we calculated the annual mean across the whole period, thereby smoothing out the frequently erratic pattern of research funding across the years. Average annual salary of researchers in the institution (GBP) The precise salary data that would have been needed for that calculation were considered confidential by the universities so we had to devise something that would arrive at a good approximation of average researcher salary, and we opted for a methodology that could be applied consistently across all the universities studied with the full cooperation of the institutions. Universities were asked to provide the median points on salary scales for each grade (e.g. lecturer, senior lecturer, dean) of publication-active staff plus the number of staff they employ on each grade. We then multiplied the number of staff at each grade by the median salary, summed the totals and divided it by the total number of staff. The result is not
12
exactly the mean salary of researchers in that institution because the calculation does not take into account the fact that all researchers on one grade may be at the top, or at the bottom, of the scale for that grade. Number of publication-active researchers in the institution This figure was derived from the RAE submissions by adding the totals for each UoA of each university for Category A staff and Category C staff. These staff categories are defined by the RAE as follows and fulfil our requirements for knowing how many people in each institution are research- (and thus publication-) active.
Category A: academic staff in post and on the payroll of the submitting institution on the census date (31/10/2007). Eligible Category A academic staff must be employed under a contract of employment within the School on the census date. Their contract must list research and/or teaching as their primary function.
Category C: independent investigators active in research who do not meet the definition for Category A staff but whose research on the census date is clearly and demonstrably focussed in the department that returns them.
Annual journal article output from the institution Figures for journal article output for each university were obtained from Web of Science, Scopus and, where available, from university research information systems. We collected figures for 2006 and 2007 and calculated a mean annual figure from them. That period corresponded as closely as possible to the final period of the RAE, thus matching, as far as we could manage, data about people with data about publication outputs. In all cases except that of University A, the Web of Science figure proved to be highest. We used the highest figure (i.e. the Web of Science one for Universities B, C and D, and the internal university research information system (RIS) figure for University A) in each case. Reading and writing articles It was beyond the scope of a project this size to undertake individual studies on how long researchers take to read and write articles. It is also unlikely to vary much between universities: why should researchers in one university take longer to read and write articles, on average, than those in another? Of course, there are likely to be disciplinary variations, but these are smoothed out by using an overall average figure. In this case we used the figures employed by Houghton et al (2009), which were themselves derived from studies by Tenopir and King (2000), King (2004), and Tenopir and King (2007). Time spent reading journal articles (hours per annum): 145 hours per annum per researcher Time spent writing journal articles (hours per annum): 95 hours per annum per researcher Peer review activities The same constraints applied to peer review data as to reading and writing articles (above). We therefore used the data employed by Houghton et al (2009), which themselves were derived by industry consultation, obtaining consensus from the literature and from studies by Tenopir and King (2000) and King (2004).
13
Time to peer review articles (hours per review): 4.5 hours per review Average number of reviews per article: 2.5 hours per review Average article rejection rate: 50% Average resubmission rate: 75% Editorial activities One section of the RAE records ‘research environment and esteem’. While the exact details of the guidelines for each disciplinary area vary slightly, each of them suggests that editorial responsibilities (‘editorship of scholarly journals’, ‘membership of editorial boards’) are examples of an esteem factor that could be recorded by universities under each UoA. Universities are not obliged to record and submit these things, but given the RAE guidelines and assuming that universities wish to make their submissions as strong as possible, we deduced that where editorial responsibility is exercised this would be recorded5. This section of the RAE submission is in text form, so we checked the ‘esteem factor’ section of each UoA of each university and extracted the numbers of researchers who were explicitly mentioned as having editorial responsibilities, using the following criteria:
Percentage of researchers who are editors of journals: we counted those who were recorded for the RAE as being any of the following: editor, editor-in-chief, co-editor, joint editor, deputy editor, section editor, regional editor. We did not count terms such as ‘book review editor’ or others that suggested a more minor role in the running of a journal. Percentage of researchers who are on journal editorial boards: we counted those who were recorded for the RAE using any of the following terms: associate editor, editorial board, advisory board, editorial panel, editorial adviser, book review editor.
2.6 Data collection: library-related data The libraries in each university under study produced information about their operations from which we derived the data for modelling.
5 Caveat: The RAE does not absolutely require this information so it is possible that our methodology here underestimates the true picture. The alternative methodology would have been to search researcher websites in the universities for mention of editorial activities there. The same caveat (that researchers may not systematically record editorial duties on their personal web pages) would have applied, though, and we decided that the importance of the RAE is such that in the vast majority of cases universities would have recorded as much editorial activity as possible in order to maximise the value of their ‘esteem’. Moreover, the figures we derived here match those derived by Houghton et al from the numbers for the UK as a whole, from which these authors estimated that 8% of researchers in an average UK university undertake editorial activities and 24% serve on editorial boards.
14
Average annual salary of library staff in the institution (GBP) This figure was supplied by the libraries. In most cases the figure was obtained by them from the latest SCONUL Annual Library Statistics6, which covers the academic year 2007-8. In other cases, the libraries calculated their own figure. Subscriptions (number of serials titles) This is the total number of serials titles to which each library subscribes. Journals included in ‘Big Deals’ or other package deals were counted as separate titles. Serials acquisition costs per annum (GBP) This is the total sum paid for journal subscriptions for this year. Package deals are included in this datum point. We have also added in the cost of any special arrangements for acquiring journals (for example, one university pays an agent an annual fee to procure all its electronic journal subscriptions on its behalf). Subscription mode The libraries provided data on the percentage of the total subscriptions that come in each mode, that is:
Percentage of journal subscriptions that are print-only
Percentage of journal subscriptions that are electronic-only
Percentage of subscriptions that are dual-mode (print plus electronic) One library could only provide figures for print-only subscriptions and all subscriptions that have electronic delivery. The latter encompasses both electronic-only and dual-mode. For modelling purposes, when the model required electronic-only and dual-mode subscriptions to be differentiated, we used a 50:50 split. For some calculations, the model treats dual-mode subscriptions as print subscriptions, assuming that dual-mode subscriptions require the same handling as print-only journals. We checked with the libraries to find out if this is true in practice. The results were that University A discards the print copies of about a third of dual-mode subscriptions; Universities B, C and D treat them as print journals. The libraries noted that their treatment of dual-mode subscriptions might well change over time as they become more confident of having permanent access to the electronic files. Of the two additional universities in the study, one treats them as print journals and one discards all print copies, treating dual-mode subscriptions as electronic-only ones. Those using the model should attempt to model the real situation in the institution under study: if the library discards the hard-copy versions of dual-mode journals then these should be counted as electronic-only subscriptions for modelling. Handling time per year per journal (toll-access, print) The libraries were asked to calculate the total handling time for a print-only, subscription journal. The guidelines we gave were that they should try to calculate the minutes per title
for the following tasks. These are derived from the studies by King et al (2004) and Schonfeld et al (2004) in their detailed analysis of library procedures and costs:
Collection development
Negotiation and licensing
Subscription processing
Receipt and check-in
Routing
Cataloguing
Linking
Physical processing
Stacks maintenance
Circulation
Reference
User instruction
Preservation
Other The libraries vary in the way they approach and carry out certain of these tasks. For example, one university provided data for cataloguing and linking as one datum point because the two processes could not be measured separately. There were other similar examples. This detail does not matter for the final modelling so long as each library can derive a handling figure (in minutes per year) for a typical journal in each mode. This minutes-per-year figure is the total of the time taken for all the tasks listed above; so long as this whole processing procedure is analysed and calculated (in minutes) then the precise ways in which the tasks are carried out in an institution is not important. The figures were calculated for each of the three delivery modes:
Handling time per year per journal (toll-access, print)
Handling time per year per journal (toll-access, electronic-only)
Handling time per year per journal (open access - electronic-only by definition) Variances between the modes are expected, of course: as examples, electronic-only journals need no figure for stacks maintenance and Open Access journals need no subscription processing. Inter-library loan and article purchase costs Libraries provided their average annual figure for the cost of inter-library supply of journal articles. Other cash outflows for article purchase do occur within institutions but these are difficult to track and record because they are almost always actioned at individual researcher level. As a result, we did not include this cost component in our calculations (thus underestimating the real cost to universities of acquiring the journal literature), but others wishing to use this modelling methodology for their own institutional situation may be able to arrive at a usable figure for this cost element.
16
2.7 Data collection: repository-related data Annual operating cost of the repository This figure includes the following:
Hardware costs: the cost of the server(s) and other hardware used to run the repository. We wrote this cost down over three years, which is normal practice, to derive the annual figure.
Software costs: most repositories run on open source software but where a repository buys in software this must be factored into the calculation
Staff costs: these vary considerably from institution to institution. In some cases there are multiple staff employed to run the repository operation. In others there is a manager (not necessarily employed full-time on the repository) and hosting and maintenance are outsourced to third party suppliers. Each instance is unique in some way and costing this element may require detailed work. It is important to exclude here the staff time used for deposit, because this is costed into the model separately and double-counting must be avoided. So if repository staff spend any time on deposit, this proportion of their salary must be excluded from the staffing cost here. Only the proportion of their time (and thus salary) used for other tasks to do with running the repository must be included here.
Other costs: these will cover a variety of things (or none) in each institution. We did not identify much to consider here for the 6 universities in this study, but if an institution spends an identifiable amount on, say, marketing materials, or advocacy outside the remit of the repository staff (which have already been costed in above) then this figure must be included here
In summary, there may be various arrangements that need to be taken into account in discovering the running costs of a repository. Care must be taken in this exercise not to double-count some costs and to ensure that all activities carried out in the institution that relate to the running of the repository are identified and costed in. Time taken to deposit a journal article This can be (and was in this study) derived in two ways: either by the repository manager (or whoever does the depositing where deposit is mediated) measuring the time taken to deposit a number of items and then averaging out the results, or by inspection of the repository logs. Note that, as in this study, only the journal situation is being modelled, care is needed to ensure that the figure is the time to deposit a journal article, not a complex object that may need considerable additional time, nor something more simple than a journal article, such as a presentation or lecture notes where copyright checking procedures may not be needed. Average annual salary of depositor Where repositories report that all deposit work is done by the repository manager then this is a simple datum point (i.e. the annual salary of that manager) to obtain. In most cases, though, 100%-mediated deposit by one person is not the norm and some share of depositing is done by authors or by third parties. In these cases the salary of those depositors must be
17
obtained and then the final average annual salary figure must take into account the proportion of depositing down at those salaries. For example, if half of all deposits are carried out by the repository manager, a quarter by an assistant to that manager, and the rest by authors, the final average salary will be the sum of:
50% of the repository manager’s salary 25% of the assistant’s salary 25% of the average researcher’s salary (already collected for this model)
18
3. USING THE ONLINE MODEL
3.1 Introduction The overall purpose of the model is to compare Open Access alternatives to subscription access. The model calculates costs, savings and benefits and expresses them in terms of annual values in British Pounds (GBP). In Houghton’s work a highly complex modelling system consisting of two spreadsheets with more than 40 worksheets was developed. This complexity was necessary to enable national-level situations to be modelled and Houghton et al have used that to model scholarly communication changes for the UK (Houghton et al, 2009a), The Netherlands (Houghton et al, 2009b) and Denmark (Houghton, 2009) so far. The online model7 developed from the Houghton study and made available for use by other investigators is a considerably less complex thing. It provides the means to model a number of scholarly communication scenarios (sub-models) and can be used to model both national and institutional situations. Also, some sub-models are relevant to journal and book publishers who wish to understand the costs and benefits of changes in their operations, particularly in relation to moving to electronic-only delivery or Open Access. The model permits data collected by users to be entered as a number of variables. Some of the scenario sub-models feed data into others, though the general design is such that each scenario can be modelled as a stand-alone entity. The sub-models we used for this study were:
Library handling costs and savings model
Research activity costs model
OA publishing impacts model (Open Access via Open Access journals)
OA self-archiving impacts model (Open Access via repositories with or without overlaid publishing services)
In the sections below we show the data points required by the model.
3.2 Library handling costs and savings model This sub-model calculates values for a number of things, shown in Box 3.
7 The model can be downloaded as a .exe file from this web page: http://www.cfses.com/EI-ASPM/
Box 3: Open Access impacts calculated using the Library Handling Costs sub-model
The sub-model requires users to enter the data described in section 2.5 and listed in Table 1. The model then permits a choice of conditions about Open Access namely: - whether there is an assumption of worldwide Open Access (i.e. all articles in all journals are freely available), or - if unilateral Open Access prevails. This calculation is scaled to the individual institution’s situation only: that is, savings are in proportion to the share of the global journal literature that would be Open Access as a result of the unilateral adoption of alternative Open Access models by the institution under study
It should be noted that full potential cost savings can only be realised when there is worldwide Open Access. Nonetheless, modelling the hypothetical situation provides an institution with a picture of the effects of its own move to Open Access for its outputs.
Parameter
Average annual salary of library staff (gross salary, GBP) Number of subscriptions (serials titles) Serials acquisition costs (per annum, GBP) Estimated article output from the institution (per annum) Library journal handling time per title per annum (minutes per annum): Toll access journals, print-only Toll access, electronic-only Open Access (electronic-only by definition) Percentage of subscriptions that are print-only Percentage of subscriptions that are dual-mode Percentage of subscriptions that are electronic-only
Table 1: Library Handling Costs and Savings Model parameters and variables The model adjusts for the fact that personnel handling electronic subscriptions are paid more than those handling print subscriptions as determined by Schonfeld et al (2004).
Average hourly staff costs (including on-costs and overheads)* Implied current library journal-handling costs per annum Library journal handling costs per title (subscription-access, print) Library journal handling costs per title (subscription-access, electronic-only) Library journal handling costs per title (Open Access, electronic-only) Implied library journal handling cost saving with Open Access Implied library subscription saving with unilateral Open Access** Implied library journal handling saving with unilateral Open Access** *Calculated using the TRAC fEC methodology **for this study we focused upon modelling outcomes in an all-Open Access world, not one where individual institutions go Open Access alone
20
3.3 Research activity costs model The values calculated by this sub-model are shown in Box 4.
Box 4: Open Access impacts calculated using the Research Activity Costs sub-model
The data entered in this sub-model relate to activities carried out in the course of performing and publishing research. The model calculates the costs associated with these normal research activities in an institution. The sub-model allows for data about books and other types of research output to be included in the computation but, as this study was restricted to journal articles, values of 0 were entered in the relevant places in the model. As described in section 2.4, we used Houghton’s figures for some of the variables and these are marked with an asterisk in the list below. The parameters for this sub-model are shown in Table 2 below:
Parameter
Number of publication-active researchers Average annual salary of researchers (gross, GBP) Journal article output per annum Time spent reading journal articles (hours per annum)* Time spent writing journal articles (hours per article)* Time to peer review journal articles (hours per review)* Average number of reviews per article* Average article rejection rate (per cent of submissions)* Average resubmission rate (per cent of rejected submissions)* Percentage of researchers acting as editors Percentage of researchers on editorial boards
Table 2: Research Activity Costs Model parameters and variables *values from Houghton et al (2009)
We also included in the modelling the cost of inter-library lending. Inter-library loan (ILL) costs were obtained from the universities. The cost used for each university in our calculations pertains only to the cost of purchasing access to journal articles.
3.4 Open Access publishing impacts model This sub-model calculates the values shown in Box 5.
Average hourly staff costs (including on-costs and overheads)* Cost of researchers reading journal articles Cost of researchers writing journal articles Cost of researchers carrying out external peer review of journal articles for publishers Cost of researchers carrying out editorial and editorial board activities
*Calculated using the TRAC fEC methodology
21
Box 5: Open Access impacts calculated using the Open Access Publishing Impacts sub-
model This models the effects of an institution moving to Open Access through publishing all its outputs in Open Access journals. Open Access journals operate using a variety of business models, one of which is where an article-processing fee is levied when an article is accepted for publication. Houghton and his colleagues calculated that the cost of processing an Open Access article (including peer review management, editing and other publishing-related costs) amounts to around 1500 GBP, and this cost is entered into the model as a value for the parameter publication fees per article (author pays8). That cost includes a margin of 20% for publisher management and investment and a 20% profit margin. Houghton acknowledges the fact that even though only just over half of all Open Access journals levy such fees, the cost of publication of Open Access articles must be met, and are met, somewhere in the research system. Thus allocating a cost for article-processing, despite the multiple forms in which it manifests in the research process, is necessary, and the place where this cost is entered into the model is in the publication fee field. The model does, however, allow any figure (including zero) to be used in that field. We applied the model using several figures: 1500 GBP, 1000 GBP, 750 GBP and 500 GBP. We did this for two reasons. First, because it is informative to see how impacts change when different article-processing costs (fees) apply: we anticipate that as more and more journals move to Open Access publishing and print is eliminated altogether as a delivery mode, systems cost savings will be possible and competition will help drive down prices. Thus in future it may be that the average cost (fee) reduces from today’s figure of 1500 GBP. Second, because by using the 750 GBP figure we could effectively model the true situation as it is today; that is, that only around half of Open Access journals do levy article-processing fees and so by using the half-fee value (750 GBP as opposed to 1500 GBP) we are modelling, strictly in cash-flow terms, what is really happening now. In addition, we added 25 GBP to the article-processing fees to account for increased costs within the universities of administering such fees. This is probably an underestimate of the
8 As well as the fact that less than half of Open Access journals levy such fees, it is rarely the author who pays the fee if it is required. In most cases the money comes from research grants or from the author’s institution.
Implied library handling saving (using the current mix of formats as the basis) Implied research saving from Open Access Implied increase in returns to R&D from enhanced access Cost of Open Access publishing charges Implied overall saving from Open Access
22
real cost: systems are currently not streamlined, with some APC payments being authorised by researchers from grant budgets and others being processed through central funds allocated to universities by certain funders. Future streamlining, if Open Access journal publishing requiring APCs is to become the norm, will be achieved as systems evolve and bed down. We used the value of 100 for the number of articles per journal per annum after consultation with the libraries, where there was agreement that, taking into account the fact that humanities journals publish in general considerably fewer articles than science journals but are also fewer in number themselves, 100 is a reasonable number to use for the mean value. The research time saving parameter is the percentage of a researcher’s time saved, per year, by having Open Access to all journal articles and is the figure calculated by Houghton et al (2009). This is composed of time saved in searching, discovering and accessing articles, which is easier with Open Access; in seeking permission to use articles; in streamlining peer review (where reviewers have easier access to articles they may need to use in their review procedure) and in writing and preparing articles (when accessing other articles they may need for this process is simplified by Open Access). The parameters for this sub-model are shown in Table 3 below.
Parameter
Publication fees per article (article-processing fees) GBP Estimated article output per annum Number of journal subscriptions Serials acquisition costs (per annum, GBP) Average articles per title Library journal handling time per title per annum (minutes per annum): Toll access journals, print-only Toll access, electronic-only Open Access (electronic-only by definition) Percentage of electronic-only subscriptions Number of publication-active researchers Research time saving (estimated percentage)* R&D spending (funding) per annum (GBP)
Table 3: Open Access Publishing Impacts Model parameters and variables *each fee has 25 GBP added to it when modelling to account for intra-institutional processing costs (see explanation above) **value from Houghton et al (2009)
3.5 Open Access self-archiving impacts model This models the costs and savings of Open Access via repositories. The sub-model calculates the values shown in Box 6.
23
Box 6: Open Access impacts calculated using the Self-Archiving Impacts sub-model
The data needed for this model are described mainly in section 2.7. The institutional repository is predominant here because the scenario involved is one where the institution makes its outputs Open Access through its repository. Optionally, the model enables exploration of a scenario where ‘overlay’ services then carry out peer review and editing functions. In other words, the repository is the vehicle for publication. Overlay costs were estimated by Houghton et al to be around 1,127 GBP per article. This covers peer review management, editing and proofing costs. In addition, we wanted to cost into the model the relatively small cost of administering the payment of article-processing fees. The parameters for this sub-model are shown in Table 4 below.
Parameter
Annual total operational cost of OA repository Number of repositories Time taken to deposit journal article (minutes) Average annual salary of person depositing (gross salary, GBP) Number of articles produced per annum Estimated cost of overlay services per article*
Table 4: Open Access Self-Archiving Impacts Model parameters and variables *value from Houghton et al (2009). We also modelled using a range of values for this parameter (500 GBP, 750 GBP and 1000 GBP)
3.6 Publisher costs When attempting to model different communication scenarios, it is necessary to unpick publishing models ( e.g. Open Access journals, or Open Access via repositories) from publishing formats (print, electronic, dual-mode). Houghton and colleagues estimated publisher costs for articles produced in different formats, deriving their data from the work of Tenopir and King (2000), King (2007), King (2007), Waltham (2005) and the study by CEPA (2008). The cost of providing a full publishing service (quality control management, editing, formatting, etc) was estimated to be 1260 GBP per article. Included in this are hosting costs for making the article available on the Web, estimated at around 132 GBP. This last element (hosting) is omitted from the overlay cost when calculating costs of Open Access via
Cost per hour of the person depositing items in the repository Cost of depositing (self-archiving) per item Cost of depositing all journal articles from the institution per annum Cost of providing overlay services for all articles per annum Total cost of the repository (or repositories) per annum Implied saving from Open Access via the repository with overlay services
24
repositories because the university repositories provide that hosting function and its cost is included in their operational costs. The data that Houghton et al derived for publisher costs are as follows:
Publishing format/model Cost per article
Subscription (toll-access) journal publishing Subscription, electronic-only 2,337 Subscription, dual-mode 3,247 Subscription, print 2,728 Open Access journal publishing Open Access, electronic-only 1,524 Open Access, dual-mode* 2,003 Open Access, print* 1,831 Open Access via self-archiving in repositories Peer review management as an overlay service 455 Editing and proofing as an overlay service 673 Hosting as an overlay service 132 Full overlay service costs** 1,260
Table 5: Estimated average publisher costs per article by model and format (GBP) Source: Houghton et al (2009) These costs exclude the external costs of peer review and VAT. *Estimates for print and dual-mode OA publishing exclude print or subscriber-related costs, assuming that the content is produced print-ready and print is an add-on. **Overlay services include: operating peer review management, editing, proofing and hosting, with commercial margins (allowed at 20% for management and investment and 20% profit).
It should be noted that some publishers have quibbled with these figures but have declined to provide actual data in their stead. Houghton’s figures triangulate well with data from the study by CEPA (2008) who used a different methodology to arrive at a publishing cost per article (see Houghton et al 2009, p159). In the absence of publisher-provided data that differ materially from those calculated by Houghton and CEPA, then, the use of Houghton’s figures for publisher-related costs per article when modelling scholarly publishing scenarios can be considered safe.
25
SECTION THREE:
SCHOLARLY COMMUNICATION-RELATED COSTS
26
4. SCHOLARLY COMMUNICATION SYSTEM COSTS Using the data that we collected and the Houghton Model, we have estimated costs and benefits for various activities and scenarios for the participating universities. As far as possible, we report these in the same manner as Houghton has done in previous reports for ease of comparison. Most of the costs are arrived at through use of the Houghton Model. The cost elements that the model calculates are collectively shown in Boxes 3 to 6 in Section 3 of this report. In addition to those, determining the total costs of scholarly communication for a university requires additional data, which we collected from the universities or from other trusted sources. An example of this is the cost of inter-library lending per annum. Because Houghton and colleagues used a methodology that collected data by activity/element of the scholarly communication process, these elements can be variously combined and summed to provide costs for different components of the system.
4.1 Reading and writing articles Reading scholarly articles by publication-active researchers in the universities studied costs between around 1 million GBP and 21 million GBP each year, and writing the journal articles that the universities produce costs between some 2 million and 50 million GBP per annum.
4.2 Publishing-related activities The cost of external peer reviewing of journal articles carried out by researchers on behalf of publishers is around 0.6 million GBP to 13 million per annum for the universities studied. Editorial board and editorial duties cost around 0.13 million to 3.7 million GBP each year.
4.3 Publisher-related activities The cost to publishers of processing the journal articles produced by the case study universities each year is from 0.8 million to 15.9 million GBP. All these scholarly communication system costs are shown for the case study universities in Table 6.
Process University A University B University C University D
Publisher costs* 827,298 1,491,006 7,174,590 15,858,882 Total system costs 4,852,125 10,667,526 52,192,498 103,644,348
Table 6: Estimated annual universities’ scholarly communication activity costs (GBP) *electronic-only format publications
27
4.4 Scholarly communication-related costs for universities The universities’ scholarly communication-related costs are shown in Table 7. Open Access publishing costs are calculated by scaling the relevant article-processing fees (different levels are used in the table below) to the actual outputs of the universities. Note: there are additional costs that cannot be estimated accurately enough to use here but should be noted as costs that would change (reduce but not disappear) with a shift to alternative publishing models. They are: i) Authentication system costs: universities use authentication systems to ensure that
only those users who are properly entitled to access content can do so. In an Open Access world, most of the need for these would disappear. There would, however, probably remain a need to authenticate users for certain special kinds of content and because of this we have not tried to model the part-reduction in costs associated with this item. The libraries did factor into their calculations of handling time an element for dealing with authentication problems associated with journal access, which would disappear with Open Access
ii) PPV: researchers purchase access to individual articles through publisher websites. The universities do not systematically collect data on this as it is actioned at researcher level, so we have omitted it here, though it may amount to quite a substantial sum in some institutions
iii) Copyright clearance charges: The Copyright Licensing Agency in the UK handles copyright clearance processes and charges universities for this, primarily through a licensing system. The total cost for the UK higher education sector is about 12 million GBP per annum, or up to 100,000 GBP per annum for each university if shared out equally. We have not included this cost in our modelling, though, because some of it would still be necessary in an Open Access world where authors are seeking the right to use third party material in articles or books, and it is difficult to arrive at a reasonably accurate estimate of what might be saved and what would remain as a cost for this item
Process University A University B University C University D
Library acquisitions (subscriptions, toll-access)
537,067 1,236,656 1,899,640 3.382,000
Inter-library lending costs
13,000 8,303 36,018 15,861
Library non-acquisition costs (handling costs)
213,994 580,735 516,360 457,333
Article-processing fees @ 3000 GBP per article
1,070,850 1,929,950 9,286,750 20,527,650
Article-processing fees (Gold Open Access) @ 2000 GBP per article
1500 GBP per article Article-processing fees @ 1000 GBP per article
362,850 653,950 3,146,750 6,955,650
Article-processing fees @ 750 GBP per article
274,350 494,450 2,379,250 5,259,150
Article-processing fees @ 500 GBP per article
185,850 334,950 1,611,750 3,562,650
Repository costs (including depositing direct costs)
26,266 49,829 208,908 117,979
Table 7: Estimated annual universities’ scholarly communication-related costs (GBP) *Includes a nominal 25 GBP per article for payment processing costs within universities
29
SECTION FOUR:
ECONOMIC BENEFITS FROM OPEN ACCESS
30
5. ECONOMIC BENEFITS FROM OPEN ACCESS: PUBLISHER, SYSTEM AND SOCIETAL SAVINGS
This study models a number of scenarios – toll-access publishing with a mix of print and electronic, or electronic-only, journals; Open Access publishing; and Open Access via repositories with or without overlay services. It should be noted that full potential cost savings can only be realised when there is worldwide Open Access. Our modelling focuses specifically on economic benefits to universities under this condition. The study does not attempt to model the economic benefits relating to better access to information for the professional, practitioner, education and lay communities, nor to address benefits to research enabled or improved by Open Access such as interdisciplinarity, collaborative research, and the use of new tools such as text-mining technologies.
5.1 Publishers’ per-article savings from shifts to Open Access The publisher-related costs of publishing an article in different formats are shown in Table 5 (Section 4.6). It is important to note that these are not savings for the universities; they are cost savings that publishers can make by switching model. It is important to note that peer review management and editing processes are costed as normal under this model. Savings arise from: avoidance of costs associated with access and authentication systems and the IT and user support elements that accompany these things; from simplification of permissions handling; from avoidance of the costs associated with negotiating prices and licences and possible saving in distribution (if the use of public repositories is favoured over proprietary hosting systems); more efficient, more timely and higher quality peer review (because reviewers have better access to the background information they need for review); and a reduction in the sales and marketing activities that selling subscription journals requires. The modelling indicates that moving from subscription (toll-access; 2337 GBP per article cost to publishers) to Open Access publishing in Open Access journals; 1524 GBP per article cost to publishers) might save publishers around 813 GBP per article. Moving from subscription (2337 GBP cost to publishers) to Open Access via self-archiving in repositories with full overlay services (1260 GBP per article cost to publishers) might save publishers 1077 GBP per article. These publisher-related parts of the scholarly communication costs system have been estimated in relation to the universities in this study, scaled to their current article output levels. They are shown in Table 8. Note that all these cost estimates are calculated for electronic-only format. Savings, pertaining to the case study universities, for publishers from shifting from the current subscription model to (a) Open Access journal publishing or (b) Open Access via repositories with overlay services are shown in the green-shaded cells in the table.
31
Costs and savings University A University B University C University D
Subscription (toll-access) model costs
827,298 1,491,006 7,174,590 15,858,882
Open Access journal model costs
539,496 972,312 4,678,680 10,341,864
Open Access overlay model costs
446,040 803,880 3,868,200 8,550,360
Saving from shift from subscription to Open Access journals
287,802 518,694 2,495,910 5,517,018
Saving from shift from subscription to Open Access provided via repositories with full publishing overlay services
381,258 687,126 3,306,390 7,308,522
Table 8: Publisher-related per article costs and savings, relating to the case study universities, from shifts in publishing model (GBP)
5.2 Research system savings per article from shifts to Open Access Houghton et al (2009) summed all the system costs per article, in electronic-only format (for simplicity), through the whole scholarly communication life cycle. This includes the cost of doing the research, writing it up and disseminating it; in other words, all the costs associated with the activities shown in Figure 1. In this way, the overall economic differences between scenarios can be demonstrated. The costs calculated by Houghton and colleagues for the UK situation are shown in Table 9.
Publishing format/model Cost per article
Subscription, electronic-only 8,295 Open Access, electronic-only 7,485 Open Access using university repositories with full overlay services and commercial margin
7,115
Table 9: Average publishing system costs per article (GBP) Source: Houghton et al (2009)
5.3 Whole-UK costs and savings From these numbers, Houghton estimated the whole-systems savings that might be realised in the UK if different publishing models were adopted; in other words, if there were shifts from the current subscription (toll-access) model to either:
Publishing in Open Access journals, or
32
Publishing via self-archiving in institutional repositories with full publishing overlay services working on those repositories to provide the quality control, editing/proofing and formatting (and perhaps branding) services required by the research community
Full savings can only be made if the whole world goes Open Access, of course. If the UK as a country were to adopt Open Access unilaterally then savings are scaled to the proportion of the world’s literature that emanates from the UK (about 6.6%; CEPA 2008). For the UK as a whole, the estimates from Houghton were that a saving of around 500 million GBP per annum could be made with a shift from subscription (toll-access) to Open Access journals (with article-processing fees at 1500 GBP for all article). Of this, 430 million GBP would accrue to the higher education sector in particular (the rest accruing to research producers outside academia). The costs within this system include some 150 million GBP in article-processing fees to be borne by the higher education sector (170 million GBP for the UK as a whole). A shift from subscription (toll-access) to Open Access via repositories with full overlay services might save 108 million GBP in total, with 75 million GBP accruing to the higher education sector. The costs within this system include around 18 million GBP per annum to operate a national network of repositories within the higher education sector (22 million for the UK as a whole).
5.4 The economic return to the world’s R&D effort from Open Access Along with calculating costs and savings for the individual universities from a switch to Open Access, the model calculates another component of the economic picture: this is what Houghton calls ‘return to R&D’. In essence, this is the additional benefit that the world’s research effort would enjoy if Open Access prevails. The methodology for arriving at this increase in return to R&D was developed by Houghton and his colleagues and is explained in detail in Houghton (2006), Houghton & Sheehan (2006) and Houghton et al (2009). The work builds on the classic Solow-Swan econometric model and introduces as friction variables into that model the elements of accessibility and efficiency, exploring their effect on research expenditure. This modelling asks, in effect, what the impact of alternative scholarly publishing models might have on the accessibility and efficiency of use of research information. The estimates that it calculates are the impact of one year’s R&D spending, lagged and discounted and expressed in terms of Net Present Value (NPV) in GBP (British Pounds) over 20 years of a transition. For the former, accessibility, this is about looking at the proportion of research information currently available to researchers, comparing it to the proportion that would be available under new publishing models and developing measures of impact of each on research. For the latter, efficiency, it is about examining where efficiencies might be gained in the system from Open Access, such as less chance of duplicative research, shorter delays in accessing research information, better support for interdisciplinary research and so forth.
33
The aim is to model the level of benefit to the research community of Open Access in terms of the efficiency of the overall process. This ‘return to R&D’ element is not to be confused with another element that is included in the modelling, ‘return to research’. That is entirely separate and is the value in monetary terms of the time savings for researchers in a single institution that Open Access can bring – savings in time spent finding information for reading purposes, when writing articles, when peer reviewing articles and so on. The two elements can be summarised thus: Return to R&D: a saving for the research community as a whole (including to funders, institutions and researchers) described in monetary terms, arising from better accessibility of research information; savings derive from less duplication, reducing plagiarism, greater overall accessibility, facilitation of interdisciplinary research, etc. Return to research: a saving for the entity that is the focus of modelling (in this case an individual university, but it may also be a nation, department, etc), described in monetary terms, arising from easier search and discovery of information, less onerous permissions procedures, easier access to information for carrying out peer review, writing and reading, and for research reporting and management, that Open Access brings). The return to research enjoyed from Open Access is included in the modelling of the benefits of Open Access to universities in Section 6 of this report. Here, we focus on the increase in return to R&D brought by Open Access. The Houghton model calculates this increase in return to R&D for each entity (university), but it is important to remember that although the value is university-specific, the return is to the worldwide research community. It is, in effect, a contribution made by each university in an Open Access world to the better working of research across that world, and it can be quantified in monetary terms. The UK’s universities have recently been asked by Government to begin the process of demonstrating greater value to society, including by engaging the business community and encouraging collaborative research9. Return to R&D is a cash measure of some of that type of value – a university’s contribution to improving the way research works. The values of the increase in return to R&D element of the modelling are shown in Table 10 and in the chart in Figure 2.
University A University B University C University D
Increase in return to R&D 26,380 136,305 1,012,824 2,836,617
Table 10: Increase in return to R&D from Open Access per annum (GBP)
Figure 2: Increase in return to R&D from Open Access per annum (GBP)
0
500,000
1,000,000
1,500,000
2,000,000
2,500,000
3,000,000
University A
University B
University C
University D
35
6. ECONOMIC BENEFITS FROM OPEN ACCESS: COMMUNICATION SYSTEM COSTS AND SAVINGS FOR INDIVIDUAL UNIVERSITIES
Using Houghton’s model we calculated potential savings for the individual universities in the study.
6.1 Subscription savings from Open Access In an all-Open Access world, the universities studied would save around from 0.53 million to 3.38 million GBP per annum in journal subscriptions by being able to access for free all the journals to which they currently subscribe.
University A University B University C University D
Table 11: Subscription savings from Open Access per annum (GBP)
Figure 3: Subscription savings from Open Access per annum (GBP)
6.2 Library handling savings from Open Access Library handling savings are the savings accruing from the library being freed of the tasks associated with subscription journals (negotiating prices, etc). There would remain a library handling cost incurred in carrying out tasks in the library that would still be necessary in an Open Access world (linking, cataloguing, helpdesk, etc). There may also be additional savings, not shown here, from a reduction in the use of copyright clearance services.
0
500,000
1,000,000
1,500,000
2,000,000
2,500,000
3,000,000
3,500,000
4,000,000
University A
University B
University C
University D
36
University A University B University C University D
Table 12: Library handling savings from Open Access per annum (GBP)
Figure 4: Library handling savings from Open Access per annum (GBP)
6.3 Library handling savings from a shift to electronic-only journals Library handling costs for the current mix in the case study universities are shown in the previous section. If all journals are published electronically and the libraries cease to handle print journals at all, the handling cost will be reduced to the values shown in the table below.
University A University B University C University D
Table 13: Library handling savings from all-electronic journals per annum (GBP)
0
100,000
200,000
300,000
400,000
500,000
600,000
University A
University B
University C
University D
37
Figure 5: Library handling savings from all-electronic journals per annum (GBP)
6.4 Publishing system savings from Open Access relative to individual universities Publishing system savings are those that accrue from differences in publisher costs with different publishing models. Houghton’s figures for the total system costs for different Open Access models are given in Table 9. At these costs, Open Access journal publishing would be around 813 GBP per article cheaper than subscription publishing; Open Access self-archiving with full overlay services would be around 1,177 GBP per article cheaper than subscription publishing. The savings for publishers, relating to each university, are shown in the table below.
University A University B University C University D
Shift from subscription publishing to Open Access journals
287,802 518,694 2,495,910 5,517,018
Shift from subscription publishing to Open Access via repositories with overlay publishing services
416,658 750,926 3.613,390 7,987,122
Table 14: Savings per annum for publishers from Open Access relative to each university (GBP)
0
20,000
40,000
60,000
80,000
100,000
120,000
140,000
160,000
180,000
200,000
University A
University B
University C
University D
38
Figure 6: Savings for publishers from Open Access relative to each university (per annum,
GBP)
6.5 Research system savings for universities from Open Access Research system savings in universities from Open Access are those that accrue from subscription savings, library handling savings, inter-library article purchase savings and savings accruing to researchers from easier access to journal articles for the purposes of reading, writing and peer reviewing. The total research system savings for the universities are shown in the table below.
University A University B University C University D
Research system savings 803,374 2,019,399 3,317,168 5,094,400
Table 15: Research system savings from Open Access per annum (GBP)
0
1,000,000
2,000,000
3,000,000
4,000,000
5,000,000
6,000,000
7,000,000
8,000,000
9,000,000
Open Access via Open Access journals
Open Access via repositories with overlay services
University A
University B
University C
University D
39
Figure 7: Research system savings from Open Access per annum (GBP)
6.6 Savings for research for universities from Open Access Savings for research arise from time saving across a range of activities, such as easier search and more efficient discovery and access of research information, less time spent on seeking permissions and in copyright and licensing-related activities, and more efficient peer review, reading and writing processes as a result of improved access. The figures for these savings are shown in the table below.
University A University B University C University D
Savings for research 120,049 205,291 994,929 1,419,950
Table 16: Savings for research from Open Access per annum (GBP)
0
1,000,000
2,000,000
3,000,000
4,000,000
5,000,000
6,000,000
University A
University B
University C
University D
40
Figure 8: Savings for research from Open Access per annum (GBP)
0
200,000
400,000
600,000
800,000
1,000,000
1,200,000
1,400,000
1,600,000
University A
University B
University C
University D
41
7. ECONOMIC BENEFITS FROM OPEN ACCESS: COSTS AND SAVINGS FOR UNIVERSITIES FROM SHIFTS TO OPEN ACCESS
7.1 Savings for universities from Open Access via repositories (‘Green’ Open Access) If Open Access were to be achieved by the alternative route, that is, by the self-archiving of articles into institutional repositories, system cost savings could also accrue. System costs for the universities relating to the repository route to Open Access are shown in Table 10. We have modelled repository-mediated Open Access under several different cost conditions:
where the overlay service cost is 1,127 GBP per article: this is the figure derived by Houghton and colleagues summing the cost of peer review management (not peer review itself), editorial , proofing and production activities
where the overlay service cost per article is less than this: we modelled the cost of overlay services for each repository when the cost is 500, 750 and 1,000 GBP per article. We did this in order to match the same conditions as for OA journal publishing, where modelling was done for article-processing charges of 3,000 GBP, 2,000 GBP, 1,500 GBP, 750 GBP and 500 GBP. It is appropriate to surmise that overlay service providers might face a competitive market situation which would tend to maintain service prices at reasonable levels and that these services could be provided at least as cheaply as Open Access journals can provide them. Currently, actual charges from Open Access journal publishers range from around 300 GBP to 3000 GBP per article, with publishers charging fees at the lower end of that range operating apparently viable and stable businesses.
Cost element University A University B University C University D
Self-archiving (depositing) cost per item
15.38 6.47 12.62 11.09
Self-archiving (depositing) cost per annum
5,444 4,131 38,754 75,260
Overlay service cost per annum @ 1127 GBP per article
398,958 719,026 3,459,890 7,647,822
Overlay service cost per annum @ 1000 GBP per article
345,000 638,000 3,070,000 6,786,000
Overlay service cost per annum @ 750 GBP per article
265,500 478,500 2,302,500 5,089,500
42
Overlay service cost per annum @ 500 GBP per article
177,000 319,000 1,525,000 3,393,000
Cost of repository operation per annum (not including depositing direct costs)
20,822 45,698 170,154 42,719
Total cost of repository operation per annum (including depositing direct costs)
26,266 49,829 208,908 117,979
Table 17: System costs for the universities for Open Access via repositories (GBP) There are two possible scenarios under this model. 7.1.1 Open Access repositories with parallel subscription publishing The first scenario is that articles are deposited in repositories (when the authors do this task the process is known as ‘self-archiving’) and published in parallel in subscription journals. This is the current practice, where repositories collect the peer-reviewed ‘postprints’ from authors and make them Open Access while the articles are published in parallel in the traditional way in a toll-access journal. In this case, the universities bear the cost of operating an Open Access repository and purchasing subscription journals. Publishers bear the cost of carrying out publisher-related tasks, and then sell the resulting journals to universities. Calculation of the savings that can accrue from Open Access provision via repositories while a parallel system of subscription journal publishing persists alongside is shown in Box 8. Some of these values are derived by using sub-models within the Houghton Model and others are examples of those that need to be collected from trusted sources.
43
Box 7: How to calculate the annual savings from Open Access via repositories with parallel
subscription publishing A shift to this form of Open Access would provide system savings for the universities each year in an Open Access world even if there were no subscription cancellations (i.e. this is a system of parallel Open Access and traditional subscription journal publishing). These savings include library handling savings, inter-library article purchase savings and the research saving that accrues from Open Access (easier access to articles streamlines reading, writing and peer review activities for researchers). There may also be additional savings, not shown here, from a reduction in the use of copyright clearance services. Moreover, universities may save further costs where some articles are collected and made Open Access by third-party repositories.
University A University B University C University D
Savings from Open Access via repositories with parallel subscription publishing
106,783 163,765 822,039 1,317,832
Table 18: Savings for universities from Open Access via repositories with a parallel subscription-based journals system (GBP per annum)
Calculation of the savings from Open Access via repositories with parallel subscription publishing
Value A = the sum of the following:
Inter-library lending cost per annum* Saving for research per annum**
Value B = Annual cost of operating the repository (annual repository cost plus the cost of deposit) Savings per annum = Value A – Value B *Collected from trusted sources **Calculated by using the Research Activity sub-model (see Section 3.3)
44
Figure 9: Savings per annum for universities from Open Access via repositories with a
parallel subscription-based journals system (GBP) 7.1.2 Open Access repositories with overlay publishing services The second scenario is where repositories collect articles from authors prior to peer review (‘preprints’) and service providers carry out the ‘overlay’ tasks that the research community deems necessary (for example, peer review management, editing and proofing) so that the resulting quality-controlled articles can be published, in Open Access form. Publication may be a simple case of giving the articles a stamp of quality (‘peer reviewed’) and then exposing them on the Web from the repository in which they were collected, or publication may be by collecting the articles into branded bundles (i.e. journals) and publishing them in that form. These journals would levy no further charges, but would make their content openly accessible on the Web. The former option avoids the issue of content residing on a number of separate and different publisher or publisher-service platforms: since repositories are indexed by all the major Web search engines, plus some more specialised academic search engines, finding Open Access content from repositories is simple and already part of the workflow of academic researchers, students and other Web users. Houghton’s calculation for the level of overlay service charge includes margins for investment and profit. Houghton and colleagues calculated the cost of such overlay services at around 1,127 GBP per article. This figure rises to around 1,260 GBP per article if hosting is included, but under this model the university repository hosts the article so that cost element can be deducted from the overlay service cost. Here, we have modelled using different levels of overlay service charge. At present this is a mainly speculative option, though it is at work in the high energy physics community where some scholarly society publishers use the subject-based Open Access
0
200,000
400,000
600,000
800,000
1,000,000
1,200,000
1,400,000
University A
University B
University C
University D
45
repository, arXiv, as a locus for submission, collecting preprints from arXiv once alerted by the authors that they are ready for publication, and taking them through the peer review process and consequent activities. It is also at work for individual journals published from within institutions, where the repository can act as a convenient collecting place for preprints. It is important to remember that future overlay service provision might come from existing publishers, such as the society publishers referred to above, or from new entrants. The latter might include within-academy actors or other service providers who could carry out such activities at a lower cost, or with a lower profit margin requirement, than existing commercial publishers. There is scope, therefore, for driving value into the system by these means. Calculation of the savings from provision of Open Access via repositories with overlaid publishing services is shown in Box 9. Some of these values are derived by using sub-models within the Houghton Model and others are examples of those that need to be collected from trusted sources.
Box 8: How to calculate the annual savings from Open Access via repositories with overlaid
publishing services Open Access via repositories plus overlay services could produce savings for the universities depending on the level of overlay service charge. There would be savings in journal subscription costs, along with the library handling savings, inter-library article purchase savings and research savings that come with Open Access. There may also be additional savings, not shown here, from a reduction in the use of copyright clearance services.
Calculation of the savings from Open Access via repositories with overlaid publishing services
Value A = the sum of the following, which are elements that would be saved with Open Access:
Cost of journal subscriptions per annum* Inter-library lending cost per annum* Library handling saving per annum** Saving for research per annum***
Value B = the sum of the following:
Annual operating cost of the repository**** Annual cost of depositing articles**** Annual cost of overlay services (calculated using relevant overlay service cost)
Savings per annum = Value A – Value B *Collected from trusted sources **Calculated by using the Library Handling Costs and Savings sub-model (see Section 3.2) ***Calculated by using the Research Activity sub-model (see Section 3.2) ****Calculated by using the Self-Archiving Impacts sub-model (see Section 3.5)
46
University A University B University C University D
Savings from Open Access repositories plus overlay publishing services charging 1,127 GBP per article
378,150 1,250,544 -351,630 -2,671,401
Savings from Open Access repositories plus overlay publishing services charging 1,000 GBP per article
423,108 1,331,570 38,260 -1,809,579
Savings from Open Access repositories plus overlay publishing services charging 750 GBP per article
511,608 1,491,070 805,760 -113,079
Savings from Open Access repositories plus overlay publishing services charging 500 GBP per article
600,108 1,650,570 1,538,260 1,583421
Table 19: Savings per annum from Open Access via repositories with overlay publishing services (GBP)
7.2 Savings for universities from moving to publishing in Open Access journals (‘Gold’ Open Access) Calculation of the savings that can result from publishing in Open Access journals is carried out as shown in Box 7. Some of these values are derived by using sub-models within the Houghton Model and others are examples of those that need to be collected from trusted sources.
47
Box 9: How to calculate the annual savings from publishing in Open Access journals
The outcomes for the universities from publishing in Open Access journals are shown in the table below. Negative figures indicate that a university would face extra costs rather than savings.
Publishing model University A University B University C University D
Open Access via Open Access journals charging an article-processing fee of 3,000 GBP
-267,476 -89,449 -5,969,582 -15,433,350
Open Access via Open Access journals charging an article-processing fee of 2,000 GBP
86,524 727,449 -2,899,582 -8,647,250
Open Access via Open Access journals charging an article-processing fee of 1,500 GBP
263,524 1,046,449 -1,364,582 -5,254,2500
Open Access via Open Access journals charging an article-processing fee of 1,000 GBP
440,524 1,365,449 170,418 -1,861,250
Open Access via Open Access journals charging
529,024* 1,524,949* 937,918* -164,750*
Calculation of the savings from publishing in Open Access journals Value A = the sum of the following:
Cost of journal subscriptions per annum* Inter-library lending cost per annum* Library handling saving per annum** Saving for research per annum***
Value B = Cost of article-processing charges per annum (using the desired APC level) Savings per annum = Value A – Value B *Collected from trusted sources **Calculated by using the Library Handling Costs and Savings sub-model (see Section 3.2) ***Calculated by using the Research Activity sub-model (see Section 3.3)
48
an article-processing fee of 750 GBP* Open Access via Open Access journals charging an article-processing fee of 500 GBP
617,524 1,684,449 1,705,418 1,531,750
Table 20: Outcomes for the universities from publishing in Open Access journals (GBP per annum)
(Negative figures denote extra costs that would be incurred rather than savings) *Note: because only around half of Open Access journals currently charge an article-processing fee, and because the average fee is around 1,500, this figure actually models the present situation with respect to the costs associated with publishing in existing Open Access journals
7.3 Summary of major costs and savings for the universities from alternative scholarly publishing models Data for all the universities are shown in the table below and graphically in Figure 10. Positive figures in the table represent savings; negative figures are additional costs that universities would face from a particular model.
Publishing model University A University B University C University D
Open Access via repositories, with parallel publishing in subscription journals
106,783 163,765 822,039 1,317,832
Open Access via repositories, with overlay services providing publishing services on repository content at 1,127 GBP per article
378,150 1,250,544 -351,630 -2,671,401
Open Access via repositories, with overlay services providing publishing services on repository content at 1,000 GBP per article
423,108 1,331,570 38,260 -1,809,579
Open Access via repositories, with overlay services providing publishing services on repository content at 750 GBP per article
511,608 1,491,070 805,760 -113,079
Open Access via repositories, with overlay services providing publishing services on repository content at 500 GBP per article
600,108 1,650,570 1,538,260 1,583421
Open Access via Open Access journals charging an article-
-267,476 -89,449 -5,969,582 -15,433,350
49
processing fee of 3,000 GBP Open Access via Open Access journals charging an article-processing fee of 2,000 GBP
86,524 727,449 -2,899,582 -8,647,250
Open Access via Open Access journals charging an article-processing fee of 1,500 GBP
263,524 1,046,449 -1,364,582 -5,254,2500
Open Access via Open Access journals charging an article-processing fee of 1,000 GBP
440,524 1,365,449 170,418 -1,861,250
Open Access via Open Access journals charging an article-processing fee of 750 GBP*
529,024* 1,524,949* 937,918* -164,750*
Open Access via Open Access journals charging an article-processing fee of 500 GBP
617,524 1,684,449 1,705,418 1,531,750
Table 21: Savings per annum for the universities from different Open Access publishing models (GBP)
(Negative figures denote extra costs that would be incurred rather than savings) *Note: because only around half of Open Access journals currently charge an article-processing fee, and because the average fee is around 1,500, this figure actually models the present situation with respect to the costs associated with publishing in existing Open Access journals
In some cases, alternative models work out more costly in economic terms than the current situation. At higher levels of APC (article-processing fee), publishing in Open Access journals works out more expensive, even for small universities, than the current subscription-based system. The largest universities, with high levels of research output, would incur costs greater than those of the current subscription-based system for this form of Open Access at all but the lowest-level APCs, and for Open Access via repositories with overlay services. Of the universities in this study, the second-largest university would pay more under a system of publishing in Open Access journals where APCs are approximately 1100 GBP or more: Open Access via repositories with overlay services would cost this university 0.35 million GBP per annum more. The very large university (University D) would pay more for publishing via an Open Access journal system unless APCs were below 700 GBP each and it would find Open Access via repositories plus overlay services more costly than the present subscription-based system.
7.4 Summary of all costs and benefits to universities from alternative publishing models All the main costs and benefits to the universities in this study are summarised in Table 21 (which expands on the data in Table 20 above) and Figure 12 to give an at-a-glance picture.
50
Potential cost savings are shaded green: potential new, additional costs are shaded red. Figures are in GBP per annum unless otherwise stated.
49
Figure 10: Savings per annum for the universities from different publishing models (GBP)
-18,000,000
-16,000,000
-14,000,000
-12,000,000
-10,000,000
-8,000,000
-6,000,000
-4,000,000
-2,000,000
0
2,000,000
4,000,000
University A University B University C University D
OA journals (APC= 3000 GBP)
OA journals (APC=2000 GBP)
Gold OA APC=1500 GBP)
OA journals (APC=1000 GBP)
OA journals (APC=750 GBP)
OA journals (APC=500 GBP)
OA repositories with parallel subscription-based journals
OA repositories with overlay publishing services at 500 GBP per articleOA repositories with overlay publishing services at 750 GBP per articleOA repositories with overlay publishing services at 1000 GBP per articleOA repositories with overlay publishing services at 1127 GBP per article
50
Model/parameter University A University B University C University D
Total scholarly communication system costs per annum 4,852,125 10,667,526 52,192,498 103,644,348 Journal subscription costs 537,067 1,236,656 1,889,640 3,382,000 Library handling costs, subscription-based system: current mix of formats 213,994 580,735 516,360 457,333 Library handling costs, subscription-based system: all journals electronic-only 183,222 493,239 339,738 291,256 Library handling savings in an all-electronic journals world 30,772 87,496 176,622 166,077 Library handling savings from Open Access 133,258 569,149 396,581 276,589 Via Open Access journals charging an article-processing fee of 3,000 GBP -267,476 -89,449 -5,969,582 -15,433,250 Via Open Access journals charging an article-processing fee of 2,000 GBP 86,524 727,449 -2,899,582 -8,647,250 Via Open Access journals charging an article-processing fee of 1,500 GBP 263,524 1,046,449 -1,364,582 -5,254,250 Via Open Access journals charging an article-processing fee of 1,000 GBP 440,524 1,365,449 170,418 -1,861,250 Via Open Access journals charging an article-processing fee of 750 GBP 529,024 1,524,949 937,918 -164,750 Via Open Access journals charging an article-processing fee of 500 GBP 617,524 1,684,449 1,705,418 1,531,750 Repository costs (total, including deposit costs) 26,266 49,829 208,908 117,979 Savings from Open Access via repositories, with parallel publishing in subscription journals 106,783 163,765 822,039 1,317,832 Savings from Open Access via repositories, with overlay services providing publishing services on repository content at a cost of 1,127 GBP per article
378,150 1,250,544 -351,630 -2,671,401
Savings from Open Access via repositories, with overlay services providing publishing services on repository content at a cost of 1,000 GBP per article
423,108 1,331,570 38,260 -1,809,579
Savings from Open Access via repositories, with overlay services providing publishing services on repository content at a cost of 750 GBP per article
511,608 1,491,070 805,760 -113,079
Savings from Open Access via repositories, with overlay services providing publishing services on repository content at a cost of 500 GBP per article
600,108 1,650,570 1,583,260 1,583,421
Research system savings 803,374 2,019,399 3,317,168 5,094,400 Return to research within the institution 120,049 205,291 994,929 1,419,950 Return to R&D 26,380 136,305 1,012,824 2,836,617
Table 22: Summary of all major benefits to the universities from a shift to Open Access
51
8. VISIBILITY AND IMPACT BENEFITS FROM OPEN ACCESS As well as potential cost savings, Open Access has another benefit for universities in enhanced visibility and impact for their research outputs. The modelling reported so far has applied to a set of conditions where the assumption is that there is global Open Access; in other words, that all research outputs are openly available. The costs and benefits reported are therefore conditional upon this situation prevailing – and we are not there yet. This next section of the modelling addresses possibilities for universities within conditions that already pertain. Individual universities can gain these benefits by unilateral moves to Open Access, without the need for the rest of the research community to do so as well. Indeed, the most marked gains here are for those universities that are in the vanguard, since some – but not all – of the advantages to be enjoyed will diminish in an all-Open Access world.
8.1 Visibility and usage benefits from Open Access The increased visibility that Open Access provides for research articles translates into a high level of usage, measured by the number of downloads from repositories or from publishers’ websites wherever articles are provided through these websites in an openly accessible way. For example, the American Society of Limnology & Oceanography reports that download figures for articles in the Society’s journals are four times higher when openly accessible than when available only to subscribers10. Data on usage of articles from repositories, which provide access for those who do not have subscription-access, would appear to support this. The approximately 7200 items in the repository at the School of Electronics & Computer Science at the University of Southampton that are full-text or are conference contributions see a download rate of about 30,000 downloads per month. The most-downloaded articles in Queensland University of Technology’s repository are enjoying tens of thousands of downloads in total over a few years, and thousands per year11. Such usage is supplemental to that from journal websites, which are used by those who have subscription-access to the journals: it may, indeed, well outstrip usage through subscription-access given the high numbers of downloads seen for Open Access articles, though this remains a supposition because data on the usage of individual journal articles from publisher websites is hard to come by. Usage in terms of downloads (and, presumably, consequent readings) of articles is not, however, a common measure of research impact or performance. That is the domain of citations. There is certainly some evidence being derived on the predictive value of downloads, though: that is, that download numbers correlate in a predictable way with later citations (Perneger, 2004; Brody et al, 2006; Bollen et al, 2005, 2008, 2009; Watson, 2007; O’Leary, 2008; Lokker et al, 2008; Watson, 2009). It follows that the increased usage that Open Access can bring to articles should result in increased impact in terms of citations. What does this mean in economic terms for universities?
8.2 Impact benefits from Open Access Evidence is accumulating that shows such enhanced impact in terms of more citations to articles that are Open Access than to articles that remain behind toll (subscription) barriers. There is a growing literature on this issue and whilst most studies confirm a citation advantage with Open Access, some do not. This is something that should be reviewed and summarised and we do this, but in order to retain the focus of this report the review of these studies can be found in an accompanying paper (Swan, 2010) for those who wish to learn more about this issue. For the modelling that follows in this section there is an assumption that Open Access does enhance impact and that this is manifest in the form of increased citations to work that is openly accessible. The levels of enhancement of impact from Open Access that have been found vary between studies (because of methodological differences) and between disciplines (because of different disciplinary citing behaviours). Enhancements in citation counts found in these studies vary from 17% to 250%. We therefore took a cautious approach and modelled the economic effects of a 25% and a 50% enhancement of citation impact from Open Access. To do this we obtained figures from the Web of Science for the average citations per article for the participating universities. We had already collected the average number of articles published per year from each university: this, multiplied by the average citation count for that institution, produced the number of citations on average accruing each year to each institution. Somewhere between 15% and 20% of research outputs are already Open Access: this is the current baseline figure (Hajjem et al, 2005; Björk et al, 2008; Gargouri et al, 2010), so using the conservative end of that range this means that around 15% of articles are already gathering the extra citations that Open Access can bring. This is factored into the calculation that follows. We then modelled the 25% and 50% increase in citations per year in economic terms in the following way for each university:
Average annual citations to articles = X
An increase of 25% in citations means the annual average citation count = Y12
An increase of 50% in citations means the average annual citation count = Z13
Annual research funding = A GBP (producing X citations)
Annual research funding per citation = A/X GBP
Annual research funding needed to produce Y citations with toll-access = B GBP
University X would need to increase its research effort (funding) by C GBP to produce the annual citation count that Open Access delivers
12
Y equals X multiplied by 1.2125, rather than 1.25, to take the baseline 15% existing Open Access literature into account 13
Z equals X multiplied by 1.425, rather than 1.50, to take the baseline 15% existing Open Access literature into account
53
This calculation is made for the participating universities and the results are shown in Table 22 and Figure 13.
University A University B University C University D
Citations to journal article outputs from 2007
716 2,743 13,618 44,153
Citations expected from Open Access at 25% increase (Y)
868 3,326 16,512 53,536
Citations expected from Open Access at 50% increase (Z)
1,020 3,9095 19,406 62,918
Annual research funding (GBP)
1,736,294 8,971,282 66,661,601 186,699,142
Annual research funding per citation (GBP)
2,425 3,271 4,895 4,228
Annual research funding needed to produce 25% increase in citations
2,105,256 10,877,679 80,827,191 226,372,710
The value of the ‘Open Access Bonus’: the value of the extra citations that Open Access can bring (i.e. the extra annual research funding needed to produce a 25% increase in citations without Open Access)
368,962 1,906,397 14,165,590 39,673,568
Annual research funding needed to produce 50% increase in citations
2,474,219 12,784,077 94,992,781 266,046,277
The value of the ‘Open Access Bonus’: the value of the extra citations that Open Access can bring (i.e. the extra annual research funding needed to produce a 50% increase in citations without Open Access)
737,925 3,812,795 28,331,180 79,347,135
Table 23: Increase in research funding needed in a subscription-access world to deliver the citation impact that Open Access delivers
54
Figure 11: Additional research funding needed per annum to realise the increased citation
impact that Open Access can bring (modelled for increased impact of 25% and 50%)
0
10
20
30
40
50
60
70
80
90
University A University B University C University D
Extra research funding per annum needed to deliver 25% more citation impact ('The Open Access bonus')
Extra research funding per annum needed to deliver 50% more citation impact ('The Open Access bonus')
mill
ion
s G
BP
55
9. DISCUSSION: THE BENEFITS TO UNIVERSITIES OF MOVING TO OPEN ACCESS
This study has modelled the economic outcomes from moving to alternative models of scholarly communication for a range of UK universities. It has looked at the outcomes of moving to a situation where all journals are delivered electronically and of moving to three possible Open Access models – maintaining the current system of subscription journals while simultaneously providing Open Access to all research outputs via Open Access repositories; providing Open Access through repositories with a publishing service system overlaid upon those; and publishing in Open Access journals. Houghton’s findings for the UK as a whole (Houghton et al, 2009a) were that there are overall cost savings to be gained for the nation from a move to Open Access by any model. Moreover, the savings that could be made would offset the cost of switching. The overall findings from the study reported here show that individual UK universities, too, can enjoy considerable economic benefits from shifts to alternative publishing models, but that under some conditions some universities would find these alternatives more expensive than the current situation. In other words, if the current system, based on paying for access to bundles of articles, is replaced by any system based on paying to produce individual articles, there can be economic benefits for all individual universities, but only under the right conditions. For all universities studied, Open Access can provide economic savings when the unit costs of alternative systems (unit costs being article processing charges for Open Access journals and overlay service costs for a repository-plus-overlay-service system) are in the lower part of the relevant range. Some additional costs could be incurred, however, particularly by the more research-intensive institutions, if these unit charges fall in the upper part of the range. It follows, then, that the implications for some universities may be challenging, though it should be stressed that major challenges would apply only to a small minority of institutions. But with national economic savings to be made from Open Access, and with unequivocal economic benefits for the majority of individual institutions, the higher education sector as a whole in the UK will need to work out how to make the transitions needed without disadvantaging the few. The implications of the study for universities fall into two main categories – policy and practice. With respect to policy, there is already much progress within the UK’s HE sector. Already, 16 university mandatory policies on Open Access have been implemented (supported by a further 14 from the Research Councils, the major biomedical research charities and other research funders). The rate of growth of these institutional policies is increasing: one was implemented in 2007, four in 2008, seven in 2009 and four in the first seven weeks of 2010. The reason for this growth is that the visibility and impact benefits that Open Access brings to universities are already being appreciated strongly at senior managerial levels. The reason for the mandatory nature of the policies is that they serve to emphasise the importance to
56
the institution of Open Access and that it is critical that all researchers within a university play their part in maximising the outreach of research effort. An economic argument for Open Access lends additional weight to the impetus to move in that direction. On a practice level, universities will need to consider implementing new budgetary arrangements to accommodate the move to Open Access. For some universities, the option of paying article-processing charges for publishing outputs in Open Access journals has already been taken up and special funds have been earmarked for this purpose. Research funders, including the Research Councils and the Wellcome Trust, have also established positions on this issue and in many cases will provide researchers they support with the required funds to pay these costs, thus relieving some of the financial burden on universities. There are potential advantages for universities in seeking engagement with the JISC on these issues: exploring how JISC Collections might be involved, perhaps with a shared service approach, may be a fruitful avenue of enquiry. New work is also being commissioned at the time of writing by a consortium of sponsors, including the JISC, into looking further at the economic implications of new scholarly communication developments and exploring how transitions to these new models might occur in practice. Early leadership on Open Access from the UK’s Research Councils and other research funders, and forward-thinking by UK university managers, means that the UK already leads the world in driving change for the better in scholarly communication. It also means that our HE sector is well-placed to start addressing the challenges that this present study has identified. Below, issues relevant to the modelling outcomes from this study are briefly discussed.
9.1 Electronic journals While most libraries already receive the majority of the journals to which they subscribe in electronic format (the percentage received in hard-copy only is very small, around 12-15% on average), most of these are actually dual-mode (electronic plus a print version) subscriptions. Libraries vary in how much processing they do of the print version but to them all there is at least some cost in handling journals in print. Those libraries that shelve and preserve print journals incur considerable handling costs from doing so and even those that send print copies straight to long-term storage still bear a cost for this process. Librarians acknowledge that the day will come when their bought-in content is electronic-only and welcome the concept: what is stopping them discarding the print versions of journals at the moment is a nervousness about permanent access to back-files. If licensing and preservation arrangements can be satisfactorily concluded on these matters libraries will be able to move to almost completely electronic-only operations. As our modelling has shown, this will bring some new savings to library operations, savings that can amount to 5-10% of the total cost of journal subscriptions. This transition will be further studied in work currently being commissioned by a consortium of funders that includes the JISC and the Research Information Network.
57
9.2 Open Access via repositories Open Access via repositories with parallel publishing in subscription journals (that is, the situation that is currently developing as repositories are built and begin to fill with articles) would bring economic benefits for universities, the savings accruing from returns to research in terms of enhanced efficiency and to the library from simpler handling procedures and less time devoted to access issues. Assuming that the current situation prevails, which is that levels of self-archiving (depositing in repositories) increase with the growth of mandatory policies from institutions and funders, and that subscriptions to journals continue, universities should enjoy economic benefits and publishers should enjoy continued revenue. Publishers argue that as repositories collect and disseminate more and more Open Access content subscriptions will decline. Though this is a legitimate fear, it remains conjecture at the moment: there is no evidence from the relevant publishers of attrition in subscriptions despite the entire contents of some of their journals being available in parallel for free in the arXiv Open Access repository for 15 years or so (Swan, 2005). General subscription attrition levels across all journals have continued through the last 2-3 decades at a rate of about 3-5% per annum but this has been due mainly to library budgets being unable to keep pace with increasing subscription prices and not as a result of Open Access. Moreover, Open Access content is collecting in repositories in an anarchical way dependent upon institutions, funders and authors enacting Open Access practices, so the likelihood of the entire contents of any particular subscription journal being available through institutional repositories is extremely low. This situation will prevail unless every university and funder in the world introduces an Open Access policy for its research outputs, or until all researchers themselves adopt new Open Access practices, to ensure that everything that is published appears in an Open Access repository. This is at present a most futuristic scenario. We can conclude that libraries will not be cancelling subscriptions in the foreseeable future because the entire contents of the world’s journals can be reliably found through Open Access channels: this is a simply unrealistic expectation, and so we can expect subscription-access to continue for some time (alongside a growing corpus of Open Access content in repositories). Nonetheless, if an increasing amount of material available in Open Access does eventually begin to impact on subscriptions, publishers will need to respond to this changing business environment. There are a number of repository-facilitated Open Access options available to them, assuming the sector remains sufficiently attractive for them to wish to continue doing business in it. These options fall into two generic categories – upping the value that publishers add so that customers are prepared to keep paying for the product, or trimming costs and overheads and delivering a version of their service that the repositories-plus-overlay services model represents. This overlay services model is currently largely theoretical, though there are some academy-based journals published through repositories and some examples of society publishers
58
using the arXiv as a submission tool for articles in high-energy physics and related fields. Two JISC-funded projects have also begun exploring the feasibility of such a system14, 15
(Brown, 2010). And repository software suppliers are seeing a number of enquiries from societies and individuals within the research community about using repositories as technical platforms for the publication of journals. It is of note here that Open Access journal publishing software, such as the popular Open Journals Systems, is often used alongside repositories in a complementary way, to produce Open Access journals from repository content. In all, there is growing interest in this area as a possible infrastructural foundation for scholarly communication. There is also the issue of whether the future of scholarly dissemination even has something recognisable as a ‘journal’ in the picture: aggregating Open Access content, if subject-based views on the literature are useful for researchers, may be done at a different level in the future. The role of the journal as a navigational aid is also important, though this function may also be integrated into new systems in new ways. Future direction will be determined by the way thinking on quality, trust and research assessment develops in the academic community. Our modelling was done using a range of ‘overlay service’ costs (akin to an Open Access journal article-processing charge). One possible level of charge, calculated by Houghton as a basis for his group’s modelling and based on known costs of various elements of the publishing service process, is 1,127 GBP per article. Overlay service charges may, however, be subject to downward pressure in a properly competitive market, so that overlay service providers look for ways of reducing them – less effort spent on formatting and branding, perhaps. Such a situation would distil overlay services for research articles to a basic level which would include peer review management and editing but perhaps little else: certainly it would reveal what the research community really requires as core elements in a dissemination system. To reach a situation where this kind of publishing system prevails, there needs to be a ‘flipping’ process similar to that discussed for Open Access journal publishing in section 8.3 below.
9.3 Open Access journals Savings through publishing in Open Access journals are dependent upon the level of APC (article-processing charge). With APCs of 750 GBP or less (the current average is around 1,500 GBP) there are savings to be made by most of the universities studied and almost certainly by most of the universities in the UK. If APCs are higher than this on average, then universities with more intensive research programmes may find that new costs outweigh the savings to be made from the simpler handling processes in libraries and a more streamlined research process that Open Access brings. 14
RIOJA Project (Repository Interface for Overlaid Journal Archives): http://www.ucl.ac.uk/ls/rioja/ 15
OJIMS (Overlay Journals Infrastructure for Meteorological Sciences): http://www.jisc.ac.uk/whatwedo/programmes/reppres/sue/ojims.aspx
We estimate that at APCs of 2000 GBP even the smallest of UK universities would probably find the system costs them more, not less, than at present. Given that there are examples of commercial publishers operating successfully and generating a satisfactory profit margin while levying an average APC of less than 400 GBP, though, moving to Open Access by publishing Open Access journals, so long as article-processing charges are kept at a reasonable level, would appear to be a viable model that the higher education sector in the UK could support with considerable economic benefit. Indeed, by helping to create a more a competitive publishing market, some think a move to this form of Open Access may serve to drive down scholarly communication costs on a global scale. It will certainly facilitate the connection of the producers and primary end users of research (researchers themselves), and research funders, more directly with the costs of communicating findings, something that has hitherto been somewhat obscure to these players as libraries have always intermediated and handled the financial aspects of the communication system. Our modelling shows that the largest universities may face increased costs at higher APC levels. Any scholarly communication system will have costs distributed across the Higher Education sector. This study has shown, based on the best evidence we have to date, how the redistribution of costs would look under a range of assumptions. Other assumptions may, of course, also be modelled, and readers of this report may like to undertake that exercise. Our modelling of a sectoral move to publishing in Open Access journals suggests that the most research-intensive universities (and probably research funders) would see costs redistributed in a way that means they pay relatively more, while other universities pay relatively less, compared to the present situation. There is no doubt that on a national scale Open Access by any means would be cheaper for the UK: Houghton et al (2009a) showed that on a national level in the UK the money currently spent on scholarly communication is sufficient to cover the costs of each alternative publishing model, with savings to be made in every case. There would, though, need to be some shifting around of money within the UK’s HE community to ensure that the largest universities do not face increased, actual costs. Nonetheless, our modelling indicates that if the per-article costs (article-processing charges) of Open Access journals are at the lower end of the current scale, even the largest universities are likely to save money through this alternative publishing model. It should also be noted that publishing costs are often paid for by research funders, who consider them to be a legitimate part of the cost of doing research, so the burden of financing the scholarly communication system need not be seen as one wholly for universities to bear. The challenge, therefore, is how to ‘flip’ the system over and move budgets around in universities, and also in the sector more generally, if Open Access journals were to be seen as the most appropriate publishing model for the future. Steps are already being taken to experiment with ways of doing this. A number of universities have established special central funds to pay APCs for Open Access journals (though some, notably the University of Amsterdam and the University of Liege, have now closed these schemes because of the high level of costs they were incurring through them and inflation of prices). Some Open Access journal publishers offer institutional membership schemes that lock up a certain amount of
60
money each year in membership ‘fee’, but entitle the researchers in those institutions to pay lower APCs when they have articles to publish. And a national-level arrangement between one publisher, Springer, and the universities in the Netherlands is underway where the publisher is paid an advance sum to enable a certain number of articles per year (1250) from authors associated with participating Dutch universities to be published in Open Access by Springer at no extra cost.16 Some other examples of experiments to ‘flip’ the system to Open Access journal publishing are SCOAP3 (Sponsoring Consortium for Open Access Publishing in Particle Physics17), an initiative by the particle physics community to provide funds up-front to pay publishers to make relevant journals completely Open Access, and COPE (Compact for Open Access Publishing Equity18), a scheme where participating universities commit to providing funds to pay Open Access publishing costs on behalf of authors who cannot obtain such funds from any other source. A detailed appraisal of possible mechanisms for ‘flipping’ is found in Suber (2007).
9.4 Societal gains For a move by all universities to Open Access models a mechanism would need to be found to assist the very largest universities, which would probably face increased costs. But the societal gain from Open Access in terms of the ‘return to R&D’ element (see section 5.4) contributes to the case for a UK-wide re-engineering of system costs. In the most basic terms, the return to R&D represents the difference between a university keeping research results behind toll-access barriers and revealing them to society at large. Societal gains here accrue economically not only to the research community itself, but to the relevant professional communities, the relevant practitioner communities and to the business and industrial communities, all of which could enjoy improved ways of working and may deliver better services and products back to society as a result. Modelling the benefits to these important communities should be a focus for future work. There are also non-economic gains for the lay community and potentially huge benefits (which also need to be measured by future work) for the education sector.
9.5 Coda The UK’s universities are now charged by Government to demonstrate their value to society, to develop more effective links with business and industry, to deliver graduates that are better equipped to fulfil roles in our increasingly technological world and to collaborate better with one other to produce world-class research in high-cost science areas. While many factors will play a part in developments around these things, Open Access has a role to play too, since they can all be enhanced by Open Access and are hindered by the toll-access system that persists today. The benefits of Open Access as a principle are unarguable. The money to pay for Open Access by any model is already in the Higher Education system in the UK (Houghton et al, 2009a). Not only is the money already there, but less of it would be needed: Houghton has also demonstrated that there are savings to be made nationally from a move to Open
Access. The gains for research and society are also plain, in economic terms and in terms of a general enhancement of the knowledge base. This study has modelled the likely economic outcomes for moving to Open Access for a representative range of universities and has demonstrated that there are economic benefits to be enjoyed at institutional level, too, if the right conditions are in place. For some institutions, though, there will be significant cost implications in some circumstances. The sector as a whole, mindful of the overall benefit to be gained, will need to begin thinking about how best to address the issues of transition. The challenge now for the UK HE community is to work out how to make the change.
62
References Björk B-C (2007) A model of scientific communication as a global distributed information system. Information research 12 (2) January. http://informationr.net/ir/12-2/paper307.html Björk B-C, Roos A and Lauri, M (2008) Global annual volume of peer reviewed scholarly articles and the share available via different open access options. In: Open Scholarship: Authority, Community, and Sustainability in the Age of Web 2.0 - Proceedings of the 12th International Conference on Electronic Publishing held in Toronto, Canada 25-27 June 2008 / Edited by: Leslie Chan and Susanna Mornati. ISBN 978-0-7727-6315-0, pp. 178-186 http://elpub.scix.net/cgi-bin/works/Show?_id=178_elpub2008 Bollen J, Van de Sompel H, Smith JA, and Luce R (2005). Toward Alternative Metrics of Journal Impact: A Comparison of Download and Citation Data. Information Processing and Management 41 (6): 1419-1440 http://citeseerx.ist.psu.edu/viewdoc/download?doi=10.1.1.100.8543&rep=rep1&type=url&i=0 Bollen J, van der Sompel H and Rodriguez M (2008) Towards Usage-based Impact Metrics: - First Results from the MESUR Project. Proceedings of the Joint Conference on Digital Libraries 2008 (JCDL08), June 16, 2008, Pittsburgh, Pennsylvania, USA http://arxiv.org/abs/0804.3791 Bollen J, Van de Sompel H, Hagberg A, Bettencourt L, Chute R, et al. (2009) Clickstream Data Yields High-Resolution Maps of Science. PLoS ONE 4(3): e4803. doi:10.1371/journal.pone.0004803 http://www.plosone.org/article/info:doi/10.1371/journal.pone.0004803 Brody T, Harnad S, and Carr L (2006). Earlier Web usage statistics as predictors of later citation impact. Journal of the American Society for Information Science and Technology, 57, 1060–1072. http://eprints.ecs.soton.ac.uk/10713/ Brown, J (2010) An introduction to overlay journals. Research report. Repositories Support Project, UK. (In press) http://eprints.ucl.ac.uk/19081/ CEPA (Cambridge Economic Policy Associates) (2008) Activities, costs and funding flows in the scholarly communications system in the UK: http://www.rin.ac.uk/costs-funding-flows Gargouri Y, Hajjem C, Lariviere V, Gingras Y, Brody T, Carr L and Harnad S. (2010) Self-Selected or Mandated, Open Access Increases Citation Impact for Higher Quality Research. PLoS ONE . (Submitted) http://eprints.ecs.soton.ac.uk/18346/ Hajjem C, Harnad S and Gingras Y. (2005) Ten-Year Cross-Disciplinary Comparison of the Growth of Open Access and How it Increases Research Citation Impact. IEEE Data Engineering Bulletin, 28 (4). pp. 39-47. http://eprints.ecs.soton.ac.uk/12906/
Houghton J et al (2008) Economic Implications of Alternative Scholarly Publishing Models: Exploring the costs and benefits. http://www.jisc.ac.uk/publications/documents/economicpublishingmodelsfinalreport.aspx Houghton, JW (2009) Costs and benefits of alternative publishing models: Denmark. Danish Electronic Research Library (DEFF), Copenhagen. http://www.deff.dk/content.aspx?itemguid={EACA73FB-2EFE-44CA-92CD-91C4416C0370} Houghton J, Rasmussen B and Sheehan S; with Oppenheim C, Morris A, Creaser C, Greenwood H, Summers M and Gourlay A. (2009a), Economic implications of Alternative Scholarly Publishing Models: Exploring the Costs and Benefits, JISC EI-ASPM Project, Report to the Joint Information Systems Committee (JISC) (UK), CSES and Loughborough University, January 2009. http://www.jisc.ac.uk/publications/documents/economicpublishingmodelsfinalreport.aspx Houghton, JW, de Jonge, J and van Oploo, M (2009b) Costs and benefits of research communication: the Dutch situation. SURF Foundation, Utrecht. http://www.surffoundation.nl/en/publicaties/Pages/CostsandBenefitsofOpenAccessPublicationlTheDutchSituation.aspx King, DW (2007) The cost of journal publishing: a literature review and commentary. Learned Publishing 20(2), April, pp 85-106. http://alpsp.publisher.ingentaconnect.com/content/alpsp/lp/2007/00000020/00000002/art00002 King, DW, Aerni, S, Brody, F, Herbison, M and Kohberger, P (2004) Comparative cost of the University of Pittsburgh electronic and print library collections. University of Pittsburgh, May 2004. Leo Waaijers, Bas Savenije and Michel Wesseling (2008) Copyright Angst, Lust for Prestige and Cost Control: What Institutions Can Do to Ease Open Access. Ariadne Issue 57. http://www.ariadne.ac.uk/issue57/waaijers-et-al/ Lokker, C, McKibbon, KA, McKinlay, RJ, Wilczynsji, NL and Haynes, R (2008) prediction of citation counts for clinical articles at two years using data available within three weeks of publication: retrospective cohort study. BMJ 336, pp 655-657. O’Leary, DE (2008) The relationship between citations and number of downloads. Decision Support Systems 45(4), November 2008, pp 972-980. OpCit Project: See the compendium of studies on the Open Access citation advantage collected by the Open Citation Project, OpCit: http://opcit.eprints.org/ Perneger, TV (2004). Relation between online “hit counts” and subsequent citations: Prospective study of research papers in the BMJ. BMJ, 329, 546–547. http://www.ncbi.nlm.nih.gov/pmc/articles/PMC516105/?tool=pubmed
Schonfeld, RC, King, DW, Okerson, A and Fenton, GE (2004) The non-subscription side of periodicals: changes in library operations and costs between print and electronic journals. Council on Library and Information Resources, Washington DC. Suber, P (2007) Flipping a journal to open access. SPARC Open Access Newsletter, Issue 114, 2 October 2007 http://www.earlham.edu/~peters/fos/newsletter/10-02-07.htm Swan, A (2005) Open Access self-archiving: an introduction. Technical report. http://eprints.ecs.soton.ac.uk/11006/ Swan, A (2010). The citation advantage from Open Access: the studies so far. Preprint available: http://eprints.ecs.soton.ac.uk/18516/ Tenopir, C and King, DW (2000) Towards electronic journals: realities for scientists, librarians and publishers. SLA Publishing, Washington DC. Tenopir, C and King, DW (2007) Perceptions of value and value beyond perceptions: measuring the quality and value of journal article readings. Serials 20 (3), pp 199-207. Walters, WH and Wilder, EI (2007) The Cost Implications of Open-access Publishing in the Life Sciences. BioScience 57(7):619-625. http://www.bioone.org/doi/full/10.1641/B570709 Waltham, M (2005) Learned society open access business models. Report for the JISC, June. http://www.jisc.ac.uk/whatwedo/topics/opentechnologies/openaccess/reports/learnedsociety.aspx Watson, A. B. (2007). Measuring demand for online articles at the Journal of Vision. Journal of Vision, 7(7):i, 1–3. doi:10.1167/7/7/i. http://journalofvision.org/7/7/i/ Watson, A. B. (2009). Comparing citations and downloads for individual articles. Journal of Vision, 9(4):i, 1-4. doi:10.1167/9.4.i http://www.journalofvision.org/9/4/i/