Modelling, simulation, and verification for detailed short-circuit analysis of a 1 × 25 kV railway traction system ISSN 1751-8687 Received on 11th April 2015 Revised on 12th October 2015 Accepted on 27th October 2015 doi: 10.1049/iet-gtd.2015.0501 www.ietdl.org Tsai-Hsiang Chen, Rih-Neng Liao ✉ Department of Electrical Engineering, National Taiwan University of Science and Technology, 43, Keelung Road, Section 4, Taipei 10607, Taiwan ✉ E-mail: [email protected]Abstract: This study presents a modelling and simulation method for the analysis of short-circuits in 1 × 25 kV railway traction systems (RTSs). First, the authors developed models of major components and a full-scale model of a RTS. The component models developed in this study include a specific Le Blanc traction transformer and an overhead catenary system. The models are represented using corresponding coupling-free equivalent circuits to facilitate implementation using software packages MATLAB ® /Simulink ® . The short-circuit fault simulation of a RTS was conducted on a personal computer operating with MS Windows 7 ® . Field testing data was used to verify the simulation results. The modelling and simulation technology developed in this study provide a valuable reference for power engineers involved in the planning, design, and operation of a railway traction network. 1 Introduction The electric locomotive is a strong contender for the title of the most efficient and economical motive power for high-density transportation systems. In the final decades of the twentieth century, the steam railway system in Taiwan was converted to electricity. In late 2014, the railway electrification system from Hualien to Taitung was completed, thereby largely overcoming the traffic problems in Eastern Taiwan. Power to the railway is supplied by nearby traction substations fed from a three-phase 69-kV high-voltage grid of the Taiwan Power Company (TPC). Single-phase 1 × 25-kV and autotransformer-fed 2 × 25-kV traction systems are commonly used in modern railway electrification system, including high-speed railways [1, 2]. The short-circuit fault current in an autotransformer-fed 2 × 25-kV traction system tends to exceed that in a 1 × 25-kV traction system, and fault locating is more complicated [3]. In 1 × 25-kV traction systems, the large single-phase non-linear traction loads supplied by three-phase power systems also tend to cause the voltage unbalance, voltage fluctuation, harmonic pollution, and problems associated with a poor power quality [4, 5]. Short-circuit analysis is critical in determining the rating of power equipment and the implementation of protection devices, as well as can also be used to check the voltage profile of a network, particularly the busses near a fault. Particular attention must be paid to an accurate modelling of the traction transformers, autotransformers as well as self and mutual impedances of the AC railway overhead contact line systems. In short-circuits analysis, the impedance of system components and the configuration of the railway traction system (RTS) are the main factors determining the short-circuit current. This paper examines a single-phase 1 × 25 kV RTS in which the key factors determining the fault current are as follows: (i) The short-circuit capacity (SCC) at the busbar on the primary side of the traction transformer; that is, the source transformer. (ii) The winding connections (Le Blanc) and impedance of transformers in traction substations. (iii) The self and mutual impedances of overhead contact systems (including overhead messenger wire, overhead trolley contact wire, and return feeders) as well as the rails. Estimating disturbances resulting from the various types of short-circuit faults require comprehensive data collection with regards to all major components and the overall RTS, while the operating conditions of the RTS (both normal and abnormal) must also be considered. In the technical literature, several studies have been performed on: (i) traction system design, components modelling, and calculation methods [6–11] and (ii) critical and short-circuit conditions [12–15]. A detailed short-circuit modelling of a RTS can be derived and implemented in the time and frequency domains. In general, a frequency domain simulation is considered a feasible solution for the steady-state analysis, and it is typically used for both, system design and harmonic studies. The time domain simulation is generally used for transient analysis, in which information on the waveform characteristics and time evolution are required. In [16, 17], a time-domain model of a complete 2 × 25-kV high-speed railway system was proposed using the MATLAB ® / Simulink ® Power System Blockset (PSB) tool, where short-circuit analyses were performed. To reduce the complexity of the simulations, simplified models were proposed in [14, 18, 19]. In [14], only three major lines (overhead contact wire, return feeder, and rail) in the overhead catenary system (OCS) are considered. In [18, 19], simplified models are suggested to reduce the number of phases of the system by grouping the conductors. These models are suitable for applications where details for each individual line are not examined. Moreover, some components are mathematically represented by algebraic equations rather than by physical elements (R, L, or C); thus, these component models cannot be directly applied to commercial circuit simulation programs. Although, several component models have been developed in existing commercial software packages, including (i) a specific traction transformer and (ii) a detailed overhead contact lines system (existing in MATLAB ® / Simulink ® PSB tool; however, their functions are insufficient for detailed analysis such as asymmetrical structure simulation). Therefore, to ensure accurate simulation and easy implementation of RTSs, more detailed models of RTSs need to be developed. In this study, we developed a system of modelling and simulated for the analysis of short-circuits in a full-scale 1 × 25 kV RTS, including all major components. All models are represented using their corresponding coupling-free equivalent circuits to facilitate implementation within in-house or commercial software packages, such as the Electromagnetic Transients Program, the Personal Computer Simulation Program with Integrated Circuit Emphasis, MATLAB ® /Simulink ® , or self-developed program for short-circuits analysis. We then applied the models to the development of a IET Generation, Transmission & Distribution Research Article IET Gener. Transm. Distrib., pp. 1–12 1 & The Institution of Engineering and Technology 2016
Transcript
IET Generation, Transmission & Distribution
Research Article
Modelling, simulation, and verification fordetailed short-circuit analysis of a 1 × 25 kVrailway traction system
IET Gener. Transm. Distrib., pp. 1–12& The Institution of Engineering and Technology 2016
ISSN 1751-8687Received on 11th April 2015Revised on 12th October 2015Accepted on 27th October 2015doi: 10.1049/iet-gtd.2015.0501www.ietdl.org
Tsai-Hsiang Chen, Rih-Neng Liao ✉
Department of Electrical Engineering, National Taiwan University of Science and Technology, 43, Keelung Road, Section 4,
Abstract: This study presents a modelling and simulation method for the analysis of short-circuits in 1 × 25 kV railwaytraction systems (RTSs). First, the authors developed models of major components and a full-scale model of a RTS.The component models developed in this study include a specific Le Blanc traction transformer and an overheadcatenary system. The models are represented using corresponding coupling-free equivalent circuits to facilitateimplementation using software packages MATLAB®/Simulink®. The short-circuit fault simulation of a RTS wasconducted on a personal computer operating with MS Windows 7®. Field testing data was used to verify thesimulation results. The modelling and simulation technology developed in this study provide a valuable reference forpower engineers involved in the planning, design, and operation of a railway traction network.
1 Introduction
The electric locomotive is a strong contender for the title of the mostefficient and economical motive power for high-densitytransportation systems. In the final decades of the twentiethcentury, the steam railway system in Taiwan was converted toelectricity. In late 2014, the railway electrification system fromHualien to Taitung was completed, thereby largely overcoming thetraffic problems in Eastern Taiwan. Power to the railway issupplied by nearby traction substations fed from a three-phase69-kV high-voltage grid of the Taiwan Power Company (TPC).
Single-phase 1 × 25-kV and autotransformer-fed 2 × 25-kVtraction systems are commonly used in modern railwayelectrification system, including high-speed railways [1, 2]. Theshort-circuit fault current in an autotransformer-fed 2 × 25-kVtraction system tends to exceed that in a 1 × 25-kV traction system,and fault locating is more complicated [3]. In 1 × 25-kV tractionsystems, the large single-phase non-linear traction loads suppliedby three-phase power systems also tend to cause the voltageunbalance, voltage fluctuation, harmonic pollution, and problemsassociated with a poor power quality [4, 5].
Short-circuit analysis is critical in determining the rating of powerequipment and the implementation of protection devices, as well ascan also be used to check the voltage profile of a network,particularly the busses near a fault. Particular attention must be paid toan accurate modelling of the traction transformers, autotransformersas well as self and mutual impedances of the AC railway overheadcontact line systems. In short-circuits analysis, the impedance ofsystem components and the configuration of the railway tractionsystem (RTS) are the main factors determining the short-circuitcurrent. This paper examines a single-phase 1 × 25 kV RTS in whichthe key factors determining the fault current are as follows:
(i) The short-circuit capacity (SCC) at the busbar on the primaryside of the traction transformer; that is, the source transformer.(ii) The winding connections (Le Blanc) and impedance oftransformers in traction substations.(iii) The self and mutual impedances of overhead contact systems(including overhead messenger wire, overhead trolley contact wire,and return feeders) as well as the rails.
Estimating disturbances resulting from the various types ofshort-circuit faults require comprehensive data collection with
regards to all major components and the overall RTS, while theoperating conditions of the RTS (both normal and abnormal) mustalso be considered. In the technical literature, several studies havebeen performed on: (i) traction system design, componentsmodelling, and calculation methods [6–11] and (ii) critical andshort-circuit conditions [12–15]. A detailed short-circuit modellingof a RTS can be derived and implemented in the time and frequencydomains. In general, a frequency domain simulation is considered afeasible solution for the steady-state analysis, and it is typically usedfor both, system design and harmonic studies. The time domainsimulation is generally used for transient analysis, in whichinformation on the waveform characteristics and time evolution arerequired. In [16, 17], a time-domain model of a complete 2 × 25-kVhigh-speed railway system was proposed using the MATLAB®/Simulink® Power System Blockset (PSB) tool, where short-circuitanalyses were performed. To reduce the complexity of thesimulations, simplified models were proposed in [14, 18, 19]. In[14], only three major lines (overhead contact wire, return feeder,and rail) in the overhead catenary system (OCS) are considered. In[18, 19], simplified models are suggested to reduce the number ofphases of the system by grouping the conductors. These models aresuitable for applications where details for each individual line are notexamined. Moreover, some components are mathematicallyrepresented by algebraic equations rather than by physical elements(R, L, or C); thus, these component models cannot be directlyapplied to commercial circuit simulation programs. Although, severalcomponent models have been developed in existing commercialsoftware packages, including (i) a specific traction transformer and(ii) a detailed overhead contact lines system (existing in MATLAB®/Simulink® PSB tool; however, their functions are insufficient fordetailed analysis such as asymmetrical structure simulation).Therefore, to ensure accurate simulation and easy implementation ofRTSs, more detailed models of RTSs need to be developed.
In this study, we developed a system of modelling and simulated forthe analysis of short-circuits in a full-scale 1 × 25 kV RTS, includingall major components. All models are represented using theircorresponding coupling-free equivalent circuits to facilitateimplementation within in-house or commercial software packages,such as the Electromagnetic Transients Program, the PersonalComputer Simulation Program with Integrated Circuit Emphasis,MATLAB®/Simulink®, or self-developed program for short-circuitsanalysis. We then applied the models to the development of a
1
Fig. 1 Arrangement of traction substations in Eastern Taiwan railway electrification system
short-circuit analysis program based on a bus (node) admittancematrix. This makes it possible to derive the fault currents in eachbranch of a RTS as well as the profiles of fault currents along theroute of the railway. It also enables the calculation of voltages inoverhead messenger wires, overhead trolley contact wires, andreturn feeders along the route of the railway.
2 Railway electrification system
The railway electrification system in Eastern Taiwan includes fivetraction substations and four disconnecting switches, as shown inFig. 1. A remote operation control centre situated in Hualien isused to supervise and control moving trains and the entire RTS.The power-supply zone for each traction substation isapproximately 40 km, each of which is further separated into twopower-supply sub-zones fed single-phase power from phases Mand T of a Le Blanc transformer in traction substations. Thisnecessitates the inclusion of a neutral zone to isolate out-of-phaseelectric power from phases M and T of the Le Blanc transformers.
Traction substations are usually located in the centre of apower-supply zone. Fig. 2 presents a single-line diagram of atraction substation typical of the Eastern Taiwan railwayelectrification system. As shown in Fig. 3, the traction substation
Fig. 2 Single-line diagram of typical traction substation in Eastern Taiwanrailway electrification system
2
transformer employs a special winding connection transformer (aLe Blanc transformer) to facilitate the balancing of system voltage.The primary windings used with the traction transformer are adelta connection fed by two 69 kV sub-transmission lines fromdiscrete TPC bulk power substations. The secondary windingspresent a special Le Blanc connection, which provides two 25 kVelectric power with 90° phase displacement for the moving trains.The traction substations are equipped with protective equipment,such as circuit breakers, disconnecting switches, and lightningarresters.
3 Mathematical model
The elements essential to a RTS include traction substations withtraction transformers and OCS comprising overhead messengerwire, overhead trolley contact wire, return feeder, and rail. Themodelling of system components is the key process dictating thesuccess of system simulation. The precision of the simulationresults as well as the convergence characteristics of solutiontechniques are determined by the system component models andfull-scale network model. In this study, we employed a busadmittance matrix and coupling-free equivalent circuit for thedevelopment of the proposed models.
Fig. 3 Le Blanc traction transformer connected using three single-phasetransformers with delta-connected primary windings
IET Gener. Transm. Distrib., pp. 1–12& The Institution of Engineering and Technology 2016
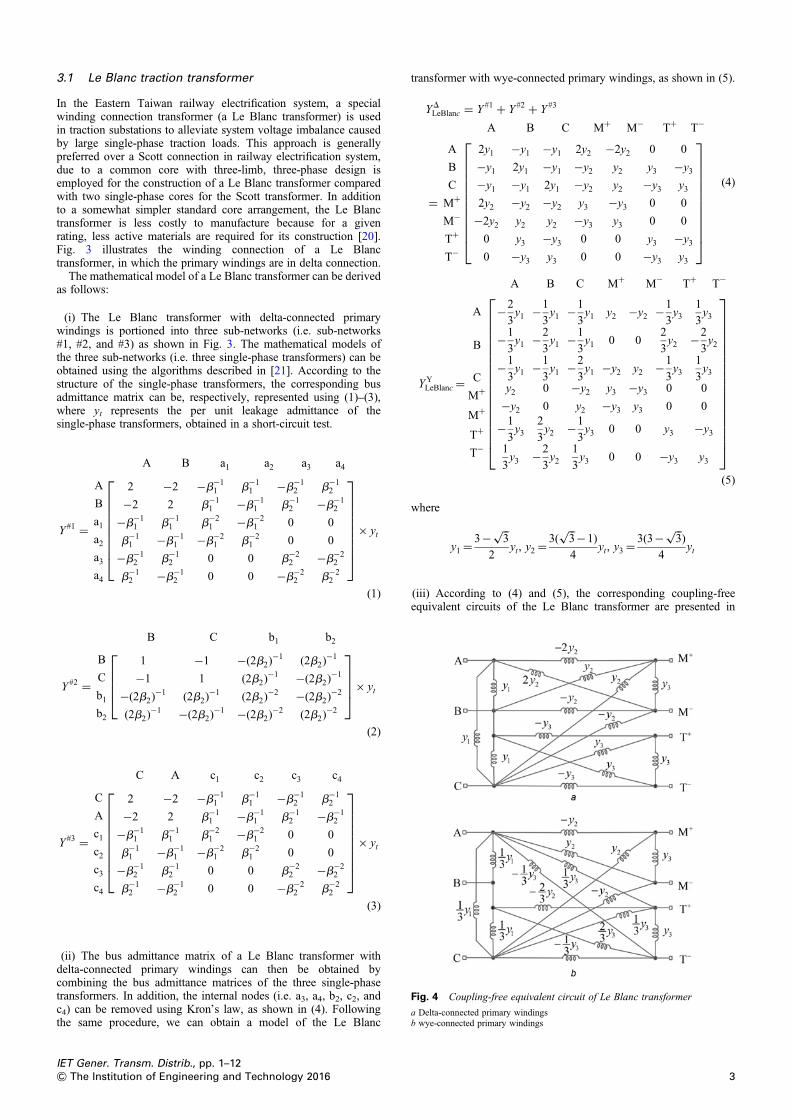
3.1 Le Blanc traction transformer
In the Eastern Taiwan railway electrification system, a specialwinding connection transformer (a Le Blanc transformer) is usedin traction substations to alleviate system voltage imbalance causedby large single-phase traction loads. This approach is generallypreferred over a Scott connection in railway electrification system,due to a common core with three-limb, three-phase design isemployed for the construction of a Le Blanc transformer comparedwith two single-phase cores for the Scott transformer. In additionto a somewhat simpler standard core arrangement, the Le Blanctransformer is less costly to manufacture because for a givenrating, less active materials are required for its construction [20].Fig. 3 illustrates the winding connection of a Le Blanctransformer, in which the primary windings are in delta connection.
The mathematical model of a Le Blanc transformer can be derivedas follows:
(i) The Le Blanc transformer with delta-connected primarywindings is portioned into three sub-networks (i.e. sub-networks#1, #2, and #3) as shown in Fig. 3. The mathematical models ofthe three sub-networks (i.e. three single-phase transformers) can beobtained using the algorithms described in [21]. According to thestructure of the single-phase transformers, the corresponding busadmittance matrix can be, respectively, represented using (1)–(3),where yt represents the per unit leakage admittance of thesingle-phase transformers, obtained in a short-circuit test.
A B a1 a2 a3 a4
Y #1 =
A
B
a1a2a3a4
2 −2 −b−11 b−1
1 −b−12 b−1
2
−2 2 b−11 −b−1
1 b−12 −b−1
2
−b−11 b−1
1 b−21 −b−2
1 0 0
b−11 −b−1
1 −b−21 b−2
1 0 0
−b−12 b−1
2 0 0 b−22 −b−2
2
b−12 −b−1
2 0 0 −b−22 b−2
2
⎡⎢⎢⎢⎢⎢⎢⎢⎢⎣
⎤⎥⎥⎥⎥⎥⎥⎥⎥⎦× yt
(1)
B C b1 b2
Y #2 =
B
C
b1b2
1 −1 −(2b2)−1 (2b2)
−1
−1 1 (2b2)−1 −(2b2)
−1
−(2b2)−1 (2b2)
−1 (2b2)−2 −(2b2)
−2
(2b2)−1 −(2b2)
−1 −(2b2)−2 (2b2)
−2
⎡⎢⎢⎢⎣
⎤⎥⎥⎥⎦× yt
(2)
Fig. 4 Coupling-free equivalent circuit of Le Blanc transformer
a Delta-connected primary windingsb wye-connected primary windings
C A c1 c2 c3 c4
Y #3 =
C
A
c1c2c3c4
2 −2 −b−11 b−1
1 −b−12 b−1
2
−2 2 b−11 −b−1
1 b−12 −b−1
2
−b−11 b−1
1 b−21 −b−2
1 0 0
b−11 −b−1
1 −b−21 b−2
1 0 0
−b−12 b−1
2 0 0 b−22 −b−2
2
b−12 −b−1
2 0 0 −b−22 b−2
2
⎡⎢⎢⎢⎢⎢⎢⎢⎢⎣
⎤⎥⎥⎥⎥⎥⎥⎥⎥⎦× yt
(3)
(ii) The bus admittance matrix of a Le Blanc transformer withdelta-connected primary windings can then be obtained bycombining the bus admittance matrices of the three single-phasetransformers. In addition, the internal nodes (i.e. a3, a4, b2, c2, andc4) can be removed using Kron’s law, as shown in (4). Followingthe same procedure, we can obtain a model of the Le Blanc
IET Gener. Transm. Distrib., pp. 1–12& The Institution of Engineering and Technology 2016
transformer with wye-connected primary windings, as shown in (5).
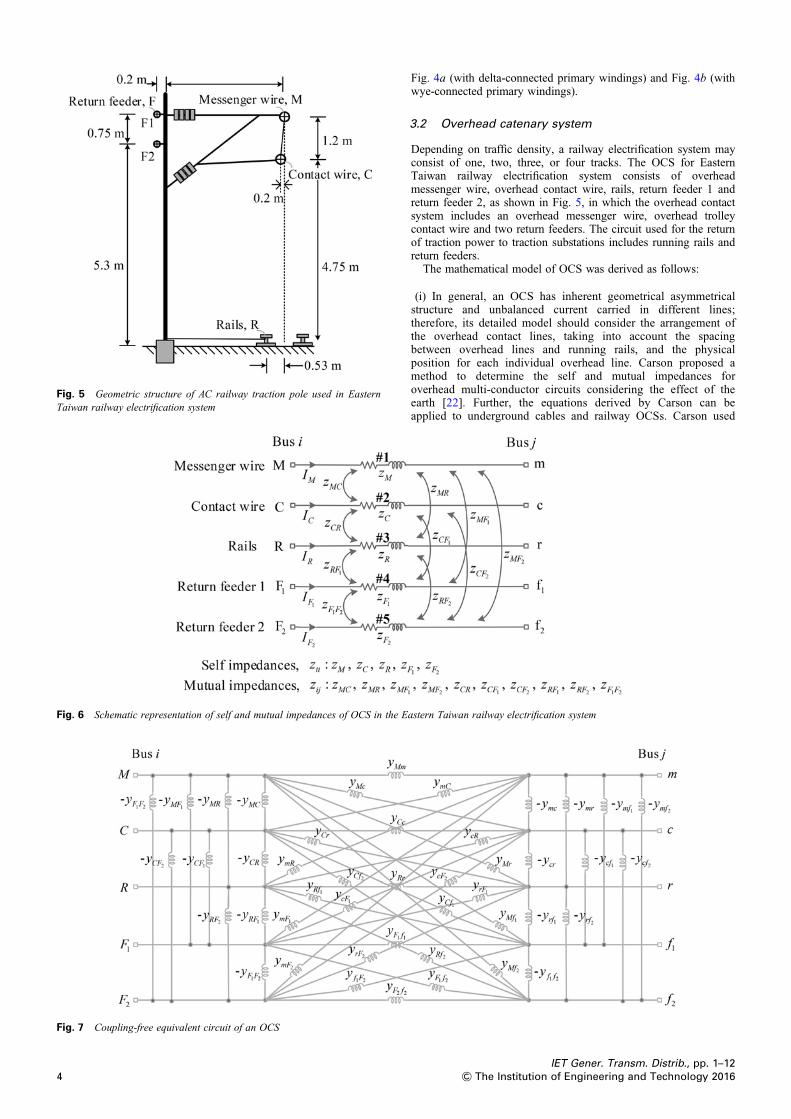
Depending on traffic density, a railway electrification system mayconsist of one, two, three, or four tracks. The OCS for EasternTaiwan railway electrification system consists of overheadmessenger wire, overhead contact wire, rails, return feeder 1 andreturn feeder 2, as shown in Fig. 5, in which the overhead contactsystem includes an overhead messenger wire, overhead trolleycontact wire and two return feeders. The circuit used for the returnof traction power to traction substations includes running rails andreturn feeders.
The mathematical model of OCS was derived as follows:
(i) In general, an OCS has inherent geometrical asymmetricalstructure and unbalanced current carried in different lines;therefore, its detailed model should consider the arrangement ofthe overhead contact lines, taking into account the spacingbetween overhead lines and running rails, and the physicalposition for each individual overhead line. Carson proposed amethod to determine the self and mutual impedances foroverhead multi-conductor circuits considering the effect of theearth [22]. Further, the equations derived by Carson can beapplied to underground cables and railway OCSs. Carson used
astern Taiwan railway electrification system
IET Gener. Transm. Distrib., pp. 1–12& The Institution of Engineering and Technology 2016
Fig. 8 One-line diagram of the Eastern Taiwan railway electrificationsystem at Guanshan traction substation
the method of images based on the assumption that the earth anequipotential plane, and therefore, the electric flux lines areforced to cut the surface of the earth orthogonally. Hence, theearth effect can be represented by placing an oppositely chargedconductor (image conductor) below the surface of the earth by adistance equal to that of the overhead conductor above the earthfor all conductors in the OCS. Carson’s original equations aregiven in [22]. Because Carson’s original equations are somewhatcomplex, some approximations are made to simplify theircalculations. In [23], Carson’s modified equations are developed,and these equations are applied for calculating the primitive selfand mutual impedances of the overhead lines in an OCS in thisstudy. It was assumed that: (i) the frequency of the railwayelectrification system is 60 Hz, and (ii) the earth resistivity is100 Ω-metre. A set of modified Carson’s equations are given in(6) and (7).
zii = ri + 0.09327+ j0.12134 ln1
GMRi
( )+ 7.95153
( )(6)
zij = 0.09327+ j0.12134 ln1
Dij
( )+ 7.95153
( )(7)
where zii: self-impedance of conductor i in Ω/mile; zij:mutual-impedance between conductors i and j in Ω/mile; ri:resistance of conductor i in Ω/mile; GMRi: geometric meanradius of conductors i in feet; and Dij: distance betweenconductors i and j in feet.(ii) Fig. 6 presents an equivalent schematic circuit of an OCSincluding running rails. All overhead lines are modelled as a πmodel. However, all shunt capacitances of the overhead lines aredisregarded because the power-supply zones of phases T and M ofthe traction transformer from traction substations are quite short,usually less than 20 km.
The primitive equations that relate the node voltages andbranch currents of overhead lines in an OCS are shown in acompact form as
VM
VC
VR
VF1VF2
⎡⎢⎢⎢⎢⎣
⎤⎥⎥⎥⎥⎦ =
Vm
Vc
Vr
V f1Vf2
⎡⎢⎢⎢⎢⎣
⎤⎥⎥⎥⎥⎦+ l×
zM zMC zMR zMF1zMF2
zMC zC zCR zCF1 zCF2zMR zCR zR zRF1 zRF2zMF1
zCF1 zRF1 zF1 zF1F2zMF2
zCF2 zRF2 zF1F2 zF2
⎡⎢⎢⎢⎢⎣
⎤⎥⎥⎥⎥⎦
×
IMICIRIF1IF2
⎡⎢⎢⎢⎢⎣
⎤⎥⎥⎥⎥⎦ (8)
where l is the overhead line length of an OCS. Further, (6) and
IET Gener. Transm. Distrib., pp. 1–12& The Institution of Engineering and Technology 2016
(7) are used to find the self and mutual impedances,respectively. The corresponding primitive impedance matrix[zpr] that considers the self and mutual impedances of theoverhead messenger wire, overhead contact wire, running rails,and two return feeders are given as
zpr
[ ]=
zM zMC zMR zMF1zMF2
zMC zC zCR zCF1 zCF2zMR zCR zR zRF1 zRF2zMF1
zCF1 zRF1 zF1 zF1F2zMF2
zCF2 zRF2 zF1F2 zF2
⎡⎢⎢⎢⎢⎣
⎤⎥⎥⎥⎥⎦ (9)
(iii) The branch-bus incident matrix C for Fig. 6 is as follows
bus i bus j
M C R F1 F2 m c r f1 f2
C=brach
#1
#2
#3
#4
#5
1 0 0 0 0 −1 0 0 0 0
0 1 0 0 0 0 −1 0 0 0
0 0 1 0 0 0 0 −1 0 0
0 0 0 1 0 0 0 0 −1 0
0 0 0 0 1 0 0 0 0 −1
⎡⎢⎢⎢⎢⎢⎢⎣
⎤⎥⎥⎥⎥⎥⎥⎦
(10)
(iv) Using (9) and (10), the bus admittance matrix of railway OCSwas obtained as (11). (see (11))
yMF2−yMm −yMc −yMr −yM f1
−yM f2
yCF2 −yCm −yCc −yCr −yC f1−yC f2
yRF2 −yRm −yRc −yRr −yR f1−yR f2
yF1F2 −yF1m −yF1c −yF1r −yF1 f1 −yF1 f2yF2 −yF2m −yF2c −yF2r −yF2 f1 −yF2 f2
−yF2m ym ymc ymr ym f1ym f2
−yF2c ymc yc ycr yc f1 yc f2−yF2r ymr ycr yr yr f1 yr f2−yF2 f1 ym f1
yc f1 yr f1 y f1 y f1 f2−yF2 f2 ym f2
yc f2 yr f2 y f1 f2 y f2
⎤⎥⎥⎥⎥⎥⎥⎥⎥⎥⎥⎥⎥⎥⎥⎥⎥⎥⎥⎥⎦
(11)
5
Fig. 9 Block diagrams created using MATLAB®/Simulink®
a Full-scale model of the Eastern Taiwan railway electrification system at a typical traction substation areab Coupling-free equivalent circuit of a Le Blanc traction transformerc Coupling-free equivalent circuit of an OCS
(v) According to (11), the corresponding coupling-free equivalentcircuit of the OCS is shown in Fig. 7.
3.3 Utility power source
The impedance of the power-supply source should be taken intoaccount for fault analysis because of its sizable effect on thefault current. The equivalent impedance of the source can beobtained by converting the SCC on the source side of thetraction transformer. In this paper, the circuit model of a utility
6
power sources is represented by a Thevenin’s equivalentcircuit [24].
4 Implementation procedure
Short-circuit field testing in a high-voltage network can be highlydangerous and time-consuming; therefore, only limited testingcases are subsidised. In contrast, a precise component model and afull-scale RTS model can be used to obtain nearly the same resultsas those obtained from the testing field. An appropriate computerprogram not only helps engineers select, design, and operate aRTS, but also provides a useful tool for determining the correct
IET Gener. Transm. Distrib., pp. 1–12& The Institution of Engineering and Technology 2016
Fig. 9 (Continued).
short-circuit currents for various fault scenarios. A commercialsimulation software package called MATLAB®/Simulink®, whichhas powerful simulation ability and a user-friendly graphicalinterface, was adopted to simulate the RTS of the Eastern Taiwanrailway electrification system. All major components need to beproperly modelled by their corresponding equivalent circuitsbefore the RTS can be simulated using MATLAB®/Simulink®.The Le Blanc traction transformer and OCS can be representedexplicitly in the MATLAB®/Simulink®. Hence, the OCS can beanalysed in more detail. The steps for modelling the RTS of theEastern Taiwan railway electrification system are as follows:
(i) Forming equivalent circuit models for all major components inthe target RTS In MATLAB®/Simulink®, the coupling-freeequivalent circuits can be represented by simple elements such asresistance, inductance, capacitance, and voltage/current sources,that is, coupling-free equivalent circuits can be modified andmodularised to meet the requirements of different simulationobjectives, and then be implemented with MATLAB®/Simulink®.Modularisation is useful for MATLAB®/Simulink® functionswhere users can construct their own component models andfull-scale system models.(ii) Setting necessary parameters for all system componentsUnsuitable or incorrect parameters may result in incorrect
Table 1 Parameters of the overhead contact line and running rail of the target
IET Gener. Transm. Distrib., pp. 1–12& The Institution of Engineering and Technology 2016
simulation results and confusing conclusions, and may lead toprogram divergence. All required parameters of the majorcomponents in the target RTS must be collected.(iii) Building a full-scale model of the target RTS According to thestructure of the target RTS, a full-scale system model can be built bycombining the major component models, such as Le Blanc tractiontransformer and OCS.
The one-line diagram of the Eastern Taiwan railway electrificationsystem at Guanshan substation is shown in Fig. 8 and itscorresponding full-scale network model implemented usingMATLAB®/Simulink® is illustrated in Fig. 9a. The branches andnodes of the major components, such as the Le Blanc tractiontransformer and OCS are explicitly represented as shown inFigs. 9b–c.
5 Field testing and simulation results
5.1 Field testing
A short-circuit fault was field tested within the power-supply zone ofthe Guanshan traction substation [25]. A solid short-circuit fault wasintroduced between the overhead contact line and the running rail.
Fig. 10 Schematic connection diagram for short-circuit currentmeasurement
To reveal the variations in the short-circuit current along thepower-supply zone, the ends of the power-supply zone – phases Mand T of the transformer from the Guanshan traction substation –were selected as fault points that are located at the Dongzhu (Case1) and Luye (Case 2) train stations, respectively (see Fig. 1).
The short-circuit fault testing procedure is as follows:
Fig. 11 Field testing result of short-circuit fault
a (ISC-case1) at Dongzhu train stationb (ISC-case2) at Luye train station
8
(i) Ensure that there is no train in the power-supply zone and theOCS is de-energised and temporarily grounded so that there is noresidual voltage on the target overhead contact lines.(ii) Short-circuit the overhead contact line and the rail at the faultpoints, that are located at the Dongzhu (Case 1) and Luye (Case 2)train stations.(iii) Measure the parameters of the target overhead contact lines andcalculate their corresponding impedance and resistance. Theoverhead contact line system is a complicated system; themagnitude, phase angle of voltage and current, and the active andreactive powers are measured while a proper current is injectedbetween the overhead contact line and the rail at the tractionsubstation. Next, the equivalent impedance of the overhead contactline and running rail of the target power-supply zone is calculated.Table 1 summarises the measured and calculated results. This tableindicates that the system equivalent resistance at the Luye trainstation is less compared with that at the Dongzhu’s train station.(iv) Using the calculated data in Table 1, along with the giventraction transformer impedance and system equivalent impedanceat the primary side of the traction transformer, calculate theshort-circuit current before the real short-circuit is performed. Thecalculated fault currents were applied to the settings of the faultcurrent recording instruments so that the waveform of theshort-circuit current can be exactly recorded, and unnecessaryrepetitive tests can be avoided.(v) Reenergise the target overhead contact line before theshort-circuit test are conducted. More functions of the related relayand vacuum circuit breaker (VCB) should be endorsed.
IET Gener. Transm. Distrib., pp. 1–12& The Institution of Engineering and Technology 2016
Table 2 Parameters used in railway electrification system
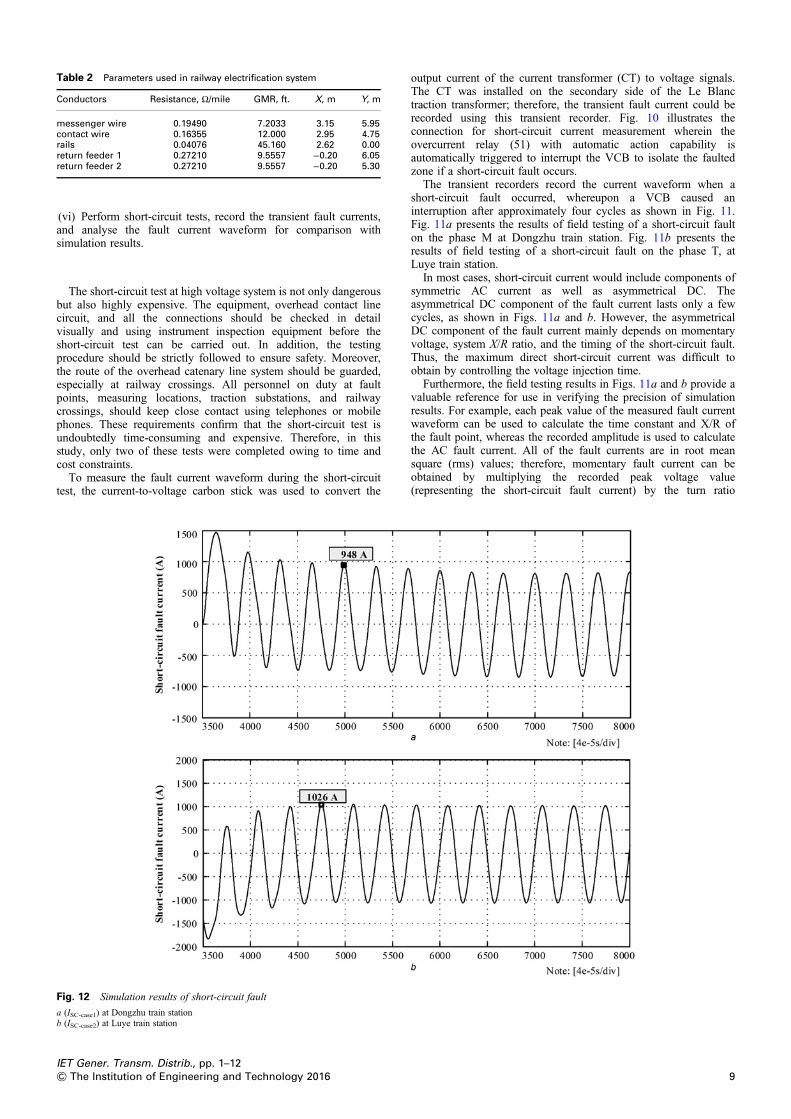
(vi) Perform short-circuit tests, record the transient fault currents,and analyse the fault current waveform for comparison withsimulation results.
The short-circuit test at high voltage system is not only dangerousbut also highly expensive. The equipment, overhead contact linecircuit, and all the connections should be checked in detailvisually and using instrument inspection equipment before theshort-circuit test can be carried out. In addition, the testingprocedure should be strictly followed to ensure safety. Moreover,the route of the overhead catenary line system should be guarded,especially at railway crossings. All personnel on duty at faultpoints, measuring locations, traction substations, and railwaycrossings, should keep close contact using telephones or mobilephones. These requirements confirm that the short-circuit test isundoubtedly time-consuming and expensive. Therefore, in thisstudy, only two of these tests were completed owing to time andcost constraints.
To measure the fault current waveform during the short-circuittest, the current-to-voltage carbon stick was used to convert the
Fig. 12 Simulation results of short-circuit fault
a (ISC-case1) at Dongzhu train stationb (ISC-case2) at Luye train station
IET Gener. Transm. Distrib., pp. 1–12& The Institution of Engineering and Technology 2016
output current of the current transformer (CT) to voltage signals.The CT was installed on the secondary side of the Le Blanctraction transformer; therefore, the transient fault current could berecorded using this transient recorder. Fig. 10 illustrates theconnection for short-circuit current measurement wherein theovercurrent relay (51) with automatic action capability isautomatically triggered to interrupt the VCB to isolate the faultedzone if a short-circuit fault occurs.
The transient recorders record the current waveform when ashort-circuit fault occurred, whereupon a VCB caused aninterruption after approximately four cycles as shown in Fig. 11.Fig. 11a presents the results of field testing of a short-circuit faulton the phase M at Dongzhu train station. Fig. 11b presents theresults of field testing of a short-circuit fault on the phase T, atLuye train station.
In most cases, short-circuit current would include components ofsymmetric AC current as well as asymmetrical DC. Theasymmetrical DC component of the fault current lasts only a fewcycles, as shown in Figs. 11a and b. However, the asymmetricalDC component of the fault current mainly depends on momentaryvoltage, system X/R ratio, and the timing of the short-circuit fault.Thus, the maximum direct short-circuit current was difficult toobtain by controlling the voltage injection time.
Furthermore, the field testing results in Figs. 11a and b provide avaluable reference for use in verifying the precision of simulationresults. For example, each peak value of the measured fault currentwaveform can be used to calculate the time constant and X/R ofthe fault point, whereas the recorded amplitude is used to calculatethe AC fault current. All of the fault currents are in root meansquare (rms) values; therefore, momentary fault current can beobtained by multiplying the recorded peak voltage value(representing the short-circuit fault current) by the turn ratio
9
Table 3 Comparison of short-circuit rms currents obtained throughfield testing and simulation
Field testingpoint
Fault distance fromsubstation, km
Fault rms current, A
Fieldtesting
Simulation
Dongzhu 19.935 940.5 948Luye 16.377 1046 1026
settings of the carbon stick and CT, which is then divided . On thebasis of the short-circuit fault current waveform shown inFigs. 11a and b, their corresponding actual rms short-circuit faultcurrents can be calculated is as following:
(i) ISC-case1 = (50 mV/DIV) × (1.33 DIV) × (0.707) × (0.02 A/1mV) × (1000/1 A) = 940.45 A, for fault at Dongzhu train station.(ii) ISC-case2 = (50 mV/DIV) × (1.48 DIV) × (0.707) × (0.02 A/1mV) × (1000/1 A) = 1046 A, for fault at Luye train station.
5.2 Parameters
The parameters used in the simulation are listed as follows:
(i) The equivalent impedance of the utility power source iscalculated according to a SCC of 364.5 MVA and rated voltage of69 kV, as provided by the TPC. This voltage source wasconsidered ideal and the phase-to-phase voltages are specified.(ii) The parameters used in the Le Blanc traction transformer are asfollows: primary windings in delta connection, rated capacity 25MVA, 69/25 kV, the leakage impedance of 10.56%.(iii) The distance between two railway poles is 50 m. The distancebetween Dongzhu train station and Guanshan substation is 19.935km. The distance between Luye train station and Guanshansubstation is 16.377 km.
Table 4 Short-circuit currents and voltages under various fault conditions
System operating mode| RSC, Ω d, km
ISC IM
Tr.#1: on Tr.#2: off 0 20 963.7∠97.9° 443.8∠9818 1011.7∠97.5° 465.9∠9716 1064.7∠97.1° 490.3∠9712 1188.9∠96.1° 547.5∠968 1345.4∠94.8° 619.6∠954 1548.1∠93.1° 712.9∠932 1673.5∠92.1° 770.7∠92
Notes: The variables are described as follows; d: distance of fault location away fcurrent; IM: fault current in overhead messenger wire; IC: fault current in overheaVTr: voltage at the traction station outgoing busbar
10
(iv) Ground resistivity was assumed to be 100 Ω-m. The railwaypoles are grounded with multiple grounding branches used toprevent harmonic current flowing through the rail from interferingwith nearby communication lines.(v) The parameters used for the AC railway line (see Fig. 5) of theEastern Taiwan of railway electrification system are listed in Table 2using a Cartesian coordinate system [26].
5.3 Simulation
Short-circuit faults were simulated using the full-scale model of therailway electrification system established in the previous section.Simulation enabled the control of the phase angle of the pre-faultvoltage. Figs. 12a and b presents the simulation results ofshort-circuit current waveforms. As shown in Table 3, acomparison of results from computer simulation and field testing
rom traction substation; RSC: fault resistance; ISC: short-circuit faultd contact wire; IF: the sum of fault currents in the two return feeders; and
IET Gener. Transm. Distrib., pp. 1–12& The Institution of Engineering and Technology 2016
revealed a difference of between 0.79% and 1.91%. The factorscontributing to this variation are as follows:
(i) Visual error: This is the primary source of error due to the factthat even slight visual errors can be magnified when a short-circuitfault of up to 1000 A appears on the screen of the transient recorder.(ii) Instrumentation error: The instruments used for testing arelikely to introduce measurement error.(iii) The validity of the components and full-scale models, thetechnical solutions that are selected, and the assumptions made forthe simulation can all exert a profound effect on the results.
Table 3 confirms that the proposed models can precisely retrieve thecharacteristics of a 1 × 25 kV railway electrification system forshort-circuit analysis. In addition, the proposed models and solutionapproach can be used to make more detailed simulations, andtherefore, can detect the features and limitations of the target systemthat cannot be done by only the field tests. The following detailedshort-circuit analysis results were obtained by the proposed approach.
(i) For the short-circuit fault occurred at Dongzhu train station(Case 1), the detailed steady-state short-circuit currents flowingthrough the individual contact lines in the OCS are identified asfollows: ISC-case1 = IM + IC = –(IR + IF) = 965.21∠97.92° A, IM =444.5∠98.32° A, IC = 520.73∠97.57° A, IR = 521.4∠−87.08° A,and IF = IF1 + IF2 = 448.1∠−76.26° A (the sum of the currentsflowing in the two return feeders). The steady-state voltage of thetraction station outgoing busbar can also be identified, that is11.96∠172.18° kV with a voltage deviation of 52.2%.(ii) For the short-circuit fault that occurred at the Luye train station (Case2), the detailed steady-state short-circuit currents flowing through theindividual contact lines in the OCS are as follows: ISC-case2 =1054.28∠7.19° A, IM= 485.52∠7.60° A, IC = 568.78∠6.85° A, IR =569.51∠−177.87° A, and IF = 489.45∠−166.99° A. The steady-statevoltage of traction station outlet end is 10.73∠81.45° kV with avoltage deviation of 57.08%.
Moreover, two fault impedances (0, 1, and 5 Ω), seven faultlocations (2, 4, 8, 12, 16, 18, and 20 km from traction substation)and two system operating conditions (Tr #1: on, Tr #2: off; Tr #1:on, Tr #2: on) were simulated for considering the effect of faultimpedance, fault location, and system configuration on the faultcurrents and voltages. The simulation results are summarised inTable 4. The short-circuit currents provide significant informationfor the selection of protective relays and circuit breakers.Accordingly, the proposed approach provides a valuable referencefor power engineers involved in the planning, design, andoperation of a railway traction network.
6 Conclusions
This study developed mathematical models of the major componentsas well as a full-scale representation of a 1 × 25 kV railwayelectrification system for analysis of short-circuits. The proposedmodels of a Le Blanc transformer and a RTS are represented usingtheir corresponding coupling-free equivalent circuits andimplemented using the commercial software package, MATLAB®/Simulink®. The models developed in this paper could be appliedto the simulation of short-circuit faults occurring in any location ofa railway electrification system as a means of avoiding the dangersand costs associated with field testing.
The Eastern Taiwan railway electrification system was introducedand used as a demonstration system for short-circuit analysis. Thefull-scale model of the demonstration system was created bycombining the equivalent circuit models for its major componentssuch as the Le Blanc traction transformer model and the OCSmodel. The coupling-free equivalent circuit of the full-scale modelwas implemented using MATLAB®/Simulink®. Next, a series ofdigital simulations were performed for various short-circuit
IET Gener. Transm. Distrib., pp. 1–12& The Institution of Engineering and Technology 2016
conditions. Finally, the simulation and field test results wascompared. The comparison indicated that the proposed models canprecisely retrieve the characteristics of a 1 × 25 kV railwayelectrification system for short-circuit analysis. Based on the abovefacts, the proposed models and solution approach could provide avaluable reference for power engineers involved in the planning,design, and operation of a railway traction network.
In addition, the proposed models and solution approach can beused to perform more simulations, and therefore, help detect thefeatures and limitations of the target system that cannot be doneonly through field tests. At present, the proposed models arebeing used to optimise and upgrade the Taiwan railway’selectrification system. Future works will aim at power flow study,harmonic analysis, voltage drop calculation, substation groundingsystem analysis, and protective relay coordination study.
7 Acknowledgment
The author thank the CECI Engineering Consultants, Inc., Taiwanfor providing the measurement data.
8 References
1 Courtois, C.: ‘Why the 2 × 25 kV alternative? [autotransformer traction supply]’.IEE Colloquium on 50 kV Autotransformer Traction Supply System – theFrench Experience, November 1993, pp. 1–4
2 Roussel, H.: ‘Power supply for the Atlantic TGV high speed line’. Int. Conf. onMain Line Railway Electrification, Set. 1989, pp. 388–392
3 Millard, A., Taylor, I.A., Weller, G.C.: ‘AC electrified railways – protection anddistance to fault measurement’. Int. Conf. on Electric Railways in UnitedEurope, March 1995, pp. 73–77
4 Bailey, D.I., Jones, K.M.: ‘The supply of large rail traction loads from smallisolated power systems’, IET Conference Publication No. 210, Sources Eff.Power Syst. Disturb., 1982, pp. 260–266
5 Ross, B.A.: ‘Meeting tomorrow’s railroad power requirements’, IEEE Trans.Power Appar. Syst., 1971, PAS-90, (2), pp. 393–400
6 Hill, R.J., Brillante, S., Leonard, P.J.: ‘Railway track transmission line parametersfrom finite element field modelling: series impedance’, IEE Proc. – Electr. PowerAppl., 1999, 146, (6), pp. 647–660
7 Hill, R.J., Brillante, S., Leonard, P.J.: ‘Railway track transmission line parametersfrom finite element field modelling: shunt admittance’, IEE Proc. – Electr. PowerAppl., 2000, 147, (3), pp. 227–238
8 Mingli, W., Chengshan, X., Fan, Y., et al.: ‘Performance and mathematical modelof three-phase three-winding transformer used in 2 × 25 kV electric railway’, IEEProc. – Electr. Power Appl., 2006, 153, (2), pp. 271–281
9 Mariscotti, A., Pozzobon, P.: ‘Determination of the electrical parameters of railwaytraction lines: calculation, measurements, and reference data’, IEEE Trans. PowerDeliv., 2004, 19, (4), pp. 1538–1546
10 Mariscotti, A., Pozzobon, P.: ‘Resistence and internal inductance of traction rails atpower frequency: a survey’, IEEE Trans. Veh. Technol., 2004, 53, (4),pp. 1069–1075
11 Kneschke, T.A., Hong, J., Natarajan, R., et al.: ‘Impedance calculations forSEPTA’s rail power distribution system’. Proc. 1995 IEEE/ASME Joint RailroadConf., April 1995, pp. 79–85
12 Natarajan, R., Kneschke, T.A., Naqvi, W., et al.: ‘Short circuit currents of theSEPTA traction power distribution system’, IEEE Ind. Appl. Mag., 1997, 3, (6),pp. 52–59
13 Cella, R., Giangaspero, G., Mariscotti, A., et al.: ‘Measurements of AT electricrailway system currents at power supply frequency and validation of amulticonductor transmission line model’, IEEE Trans. Power Deliv., 2006, 21,(3), pp. 1721–1726
14 Chen, T.H., Hsu, Y.F.: ‘Systematized short-circuit analysis of a 2 × 25 kV electrictraction network’, Electr. Power Syst. Res., 1998, 47, (2), pp. 133–142
15 Battistelli, L., Pagano, M., Proto, D.: ‘Short circuit modelling and simulation of 2 ×25 kV high speed railways’. 2008. AICMS 08. Second Asia Int. Conf. onModelling and Simulation, May 2008, pp. 702–707
16 Battistelli, L., Pagano, M., Proto, D.: ‘2 × 25-kV 50 Hz high-speed traction powersystem: short-circuit modeling’, IEEE Trans. Power Deliv., 2011, 26, (3),pp. 1459–1466
17 Amendola, A., Battistelli, L., Candurro, L., et al.: ‘Steady state and transient shortcircuit analysis of 2 × 25 kV high speed railways’. Proc. 8th World Congress onRailway Research, May 2008
18 Lee, H., Lee, C., Jang, G., et al.: ‘Harmonic analysis of the korean high-speedrailway using the eight-port representation model’, IEEE Trans. Power Deliv.,2006, 21, (2), pp. 979–986
19 Mariscotti, A., Pozzobon, P., Vanti, M.: ‘Simplified modelling of a 2 × 25-kV ATrailway system for the solution of a low frequency and large-scale problems’, IEEETrans. Power Deliv., 2007, 22, (1), pp. 296–301
20 Stigant, S.A., Franklin, A.C.: ‘The J & P transformer book: a practical technologyof the power transformer’ (London, Boston, 1973), pp. 150–205
11
21 Chen, T.H., Huang, M.Y.: ‘Network modelling of 24-pulse rectifier transformersfor rigorous simulation of rail transit power systems’, Electr. Power Syst. Res.,1999, 50, (1), pp. 23–33
22 Carson, J.R.: ‘Wave propagation in overhead wires with ground return’, Bell Syst.Tech. J., 1926, 5, (4), pp. 539–554
23 Kersting, W.H., Green, R.K.: ‘The application of Carson’s equation to thesteady-state analysis of distribution feeders’. Power Systems Conf. andExposition, March 2011, pp. 1–6
25 Tatung Company: ‘East railway improvement project – power supply system: statictest report’ (Railway Reconstruction Bureau Ministry of Transportation andCommunications, 2011), pp. 221–224
26 Chang, S.H.: ‘Analysis of voltage unbalance in the electric railway depot usingtwo-port network model’, Korean Inst. Electr. Eng., 2001, 50, pp. 248–256
IET Gener. Transm. Distrib., pp. 1–12& The Institution of Engineering and Technology 2016