Modelling urban pollution within the UK scale integrated assessment model, UKIAM Helen ApSimon, Tim Oxley and Marios Valiantis UK Centre for Integrated Assessment Modelling Imperial College London
Transcript
Modelling urban pollution within the UK scale integrated assessment
model, UKIAM
Helen ApSimon, Tim Oxley and Marios Valiantis
UK Centre for Integrated Assessment Modelling
Imperial College London
UKIAM- a national scale model including urban areas
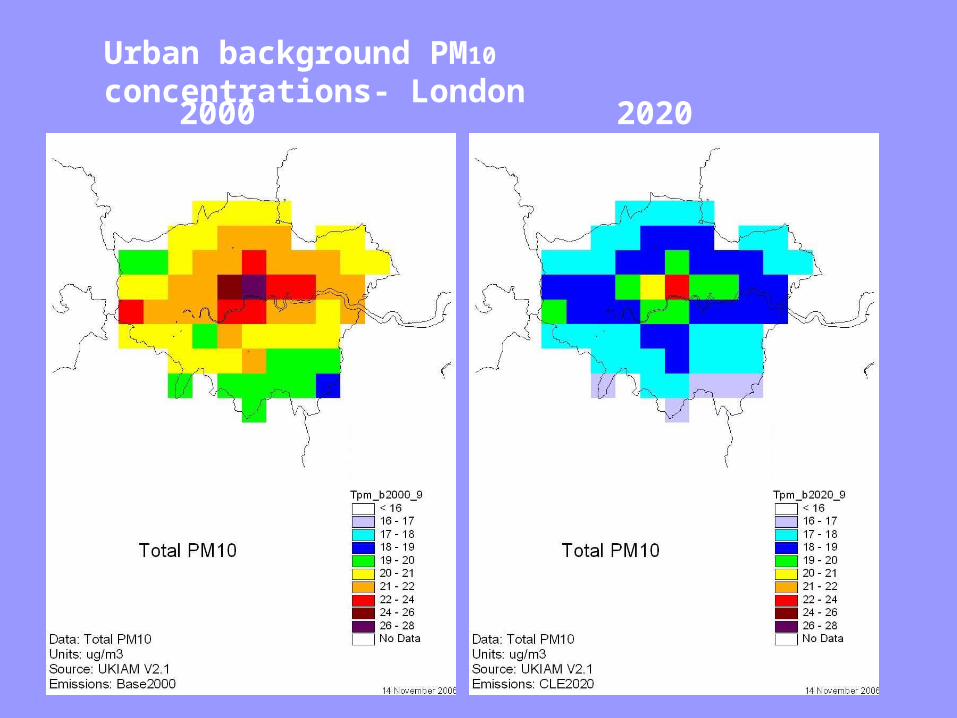
Modelling urban background concentrations-PPM model
Illustrations for particulate matter PM10
Modelling NO2, and urban ozone deficit
Current developments including roadside concentrations in relation to AQ limit values
ATMOSPHERIC MODELLING:
Imported: EMEP
+ ASAM tool
FRAME(CEH)
PPM(Imperial)
BRUTAL (Imperial)
UK Integrated Assessment Model: UKIAM
UK SOURCES
Projected UK emissions:
NETCEN
ENTEC,CEH
Abatement options and costs
ENTEC
NARSES
SHIPPING
ENTEC
ENVIRONMENTAL CRITERIA:
Ecosystems: CEH
Human health &
Urban air quality
UKIAM->Integrated analysis of either specified scenarios, or optimised selection of abatement options converging to achieve environmental criteria at least cost (Imperial)
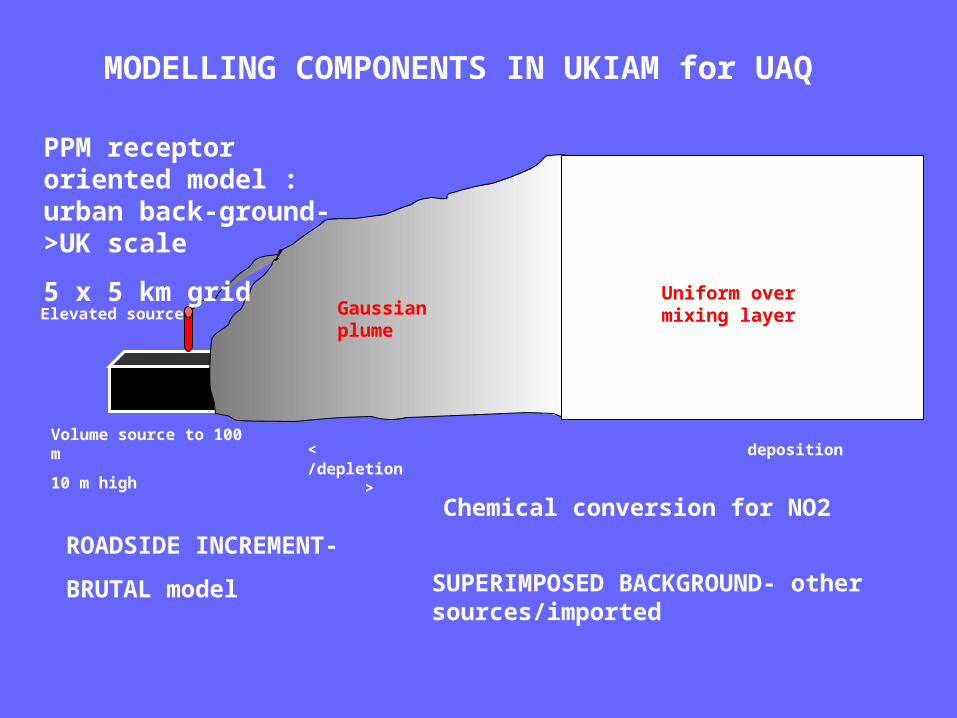
PPM receptor oriented model : urban back-ground->UK scale
5 x 5 km grid
Elevated source
Volume source to 100 m
10 m high
Gaussian plume
Uniform over mixing layer
< deposition /depletion >
SUPERIMPOSED BACKGROUND- other sources/imported
ROADSIDE INCREMENT-
BRUTAL model
MODELLING COMPONENTS IN UKIAM for UAQ
Chemical conversion for NO2
k
Stedman (UK NOx data for 1996) 33
Carslaw NOx data for LAQN for 1998 “ “ “ “ 1997 “ “ “ “ 1996
25
26 24
IIASA – PM in London for 2001(background sites only; R2= .9116)
24
PPM model: contribution from home square 5x5 km
29-33
Comparison empirical modelling C= k.E +X
E= emission kT in 5x5km gridsquare, C g/m3
PM10 Modelling
Superimposes:
primary contribution due to UK sources using PPM (PWC 2.2)