Models to quantify excretion of dry matter,nitrogen, phosphorus and carbon in growing pigsfed regional dietsHenry Jørgensen1, Trakarn Prapaspongsa2, Van Thi Khanh Vu3 and Hanne Damgaard Poulsen1*
Abstract
Modern pig production contributes to many environmental problems that relate to manure, especially in areas withhighly intensive production systems and in regions like Asia where the regulative control is not effective. Therefore,the objective of this study was to use three different pig diets varying in dietary protein, fibre and fat asrepresentative for Danish (DK), Thai (TH) and Vietnamese (VN) pig production to develop and evaluate differentapproaches to predict/calculate excretion from growing pigs in comparison with the experimentally determinedvalues.Nine female growing pigs were used in a digestibility and balance experiment. Excretion of dry matter (DM),nitrogen (N), phosphorus (P) and carbon (C) of the experimental diets were determined.Due to the highest dietary fibre content, VN had the lowest digestibility of N, P and C (73, 49, and 73%,respectively) compared with the DK and TH pig diets. From the known diet composition using standard tablevalues on chemical and nutrient digestibly, high accuracy (bias) and low variation was found and the results couldbe used for prediction on chemical composition and excretion in faeces and urine in growing pigs. Calculationbased on standard values regarding nutrient retention in the pig body as used in the Danish manure normativesystem (DMNS) showed likewise to be quite useful for quantifying the total excretion of N and P.Overall, the results demonstrate that simple models that require cheap and normally available information ondietary nutrients can give useful information on nutrient excretion in growing pigs.
BackgroundMany environmental problems like surface water eu-trophication, groundwater pollution, greenhouse gas emis-sions and odour relate to livestock manure especially inregions with intensive production systems. Highly inten-sive pig production has in many countries around theworld resulted in a higher risk of negative environmentalimpact [1-3]. In fact, there are legislative measures to limitenvironmental impacts in many countries, e.g. Denmark,The Netherlands, and France where restrictions on animaldensity have been imposed [4]. However, the amount ofnutrients in manure may exceed the amount that can be
assimilated by crops resulting in nutrient accumulation inagricultural areas [4,5]. The situation is worse in Asiancountries such as Thailand and Vietnam because there areno effective regulations or the regulations are poorlyenforced [6].Nevertheless, pig manure has potential for resource re-
coveries in terms of energy, such as biogas production,and nutrients, such as nitrogen (N) and phosphorus (P)fertilizers. The challenge is how to manage the resourcerecoveries more efficiently with lower effects on the envi-ronment. Many studies have shown that different feedingstrategies can reduce nutrient excretions and greenhousegas emissions by use of lowered dietary nutrient suppliesadapted to the actual physiological requirements in pigs(i.e. phase feeding), use of synthetic amino acids toimprove the utilization of crude protein, or microbial phy-tase supplementation combined with reductions in
* Correspondence: [email protected] of Animal Science, Aarhus University, Blichers Allé 20, P.O. Box50, DK-8830 Tjele, DenmarkFull list of author information is available at the end of the article
inorganic feed phosphates [7-10]. Nahm [9] reported thatmanure N can be decreased with up to 60% by theaddition of synthetic amino acids to improve crude pro-tein and the N utilization by 50% from 28 to 42% [11].Tools to quantify inputs, outputs, and flows of nutri-
ents at animal level is very useful for global design ofmanure management systems that efficiently take intoaccount diet composition and productivity, resource re-covery and environmental protection as well as econ-omy. Therefore, the objective of this study was to usethree different pig diets as representative for Danish(DK), Thai (TH) and Vietnamese (VN) pig production todevelop different approaches to predict/calculate excre-tion from growing pigs in comparison with the experi-mentally determined values.
Materials and methodsIn vivo experimentsComposite diets simulating practical diets used inDenmark (DK), Vietnam (VN) and Thailand (TH) withvaried contents of dietary protein, dietary fibre and fat,respectively were formulated on the basis of feed ingre-dients purchased in Denmark (Table 1). Representativesamples of diets were stored at −18°C for chemicalanalyses.The experimental procedure was similar to Sørensen and
Fernández [12]. Nine sibling female pigs were allocated in-dividually to metabolism cages. Three growing pigs weresubjected to two balance periods for each diet at 40 to
45 kg and 55 to 60 kg body weight - and fed 1.7 and 2 kgfeed per d, respectively. Each balance period consistedof 5 d adaptation and 7 d complete collection of faecesand urine. Faeces and urine were collected quantitativelyeach d during the 7 experimental ds and stored at 5°C.Urine was collected through indwelling Foley catheters[13]. After 7 d the faeces collected from each pig werehomogenized and samples were stored at −18°C untilfurther analysis.The diets, faeces and urine were analyzed chem-
ically. Dry matter was determined by drying samplesto a constant weight at 103°C, and ash was analyzedby incineration at 525°C. Nitrogen was measured bythe Dumas procedure and protein was calculated asN × 6.25 [14]. Carbon was analyzed according toISO-9831 [15]. P was determined by the vanadomo-lybdate colorimetric procedure [16]. Crude fat (HCl-fat) was extracted with diethyl ether after acidhydrolysis [17]. Crude fibre (CF) was assessed by theWeende method [18]. Starch was assayed by an en-zymatic procedure according to Bach Knudsen [19]and sugar was analyzed by the method of Jacobsen[20].
Calculations and statistical analysesBased on the obtained chemical results, the digestibility,retention, utilization and excretions of N, P and C weredetermined according to Sørensen and Fernández [12]and shown in Table 2.The Danish manure normative system (DMNS) cal-
culating N, P, and potassium (K) contents in manurehas been established in order to provide Danishfarmers and authorities with tools for fertilizer plan-ning and control. The system calculates the nutrientflows by considering ex animal, ex housing, and exstorage contents of N, P and K [21]. First, the systemincludes standard values for dietary nutrient content,nutrient digestibility, feed intake, and nutrient reten-tion in the pig body in order to calculate the excre-tion of the nutrients (ex animal). Then, the systemaccounts for losses due to emissions during housingto get ex housing values and finally, losses from emis-sions and denitrification during storage are subtracted(ex storage). In the present study, the excretion of Nand P was calculated for a standard (mean) Danish pigbased on the current mean values for dietary protein (N)and P content, digestibility of protein and P, daily feed in-take, and daily N and P retention to give the actual dailyexcretion of N and P for a standard Danish growing-finishing pig in the interval from 30 to slaughtering at105 kg [21-23].Validation of the predicted/estimated results (Tables 3
and 4) was done by test set validation [24] using thepresent experiment. The performance of the prediction
Table 1 Composition and chemical analysis of theexperimental diets
Diet DK VN TH
Ingredients, %
Barley 26.04 - -
Wheat 55.00 15.00 -
Oats - 28.76 -
Pearl millet - - 42.50
Maize - - 22.05
Soybean meal 15.91 15.90 15.00
Wheat bran - 15.00 10.00
Grass/Alfalfa meal - 12.85 -
Vegetable oil - 8.00 -
Fish meal - 3.00 8.00
Limestone (CaCO3) 0.41 1.07 0.76
Salt 0.39 0.22 0.31
Dicalcium phosphate 1.00 - 1.18
Minerals and vitamins 0.20 0.20 0.20
Lysine, methionine, threonine mix 1.05 - -
DK Danish diet, VN Vietnamese diet, TH Thai diet.
Jørgensen et al. Journal of Animal Science and Biotechnology 2013, 4:42 Page 2 of 9http://www.jasbsci.com/content/4/1/42
was evaluated by its prediction error in terms of rootmean square error of prediction (RMSEP):
Bias represents the average difference between pre-dicted and measured Y-values for all samples in the va-lidation or reference data set (ref ) and measure theaccuracy of the prediction model. If there is no syste-matic difference between the average values of the twodata sets, the deviation (bias) will be zero:
Deviation Biasð Þ ¼
Xn
i¼1
yi^−yi;ref
� �
n
Results and discussionIn vivo experiment with pigs fed Danish (DK), Vietnamese(VN) and Thai (TH) based dietsThe chemical composition of the experimental diets isshown in Table 1. Generally, the protein and fat contentwere higher in the VN and TH pig diets compared withthe DK diet whereas the fibre content was highest in theVN diet compared with the TH and the DK diets.In general, no health problems were observed among
the pigs throughout the experiment. Average feed intakefor the DK and the VN was almost identical whereas theTH intake was lower (Table 2). Feed refusals were ob-served for the TH group during the first period andthese pigs consumed 20% less than the other groups,which might be related to the inclusion of pearl milletthat is known to contain tannins affecting palatabilityand reducing feed intake [30]. Therefore, vanilla flavourwas added to TH during the second period resulting inincreased feed intake to almost the same level as the VNand DK diets. The average body weight gain of pigs fedthe TH diet was lower than the VN and DK pigs reflec-ting the lower feed intake of the pigs fed the TH dietwithout added flavour.The analyzed contents for most nutrients reflected the
calculated contents (Table 3) showing that table valueson nutrient contents are quite reliable for the most com-mon feedstuffs. Main feedstuffs in TH were maize andsorghum which are not typically used for pig feeding inDenmark and the use of these feedstuffs resulted inminor deviations from the standard values.
Nutrient digestibility, retention and excretionNutrient balances in terms of intake, retention and ex-cretion per d, total excretion in percentage of intake andthe digestibility of dietary nutrients are summarized inTable 2. The digestibility of N, P and C in the TH andDK diets was very much alike whereas the digestibilitywas the lowest in the VN diet which might be related tothe high crude fibre content in feed. The low P digest-ibility in VN might also be caused by the fact that feedphosphate (dicalcium phosphate, DCP) was solely addedto the DK and TH diets, and it is known that DCP has ahigher P digestibility than plant feedstuffs [31]. Previousstudies have shown that high fibre levels decrease nutri-ent and energy digestibility in pigs [32-34] and increasefermentation and excretion of methane (CH4) to the en-vironment [28]. Fibre can hinder the access of digestiveenzymes to the cell contents [35] and can furthermore in-crease the passage rate of digesta [36]. This may also
Table 2 Mean body weight, feed intake andexperimentally determined nutrient balances andexcretions in the in vivo experiment with pigs fed thethree different diets (LS Mean values for six pigs)
Composition Diet SE1
DK VN TH
Mean body weight, kg 59.7 60.2 57.1 5.12
Feed intake, kg/d 1.80 1.78 1.43 0.21
Feed DM intake, kg/d 1.62 1.63 1.29 0.19
N
N intake, g/d 45.5 51.2 49.2 4.23
N retention, g/d 21.2 23.5 21.2 2.03
Faecal N, g/d 8.79a 13.8b 10.0ab 1.33
Urine N, g/d 15.5 13.9 18.0 2.43
N excretion, % of intake 52.9 54.1 56.1 3.54
N Digestibility, % 80.6a 72.9b 79.9a 1.94
P
P intake, g/d 9.17 8.55 9.99 0.84
P retention, g/d 3.91 4.12 4.34 0.38
Faecal P, g/d 4.39 4.37 4.41 0.42
Urine P, g/d 0.87a 0.05b 1.53c 0.22
P excretion, % of intake 57.2 51.8 59.0 2.69
P digestibility, % 51.9ab 48.7a 55.9b 2.21
C
C intake, g/d 705ab 770a 573b 53.3
Faecal C, g/d 108a 208b 93a 12.5
Urine C, g/d 19.8 20.7 20.7 2.83
C excretion, % of intake 18.2a 29.7b 19.5a 1.00
C digestibility, % 84.6a 72.9b 84.1a 1.03
DK Danish diet, VN Vietnamese diet, TH Thai diet.1Pooled standard error.LS Means values within a row with the same letter are not significantlydifferent at P<0.05 (Least Square Means test).abc: Values in a row with different superscripts differ significantly (P<0.05).
Jørgensen et al. Journal of Animal Science and Biotechnology 2013, 4:42 Page 3 of 9http://www.jasbsci.com/content/4/1/42
decrease the digestibility of nutrients and energy becauseof less access and time available for the digestive enzymes.The N, P and C excretions in faeces and urine are pre-
sented in Table 2 and differed to some extend betweendiets although the total daily excretion of N and P didnot differ significantly between diets. In contrast, thetotal C excretion was 50% higher in VN compared withDK and TH which was due to a much lower C digestibilityin VN. The present study did not result in statistical differ-ences in the urinary N and C excretion between the ex-perimental diets whereas the faecal excretion of N and C
was significantly different. The opposite was true for the Pexcretion. The retention of N and P was almost the samefor all diets and was similar to the values of growing pigsreported by Fernández et al. [37] (21.0 g N and 4.15 g Pper d). Excreted urinary P represents excessive dietary P inrelation to the pigs’ physiological requirement. However,the small amount of excreted P in urine for VN can beregarded as obligatory losses (Table 2), but it seems likelythat VN provided sufficient available P to fulfil the pigs’ Pneed. In general, excessive protein (N) and P intake resultsin higher daily excretion of N and P in urine. Many
Table 3 Analyzed and calculated chemical composition and digestibility of nutrients of the experimental diets(DK, VN and TH)
Analyzed/Estimated (in vivo) Calculated from feedstuff tables1
DM Dry matter, DK Danish diet, VN Vietnamese diet, TH Thai diet.1Bach Knudsen [19], Just et al. [25], NRC [26] Vils and Sloth [27].2Deviations, systematic difference between the calculated using table values and the experimental estimated value.3RMSEP, root mean square error of prediction.4Carbon digestibility calculated by the equation: dcCarbon (%) = −12.15 +1.117 dcOM (%), using data from Jørgensen [28].
Table 4 In vivo estimation and calculated/predicted amount of excreted faeces DM, N, C and urine N of theexperimental diets (DK, VN and TH)
In vivo estimation Calculated from tables 1 Predicted from equations2
DK Danish diet, VN Vietnamese diet, TH Thai diet.1Based on feed intake shown in Table 2 and values calculated from tables (Bach Knudsen [19]; Just et al. [25]; NRC [26]; Vils and Sloth [27]) shown in Table 3.2Based on feed intake shown in Table 2 and equations from Vu et al. [29].3Pooled standard error.4Deviation, systematic difference between the experimental estimated value and that calculated using either table values or predicted values.5RMSEP, root mean square error of prediction.6Urine N calculated assuming a 50% utilization of the digested N.
Jørgensen et al. Journal of Animal Science and Biotechnology 2013, 4:42 Page 4 of 9http://www.jasbsci.com/content/4/1/42
studies show that reductions in unavailable and/orexcess N and P in diet can decrease the excretion ofN and P [38-40].
Calculations and predictions of excretions of faeces,N and CIn addition to the experimentally obtained results, twodifferent models were used to quantify the excretions offaeces DM, N and C. First, the excretions were quanti-fied using published table values on nutrient contents inthe feedstuffs used in the in vivo experiment. Proximateanalysis and digestibility of the used feedstuffs werederived from Just et al. [25], except pearl millet [26],cereals [27] and dietary fibre [19]. The calculated re-sults are shown in Table 3.Second, the excretions of faeces, DM, N and C were
predicted using published equations. Vu et al. [29] pro-posed equations to calculate amounts of faeces andfaeces composition derived from datasets of 285 dietsassayed in digestibility experiments at the Department ofAgricultural Sciences, Aarhus University. Vu et al. [29]showed that the calculated values using these equationsdid not differ significantly between equations with one,two or three parameters. Therefore, Vu et al. [29] de-fined the following criteria for parameterization of theequations, (i) easily obtainable parameters, (ii) as fewparameters as possible, and (iii) a diminutive differencebetween the calculated and the experimental determinedresults. The selected equations from Vu et al. [29] used inthe present study are shown below.
0.0855 × N intake (g/d).Faeces C (g/d) = −98.82 + 68.95 × DM intake (kg/d) +
0.541 × DF (g/kg DM).There were two sets of equations to calculate urinary N
given by Vu et al. [29]. The equation representing dietaryprotein contents from 15 to 26% of DM and protein re-tention between 70 to 160 g/d was selected for the presentstudy.Urine N (g/d) = −28.50 + 0.143 × Crude protein (g/kg
DM) + 13.23 × DM intake (kg/d). The predicted valuesare shown in Table 4 and Figure 1, 2 and 3.Comparing the analyzed values and values obtained
from feedstuff tables on dietary nutrients is shown inTable 3. In general, the difference is very small whichresulted in correspondingly small deviations when thedigestibility of DM, OM, C and N (protein) was calcu-lated based on either the analyzed values or standardvalues from feedstuff tables [19,25-27]. Thus, the cheapand quick approach using table values seems reasonablefor obtaining indicative values on digestibility.
Calculation of the daily excretions by use of table valuesor equationsThe predicted amount of daily excretion of faeces DM,N, C and urine N using either information from tables[19,25-27] or equations [29] is shown in Table 4 andFigure 1 and 2. In general both methods of prediction
Faeces N
0
5
10
15
20
DK VN THDiet
g/da
y
ExperimentDMNSVuTables
Faeces P
0123
4567
DK VN THDiet
g/da
y
ExperimentDMNSAarnink
Faeces C
0
50
100
150
200
250
DK VN THDiet
g/da
y
ExperimentVuTables
Faeces DM
0
0.1
0.2
0.3
0.4
0.5
0.6
DK VN THDiet
kg/d
ay
ExperimentVuTables
Figure 1 Comparison of the daily excretion of faeces DM, N, C and P obtained in the present experiment (Experiment) with the Danishmanure normative system (DMNS), Vu et al. [29] (Vu), calculated amounts based on table values (Tables) and Aarnink et al. [41](Aarnink). The experimental values are expressed as least square means (n = 6) with pooled standard errors. DK Danish diet, VN Vietnamese diet,TH Thai diet.
Jørgensen et al. Journal of Animal Science and Biotechnology 2013, 4:42 Page 5 of 9http://www.jasbsci.com/content/4/1/42
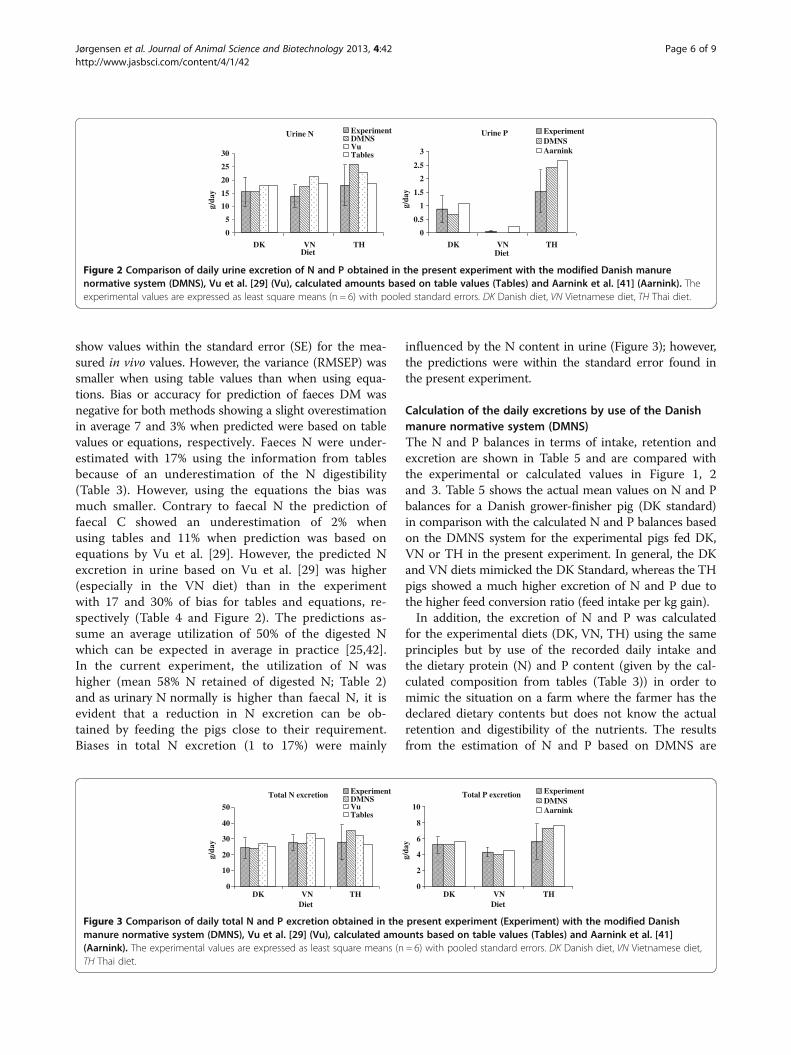
show values within the standard error (SE) for the mea-sured in vivo values. However, the variance (RMSEP) wassmaller when using table values than when using equa-tions. Bias or accuracy for prediction of faeces DM wasnegative for both methods showing a slight overestimationin average 7 and 3% when predicted were based on tablevalues or equations, respectively. Faeces N were under-estimated with 17% using the information from tablesbecause of an underestimation of the N digestibility(Table 3). However, using the equations the bias wasmuch smaller. Contrary to faecal N the prediction offaecal C showed an underestimation of 2% whenusing tables and 11% when prediction was based onequations by Vu et al. [29]. However, the predicted Nexcretion in urine based on Vu et al. [29] was higher(especially in the VN diet) than in the experimentwith 17 and 30% of bias for tables and equations, re-spectively (Table 4 and Figure 2). The predictions as-sume an average utilization of 50% of the digested Nwhich can be expected in average in practice [25,42].In the current experiment, the utilization of N washigher (mean 58% N retained of digested N; Table 2)and as urinary N normally is higher than faecal N, it isevident that a reduction in N excretion can be ob-tained by feeding the pigs close to their requirement.Biases in total N excretion (1 to 17%) were mainly
influenced by the N content in urine (Figure 3); however,the predictions were within the standard error found inthe present experiment.
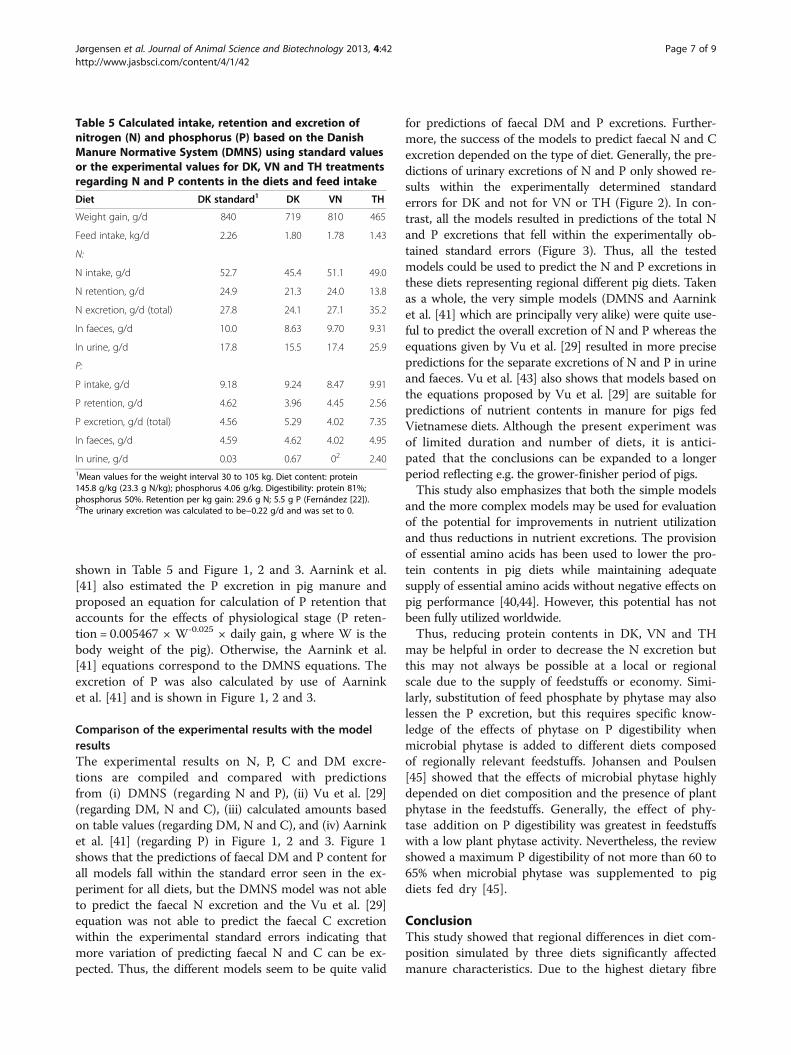
Calculation of the daily excretions by use of the Danishmanure normative system (DMNS)The N and P balances in terms of intake, retention andexcretion are shown in Table 5 and are compared withthe experimental or calculated values in Figure 1, 2and 3. Table 5 shows the actual mean values on N and Pbalances for a Danish grower-finisher pig (DK standard)in comparison with the calculated N and P balances basedon the DMNS system for the experimental pigs fed DK,VN or TH in the present experiment. In general, the DKand VN diets mimicked the DK Standard, whereas the THpigs showed a much higher excretion of N and P due tothe higher feed conversion ratio (feed intake per kg gain).In addition, the excretion of N and P was calculated
for the experimental diets (DK, VN, TH) using the sameprinciples but by use of the recorded daily intake andthe dietary protein (N) and P content (given by the cal-culated composition from tables (Table 3)) in order tomimic the situation on a farm where the farmer has thedeclared dietary contents but does not know the actualretention and digestibility of the nutrients. The resultsfrom the estimation of N and P based on DMNS are
Urine N
0
5
10
15
20
25
30
DK VN THDiet
g/da
y
ExperimentDMNSVuTables
Urine P
0
0.5
1
1.5
2
2.5
3
DK VN THDiet
g/da
y
ExperimentDMNSAarnink
Figure 2 Comparison of daily urine excretion of N and P obtained in the present experiment with the modified Danish manurenormative system (DMNS), Vu et al. [29] (Vu), calculated amounts based on table values (Tables) and Aarnink et al. [41] (Aarnink). Theexperimental values are expressed as least square means (n = 6) with pooled standard errors. DK Danish diet, VN Vietnamese diet, TH Thai diet.
Total N excretion
0
10
20
30
40
50
DK VN THDiet
g/da
y
ExperimentDMNSVuTables
Total P excretion
0
2
4
6
8
10
DK VN THDiet
g/da
y
ExperimentDMNSAarnink
Figure 3 Comparison of daily total N and P excretion obtained in the present experiment (Experiment) with the modified Danishmanure normative system (DMNS), Vu et al. [29] (Vu), calculated amounts based on table values (Tables) and Aarnink et al. [41](Aarnink). The experimental values are expressed as least square means (n = 6) with pooled standard errors. DK Danish diet, VN Vietnamese diet,TH Thai diet.
Jørgensen et al. Journal of Animal Science and Biotechnology 2013, 4:42 Page 6 of 9http://www.jasbsci.com/content/4/1/42
shown in Table 5 and Figure 1, 2 and 3. Aarnink et al.[41] also estimated the P excretion in pig manure andproposed an equation for calculation of P retention thataccounts for the effects of physiological stage (P reten-tion = 0.005467 × W-0.025 × daily gain, g where W is thebody weight of the pig). Otherwise, the Aarnink et al.[41] equations correspond to the DMNS equations. Theexcretion of P was also calculated by use of Aarninket al. [41] and is shown in Figure 1, 2 and 3.
Comparison of the experimental results with the modelresultsThe experimental results on N, P, C and DM excre-tions are compiled and compared with predictionsfrom (i) DMNS (regarding N and P), (ii) Vu et al. [29](regarding DM, N and C), (iii) calculated amounts basedon table values (regarding DM, N and C), and (iv) Aarninket al. [41] (regarding P) in Figure 1, 2 and 3. Figure 1shows that the predictions of faecal DM and P content forall models fall within the standard error seen in the ex-periment for all diets, but the DMNS model was not ableto predict the faecal N excretion and the Vu et al. [29]equation was not able to predict the faecal C excretionwithin the experimental standard errors indicating thatmore variation of predicting faecal N and C can be ex-pected. Thus, the different models seem to be quite valid
for predictions of faecal DM and P excretions. Further-more, the success of the models to predict faecal N and Cexcretion depended on the type of diet. Generally, the pre-dictions of urinary excretions of N and P only showed re-sults within the experimentally determined standarderrors for DK and not for VN or TH (Figure 2). In con-trast, all the models resulted in predictions of the total Nand P excretions that fell within the experimentally ob-tained standard errors (Figure 3). Thus, all the testedmodels could be used to predict the N and P excretions inthese diets representing regional different pig diets. Takenas a whole, the very simple models (DMNS and Aarninket al. [41] which are principally very alike) were quite use-ful to predict the overall excretion of N and P whereas theequations given by Vu et al. [29] resulted in more precisepredictions for the separate excretions of N and P in urineand faeces. Vu et al. [43] also shows that models based onthe equations proposed by Vu et al. [29] are suitable forpredictions of nutrient contents in manure for pigs fedVietnamese diets. Although the present experiment wasof limited duration and number of diets, it is antici-pated that the conclusions can be expanded to a longerperiod reflecting e.g. the grower-finisher period of pigs.This study also emphasizes that both the simple models
and the more complex models may be used for evaluationof the potential for improvements in nutrient utilizationand thus reductions in nutrient excretions. The provisionof essential amino acids has been used to lower the pro-tein contents in pig diets while maintaining adequatesupply of essential amino acids without negative effects onpig performance [40,44]. However, this potential has notbeen fully utilized worldwide.Thus, reducing protein contents in DK, VN and TH
may be helpful in order to decrease the N excretion butthis may not always be possible at a local or regionalscale due to the supply of feedstuffs or economy. Simi-larly, substitution of feed phosphate by phytase may alsolessen the P excretion, but this requires specific know-ledge of the effects of phytase on P digestibility whenmicrobial phytase is added to different diets composedof regionally relevant feedstuffs. Johansen and Poulsen[45] showed that the effects of microbial phytase highlydepended on diet composition and the presence of plantphytase in the feedstuffs. Generally, the effect of phy-tase addition on P digestibility was greatest in feedstuffswith a low plant phytase activity. Nevertheless, the reviewshowed a maximum P digestibility of not more than 60 to65% when microbial phytase was supplemented to pigdiets fed dry [45].
ConclusionThis study showed that regional differences in diet com-position simulated by three diets significantly affectedmanure characteristics. Due to the highest dietary fibre
Table 5 Calculated intake, retention and excretion ofnitrogen (N) and phosphorus (P) based on the DanishManure Normative System (DMNS) using standard valuesor the experimental values for DK, VN and TH treatmentsregarding N and P contents in the diets and feed intake
Diet DK standard1 DK VN TH
Weight gain, g/d 840 719 810 465
Feed intake, kg/d 2.26 1.80 1.78 1.43
N:
N intake, g/d 52.7 45.4 51.1 49.0
N retention, g/d 24.9 21.3 24.0 13.8
N excretion, g/d (total) 27.8 24.1 27.1 35.2
In faeces, g/d 10.0 8.63 9.70 9.31
In urine, g/d 17.8 15.5 17.4 25.9
P:
P intake, g/d 9.18 9.24 8.47 9.91
P retention, g/d 4.62 3.96 4.45 2.56
P excretion, g/d (total) 4.56 5.29 4.02 7.35
In faeces, g/d 4.59 4.62 4.02 4.95
In urine, g/d 0.03 0.67 02 2.401Mean values for the weight interval 30 to 105 kg. Diet content: protein145.8 g/kg (23.3 g N/kg); phosphorus 4.06 g/kg. Digestibility: protein 81%;phosphorus 50%. Retention per kg gain: 29.6 g N; 5.5 g P (Fernández [22]).2The urinary excretion was calculated to be−0.22 g/d and was set to 0.
Jørgensen et al. Journal of Animal Science and Biotechnology 2013, 4:42 Page 7 of 9http://www.jasbsci.com/content/4/1/42
content, VN had the lowest digestibility of N, P and C(73, 49, and 73%, respectively) compared with the DKand TH pig diets. Very simple input–output modelsusing either standard table values of the feedstuffs orstandard values regarding nutrients retention in the pigbody (like DMNS) seem quite useful in order to quantifythe total excretion of N and P whereas the newly devel-oped equations derived from datasets of almost 300 dietswere very useful to predict the divided excretions ofDM, N and C in faeces and in urine. In conclusion, thesesimple models seem to be quite robust and thus veryuseful as they are based on parameters and informationthat are available at a low cost under practical conditions.However, more experimental data have to be available andintegrated if the effects of e.g. microbial phytase additionsshould be included in a further refined model.
AbbreviationsDMNS: Danish manure normative system; RMSEP: Root men square errorof prediction; DF: Total dietary fibre calculated as the residual fraction aftersubtraction of the analysed content of sugar, starch, crude protein, crude fatand ash from the dry matter.
Competing interestsThe authors declare that they have no competing interests.
Authors’ contributionsTP and VTKV carried out the experimental trial, performed the statistics anddrafted the manuscript. HJ and HDP participated in design and coordinationof the study. All authors read and approved the final manuscript.
AcknowledgementsThis study was partially supported by a grant from the Danish Ministryof Foreign Affairs to the project SUSANE-II (Optimizing environmentallyfriendly biogas production from livestock manure for the reduction ofgreen house gas emissions). The authors would like to thank the staff fortaking care of the pigs and the lab technicians for analyzing the samples.Finally, Dr. J.A. Fernández, Prof. J.A. Hansen and Prof. S.G. Sommer areacknowledged for their advice.
Author details1Department of Animal Science, Aarhus University, Blichers Allé 20, P.O. Box50, DK-8830 Tjele, Denmark. 2Department of Civil and EnvironmentalEngineering, Faculty of Engineering, Mahidol University, 25/25Puttamonthon, Salaya, Nakorn Pathom 73170 Thailand. 3National Institute ofAnimal Sciences, Thuy Phuong, Tu Liem, Hanoi, Vietnam.
Received: 4 July 2013 Accepted: 30 October 2013Published: 9 November 2013
References1. Devendra C: Perspectives on animal production systems in Asia. Livest Sci
2007, 106(1):1–18.2. Poulsen HD: Phosphorus utilisation and excretion in pig production. J Environ
Qual 2000, 29:24–27.3. Sorensen JT, Edwards S, Noordhuizen J, Gunnarsson S: Animal production
systems in the industrialised world. Rev Sci Tech-Off Int Epiz 2006,25(2):493–503.
4. Jongbloed AW, Poulsen HD, Dourmad JY, van der Peet-Schwering C:Environmental and legislative aspects of pig production in TheNetherlands, France and Denmark. Livest Prod Sci 1999, 58(3):243–249.
5. Kyllingsbæk A: Nutrient balances and nutrient surpluses in Danishagriculture 1979–2002 – Nitrogen Phosphorus Potassium. 2005,116:100pp. DJF Report no. 116 Research Centre Foulum: Danish Institute ofAgricultural Sciences.
6. IAEA-TECDOC-1582: Guidelines for Sustainable manure Management in AsianLivestock Production Systems. Animal Production and Health Section ed.Vienna, Austria: IAEA; 2008.
7. Jondreville C, Revy PS, Dourmad JY: Dietary means to better control theenvironmental impact of copper and zinc by pigs from weaning toslaughter. Livest Prod Sci 2003, 84(2):147–156.
8. Monteny GJ, Bannink A, Chadwick D: Greenhouse gas abatement strategiesfor animal husbandry. Agric Ecosyst Environ 2006, 112(2–3):163–170.
9. Nahm KH: Efficient feed nutrient utilization to reduce pollutants inpoultry and swine manure. Critical Rev Environ Sci Technol 2002, 32(1):1–16.
10. Sutton AL, Richert BT: Nutrition and feed management strategies toreduce nutrient excretions and odors from swine manure. Water SciTechnol 2004, 49(5–6):397–404.
11. Jensen LS, Schjoerring JK, van der Hoek KW, Poulsen HD, Zevenbergen JF,Paliére C, et al: Benefits of nitrogen for food, fibre and industrialproduction. In The European Nitrogen Assessement. Sources, Effects and PolicyPerspectives. 1st edition. Edited by Sutton MA, Howard CM, Erisman JW,Billen G, Bleeker A, Greenfelt P, et al. Cambridge, UK: Cambridge UniversityPress; 2011:32–61.
12. Sørensen P, Fernández JA: Dietary effects on the composition of pigslurry and on the plant utilization of pig slurry nitrogen. J Agr Sci 2003,140:343–355.
13. Jørgensen H, Fernandéz JA: Chemical composition and energy value ofdifferent fat sources for growing pigs. Acta Agric Scand Sect A Anim Sci2000, 50:129–136.
14. Hansen B: Determination of Nitrogen as elementary-N, an alternative toKjeldahl. Acta Agr Scand 1989, 39(2):113–118.
15. ISO-9831: Animal Feeding Stuffs, Animal Products, and Faeces or Urine -Determinationof Gross Calorific Value - Bomb Calorimeter Method. Geneve, Switzerland:International Organization for Standardization; 1998:28pp.
16. Stuffins CB: The determination of phosphate and calcium in feedingstuffs. Analyst 1997, 92:107–111.
17. Stoldt W: Vorslag zur Vereinheitlichung der Fettbestimmung inLebensmitteln. Fette und Seifen 1952, 54:206–207.
18. Tecator: Determination of Crude Fibre in Some Feed and Food Samples byUsing the Fibertec System and Weende Method. Application Note 01.Høganæs, Sweden: Tecator; 1978.
19. Bach Knudsen KE: Carbohydrate and lignin contents of plant materialsused in animal feeding. Anim Feed Sci Technol 1997, 67:319–338.
20. Jacobsen EE: Sukker og stivelse (LHK) - ny analysemetode. Medd BiotekniskInstitut, ATV 1981, 98:39–54.
21. Poulsen HD, Lund P, Sehested J, Hutchings N, Sommer SG: Quantificationof Nitrogen and Phosphorus in Manure in the Danish Normative System.In DIAS Report - 12th Ramiran International Conference. DIAS Report no. 123.Edited by Petersen SO. Research Centre Foulum, Denmark: Danish Instituteof Agricultural Sciences; 2006:105–107.
22. Fernández JA: Deposition and content of N, P and K in finishing pigs. InNormtal for husdyrgødning [Standard values for farm manure]. Edited byDamgaard Poulsen D, Friis Kristensen V. Research Centre Foulum: DanishInstitute of Agricultural Sciences; 1997:102–112. Report No.: 736.
23. Poulsen HD: Standard values for nutrient contents of farm manure. 2009.http://anis.au.dk/normtal/.
24. Esbersen KH: Multivariate Data Analysis. In Practice. 5th edition. Oslo:CAMO Process AS; 2002:598.
25. Just A, Jørgensen H, Fernández JA, Bech-Andersen S, Hansen NE: TheChemical Composition, Digestibility, Energy and Protein Value of DifferentFeedstuffs for Pigs. 556. Report from the National Institute of Animal Science.Denmark: National Institute of Animal Science; 1983:97pp.
26. National Research Council: United States - Canadian Tables of Feed Composition.Third revision ed. Washington, D.C: National Academy Press; 1982:148pp.
27. Vils E, Sloth NM: Næringsindhold i korn fra høsten 2005 [Nutrient contentin cereals from harvest 2005]. 2005:1–8. http://vsp.lf.dk/Publikationer/Kilder/Notater/2005/0530.aspx.
28. Jørgensen H: Methane emission by growing pigs and adult sows asinfluenced by fermentation. Livest Sci 2007, 109(1–3):216–219.
29. Vu VTK, Prapaspongsa T, Poulsen HD, Jørgensen H: Prediction of manurenitrogen and carbon output from grower-finisher pigs. Anim Feed SciTechnol 2009, 151(1-2):97–110.
30. FAO: Sorghum and Millet in Human Nutrition. FAO Food and Nutrition Series.No. 27. Rome, Italy: FAO; 1995.
Jørgensen et al. Journal of Animal Science and Biotechnology 2013, 4:42 Page 8 of 9http://www.jasbsci.com/content/4/1/42
32. Just A, Jørgensen H, Fernández JA: Prediction of metabolizable energy forpigs on the basis of crude nutrients in the feeds. Livest Prod Sci 1984,11(1):105–128.
33. Len NT, Lindberg JE, Ogle B: Digestibility and nitrogen retention of dietscontaining different levels of fibre in local (Mong Cai), F1 (Mong Cai xYorkshire) and exotic (Landrace x Yorkshire) growing pigs in Vietnam.J Anim Physiol a Anim Nutr 2007, 91(7–8):297–303.
34. Noblet J, Perez JM: Prediction of digestibility of nutrients and energy valuesof pig diets from chemical analysis. J Anim Sci 1993, 71(12):3389–3398.
35. Bach Knudsen KE, Jensen BB, Hansen I: Digestion of polysaccharides andother major components in the small and large intestine of pigs fed ondiets consisting of oat fractions rich in β-D-glucan. Br J Nutr 1993,70(2):537–556.
36. Low AG: Role of Dietary Fibre in Pigs Diets. In Recent Developments in PigNutrition 2. Edited by Cole DJA, Haresign W, Garnsworthy PC. Nottingham:Nottingham Press; 1993:137–161.
37. Fernández JA, Poulsen HD, Boisen S, Rom HB: Nitrogen and phosphorusconsumption, utilisation and losses in pig production: Denmark.Livest Prod Sci 1999, 8(3):225–242.
38. Jongbloed AW, Lenis NP: Alteration of nutrition as a means to reduceenvironmental-pollution by pigs. Livest Prod Sci 1992, 31(1–2):75–94.
39. Knowlton KF, Radcliffe JS, Novak CL, Emmerson DA: Animal managementto reduce phosphorus losses to the environment. J Anim Sci 2004,82(13 suppl):E173–E195.
40. Portejoie S, Dourmad JY, Martinez J, Lebreton Y: Effect of lowering dietarycrude protein on nitrogen excretion, manure composition and ammoniaemission from fattening pigs. Livest Prod Sci 2004, 91(1–2):45–55.
41. Aarnink AJA, van Ouwerkerk ENJ, Verstegen MWA: A mathematical modelfor estimating the amount and composition of slurry from fatteningpigs. Livest Prod Sci 1992, 31(1–2):133–147.
42. Just A: The net energy value of crude (catabolized) protein for growth inpigs. Livest Prod Sci 1982, 9(3):349–360.
43. Vu TKV, Sommer SG, Vu CC, Jørgensen H: Assessing nitrogen andphosphorus in excreta from grower-finisher pigs fed prevalent rations inVietnam. Asian-Australas J Anim Sci 2010, 23:279–286.
44. Canh TT, Sutton AL, Aarnink AJA, Verstegen MWA, Schrama JW, Bakker GCM:Dietary carbohydrates alter the fecal composition and pH and theammonia emission from slurry of growing pigs. J Anim Sci 1998, 76(7):1887–1895.
45. Johansen K, Poulsen HD: Substitution of inorganic phosphorus in pigdiets by microbial phytase supplementation - a review. Pig News and Inf2003, 24(3):77–82.
doi:10.1186/2049-1891-4-42Cite this article as: Jørgensen et al.: Models to quantify excretion of drymatter, nitrogen, phosphorus and carbon in growing pigs fed regionaldiets. Journal of Animal Science and Biotechnology 2013 4:42.
Submit your next manuscript to BioMed Centraland take full advantage of:
• Convenient online submission
• Thorough peer review
• No space constraints or color figure charges
• Immediate publication on acceptance
• Inclusion in PubMed, CAS, Scopus and Google Scholar
• Research which is freely available for redistribution
Submit your manuscript at www.biomedcentral.com/submit
Jørgensen et al. Journal of Animal Science and Biotechnology 2013, 4:42 Page 9 of 9http://www.jasbsci.com/content/4/1/42