1101 Pennsylvania Ave. NW, Suite 600 Washington, DC 20004 P 202.756.2971 F 866.808.6585 www.hanoverresearch.com MARKET EVALUATION SURVEYING DATA ANALYSIS BENCHMARKING INNOVATIVE PRACTICES LITERATURE REVIEW Models Used to Determine Academic Program Costs and Viability In this report, The Hanover Research Council explores the financial models used by colleges and universities to determine net revenues and profits generated by specific academic departments and athletic teams with the goal of assessing program viability.
Transcript
1101 Pennsylvania Ave. NW, Suite 600 Washington, DC 20004
P 202.756.2971 F 866.808.6585 www.hanoverresearch.com
MARKET EVALUATION SURVEYING DATA ANALYSIS BENCHMARKING INNOVATIVE PRACTICES LITERATURE REVIEW
Models Used to Determine Academic Program Costs and Viability
In this report, The Hanover Research Council explores the financial models used by colleges and universities to determine net revenues and profits generated by specific academic departments and athletic teams with the goal of assessing program viability.
In this report we aim to characterize models used by colleges and universities in the determination of the financial viability of academic and athletic programs. We define small college as one with a student population between 500 and 1000 students, and larger institutions as those with a student population over 1000 students. The report is divided into four primary sections:
A general overview of financial models used at colleges and universities;
Examples of program viability models employed by small colleges and general guidelines for program viability assessment;
Examples of financial viability models employed by larger universities; and,
A discussion of financial assessment of athletics programs.
Because, unlike public institutions, small private colleges are under no state or federal obligation to post financial data publicly, such information can be difficult to find. Additionally, even when such data is available, the actual method by which figures were ascertained may remain undisclosed. As a result, we have attempted to offer the best characterization possible of methods that colleges and universities of all sizes and types employ in determining the viability of academic programs, based on annual reports, self-study materials, and strategic planning documents, as well as financial documentation when available. We conclude with a summary of key findings.
Reviewing internal documents and reports at several colleges and universities, this section illustrates the many general and specific principles used to determine the financial viability of academic programs. Although the frameworks for program viability decisions vary considerably from one institution to the next, several similarities stand out among institutions. Before examining the specific measurements used by individual institutions, it is useful to understand some key unifying concepts.
First, nearly every college or university that uses a prescribed viability framework does so as part of a routine audit of every department or degree program offered. At many institutions, university administrators require that each program be examined for academic and financial viability on a regular schedule, typically every 5 or 7 years. Routine audits are performed so that the institutions understand the viability of all academic offerings regardless of perceived strength. Additionally, this structure allows for data from thriving programs to be used to create benchmarks for future audits within or between programs.1
Secondly, hard or inflexible standards for financial (or academic) metrics appear to be very rare, except in reference to student enrollment levels. Viability auditors are much more likely to ask whether a department brings in “substantial funds” from external sources rather than designating a specific amount. Related terms like “adequate” and “sufficient” are equally prevalent. Though the lack of basic numerical figures is somewhat irrelevant, as not all of the institutions reviewed would be considered peers to XYZ University, it points to a larger issue. Rather than employing prescribed rules that cannot be amended, most colleges recognize that financial viability is defined subjectively. Historical data or figures from related programs can be used to decide whether a department is generating an institutionally-defined level of sufficient revenue, but the available figures are nearly always taken in context.
Third, most mentions of financial viability follow a long list of academic- and performance-related requirements, indicating that high quality academic performance is the most important factor at most of the institutions studied. Indeed, even in regard to issues related to generating revenue, many institutional audits appear to be more concerned with program popularity than with viability. This is not to say that financial factors are unimportant, rather, economic concerns are simply understood as part of a grander scheme of a fully functional and efficient institution with an established mission statement. “Is demand for program X high enough to justify its costs?” appears to be a more important question than “Is X program losing money?” That being said, this report will not discuss program quality issues even though many viability frameworks make explicit mention of these metrics alongside economic concerns.
Typical Financial Viability Metrics
1 See http://www.roosevelt.edu/provost/programReview/schedule.htm for an example of viability audit
Though the list of metrics discussed below is far from comprehensive, understanding the types of questions that are typically asked of individual departments or degree programs should help college administrators decide what types of specific measurements are useful in a viability scorecard or related data compilation tool. Again, the examples discussed below are most often used in tandem with a host of related viability questions, the mention of some of which is superfluous within the confines of the economic debate.
Enrollment-Based Measurements
At its most crude and basic formulation, the economic viability of an academic program is largely determined by the number of students enrolled in the program. Students pay tuition and, in turn, earn degrees in certain disciplines, and therefore, higher student enrollments in a program typically presume more money earned for the institution.
The most basic calculation for enrollment revenue (the number of students in a program multiplied by total tuition) is inadequate for a number of reasons, the least of which being that students typically take courses and participate in activities outside of their degree program. At the same time, it is clear that a course or program that fails to attract students should not be allowed to continue to utilize limited institutional resources. Recognizing this conundrum, many colleges have responded by establishing minimum enrollment standards. Rather than relying on elaborate calculations to determine whether a program is sufficiently popular, these institutions state that programs must simply enroll X number of students in order to satisfy demand.
The Alabama Commission on Higher Education features a very basic version of the minimum enrollment viability metric. At all Alabama higher education institutions that receive state funding, one condition for state allocations is based on graduation rates within each department. In order to be eligible for state funding, academic departments at 4-year institutions must graduate at least a minimum number of students, on average, over a 5-year period:
7.5 graduates/year in bachelor’s programs;
3.5 graduates/year in master’s programs;
3.0 graduates/year in education specialist programs;
2.25 graduates/year in doctoral programs.2
2 Section 16-5-8 of the Alabama Code. See http://www.legislature.state.al.us/codeofAlabama/1975/16-5-
These minimum enrollment standards are not accompanied by other requirements; however, they reinforce the idea that there should be at least a minimum number of students enrolled in a program in order to justify continued funding of the program.
While the Alabama model is basic enough to allow for flexibility within the different public colleges and universities within the state, it may be perceived as too simplistic. Mitchell Community College (MCC) in Statesville, North Carolina, alternatively, uses a similar approach that is more comprehensive and explicit. Using a 14-point viability standard worksheet, MCC tracks several enrollment-based metrics that provide for a much greater degree of program flexibility. These include the following requirements:
Each program must feature an average annual FTE enrollment of at least 10 students over a 5-year period;
Each program must feature an average annual enrollment of at least 10 students (full-time or part-time) over a 3-year period;
FTE enrollments in each program should not decline by more than 25 percent over a 5-year period;
For each program, student to faculty ratios should be no less than 7 to 1;
Each program must graduate at least 7 students every 5 years.3 Instead of relying solely on graduation rates (which fail to take attrition rates into consideration), the MCC model uses a variety of measurements to determine whether a sufficient number of students are enrolled in classes.
Although both the Alabama and the MCC examples provide figures that may not be directly applicable to XYZ University, they are useful in that they provide the type of model that might be employed in order to use enrollment as an indicator of the economic viability of academic programs.
Other formulations include simply tracking whether or not enrollments are increasing or decreasing over time. West Virginia University (WVU) asks this question when evaluating graduate programs, and the resulting figures are considered alongside several other academic and financial issues (such as “has a continuing need for this program been demonstrated?”).4 In a related program, Roosevelt University in Chicago considers average class size over time as well as student to faculty ratios as part of an elaborate framework for evaluating each degree program. The university
3 "Program Viability Factors." Mitchell Community College,
http://www.mitchellcc.edu/sacs/compliance/docs/ProgramViabilityFactors.pdf 4 "Graduate Council Program Review Guidelines/Rubric." West Virginia University,
http://graduatecouncil.wvu.edu/r/download/14208, p. 1.
also calculates direct program expenditures per student, another potential enrollment-based data point.5
Activity-Based Costing and Cost Benefit Analysis Models
Activity-Based Costing Models
As a general framework for cost management, activity-based costing (ABC) models may assist higher education administrators in identifying opportunities for maximizing profitability and implementing strategic growth strategies. According to a proposal completed by the President of the Northwest Missouri State University, activity-based costing “identifies activities as the fundamental cost object of the organization,” by utilizing the “cost of these activities as the basis for assigning costs to other cost objects…”6 In general, the ABC model is comprised of four key steps:7
Identify all activities used to achieve outcomes
Determine the cost of each activity
Assign costs to outcomes on the basis of the amount of each activity used by the outcome
Re-assign resources to those activities that result in benefits to institutional outcomes and conduct internal benchmarking against other institutions
As noted by Northwest Missouri State University, integrating an ABC model into the University’s planning process, and at higher education institutions in general, is associated with numerous strategic benefits, such as greater profitability and additional value-added.8 Other benefits that may accrue as a result of using the model may include: more precise cost information for costing and pricing; improved cost control and management; improved insight into cost causation; improved performance measures; and more accurate “customer profitability analysis.”9
A key challenge in applying the ABC model to the realm of higher education exists in identifying reliable measures or key quality indicators for programs and activities. However, a 2000 report by Ernst & Young, “A Study to Develop a Costing Methodology for the Australian Higher Education Sector,” identifies some critical areas of identification that may permit a higher education institution to achieve its strategic and financial goals:10
5 "Guidelines for Self-Study." Roosevelt University,
http://www.roosevelt.edu/provost/programReview/selfStudy.htm 6 Dean Hubbard, Northwest Missouri State University. “Quality, Cost, and Value-Added in Comprehensive
Institutions of Higher Education: Toward New, Testable Approaches.” http://www.offtech.com.au/abc/ABC_PDF/sloan.pdf: 7.
7 Ibid. 8 Ibid., 8. 9 Ibid. 10 Ernst & Young. (May 2000). “A Study to Develop a Costing Methodology for the Australian Higher
Cost Benefit Analysis A cost benefit analysis model identifies, determines, and adds all gains, and subsequently does the same for expenditures, ultimately resulting in a comprehensive economic assessment of a program’s impact, whether producing deficit or profit. The analysis considers economic trends, investment portfolios, assets, and all sources generating income and expense. It can be used for large-scale projects and budgeting concerns, and also for determining the viability of specific small-scale projects and investments. Texas State University, for example, was commissioned by the San Marcos community to determine if the building of a community conference center would be a viable project. In the description of this study, the researchers explain the model and its use in this context:
Benefit-cost analysis identifies how to properly assess the benefits and costs associated with a project using monetary amounts. The conceptual framework links these benefits and costs associated with conference centers to existing scholarly literature. The operationalization of the benefit and cost variables from the conceptual framework are identified, showing how the research measured each variable of the project. To ensure a credible study, an appropriate discount rate and time horizon were used to calculate the viability of the project. The decision criteria of present value and net present value were used to determine the viability of the project.11
Ultimately the benefit-cost analysis determined that this project would not be economically sustainable for the community.
In colleges and universities, benefit-cost analysis is used for a variety of purposes. In one working paper from Umeå University in Sweden, it is applied to determine the
http://www.dest.gov.au/archive/highered/otherpub/costing/costing.pdf: 7. 11 Tanous, William Brandon, "A Benefit-Cost Analysis of the San Marcos Conference Center in San Marcos,
Texas" (2007). Applied Research Projects. Paper 266. http://ecommons.txstate.edu/arp/266
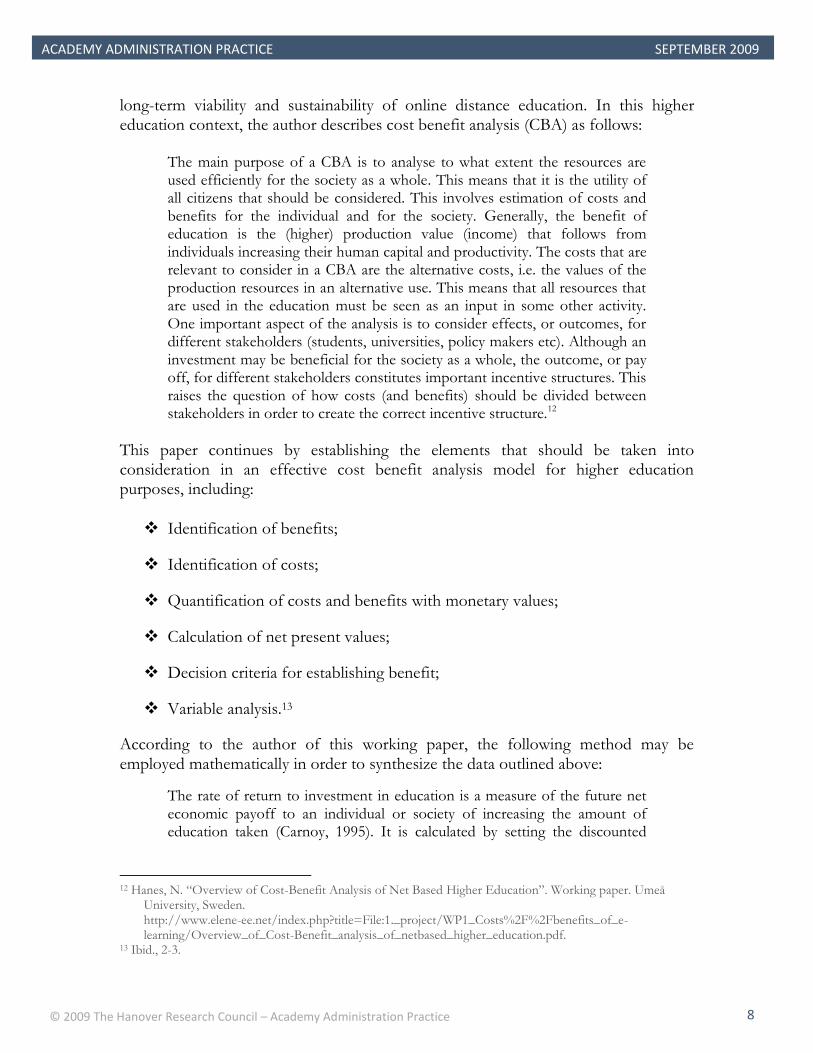
long-term viability and sustainability of online distance education. In this higher education context, the author describes cost benefit analysis (CBA) as follows:
The main purpose of a CBA is to analyse to what extent the resources are used efficiently for the society as a whole. This means that it is the utility of all citizens that should be considered. This involves estimation of costs and benefits for the individual and for the society. Generally, the benefit of education is the (higher) production value (income) that follows from individuals increasing their human capital and productivity. The costs that are relevant to consider in a CBA are the alternative costs, i.e. the values of the production resources in an alternative use. This means that all resources that are used in the education must be seen as an input in some other activity. One important aspect of the analysis is to consider effects, or outcomes, for different stakeholders (students, universities, policy makers etc). Although an investment may be beneficial for the society as a whole, the outcome, or pay off, for different stakeholders constitutes important incentive structures. This raises the question of how costs (and benefits) should be divided between stakeholders in order to create the correct incentive structure.12
This paper continues by establishing the elements that should be taken into consideration in an effective cost benefit analysis model for higher education purposes, including:
Identification of benefits;
Identification of costs;
Quantification of costs and benefits with monetary values;
Calculation of net present values;
Decision criteria for establishing benefit;
Variable analysis.13
According to the author of this working paper, the following method may be employed mathematically in order to synthesize the data outlined above:
The rate of return to investment in education is a measure of the future net economic payoff to an individual or society of increasing the amount of education taken (Carnoy, 1995). It is calculated by setting the discounted
12 Hanes, N. “Overview of Cost-Benefit Analysis of Net Based Higher Education”. Working paper. Umeå
value of costs (Ci) and benefits (Bi) over time equal to zero and solving for the implicit discount rate r:14
Σ Bt = Σ Ct
(1+r)t (1+r)t
Research indicates that cost benefit analysis is an effective choice for determining whether a specific program or investment should be initiated. The model is simple enough that it, in theory, should not be difficult to apply to more specific contexts concerning the viability of existing programs, though it is typically not implemented in this way. At the University of Wisconsin, for example, the question of financial viability is a major consideration in the approval process for the creation of new degree programs. Recognizing that external funding may be a deciding factor for university administrators, individuals wishing to propose new programs must document the amount and source of all expected external income.15
Given the value of financial considerations, in the remainder of this report, we offer selected case studies highlighting strategies for assessing viability – both program and financial – at small and large colleges and universities across the nation.
14 Ibid., 6. 15 "Authorization to Implement New Program Proposal." University of Wisconsin System,
Examples of Program Viability Measures at Small Colleges
Aside from the net profitability of academic degree programs, additional qualitative and quantitative measures may be taken into consideration when assessing the viability of particular degree offerings. In this section, we explore various strategies for assessing program viability at two small colleges: Kansas Wesleyan University and Nebraska Methodist College. In light of the relative scarcity of data concerning financial assessment measures at small colleges, we conclude with a broad overview of some general recommendations concerning program viability at higher education institutions of all sizes. To this effect, we posit financial profitability as a key component in the overarching assessment of program viability. Small College Case Study 1: Kansas Wesleyan University Overview Kansas Wesleyan University (KWU) is a small private liberal arts college with approximately 800 students located in Salina, Kansas. Founded in 1886, the University now offers undergraduate degrees in 25 different majors, as well as the Master of Business Administration.16 Program viability is a typical concern for the institution, since its total endowment is less than $20 million, and is apparent in KWU’s current strategic plan and recent annual reports.17 Program Viability Measures
According to its 2006 self-study created as part of the preparation of the current strategic plan, KWU aims to analyze program viability as a means to identifying enrollment trends, which ultimately contribute directly to net revenues:
Enrollment management includes financial viability. Although increased enrollment is always possible to achieve, the difficulty lies in attaining adequate enrollment while increasing net revenue and maintaining a positive bottom line on the income statement. What is more important than actual enrollment is the financial viability of the institution and this has been clearly demonstrated in the annual audits. Between 1999-00 and 2005-06, the average net revenue per full-time student increased from $9,690 to $12,378.18
In KWU’s 2002-2003 annual fiscal audit documentation, the institution provides a schedule of changes in unrestricted net assets available for operations as reported at
the end of the 2002 and 2003 fiscal years.19 Among the key sources of income taken into consideration are: revenues and gains from tuition and fees (undergraduate and graduate), gift and grant revenues, investment income, auxiliary enterprises, and transfers. These gains are then compared side-by-side with institutional expenses, including academic programs, academic and institutional support, student services, and other enterprises. To this extent, academic program and other institutional expenses are assessed in light of the total percent of the university’s operating budget. Table 1 provides an example of how costs might be quantified and used for analysis, based on the KWU model:
Table 1: Expenses for Academic Programs20
2002 2003
Program
Amount
Amount as Percentage of
Operations Funding
Amount
Amount as Percentage of
Operations Funding
Art $61K 0.8% $63K 0.8%
English $155K 2.0% $157K 2.0%
Language $83K 1.1% $83K 1.1%
Music $159K 2.0% $154K 2.0%
Speech and Theater
$100K 1.3% $101K 1.3%
Communications $52K 0.7% $49K 0.5%
According to available materials online, this format appears to be the only means by which KWU program viability is determined. There is no evidence of a more sophisticated model based on documents found on the KWU website, but this does not necessarily suggest that the University does not employ a specific cost benefit model that provides greater specificity. Small College Case Study 2: Nebraska Methodist College Overview Nebraska Methodist College (NMC) is a small institution of approximately 600 students with a focus on training in the health professions. One of its central points of pride is that the school “is small enough to really care about each student as an individual and large enough to provide outstanding undergraduate, graduate and certificate programs in nursing and allied health.”21 As a health-focused institution, it
19 Kansas Wesleyan University. “Financial Statements: Years Ended June 30, 2003”.
http://www.kwu.edu/BOT/pdfdocs/Audit03.pdf 20 Ibid. 21 Nebraska Methodist College. “About the College”.
is important that NMC consistently offer up-to-date and relevant programs of instruction for its students. Program Viability Measures NMC relies on an annual qualitative review of all of its programs, and this includes a fiscal evaluation of each program. In the nursing program, for example, the annual review should indicate that there is a “90% match between budget and actual expenditures.”22 Additionally, a reconsideration of policies, including those related to enrollment and retention, is reviewed every other year and whenever any change to policy, whether institutional or departmental, occurs.23 Annual review of student surveys also takes place in order to fulfill the institutional goal of ensuring that “the mission [and] goals of the Nursing Department and expected outcomes of the program are reviewed periodically and revised, as appropriate, to reflect the needs and expectations of the community of interest.”24 These review procedures might be construed as a viability measure of sorts. In determining student satisfaction and outcomes in conjunction with enrollment and budgetary issues, Nebraska Methodist College has a system of checks and balances in place that aims to keep a close eye on programs and to effect change when necessary. Annual reviews of the procedures mentioned here, as well as of many other aspects of NMC programs, are conducted regularly and thoroughly in each department.
In the implementation of new programs, NMC states:
NMC is dedicated to the design and implementation of high-quality educational programs that both serve the community and the student in terms of professional and personal development. As new programs are considered, a variety of factors are reviewed: compatibility with mission; market analysis of job growth; accrediting requirements; competitive programs already offered in the region; costs associated with faculty, staff, labs, and equipment; potential for clinical experience; and interest within the region. Each of these factors must be favorable before a new program is taken before the Board of Directors for approval or any financial investment is made.25
The measurement of effectiveness of existing programs is described as follows:
A broad array of measures is used to track the effectiveness with which the College is carrying out its mission. NMC’s key measures of effectiveness focus on the accomplishments of students, programs, program faculty, and administrators (for example: graduation rates and licensure pass rates); on the efficiency and effectiveness of institutional processes (for example: enrollment, retention, quality improvement, and budget); on the satisfaction of students and other stakeholders (including Alumni); and on the engagement of external stakeholders (for example: collaboration and partnerships). Increasingly, the College is using comparative data from like institutions to evaluate institutional effectiveness.26
The overall process for measuring program viability at NMC suggests that a number of factors must be taken into consideration in order to determine whether or not a program is financially viable. NMC does not disclose a specific model that serves as the fundamental means for this determination; rather, it offers a summary of the type of data that must be considered in program evaluations of this type. Summary of Program Viability Measures The degree to which a program is financially viable and the overall sustainability of a particular program offering are highly interrelated. Assessments used to determine financial viability may also be utilized in the process of campus planning and determining the allocation of existing institutional resources. For this reason, determining the economic profitability of a particular academic offering is a strong indicator of program viability, but is by no means the only measure. Other key indicators, drawn from various institutional planning resources, may include:27
Assessments of program effectiveness and student learning outcomes, enrollment, and retention
Indicators of student and labor-market demand
Relation of the program to the institutional mission and institutional effectiveness plan
Perceptions of students, faculty, campus stakeholders, and the community at-large
In the following section, we examine financial models used to assess program viability at larger U.S. higher education institutions.
26 Ibid., 67. 27 College of San Mateo. “Program Viability Form.”
Examples of Financial Models at Larger U.S. Institutions
Financial models serve as practical tools for strategic decision-makers in the process of assessing program costs. In this section, we explore diverse financial models for calculating the profitability of a particular academic program, including examples from Midlands Technical College, the University of Delaware, and the University of Hawaii. We conclude with a general financial model for state universities for evaluating instructional activities of academic departments.
Midlands Technical College
South Carolina’s Midlands Technical College has an undergraduate enrollment of 11,000 students on four campuses. Its degree programs, as the name of the institution suggests, are primarily in professional and technical fields, including business, information technology, and health sciences. The institution also offers a more general curriculum in the arts and sciences that leads to an associate’s degree.28
The abstract for a 2006 report on assessing financial viability of specific programs from the college states:
Midlands Technical College’s governing board is interested in the cost of programs and challenged the administration to analyze the college’s cost of programs for use in strategic decision-making. Understanding and managing cost is critical in today’s environment of declining revenues from public sources. The college’s credit and noncredit programs were analyzed based on the model used for funding colleges in South Carolina. The model has provided the college a significant tool to better understand its cost of programs and clearly identify programs that subsidize those with higher costs. The model allowed the college to quickly and accurately respond to legislative inquires regarding the cost of educating nurses. As a result, the college received a substantial new allocation from the state in recurring funds for its nursing program. Additionally, a spin-off model that simulates the affect of section sizes and net financial contributions to the college was developed collaboratively with the college’s academic departments. The spin-off model allows the academic departments to make effective faculty loading decisions.29
The state of South Carolina uses a specific funding model, mentioned above, based upon the audited Formula Computation Worksheet (FCW), which is applied in combination with other figures such as the number of full-time faculty in order to determine the distribution of state funds to individual departments, programs, and/or disciplines. Other funding and sources of revenue are determined by student
28 Midlands Technical College. “About MTC”. http://www.midlandstech.edu/FF_acadprg.htm 29 Rhames, R. “An Academic Program Cost Model, A Tool for Strategic Decision-Making”. Midlands
enrollment.30 Additionally, “non-credit state revenue is determined by using the System’s formula for determining reimbursement, which is also based on a converted FTE faculty. Non-credit student revenue is the actual amount earned.”31
According to the financial model used by Midlands Technical College, program cost and revenue assessments are calculated on a per credit basis as follows:32
The credits funded by the state for each CIP code are broken down by discipline and in detail by specific programs. Revenues and expenditures are allocated to the various programs using the state funded credits. State funding for credit programs is determined for each discipline and program in dollars and percentages based on FTE faculty. County, student and other revenue for credit programs is distributed by the percentage of credits funded.
Non-Credit state revenue is determined by using the System’s formula for determining reimbursement, which is also based on a converted FTE faculty. Non-credit student revenue is the actual amount earned. County and other revenue for non-credit is determined by using the converted percentage of credits funded. After allocation of college-wide revenues the total amount of funds earned for each credit and non-credit program is determined. Expenditures follow the NACUBO classification by function. Validations studies are conducted to determine if the expenditures by function are comparable to peer and national institutions. Credit instructional costs, student and capital costs are distributed using FTE faculty, whereas costs for plant, administration and other costs are allocated by credit FTE. Instructional costs for non-credit program are based on actual audited cost and are distributed by FTE faculty to individual programs. Student cost for non-credit programs are allocated using the converted credit FTE in relation to overall total institutional student cost. Administrative, plant, capital and other cost for non-credit programs are distributed using converted credit FTE’s.
In this way, the total cost for both credit and non-credit programs is determined as established above, and is subsequently analyzed in combination with college-wide profits and spending, ultimately resulting in an understanding of the amount of financial gain or loss per credit hour. Overall, this model appears to have been well received by administrators at Midlands Technical College. The model “yielded
reliable and consistent outcomes,” and was tested by various offices within the college, and found by all stakeholders to be sufficient and accurate.33 Among the unique benefits of using this particular model, the College cites the model’s utility in:34
Allowing the College to comprehend both the direct and indirect costs of its programs;
Helping the College to identify subsidized and unsubsidized programs;
Assisting the Administration in allocating institutional resources, making programmatic decisions, and understanding the total impact of those decisions.
University of Delaware
With over 20,000 students, 1,200 faculty members, and approximately 250 degree programs, the University of Delaware undeniably has a vested interest in determining the viability of its programs.35 Among other universities researched for this report, the University of Delaware’s model for determining program viability is among the most detailed and comprehensive.
In a 2003 report, the University of Delaware’s Office of Institutional Advancement introduced its Budget Support Notebook, a computer program designed to help academic departments at that institution keep track of enrollment, teaching load for professors, and the distribution of funds to various endeavors within the department. The program is described in the report as:
…a resource document that academic administrators, chairs, deans, and provost use for decision making. It contains information on instructional, research, and service revenues and expenditures for each college and academic department. In addition to fiscal data, it provides information on instructional workload and productivity measures and the resulting management ratios. Data for three years are given to present trend patterns. A trend showing steadily declining productivity and increasing costs should be viewed as indicators that further, in-depth study of a unit is required to determine the underlying cause of those trends.36
33 Ibid., 5 34 Ibid., 5. 35 University of Delaware. “Facts and Figures”. http://www.udel.edu/IR/fnf/index.html 36 DeMonte, K. “Academic Department Profiles: Creating an Online Budget Support Network”. University of
Delaware Office of Institutional Research and Planning. http://www.google.com/url?sa=t&source=web&ct=res&cd=2&url=http%3A%2F%2Fwww.udel.edu%2FIR%2Fpresentations%2FBudgetSupport.doc&ei=b5CySofhJM-ZlAezssGADw&rct=j&q=revenue+generated+by+academic+major+site%3A.edu&usg=AFQjCNEZA3IHA8gfyTeVohI5j7B4Gv4QUQ
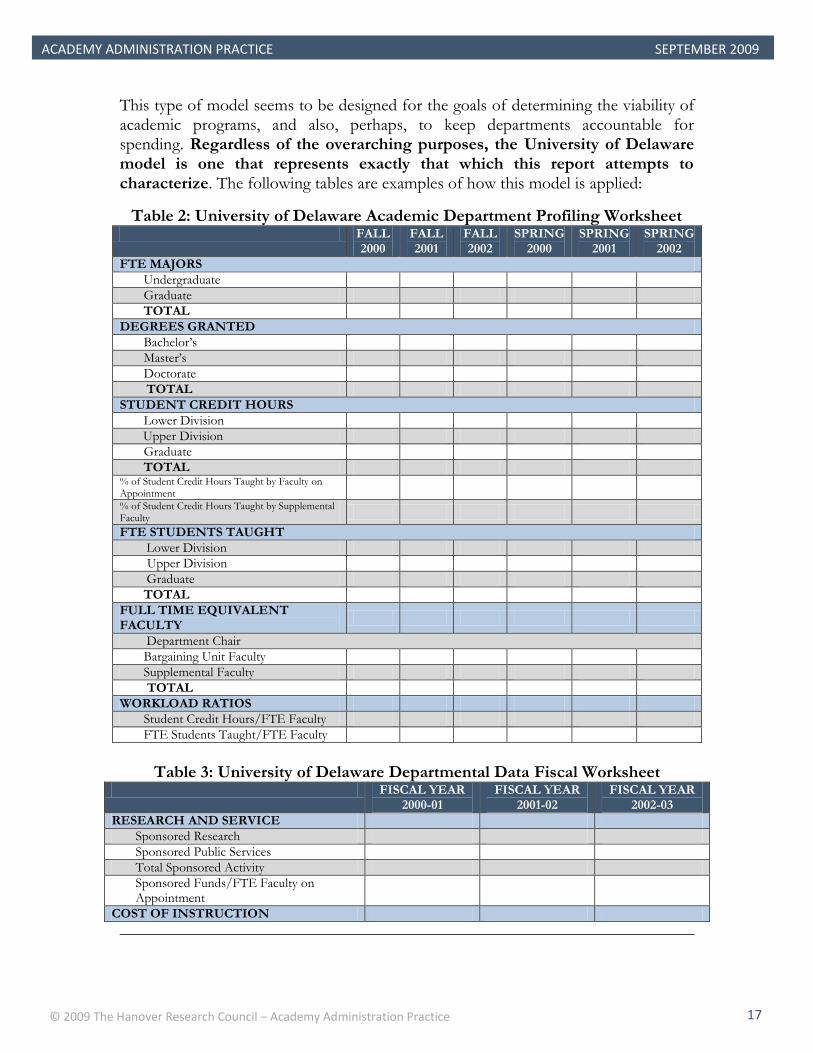
This type of model seems to be designed for the goals of determining the viability of academic programs, and also, perhaps, to keep departments accountable for spending. Regardless of the overarching purposes, the University of Delaware model is one that represents exactly that which this report attempts to characterize. The following tables are examples of how this model is applied:
Table 2: University of Delaware Academic Department Profiling Worksheet FALL
2000 FALL 2001
FALL 2002
SPRING 2000
SPRING 2001
SPRING 2002
FTE MAJORS
Undergraduate
Graduate
TOTAL
DEGREES GRANTED
Bachelor’s
Master’s
Doctorate
TOTAL
STUDENT CREDIT HOURS
Lower Division
Upper Division
Graduate
TOTAL % of Student Credit Hours Taught by Faculty on Appointment
% of Student Credit Hours Taught by Supplemental Faculty
FTE STUDENTS TAUGHT
Lower Division
Upper Division
Graduate
TOTAL
FULL TIME EQUIVALENT FACULTY
Department Chair
Bargaining Unit Faculty
Supplemental Faculty
TOTAL
WORKLOAD RATIOS
Student Credit Hours/FTE Faculty
FTE Students Taught/FTE Faculty
Table 3: University of Delaware Departmental Data Fiscal Worksheet
Earned Income PLUS Sponsored Activity/FTE Faculty on Appointment
Source: University of Delaware
Tables 2 and 3 indicate that the University of Delaware uses a wide variety of figures to determine the viability of programs over a designated period of time. Though the way that the university determines specific costs of the areas quantified is not entirely specified, the model of comparison that is specified offers a useful means for establishing financial measures of program viability.
University of Hawaii
The University of Hawaii (UH) System represents one of the few concrete examples of how higher education institutions have calculated the financial viability of individual academic programs. The UH System provides an “Academic Program Cost and Revenues Template” for each of its member institutions to use as they assess program costs.37 The template is presented in full below.
Table 4: Academic Program Cost and Revenues Template: Sample for the BBA in Entrepreneurship
Provisional Years Projected Years
2007-08
2008-09
2009-10
2010- 11
2011- 12
2012- 13
Students & Student Semester Hours (SSH)
A. Headcount enrollment of majors (Fall) 138 138 138 138 138 138
B. Annual SSH 825 825 825 825 825 825
Direct and Incremental Program Costs
C. Instructional Cost 130,000 144,300 144,300 144,300 144,300 144,300
D. Other Personnel Costs 10,000 10,000 10,000 10,000 10,000 10,000
E. Unique Program Costs 10,000 10,000 10,000 10,000 10,000 10,000
F. Total Direct and Incremental Costs (C+D+E)
150,000 164,300 164,300 164,300 164,300 164,300
Revenue
G. Tuition* 283,025 327,195 327,195 327,195 327,195 327,195
Tuition rate per credit 343 397 397 397 397 397
37 University of Hawaii System, “Academic Program Cost and Revenues Template.”
I. Total Revenue (G+H) 283,388 327,618 327,618 327,618 327,618 327,618
J. Net Cost (Net Incremental Cost of the Program to the Campus) (F-I)
133,388 163,318 163,318 163,318 163,318 163,318
Comparable Cost per SSH
Program Cost Per SSH
K. Total Direct Cost/SSH (F/B) 182 199 199 199 199 199
L. Support Cost/SSH Non-Instructional Exp/SSH System-wide Support Organized Research
269 269 269 269 269 269
M. Total Program Cost/SSH (K+L) 451 468 468 468 468 468
N. Total Campus Expenditure/SSH 600 600 600 600 600 600
Instruction Cost per SSH
O. Program Instruction Cost/SSH (C/B) 158 175 175 175 175 175
P. Comparable Cost/SSH (Note program used for comparison)
451 451 451 451 451 451
*Tuition: Annual SSH x tuition rate/credit **Other sources of revenue, including grants, program fees, etc. Source: University of Hawaii System.
An explanation of the cost totals used in lines C, D and E follows:
Instructional Cost: Direct salary cost for all faculty teaching in the program. Add negotiated collective bargaining increases and keep salary flat thereafter.
Other Personnel Cost: Salary cost (part or full time) for personnel supporting the program (APT, clerical lab support, advisor, etc.). This includes personnel providing necessary support for the program who may not be directly employed by the program and may include partial FTEs.
Unique Program Cost: Costs specific to the program for equipment, supplies, insurance, etc. For provisional years, this would be actual cost. For established years, this would be projected costs using amortization for equipment.38
In line L, support cost per student semester hour is calculated as:
non-instructional expenditure/ssh + systemwide support – organized research
The UH System publishes support cost per student semester hour for each institution in the annual UH Expenditure Report. This report likewise includes total campus expenditures per student semester hour, recorded in line N.
A Proposed General Model for State Universities In a 1981 article written by an upper-level financial administrator at the University of West Florida, the author proposes “a cost-efficiency model designed to provide a basis for evaluation and planning decisions related directly to the instructional activities of academic departments.”39 The model presented within consists of two primary components: the Instructional Personnel Profit or Loss Statement and the Departmental Instructional Profit or Loss Statement. The former (Table 5) analyzes the way that funds are earned and spent based on student enrollment and salary per faculty member. The latter (Table 6) takes the figures on total instructional costs determined by the former and ultimately determines the total profit or loss for the department as a whole. Once losses have been determined, these must be further analyzed by category, in order to establish where, exactly, the losses originate (Table 7). From there, departments or administrators may take active measures, such as minimizing staff hires or equipment purchases, or possibly increasing the number of classes taught if demand suggests that this is feasible, in order to implement effective changes that can reduce loss and/or increase profit margins.
Table 5: Instructional Personnel Profit or Loss Statement
Faculty Name
Average Graduate FTE per semester
Average Undergraduate
FTE per semester
Total FTE
Instructional Salary $$
Generated
Cost of Salaries Paid
Salary Generation Surplus or (Deficit)
% of Actual
Salary Generated
Professor1
2.5
6.58
9.08
$9,083
$33,019
($23,936)
27.5%
Professor2
.00
1.42
1.42
$1,246
$2,664
($1,418)
55.0%
Assistant Professor3 and Chair
.31
.42
.73
$779
$1,570
($791)
49.0%
Associate Professor4
17.81
14.00
31.81
$35,793
$31,421
4,372
113.9%
Associate Professor5
10.00
7.25
17.25
$19,558
$22, 796
($3,238)
85.8%
Associate Professor6
.00
.08
.08
$73
$460
($387)
15.9%
Assistant Professor7
1.56
23.58
25.14
$22,792
$24,363
(1,571)
93.6%
39 Norris, R. “Analyzing the Cost Efficiency of Academic Departments and Instructional Personnel at State
Universities”. ERIC document (ED208709). http://www.eric.ed.gov/ERICWebPortal/custom/portlets/recordDetails/detailmini.jsp?_nfpb=true&_&ERICExtSearch_SearchValue_0=ED208709&ERICExtSearch_SearchType_0=no&accno=ED208709
The data in Table 7 suggests that the categories of Operating Expenses and Equipment Replacement balance each other out, while the salaries seem to be the primary reason that the department experienced a deficit of $13,205.
Given the selected financial models for academic programs presented in the previous section, we now offer potential models for determining the financial viability of athletics programs. Among the institutions under review are: Concord University and the University of Michigan – Flint. Concord University In 2004, Concord University, located in Athens, West Virginia (student population approximately 2,800), outlined its Policy for Funding Intercollegiate Athletics.40 In the following list, we summarize stated revenue sources for the athletics program, as sketched out in the policy briefing:41
State Appropriations
o The amount of state appropriated funds that may be expended by the institution each fiscal year for intercollegiate athletics will not exceed two (2) percent of the average state appropriation for that fiscal year for the eight four-year state institutions of higher education.
Student Athletic Fees o The amount of Student Athletic Fees shall be limited to 10 percent of the
total undergraduate tuition and fees charged to resident (in-state) students for any given academic year. The President shall annually recommend after consultation with student representatives and others a fee rate to the Board of Governors for approval.
Athletic Waivers o Though not a revenue stream, athletic waivers are an acceptable means for
underwriting the cost of intercollegiate athletics. Athletic tuition waivers shall be limited to 20 percent of the total allowable.
Institutional Support o Whereas the athletic program is an integral contributor to the mission of
Concord University, fiscal resources should be dedicated that prudently provide for an athletic program that reflects the excellence of the institution …Grant-In-Aid scholarships should be maintained to support athletics as an enrollment management effort and to insure that a level of excellence is maintained. Institutional scholarship dollars reserved for athletics should not exceed 30 percent of institutional monies dedicated to the University’s total scholarship program. Total expenditures from unrestricted institutional revenues shall not exceed 70 percent of the national average for Division II institutions.
40 Concord University. (September 30, 2004). “Policy No. 10 Policy for Funding for Intercollegiate Athletics.”
Intercollegiate Athletic Revenues o Within NCAA and WVIAC regulations, funding for intercollegiate athletics
may include revenue generated by gate receipts, contest guarantees, tournament and post-season income, foundations, private gifts, interest groups, sponsorships, advertising and other development activities related to athletics. Auxiliary enterprises provide support and services to the entire institution thereby ensuring a safe and fulfilling existence for all members of the extended campus community. The revenue stream provided by the auxiliary enterprises is important to the fiscal health of the greater institution. It is strategically sound for athletics to be supported as a partner in the auxiliary domain of the University.
Considering these parameters for athletic programs revenues, the next case study offers sample models for calculating athletics program costs. University of Michigan-Flint In a May 2009 feasibility study, Alden & Associates, Inc. recommends that the University of Michigan-Flint (total student population approximately 7,260) initiate an intercollegiate athletics program upon the availability of financial resources.42 Consisting of seven varsity sports – men’s basketball, soccer, and baseball; and women’s basketball, soccer, softball and cross country – the athletics program is projected to bear an annual cost of $540,000. Among the firm’s key recommendations for raising necessary revenue: raise the University’s current activity fee from $25 per semester to $75 per semester.43 As noted in the feasibility study, the following tables represent a projected breakdown of athletics program start-up costs by various expense categories and sport, annual coaching and administrative personnel costs by position and sport, and five-year revenue and expense projections. In presenting these tables we offer possible measures of financial costs and revenues for athletics programs at higher education institutions:44
Table 8: Sports Equipment and Uniform Start-Up Costs Sport Equipment Uniform/Supplies Total
Men's Basketball $15,000 $10,000 $25,000
Women's Basketball $15,000 $10,000 $25,000
Men's Soccer $15,000 $10,000 $25,000
Women's Soccer $15,000 $10,000 $25,000
Baseball $15,000 $10,000 $25,000
Softball $15,000 $10,000 $25,000
Women’s Cross $5,000 $5,000 $10,000
42 University of Michigan-Flint. (May 2009). “Feasibility Study for Intercollegiate Athletics.”
Models used by larger universities may be easily applied in financial viability studies of small colleges, since the size or total net assets of an institution need not be considered in examination of departmental profits and losses;
Models typically integrate a cost-benefit analysis model of some sort, which
considers enrollment, tuition and faculty salaries and workload;
Models may also consider more general figures that are determined on a case-by-case basis such as instructional cost, personnel cost, and other costs;
The models presented here can easily be repurposed for an examination of athletic program viability by replacing figures for instructional cost with general activity cost, including travel and equipment costs per team, in comparison with the revenues generated by ticket sales, private donations, grants, and state and federal funding for athletics.
Note This brief was written to fulfill the specific request of an individual member of The Hanover Research Council. As such, it may not satisfy the needs of all members. We encourage any and all members who have additional questions about this topic – or any other – to contact us.
Caveat The publisher and authors have used their best efforts in preparing this brief. The publisher and authors make no representations or warranties with respect to the accuracy or completeness of the contents of this brief and specifically disclaim any implied warranties of fitness for a particular purpose. There are no warranties which extend beyond the descriptions contained in this paragraph. No warranty may be created or extended by representatives of The Hanover Research Council or its marketing materials. The accuracy and completeness of the information provided herein and the opinions stated herein are not guaranteed or warranted to produce any particular results, and the advice and strategies contained herein may not be suitable for every member. Neither the publisher nor the authors shall be liable for any loss of profit or any other commercial damages, including but not limited to special, incidental, consequential, or other damages. Moreover, The Hanover Research Council is not engaged in rendering legal, accounting, or other professional services. Members requiring such services are advised to consult an appropriate professional.