60
Modern Economic Statistics in a Policy Environment Martine Durand Chief Economist, OECD Chair: Joe Grice Chairman of the ONS Economic Experts Working Group
| Date post: | 12-Apr-2017 |
| Category: |
Government & Nonprofit |
| Upload: | office-for-national-statistics |
| View: | 360 times |
| Download: | 0 times |

Modern Economic Statistics in a Policy Environment
Martine Durand
Chief Economist, OECD
Chair:
Joe Grice
Chairman of the ONS Economic Experts Working Group

INFORMING POLICY:CHALLENGES FOR
ECONOMIC STATISTICS
Martine DurandOECD Chief Statistician
International Economic Statistics ConferenceCeltic Manor21-22 February 2017

The issue

Current international economic policy environment
➢ Low growth, low productivity trap, significant differences in economic performance across countries
➢ Persistent inequalities in many countries ➢ Backlash against globalisation ➢ Fears that impact of digitalisation on jobs and income will
outweigh potential benefits
Well-being at the centre of the policy discourse
Not only economic well-being and quality of life, but also … … (environmental) sustainability
4

What are the challenges for (economic) statistics ?
5
• What are the reasons for the recent productivity slowdown? Or is this simply a statistical artefact?
• How does digitalisation affect our economy and our every-day life? What is the role of knowledge-based capital? Do we measure it appropriately?
• How does globalisation affect our capacity to measure national economic activity? Most policies are still framed in a national context so capacity to monitor national developments remains important.
• Are people left behind?, thus potentially creating political instability? Do we measure disparities well ? And how to monitor financial risks and vulnerabilities?
• How can we grow while preserving the environment ? How to measure green growth?

The Statistical Agenda
Which modern economic statistics to inform policies for
a more inclusive and (environmentally) sustainable growth ?
1. Explaining Productivity2. Understanding Globalisation 3. Taking a Households’ Perspective, looking at
Disparities 4. Pushing the Boundaries ?5. Addressing Sustainability
6
The statistical agenda (1) : Explaining productivity

Downward trend in labour productivity growth in many countries
Total economy, percentage change at annual rate
Source: OECD Productivity Compendium 2016

Downward trend in labour productivity growth in many countries
Total economy, percentage change at annual rate
Source: OECD Productivity Compendium 2016

• Shortage of ideas (Gordon)• Break-down of the diffusion machine and
inequality (OECD)• A business cycle effect
• A great deal is happening in the digital economy (Brynjolfsson/McAffee)– but takes time to materialise– And some or much of it is not picked up by GDP and
productivity figures - the mis-measurement hypothesis
Some explanations

Source: OECD Economic Outlook June 2016; see also Andrews, Criscuolo and Gal 2016; Brookings Working Paper
Weaker diffusion of frontier productivity
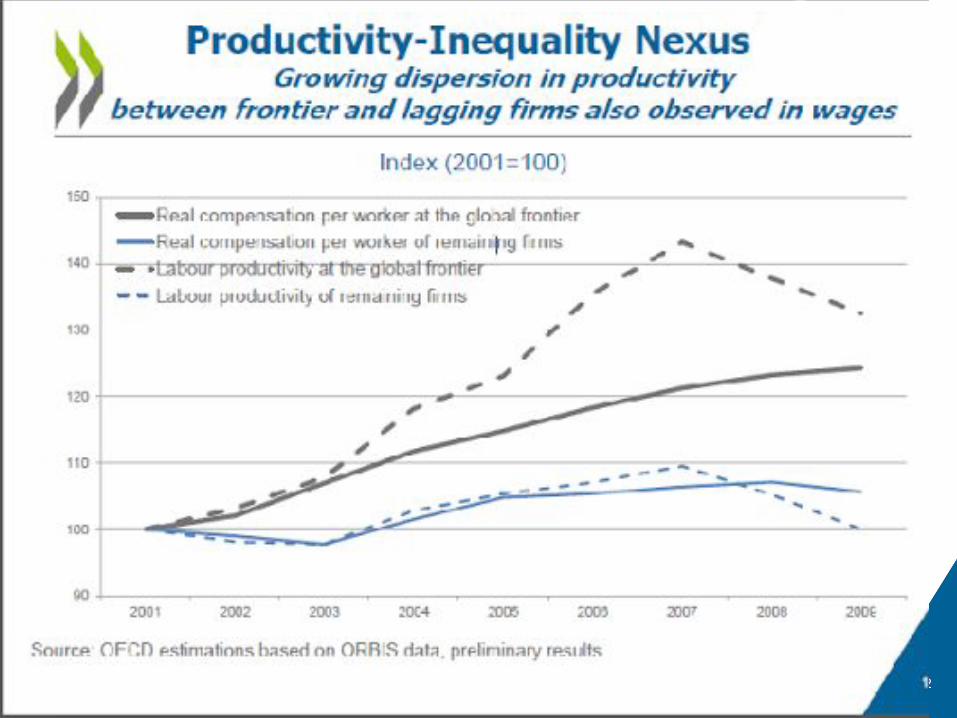
12

• Industry level: detailed and updated information– To assess developments at sectoral level
• Firm level: detailed micro firm-level data– To assess developments by firm characteristics
• Linked employer-employee data– To assess relationship between wage and productivity dispersion
Exploring the decline in productivity: what’s needed ?
13

Systematic work to assess the mismeasurement hypothesis is scarce…
And despite some notable responses:
• Challenges to Mismeasurement Explanations for the U.S. Productivity Slowdown, Chad Syverson; NBER Working Paper No. 21974, February 2016
• Does the United States have a productivity slowdown or a measurement problem? Byrne, D., J.Fernald and M. Reinsdorf; Brookings Papers on Economic Activity, Spring 2016.
There remain more questions than answers…… and calls for action:
14

In the debate, there is often confusion between:
• Conceptual vs. Empirical issues
• Production vs. Consumer Surplus vs. Welfare
• Volumes vs. prices
Recent OECD work (presented later by Peter Van de Ven) reviews these issues more systematically and discusses the statistical agenda
… and the ill-defined nature of the issue has not helped

The statistical agenda (2) :Understanding globalisation

Globalisation: an illustration
A significant share of domestic value added is generated by foreign affiliates
Value Added of Foreign Affiliates – share of national total 2009 (ISIC B-N, ex K)
17
10%
50%
40%
30%
20%
Source: OECD calculations based on OECD TiVA database, 2013
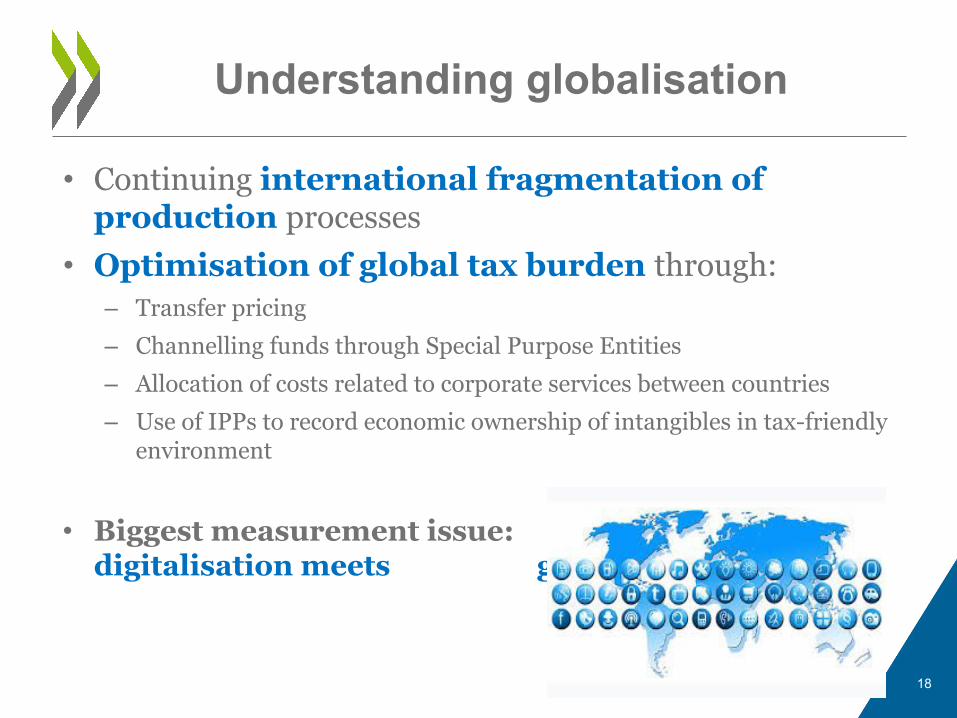
Understanding globalisation
• Continuing international fragmentation of production processes
• Optimisation of global tax burden through:– Transfer pricing
– Channelling funds through Special Purpose Entities
– Allocation of costs related to corporate services between countries
– Use of IPPs to record economic ownership of intangibles in tax-friendly environment
• Biggest measurement issue: where digitalisation meets globalisation
18

Understanding globalisation :the basic discussion
• Are quickly moving intangibles reflective of a new economic reality (industry 4.0), correctly picked up in our GDP concept? And we ‘simply’ need improved source information?
• Is the current accounting framework conceptually ill-suited to deal with globalisation phenomena and deserves a review?
19

Either way, an improved information base is necessary
• Distinguish activities of MNEs from (other) nationally operating enterprises, in supply and use tables and sector accounts; develop MNE accounts ✓ provide a better understanding of the impact of MNEs
• Conduct additional types of analysis, e.g. OECD Trade in Value Added (TiVA) ✓ Competivieness/new industrial policy in globalised world✓ Link TiVA and employment/skills data to understand where jobs
are created
• Pay more attention to other national accounts indicators, e.g. Household Disposable Income
20

But globalisation is also about the movement of persons…
21

And there too better information is needed
22
•Monitoring migration flows•Monitoring the impact of the refugee crisis •Analysing the demographic impact of migration •Monitoring integration outcomes of immigrants

The statistical agenda (2) : Taking a households’ perspective,
looking at disparities

From production to income/wealth
24
• Material well-being perspective: – differences between economic growth and growth in real
household disposable income
• Analysis of interaction between real and financial economy– e.g. impact of wealth changes (holding gains/losses) on
consumption and growth
• Analysis of risks and vulnerabilities related to interconnectedness, asset price volatilities, growing debt levels, etc. – G20 Data Gaps Initiative
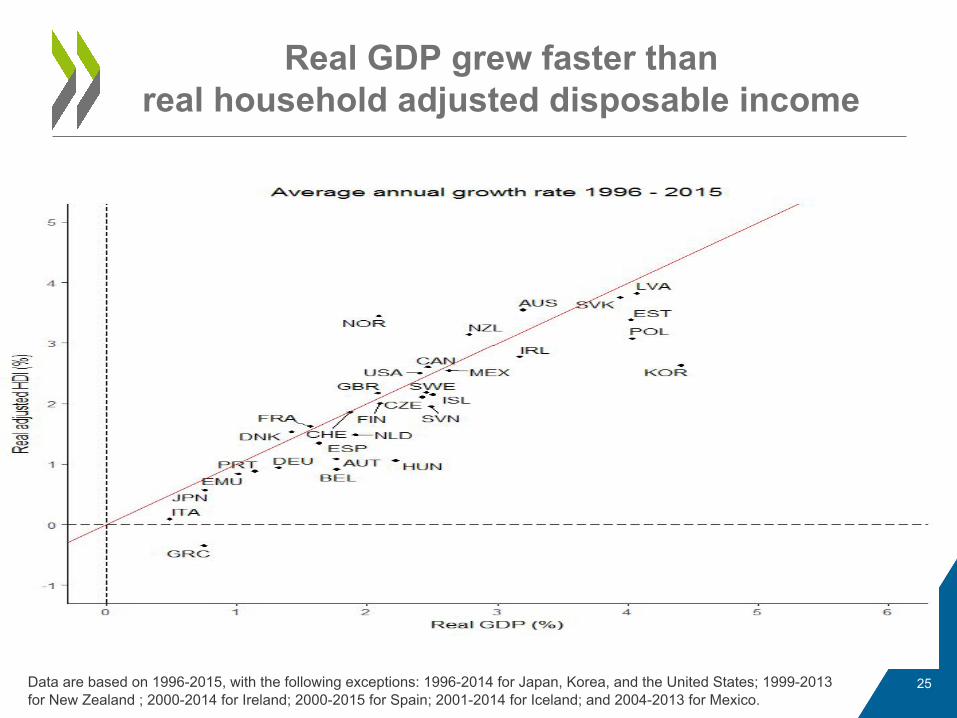
Real GDP grew faster than real household adjusted disposable income
25Data are based on 1996-2015, with the following exceptions: 1996-2014 for Japan, Korea, and the United States; 1999-2013 for New Zealand ; 2000-2014 for Ireland; 2000-2015 for Spain; 2001-2014 for Iceland; and 2004-2013 for Mexico.

Additional indicators to assess households’ economic well-being
• The OECD Household Dashboard– GDP and household income – 3 indicators; Confidence, consumption, and
savings – 3 indicators; Debt and net worth – 2 indicators; Unemployment and under-employment– 2 indicators
26

Analysis of links between real economy and finance, and of risks/vulnerabilities:
what’s needed?
27
• Need for fully-fledged institutional sector accounts, up to and including balance sheets, on a quarterly basis
• But there are some important gaps too:• Lack of good and internationally comparable data on
non-financial assets• Lack of from-whom-to-whom information and other
information on risks and vulnerabilities (maturity mismatches, currency mismatches, etc.)
• And many types of risk analysis require very granular data, which are also lacking

Distributional aspects
28

Widening income inequality
29Source: Unweighted average over 17 countries ; OECD Income Distribution Database

Wealth disparities are larger than income disparities

Distributional aspects : what is needed?
• Further improvement of micro-data:– Consistency between data on income, consumption
and wealth (see e.g. OECD Framework for Statistics on the Joint Distribution of Consumption, Income and Wealth)
– Maximum use and linking of available data (surveys and administrative data to capture whole distribution)
– More and more up-to-date data on wealth: new OECD Wealth Distribution Database (WDD)
• Linking micro-data and national accounts data:– To analyse links between growth and inequalities– OECD Expert Group on Disparities in National
Accounts 31

32
Linking micro and NA data: Income, results from 2015 exercise
Source: OECD Expert Group on Distribution in the National Accounts
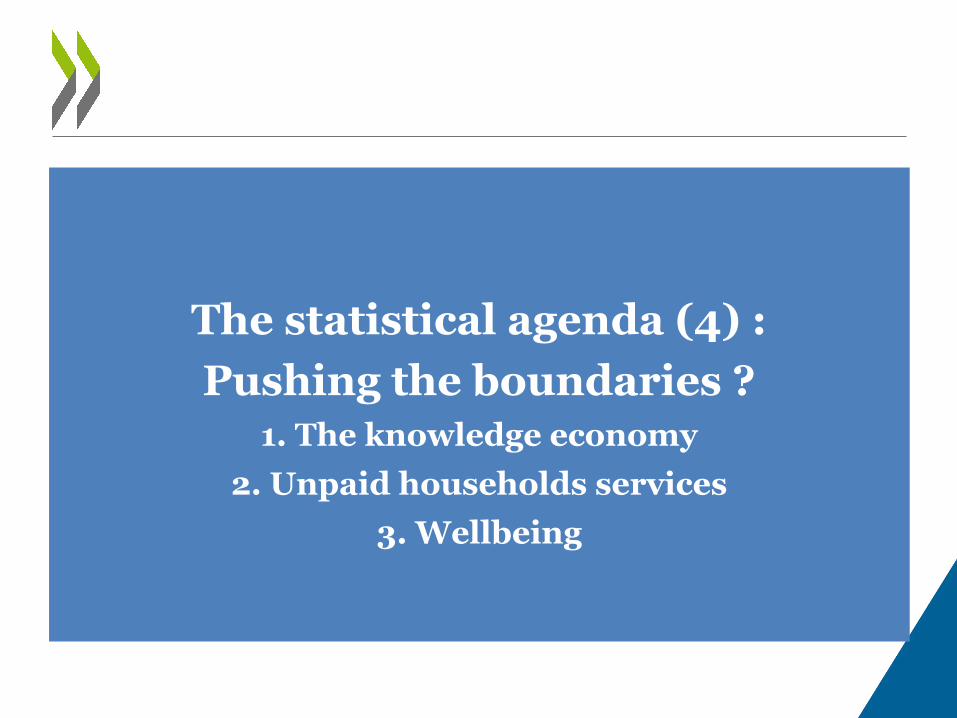
The statistical agenda (4) : Pushing the boundaries ?
1. The knowledge economy 2. Unpaid households services
3. Wellbeing

1. Growing importance of the knowledge economy
• Knowledge, including human capital, considered as the driving force of economic growth. Its measurement is essential:– Organisational capital– Brands, trademarks, logos, domain names– Human capital
• But as part of the National Accounts? Reasons for not extending the asset boundary:– Further drift away from business accounting standards, with
negative consequences for potential micro-macro linkage?– Ever more modelling and imputations needed
34

Measuring the knowledge economy :what’s needed?
• Way forward without changing the asset boundary:
• Satellite account on education and training (according to UNECE Guide on Measuring Human Capital):
• More targeted classification of goods and services related to education and training (including own-account production of training)
• Labour input by level of education
• Further break-down of expenditures with strong links with knowledge creation:
• Advertising• Organisational changes• Etc.
35

Truly important activities but, by convention and for good reasons, outside GDP:• Cooking• Child care• Care for elderly• Care for mentally and physically ill
family members• Maintenance of shelter
• ….
36
2. Unpaid household activities
2016 ALZHEIMER’S DISEASE FACTS AND FIGURES

Unpaid household activities are significant
Household production as % of GDP
Source: OECD: Ahmad and Koh (2011)

1. Cost of labour – good understanding of valuation methods• Replacement costs, opportunity costs, minimum wage approach…
2. Cost of capital: separating out consumer durables that are used in production (e.g. car, kitchen) – also relevant for sharing economy
3. Time use surveys – THE ingredient to measure time spent on household production• A vital input also for gender-related questions• Need to improve the quality and frequency of data from time
use surveys
4. Combining this information in satellite account (UNECE Guide)38
Unpaid household activities what’s needed?

3. Wellbeing
39

Wellbeing
• Well-being is a multidimensional phenomenon
• OECD well-being framework (How’s Life?) includes 11 dimensions (material and non-material)
• No attempt to construct single composite indicator of 11 dimensions of well-being…
• …But estimation of a welfare function (MDLS), using shadow prices for 3 dimensions, for policy purposes– Allows quantification of policy trade-offs and synergies
40

The OECD wellbeing framework
Source: OECD (2011) How’s Life? Measuring Well-Being, OECD Publishing, Paris
Averages and distributions
Today
Tomorrow

Growth in multi-dimensional living standards for the poorest households
Components of overall welfare of the 10% poorest households G7 countries, changes 1995-2015
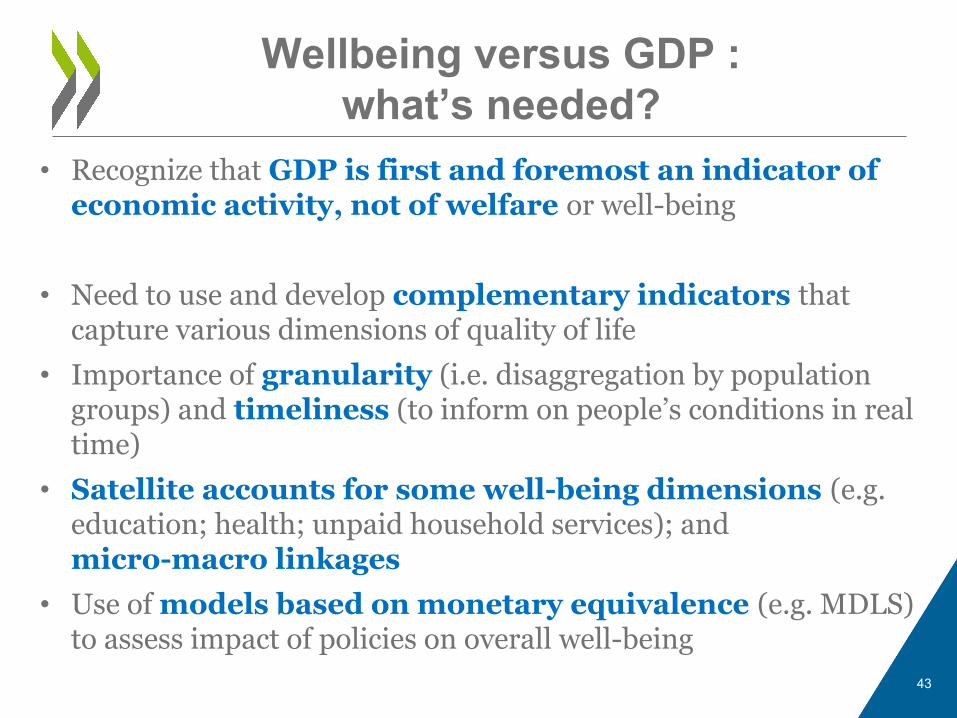
Wellbeing versus GDP : what’s needed?
• Recognize that GDP is first and foremost an indicator of economic activity, not of welfare or well-being
• Need to use and develop complementary indicators that capture various dimensions of quality of life
• Importance of granularity (i.e. disaggregation by population groups) and timeliness (to inform on people’s conditions in real time)
• Satellite accounts for some well-being dimensions (e.g. education; health; unpaid household services); and micro-macro linkages
• Use of models based on monetary equivalence (e.g. MDLS) to assess impact of policies on overall well-being
43

The statistical agenda (5) : Addressing environmental
sustainability

• OECD policy analysis…
• …and measurement that includes:– Environmental and Resource
Productivity– Maintaining the Natural Asset Base– Economic Opportunities
How Green is our Growth?

• Environmental assets– Mineral and energy res.– Land– Soil– Timber– Aquatic resources– Water
• Ecosystems– Atmosphere– Oceans– Forests
46
The environmental asset basehow should it be measured?
Measurability
High
Low
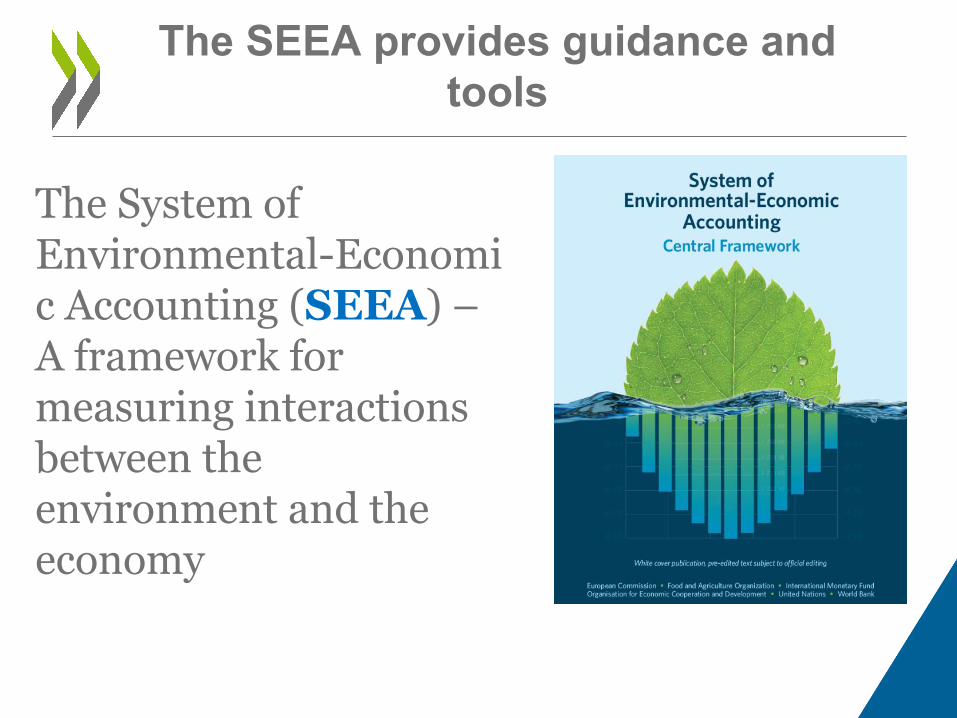
The System of Environmental-Economic Accounting (SEEA) – A framework for measuring interactions between the environment and the economy
The SEEA provides guidance and tools

Assessing economic/environmental sustainability : what’s needed ?
• Speed up implementation of SEEA at industry level– Current OECD focus: emissions to air, and mineral and energy resources
– Extension to environmental protection expenditures and revenues, environmental taxes and subsidies
• Better physical and monetary estimates for environmental assets, depletion and deterioration
• Further work on ecosystems accounting
• More and better use cases of SEEA48

How to move forward?
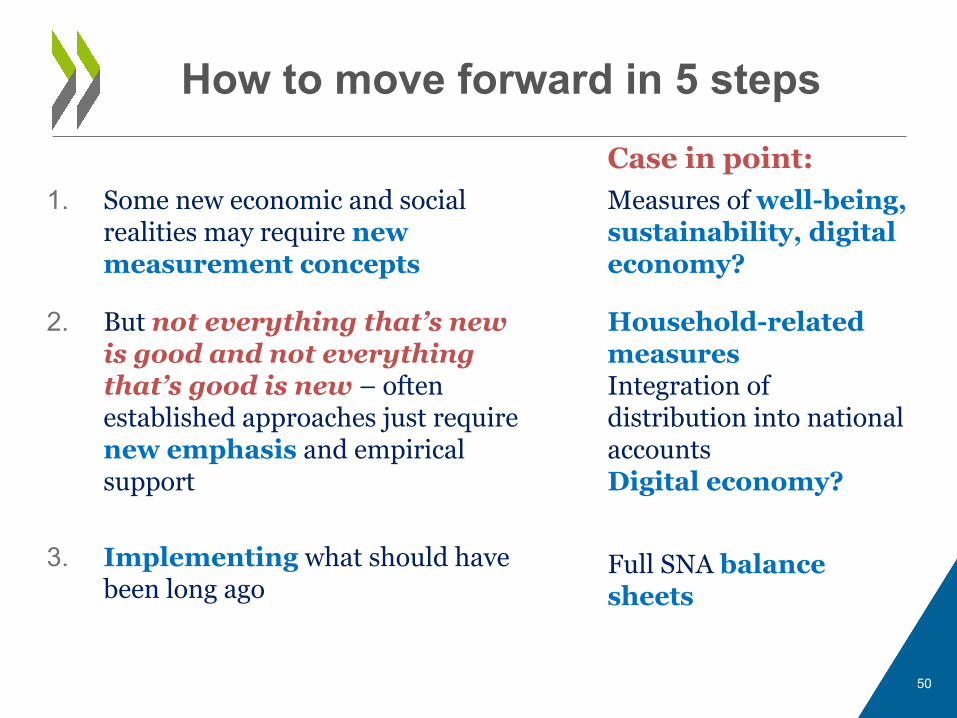
How to move forward in 5 steps
1. Some new economic and social realities may require new measurement concepts
50
Measures of well-being, sustainability, digital economy?
Case in point:
2. But not everything that’s new is good and not everything that’s good is new – often established approaches just require new emphasis and empirical support
Household-related measuresIntegration of distribution into national accountsDigital economy?
3. Implementing what should have been long ago
Full SNA balance sheets

How to move forward in 5 steps
51
Case in point:4. Measurement efforts beyond
established boundaries for analyses
Satellite accounts on unpaid household activitiesImplementing the SEEAKnowledge and human capital
5. Embrace smart data where useful and integrate and link data from different sources for more granular and more timely policy uses
Geospatial dataFull use of administrative recordsData from social mediaIntegrate survey data and administrative recordsLink trade and business statistics; TiVA and jobs

Back-up slides

Globalisation and trade The role of MNEs: the feedback loop
54
Mexico’s exports by origin of value-added, 2011
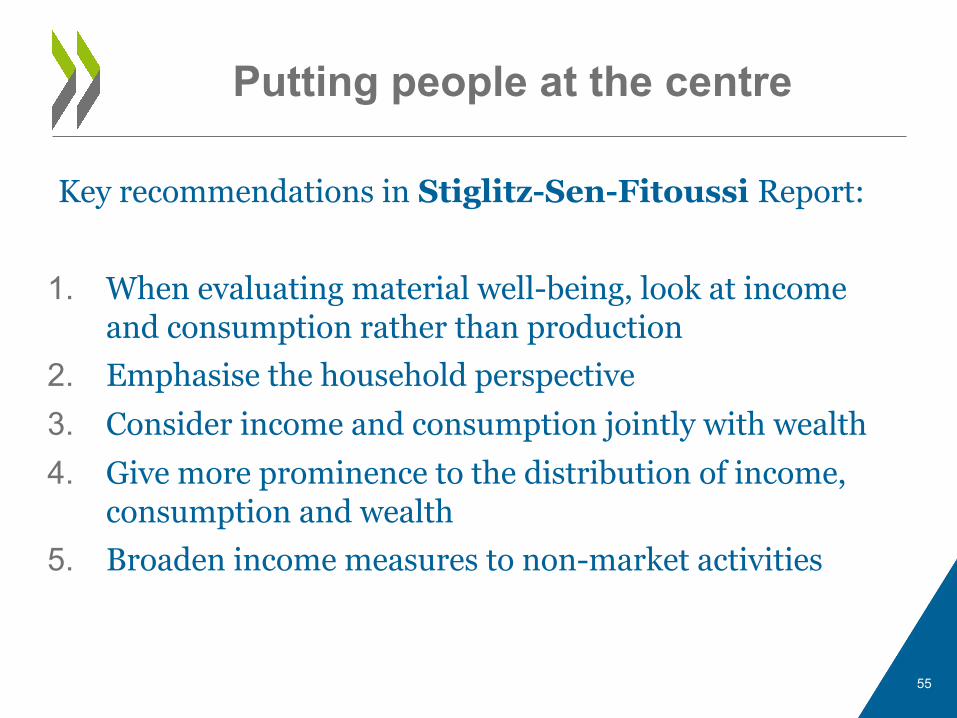
Putting people at the centre
55
Key recommendations in Stiglitz-Sen-Fitoussi Report:
1. When evaluating material well-being, look at income and consumption rather than production
2. Emphasise the household perspective3. Consider income and consumption jointly with wealth4. Give more prominence to the distribution of income,
consumption and wealth5. Broaden income measures to non-market activities

GDP per capita differs from households’ material living standards
56

Linking micro and NA data : Saving ratios, results from 2015 exercise
UKFrance
United States

Netherlands
Period 95-00 00-06 06-10Official 5.4 3.1 1.7Minimum wage 4.8 3.8 1.2Opportunity - 4.8 0.9
United Kingdom
Period 01-05 05-10Official 3.9 4.6Minimum wage 4.1 4.6Opportunity 3.5 4.4
United States
Period 03-08 08-10 10-14Official 5.4 1.2 3.6Minimum wage 5.1 2.2 3.6Opportunity 4.7 2.1 3.0
58
Household production: impact on growth rates

Declining emission intensity – can we track the causes? Example - Netherlands

#econstats
Join the conversation:


