21
Modern JD Edwards BI Microsoft Power BI & Excel with BI QuickLaunch Presented by Adam Crigger Founder
Modern JD Edwards BIMicrosoft Power BI & Excel with BI QuickLaunch
Presented by
Adam CriggerFounder
Agenda
▪ Preferred Strategies Overview
▪ Business Intelligence Overview
▪ BI QuickLaunch Overview (Microsoft)
▪ Live Demonstration
▪ Session Recap
▪ Scavenger hunt
▪ Questions
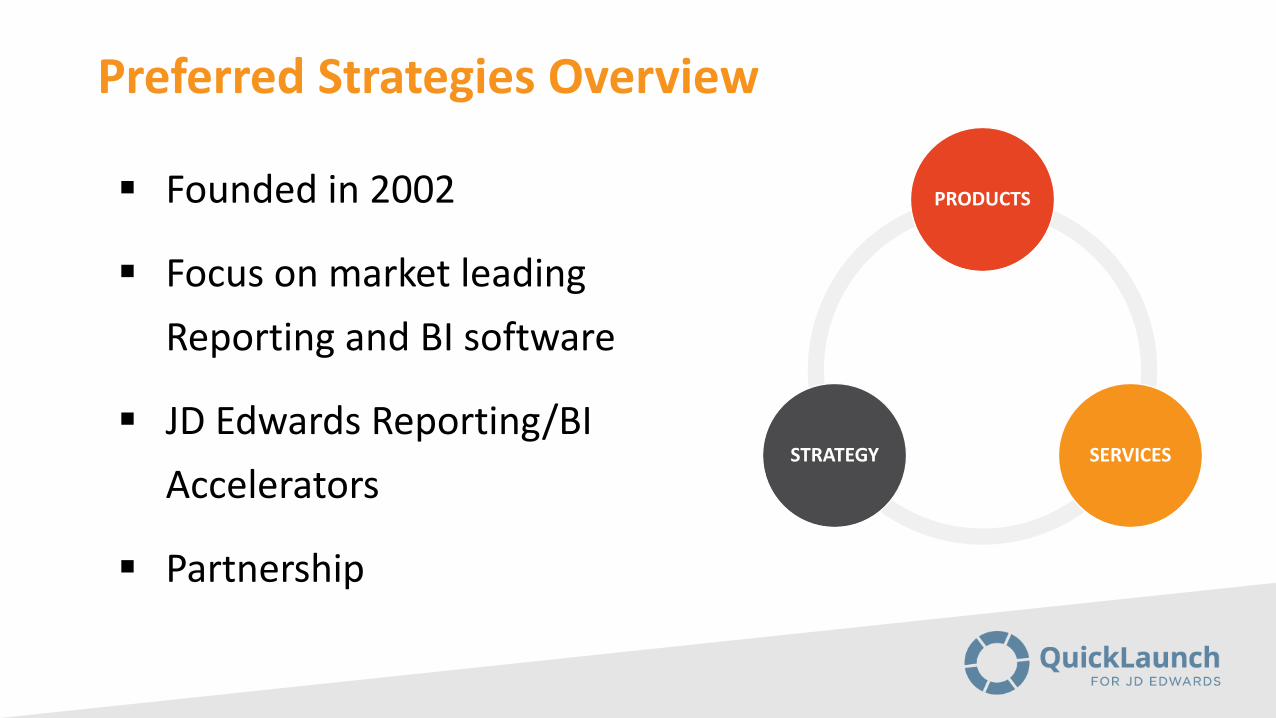
Preferred Strategies Overview
STRATEGY
PRODUCTS
SERVICESSTRATEGY
▪ Founded in 2002
▪ Focus on market leading
Reporting and BI software
▪ JD Edwards Reporting/BI
Accelerators
▪ Partnership
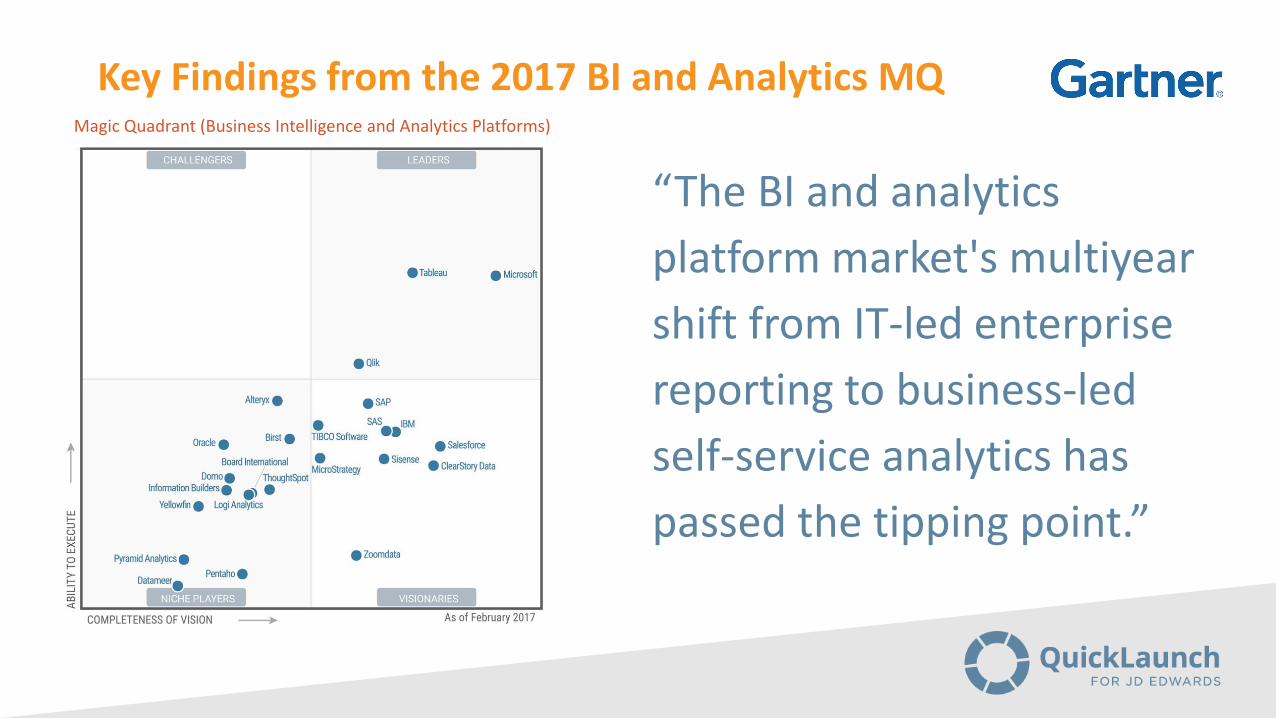
Key Findings from the 2017 BI and Analytics MQMagic Quadrant (Business Intelligence and Analytics Platforms)
“The BI and analytics
platform market's multiyear
shift from IT-led enterprise
reporting to business-led
self-service analytics has
passed the tipping point.”
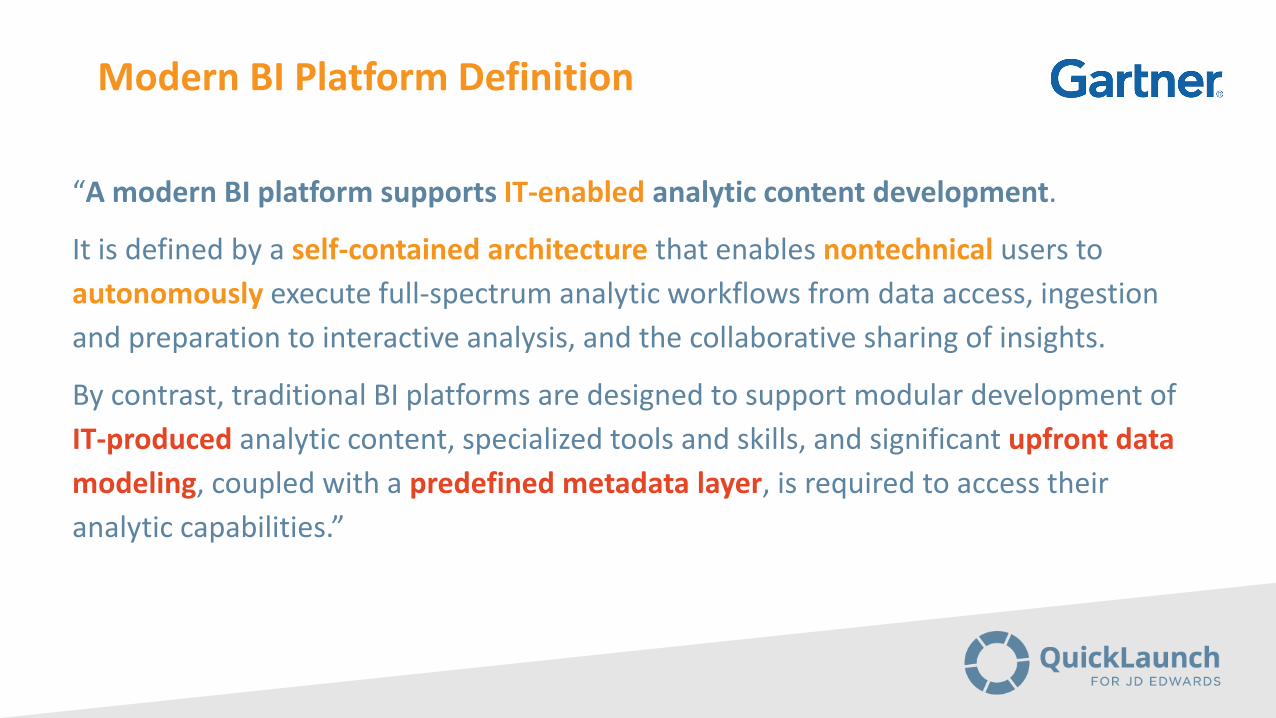
Modern BI Platform Definition
“A modern BI platform supports IT-enabled analytic content development.
It is defined by a self-contained architecture that enables nontechnical users to
autonomously execute full-spectrum analytic workflows from data access, ingestion
and preparation to interactive analysis, and the collaborative sharing of insights.
By contrast, traditional BI platforms are designed to support modular development of
IT-produced analytic content, specialized tools and skills, and significant upfront data
modeling, coupled with a predefined metadata layer, is required to access their
analytic capabilities.”

Cost
Microsoft Power BI Strengths
Ease of use plus complex analysis
Vision
Active Community
Ease of Use & Visual Appeal
In-memory engine with data preparation
Data Sources and Pre-built Apps
Magic Quadrant
Magic Quadrant
Magic Quadrant
Magic Quadrant
Critical Capabilities Guide
Critical Capabilities Guide
Critical Capabilities Guide

QuickLaunch BI Architecture (Microsoft)
Data Gateway
Data
JD Edwards
ODS
Share
Centralized
Decentralized
Model Report
On-Premise
Cloud
On-Premise
Cloud
EDW
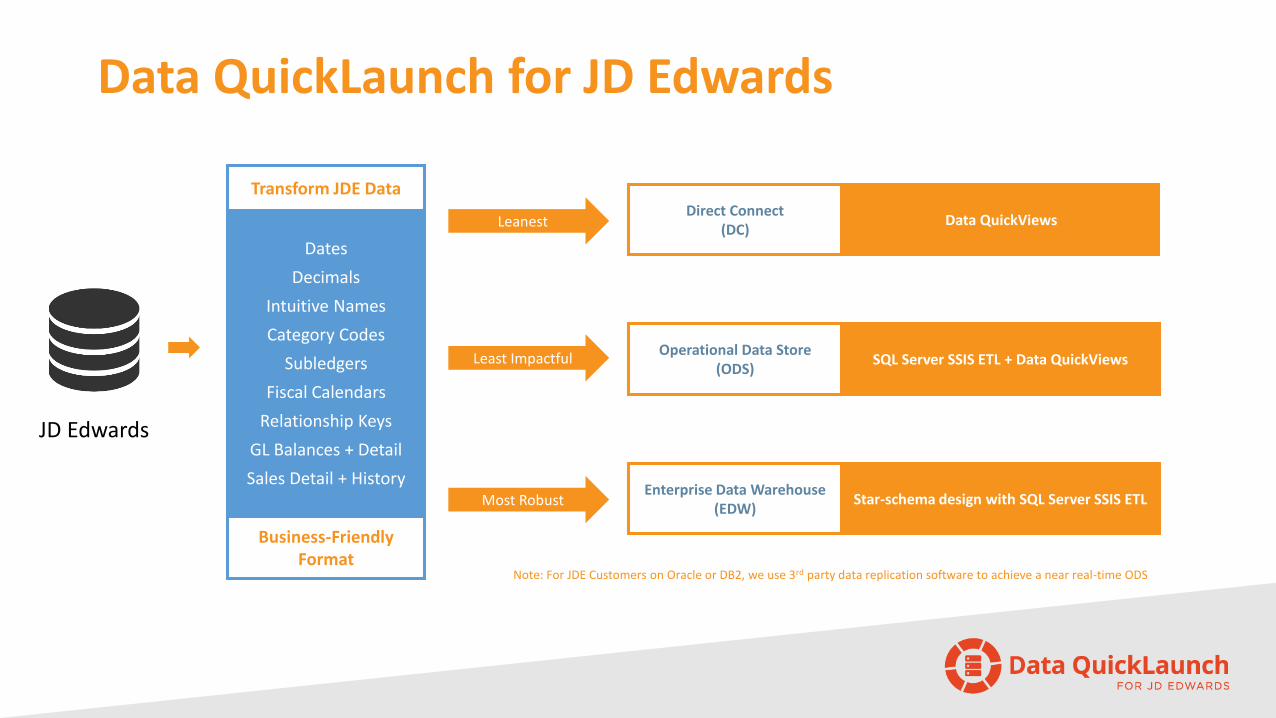
Data QuickLaunch for JD Edwards
JD Edwards
Dates
Decimals
Intuitive Names
Category Codes
Subledgers
Fiscal Calendars
Relationship Keys
GL Balances + Detail
Sales Detail + History
Direct Connect(DC)
Leanest
Transform JDE Data
Least Impactful
Most Robust
Data QuickViews
SQL Server SSIS ETL + Data QuickViewsOperational Data Store
(ODS)
Star-schema design with SQL Server SSIS ETLEnterprise Data Warehouse
(EDW)
Note: For JDE Customers on Oracle or DB2, we use 3rd party data replication software to achieve a near real-time ODS
Business-Friendly Format
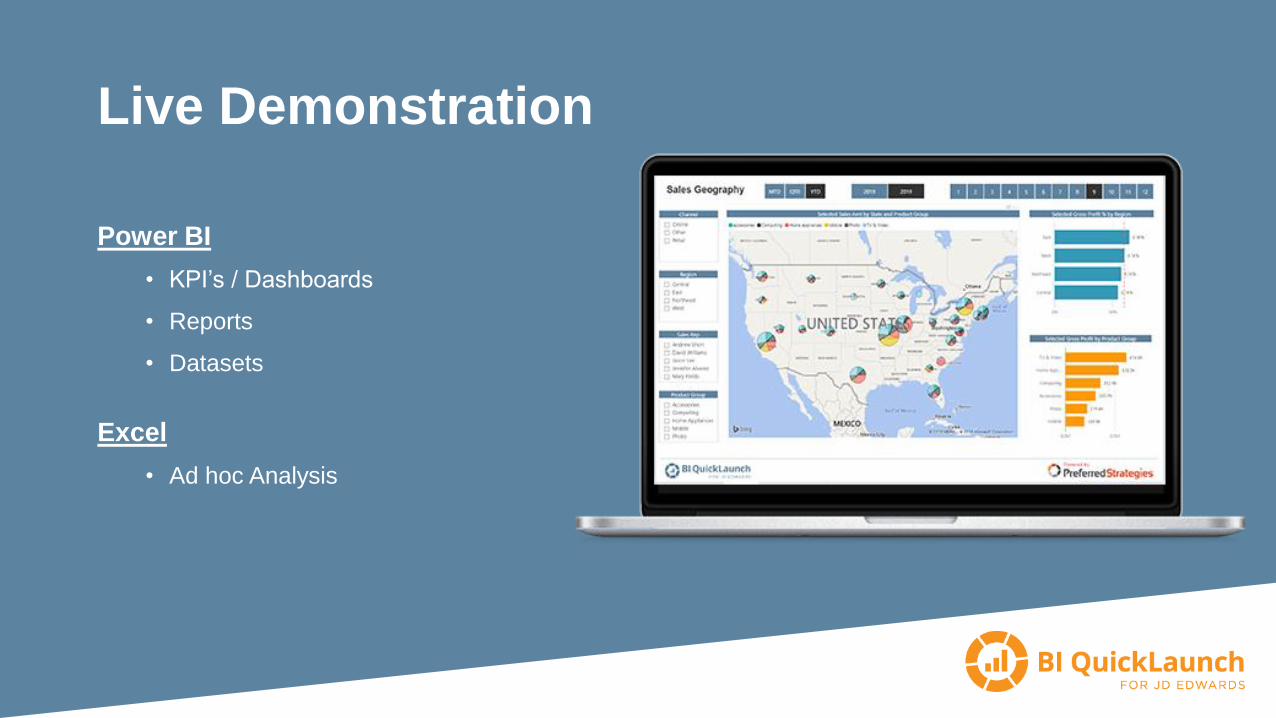
Live Demonstration
Power BI
• KPI’s / Dashboards
• Reports
• Datasets
Excel
• Ad hoc Analysis
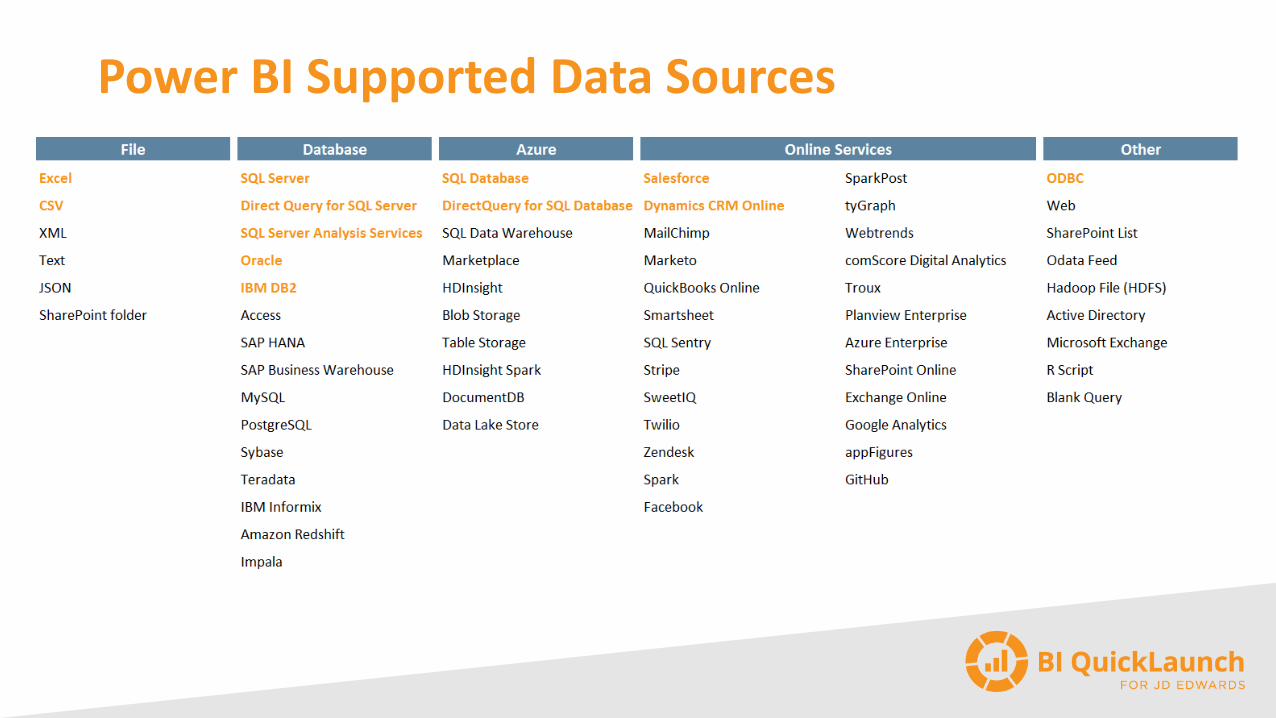
Power BI Supported Data Sources

Power BI Custom Visuals

Modern BI Terms and Decisions
▪ Modern BI vs. Traditional BI
▪ Centralized vs. Decentralized
▪ Cloud vs. On-Premise
▪ In-memory vs. Disk
▪ Direct Connect vs. ODS vs. Data Warehouse

BI QuickLaunch for JD Edwards (Tabular Model)
General Ledger
Sales
Manufacturing
Enterprise Asset Management
Accounts Payable Accounts Receivable
Inventory
Job Cost
Human Resources / Payroll
Purchasing
Contract Billing
Transportation
Property Management• 23 JDE Perspectives• 30 JDE Power BI Reports

BI QuickLaunch KPI Ratios
Liquidity
• Current Ratio
• Quick Ratio
• Accounts Receivable
Turnover
• Days’ Receivables
• Inventory Turnover
• Days’ Inventory
• Cost of Sales / Payables
• Days’ Payables
• Sales / Working Capital
Coverage LeverageOperating
• EBIT / Interest
• Net Profit + Depr & Amort
/ Current Maturities LTD
• Fixed / Worth
• Debt / Worth
• % Profit Before Taxes /
Tangible Net Worth
• % Profits Before Taxes /
Total Assets
• Sales / Net Fixed Assets
• Sales / Total Assets

Founded in 1992, as a family and employee owned company, Clif Bar & Company is the leading brand in all-natural and organic energy and nutrition foods and drinks. Now a global organization, the company focuses on the following five aspirations sustaining our Planet, Community, People, Business, and Brands.
Project Objective:• Transition from JD Edwards reporting tool (Corporate Radar) to Microsoft data warehousing Reporting & BI
technologies
Solution:• JD Edwards Modules on SQL (GL, AP, AR, SLS, INV, PO, MFG)• BI QuickLaunch Data Warehouse• BI QuickLaunch PowerPivot Models• BI QuickLaunch Tabular Models
Benefits: • Reporting/BI Standardization• Drillable Management Operating Statements for Finance• Governed access to JDE data in Excel

Mann Packing is a leading provider of innovative, pre-washed and ready to use fresh veggies. Mann is one of the largest suppliers of western vegetables, Broccolini® and sugar snap peas in North America.
Project Objective: • Provide executive management and sales team with better visibility into JDE data & business
performance
Solution: • JD Edwards Modules on SQL (GL, SLS, INV, MFG)• BI QuickLaunch Tabular (Direct Connect)• BI QuickLaunch Power BI Reports
Benefits: • JDE reporting moved from IT to the business• Executive dashboards and KPIs• Ease of Use - Sales reps are trained in 10 minutes• CFO says “We have reached nirvana”

Implementation Timeline
We’ve spent thousands of hours of development
and fully configured in
2 - 3 weeks
To be installed in
1-5 days

How we differentiate from competitors (CHOICE)
▪ Market-leading BI Tools
▪ BI Approach
▪ Deployment Method
▪ Licensing Options
▪ Supported Data Sources
Power BI Trial with BI QuickLaunch for JDE
▪ Go to www.PreferredStrategies.com
▪ Select Free Trial link at the top
▪ Fill out the form and we will setup your Power BI Trial
environment
▪ Pick your JDE Modules
▪ Have fun for 30 days!
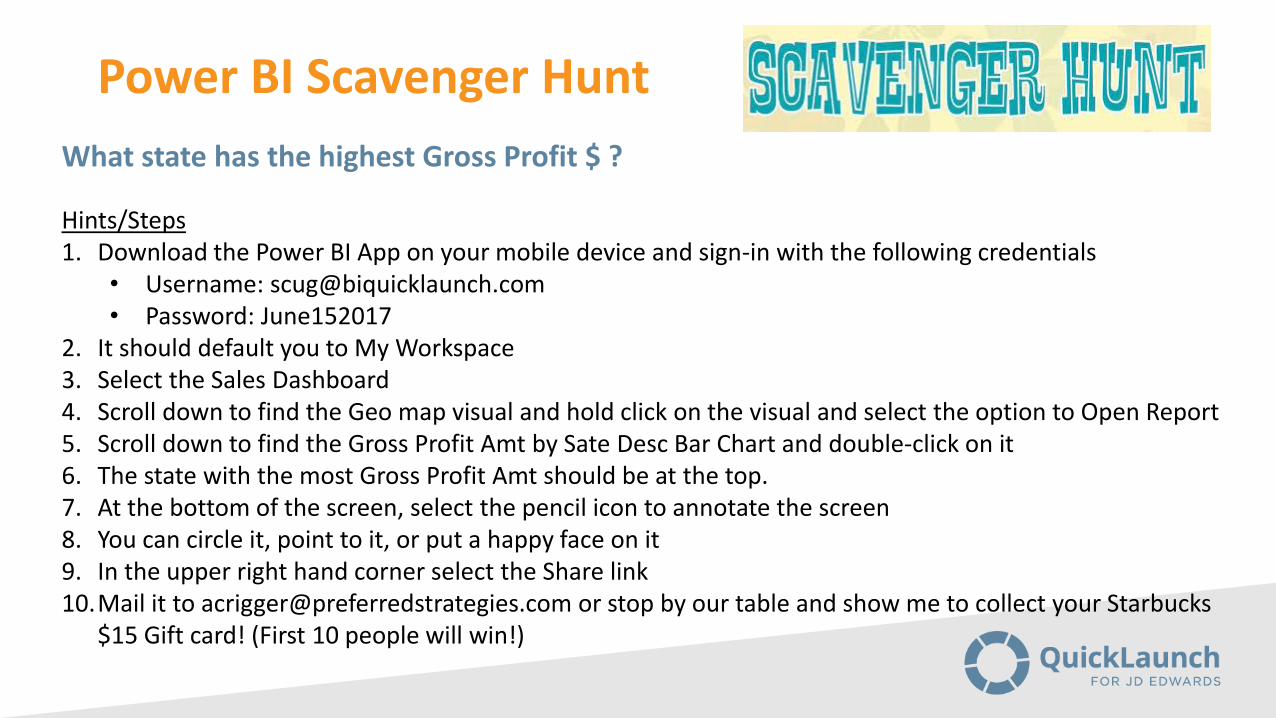
Power BI Scavenger Hunt
What state has the highest Gross Profit $ ?
Hints/Steps1. Download the Power BI App on your mobile device and sign-in with the following credentials
• Username: [email protected]• Password: June152017
2. It should default you to My Workspace3. Select the Sales Dashboard4. Scroll down to find the Geo map visual and hold click on the visual and select the option to Open Report5. Scroll down to find the Gross Profit Amt by Sate Desc Bar Chart and double-click on it6. The state with the most Gross Profit Amt should be at the top.7. At the bottom of the screen, select the pencil icon to annotate the screen8. You can circle it, point to it, or put a happy face on it9. In the upper right hand corner select the Share link10.Mail it to [email protected] or stop by our table and show me to collect your Starbucks
$15 Gift card! (First 10 people will win!)