7/ 7 (zone 4vull(I-) .stL@ Ad - l A. ha -- - I U.S. 0EPARTMENT OF Et -R W YUCCA M 4ERGY ace ( , 52SI,/ y,;v _~~ YUCCA MOUNTAIN _-- ~~ SITE CHARACTERIZATION PROJECT MODERN OPEN HOLE GEOPHYSICAL LOGS A One-Day Survey Course Presented to U.S. Department of Energy Yucca Mountain Site Characterization Project Office Presented by Loren E. "bud" Thompson Science Applications International Corporation Las Vegas, Nevada March 28,1992 1AI -/ I 40ry I-ll ' _ ~ PDR I I / eld, 7 44 ' 6dn &/ AL6.k 0a *b 6/ /
Transcript
7/ 7
(zone 4vull(I-).stL@Ad -l A. ha - - -I
U.S. 0EPARTMENT OF Et
-RW YUCCA
M
4ERGY ace ( , 52SI,/ y,;v_~~ YUCCA MOUNTAIN
_-- ~~ SITE CHARACTERIZATIONPROJECT
MODERN OPEN HOLEGEOPHYSICAL LOGS
A One-Day Survey Course
Presented to
U.S. Department of EnergyYucca Mountain Site Characterization Project Office
Presented by
Loren E. "bud" ThompsonScience Applications International Corporation
Las Vegas, NevadaMarch 28,1992
1AI -/
I 40ryI-ll ' _ ~ PDR I
I / eld, 7 44 ' 6dn &/ AL6.k 0a *b 6//
m- i
U.S. DEPARTMENT OF Et
toCRW YUCCA
M
4ERGY
- YUCCA MOUNTAIN_SISITE CHARACTERIZATION
_~ PROJECT
MODERN OPEN HOLEGEOPHYSICAL LOGS
A One-Day Survey Course
Presented to
U.S. Department of EnergyYucca Mountain Site Characterization Project Office
Presented by
Loren E. "bud" ThompsonScience Applications International Corporation
Las Vegas, NevadaMarch 28,1992
a.2L
MODERN OPEN HOLE GEOPHYSICAL LOGS
A note from bud:
This one-day survey course has been designed for non-geotechnical personnel who need anintroduction to or review of modem wireline geophysical logging tools and techniques. Theinformation presented during the workshop, along with the material contained In this course manual,will enable you to become more knowledgeable about the types of log measurements, the datacollection process, and the uses for modem log measurements.
My goal Is to provide the background Information to bring you Oup to speedu so you will be able toappreciate the need for quality log data for site characterization and other purposes.
We will discuss the following salient points throughout the workshop:
Why we want to use log data
Generic types of logs
How each type of log makes Its measurement
How log data are collected
Information which may be Interpreted from logs
Basic pitfalls In using log data
Quality Control and Quality Assurance of log data
Within the time constraints of a single day-long class, and given the diverse backgrounds of those Inattendance, the Information presented must be at a basic, near-lay person level In order to bring us allup to a common level of understanding of these topics. At a later date, I can offer a morecomprehensive three- to five- day seminar on log analyses or specific applications during which youwould have ample opportunity for hands-on problem solving using log and related data.
Part of our time will be spent with lecture presentations and part with video tapes. The tapes havebeen supplied by a commercial vendor of logging services for training and information purposes. Theuse of these tapes should not be considered an endorsement of a particular vendor's products.
I
An additional note regarding this course manual:
Due to several factors, mostly involved with timing, I was not feasible to prepare a concise andtypographically uniform manual specifically for this workshop. I elected to gather up relevant materialfrom various sources to provide the information I felt would be of most benefit to you. You will,therefore, find a variety of type faces, formats, page numbers, and references.
These sources are diverse, and include:
Course manuals I have previously prepared
Articles from a newsletter I published while in private practice
Logging service company literature
In the future, I will be able to reprint all the information in a single format for related courses.
bud Thompson
May 28, 1992
4 Z.-
TOPICS WHICH WILL BE COVERED
DRILLING
BOREHOLE ENVIRONMENT
BASICS OF LOGGING
TYPES OF MEASUREMENTS
Mechanical Measurements
Measurements of Natural Occurring Energy
Logs Which Introduce Energy into the Borehole System
PRODUCTION LOGS
BASICS OF LOOKING AT LOGS - Leading to Pitfalls
Relative Volumes Investigated
Porosity Determination
Thin Beds
Rock Typing
Bore Hole Size
LOG CALIBRATIONS
LOG QUALITY CONTROL
LOG QUALITY ASSURANCE
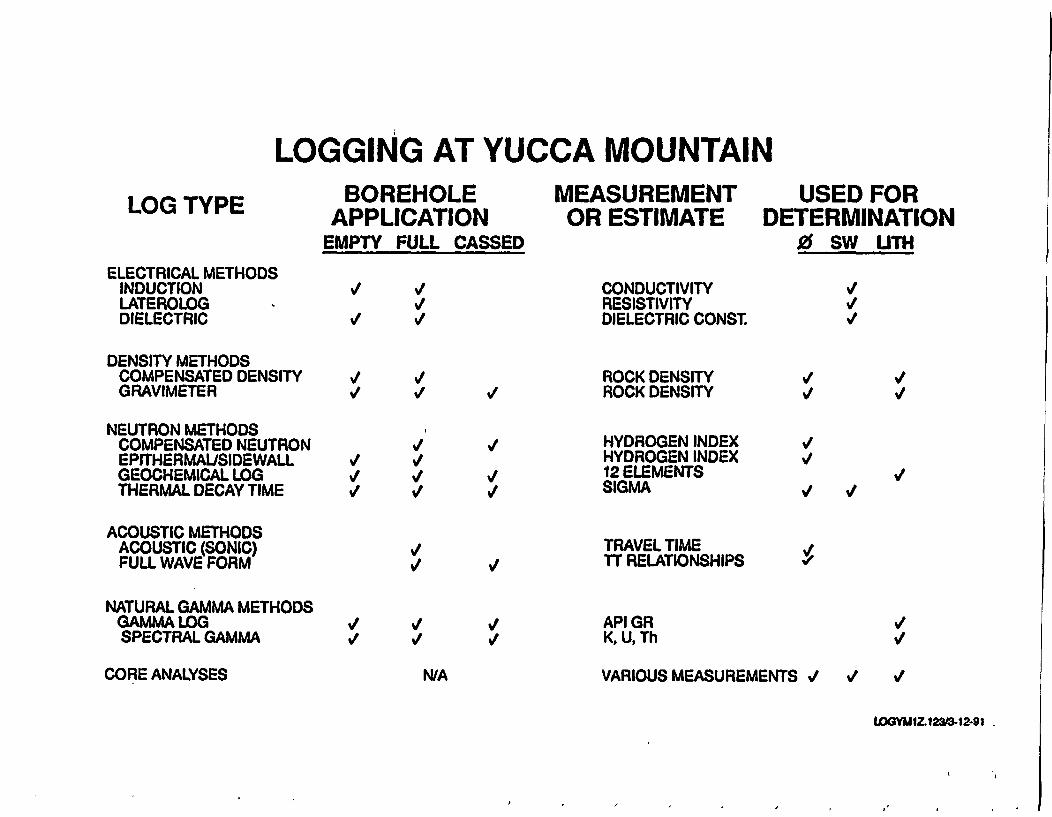
LOGGING AT YUCCA MOUNTAIN
LOG TYPE BOREHOLEAPPLICATION
EMPTY FULL CASSED
MEASUREMENTOR ESTIMATE
USED FORDETERMINATION
0 SW UTH
ELECTRICAL METHODSINDUCTIONLATEROLOGDIELECTRIC
I/ I/CONDUCTIVITYRESISTIVITYDIELECTRIC CONST.
I/I/I/
DENSITY METHODSCOMPENSATED DENSITYGRAVIMETER
NEUTRON METHODSCOMPENSATED NEUTRONEPITHERMALJSIDEWALLGEOCHEMICAL LOGTHERMAL DECAY TIME
ACOUSTIC METHODSACOUSTIC (SONIC)FULL WAVE FORM
NATURAL GAMMA METHODSGAMMA LOGSPECTRAL GAMMA
%tV
I/I/I/
I/V
I/
V
I/
V
V
ROCK DENSITYROCK DENSITYV
I/v
I/I/
I/
I/I/
HYDROGEN INDEXHYDROGEN INDEX12 ELEMENTSSIGMA
TRAVEL TIMETT RELATIONSHIPS
I/I/ I
V
I/
itAPI GRK. U, Th
VIV
CORE ANALYSES N/A VARIOUS MEASUREMENTS / V/ V
LOGYMIZ12&-12-91
DRILLING
AND
BOREHOLE ENVIRONMENT
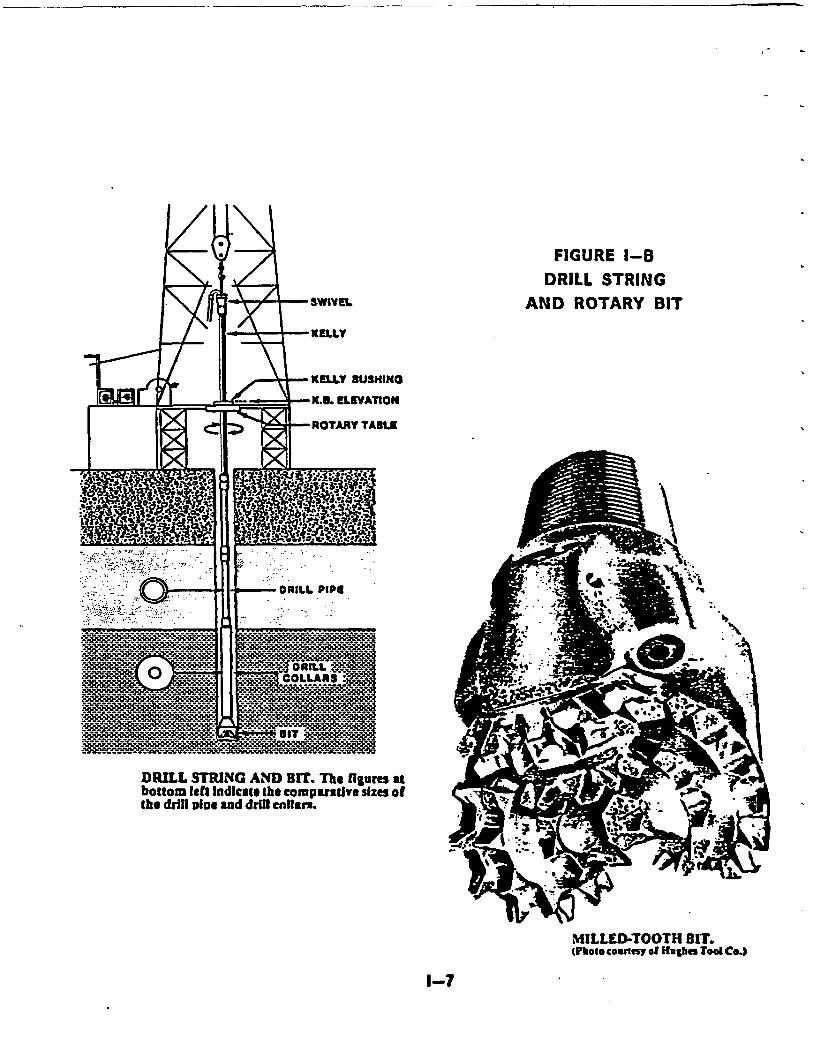
FIGURE 1-BDRILL STRING
AND ROTARY BIT
DRILL STRING AND BIT. The flgurn atbottom left Indicate the comparative sizes ofthe drill vive and drill callarx.
w ,~~~~~~~~~~~%.&MILLEDTOOTH BIT.(Plots coUnny t ofHugh Tool Co.)
1-7
X I I I e l, % *X
CONVENTIONAL OIL FIELD DRILLINGCONFIGURATION
%. a
..
.... . .'
' *- .-- --- .::.- :-
*.,.
4D A P L^ A ° .. ........
DRILLING MUD
DRILLING MUD IS PUMPEDDOWN THE DRILL PIPE,PAST THE TURNING BIT,AND RETURNED TO THESURFACE THROUGH THEANNULAR SPACE BETWEENTHE DRILL ROD AND THEBORE WALL
¼l
'-BORE WALL
-DRILL ROD
,TRICONE BIT
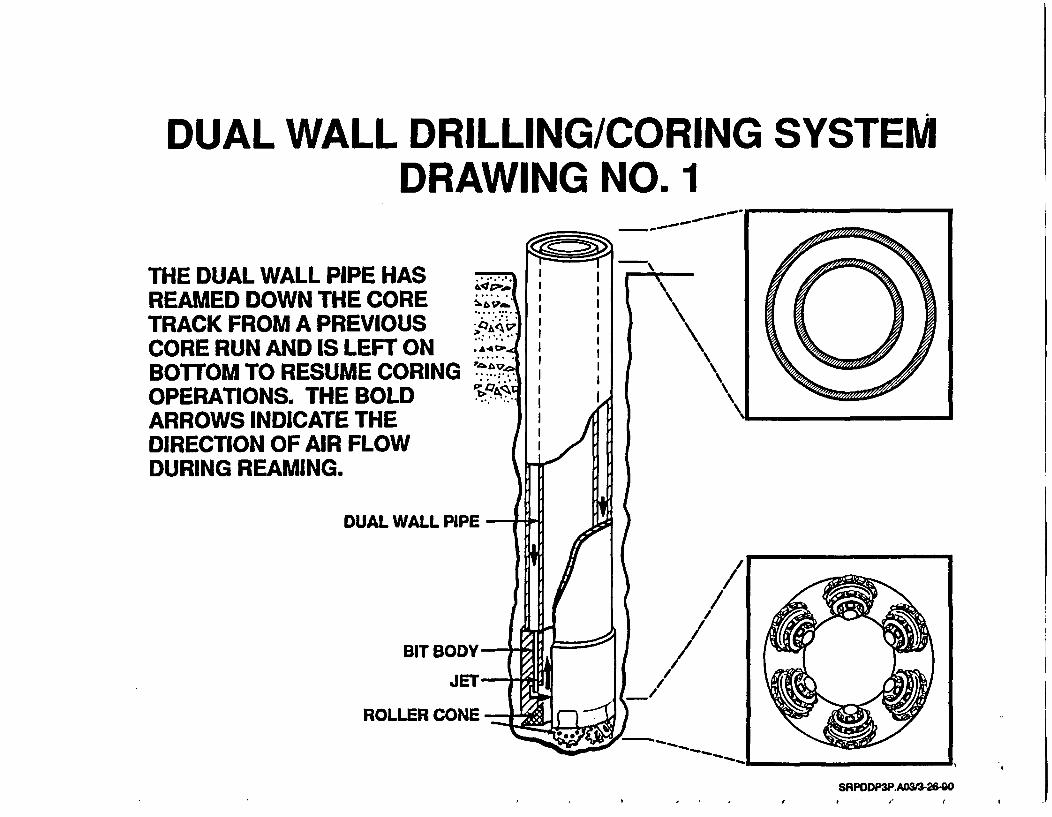
DUAL WALL DRILLING/CORING SYSTEMDRAWING NO. 1
THE DUAL WALL PIPE HASREAMED DOWN THE CORETRACK FROM A PREVIOUS > \CORE RUN AND IS LEFT ON Ah
BOTTOM TO RESUME CORING .KOPERATIONS. THE BOLDARROWS INDICATE THE I
DIRECTION OF AIR FLOWDURING REAMING.
DUAL WALL PIPE
BIT BODY /i
JET /
ROLLER CONE
SRPDDP3P.AOr3-2640I
& IL
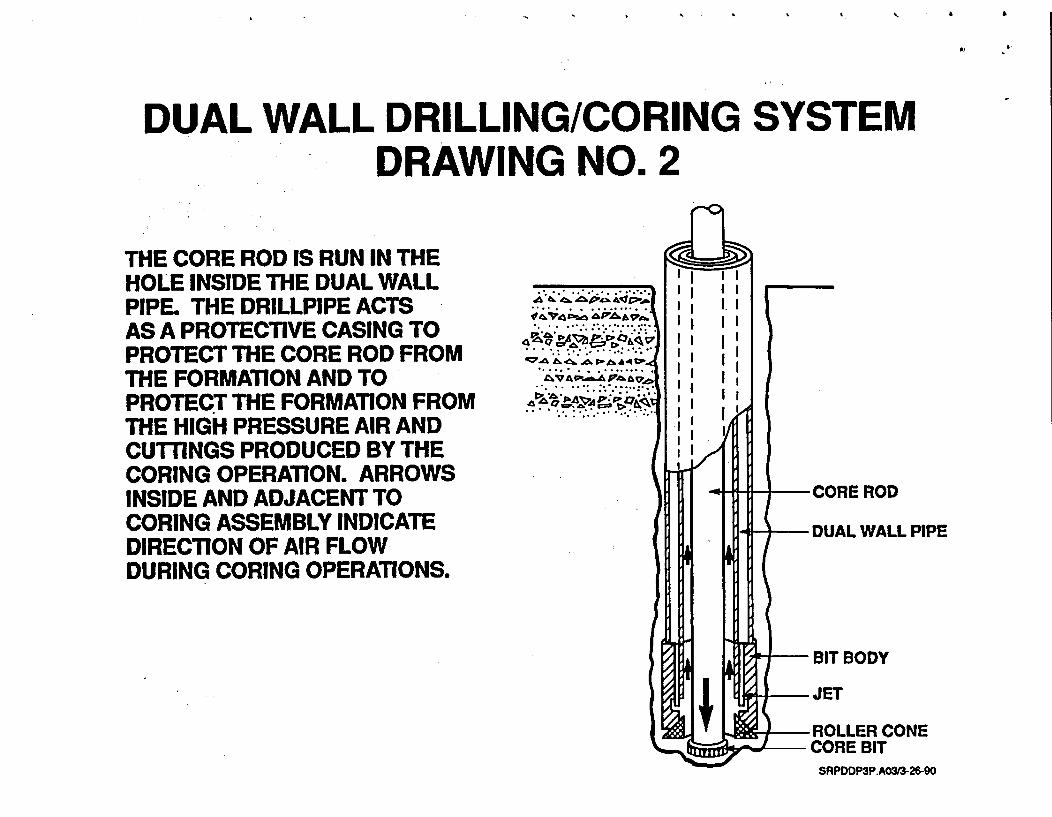
DUAL WALL DRILLING/CORING SYSTEM- DRAWING NO. 2
THE CORE ROD IS RUN IN THEHOLE INSIDE THE DUAL WALLPIPE. THE DRILLPIPE ACTSAS A PROTECTIVE CASING TOPROTECT THE CORE ROD FROMTHE FORMATION AND TOPROTECT THE FORMATION FROMTHE HIGH PRESSURE AIR ANDCUTTINGS PRODUCED BY THECORING OPERATION. ARROWSINSIDE AND ADJACENT TOCORING ASSEMBLY INDICATEDIRECTION OF AIR FLOWDURING CORING OPERATIONS.
.... ..... ...
.,t7 X >i
.: : .:-:*
-CORE ROD
-DUAL WALL PIPE
- BIT BODY
-JET
-ROLLER CONECORE BIT
SRPDDP3P.A03/3a26-90
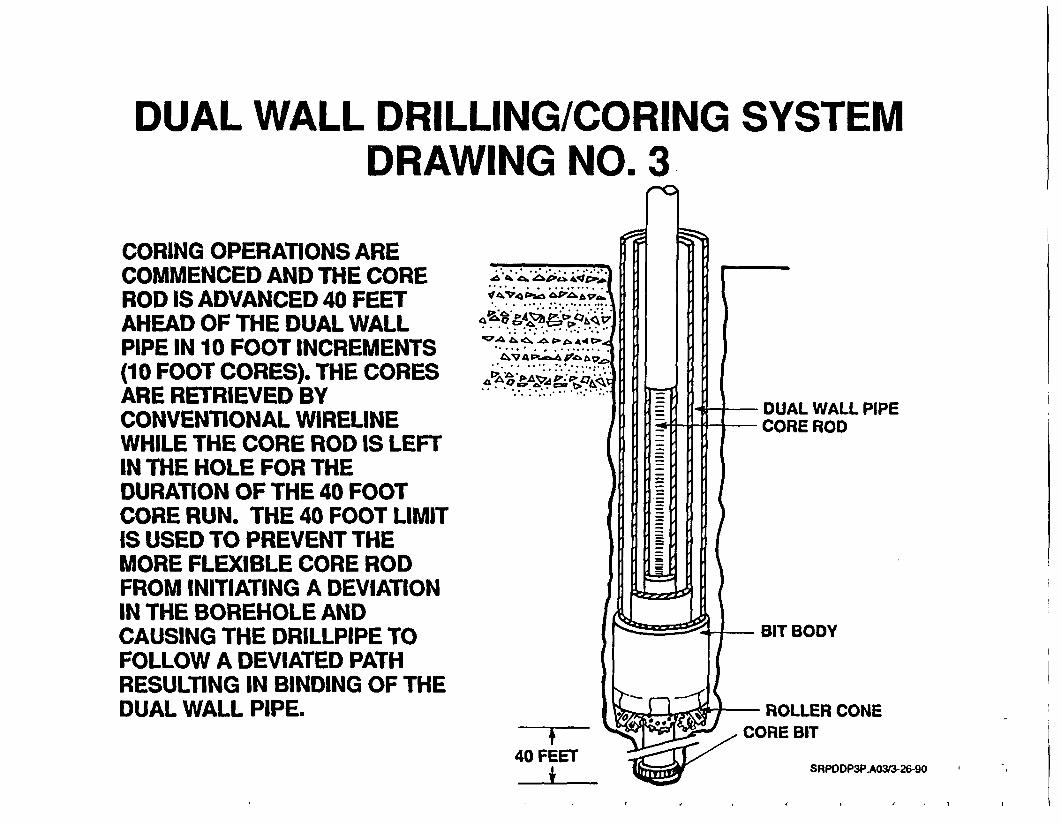
DUAL WALL DRILLING/CORING SYSTEMDRAWING NO. 3
CORING OPERATIONS ARECOMMENCED AND THE COREROD IS ADVANCED 40 FEETAHEAD OF THE DUAL WALLPIPE IN 10 FOOT INCREMENTS(10 FOOT CORES). THE CORESARE RETRIEVED BYCONVENTIONAL WIRELINEWHILE THE CORE ROD IS LEFTIN THE HOLE FOR THEDURATION OF THE 40 FOOTCORE RUN. THE 40 FOOT LIMITIS USED TO PREVENT THEMORE FLEXIBLE CORE RODFROM INITIATING A DEVIATIONIN THE BOREHOLE ANDCAUSING THE DRILLPIPE TOFOLLOW A DEVIATED PATHRESULTING IN BINDING OF THEDUAL WALL PIPE.
..-.. ..... . .
. . ..~~~~~~~. .......
... .. .. . . .
* -- -- -- - .' . , .:
40 FEET
- DUAL WALL PIPE- CORE ROD
- BIT BODY
- ROLLER CONECORE BIT
SRPDDP3P.A03/3-26-90
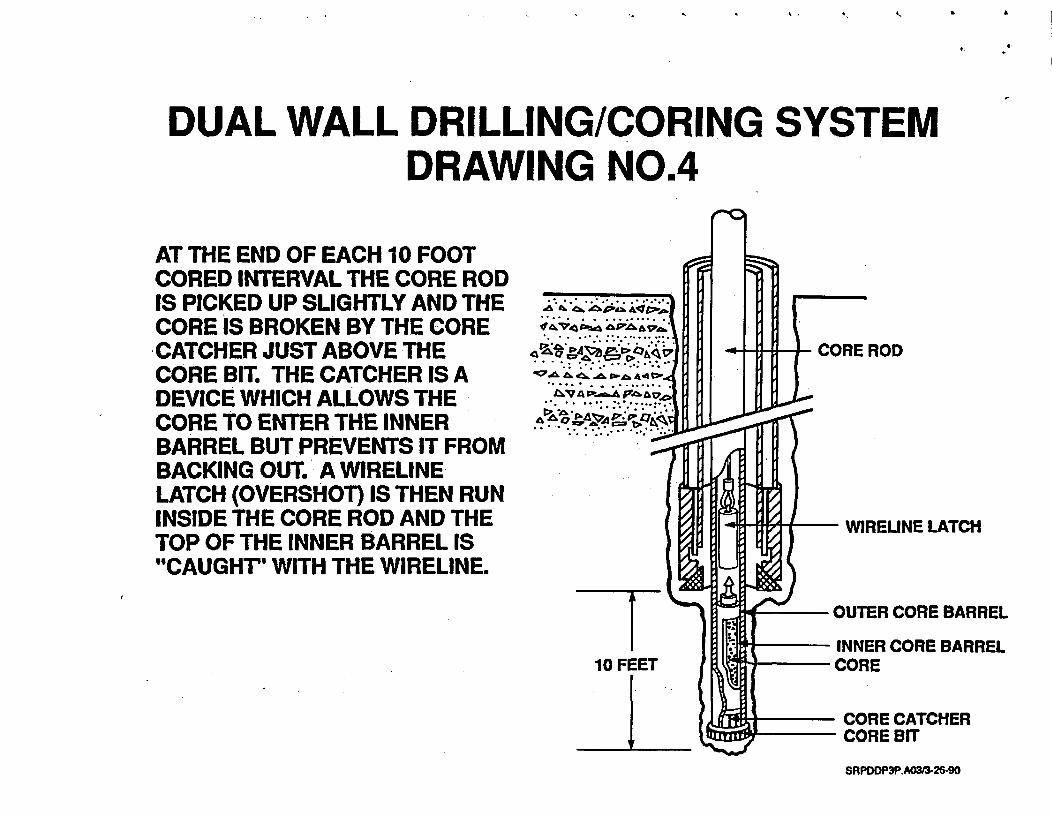
DUAL WALL DRILLING/CORING SYSTEMDRAWING NO.4
AT THE END OF EACH 10 FOOTCORED INTERVAL THE CORE RODIS PICKED UP SLIGHTLY AND THECORE IS BROKEN BY THE CORECATCHER JUST ABOVE THECORE BIT. THE CATCHER IS ADEVICE WHICH ALLOWS THECORE TO ENTER THE INNERBARREL BUT PREVENTS IT FROMBACKING OUT. A WIRELINELATCH (OVERSHOT) IS THEN RUNINSIDE THE CORE ROD AND THETOP OF THE INNER BARREL IS"CAUGHT' WITH THE WIRELINE.
CORE ROD
- WIRELINE LATCH
OUTER CORE BARREL
INNER CORE BARREL, CORE
- CORE CATCHER- CORE BIT
SRPDDP3P.A3O-26-90
DUAL WALL DRILLING/CORING SYSTEMDRAWING NO. 5
AFTER THE CORE IS BROKEN, THEINNER BARREL (WITH CORE HELDIN BY THE CORE CATCHER) ISPULLED OUT OF THE HOLE BYWIRELINE. A NEW (EMPTY) INNERBARREL IS THEN RUN IN HOLE,LATCHED INTO THE OUTERBARREL, AND THE WIRELINE ISREMOVED. THIS SEQUENCE ISREPEATED EACH TIME THE CORETRACK IS ADVANCED 10 FEET.
81A A . .. 4.*v4;~ 2 Fuji A 6
.g
10 FEET
CORE ROD
0-p
- WIREUNE LATCH
INNER COREBARREL
CORE TRACK
CORE BIT
LA20
111-1
bRPDDP3AO3/3-26-90
- - I
DUAL WALL DRILLING/CORING SYSTEM- DRAWING NO. 6
THE CORING STRING IS PULLEDOUT OF THE HOLE AT THE ENDOFTHE40FOOTCORERUN INPREPARATION FOR REAMINGDOWN THE CORE TRACK WITHTHE DUAL WALL PIPE.
. . . .
40 FEEToAn>
DUAL WALL PIPE
CORE ROD
BIT BODYJET
ROLLER CONE
SRPDDP3P.A03/3-26-90
DUAL WALL DRILLING/CORING SYSTEMDRAWING NO. 7
ONCE THE CORING ASSEMBLY ISOUT OF THE BOREHOLE, IT ISDRILLED/REAMED WITH THE DUALWALL DRILL STRING TO THEBOTTOM OF THE CORE TRACK.THE FORMATION IS PROTECTEDFROM CONTAMINATION NORMALLYASSOCIATED WITH DRILLING BYCIRCULATING THE CUTTINGS UPTHE CENTER OF THE DUAL WALLPIPE. CONTAMINATED FORMATIONCAUSED BY THE CORINGOPERATION IS REMOVED WHENTHE CORE TRACK IS REAMEDDOWN. THE BOLD ARROWSINDICATE THE DIRECTION OF AIRFLOW DURING REAMING.
.6 & -v' d.Qrp.~
pA.k .4
CPO~
DUAL WALL PIPE
BIT BODY
JET
ROLLER CONE
BOTTOM OFCORE TRACK
40 FEET
SRPDDP3P.A03#3-26-90
J
LM-300RIG SPECIFICATION
RIG DIMENSIONS:
* OVERALL HEIGHTW/MAST ERECT
* OVERALL WIDTH* OVERALL HEIGHT W/MAST
IN TRANSPORT POSITIONe LENGTH OF MAST
- 84'
a10'
- 15'- 80'6"
DRILLING CAPABILITIES:
* PRIMARY AND SECONDARYPOWER FOR HYDRAULIC/ - 2 CUMMINS KTA19,DRIVE SYSTEMS 600 HP EACH
* POWER TO TOPHEAD DRIVE - 371 HP* MAX. MAST LOAD - 300,000 LBS* PULLBACK CAPABILITY - 238,500 LBS* PULLDOWN CAPABILITY - 30,000 LBS* MAIN HOIST - LONGYEAR 600,
4 SPEED W/3000' OF1/4" LINE AND70,000 LB PULLCAPABILITY
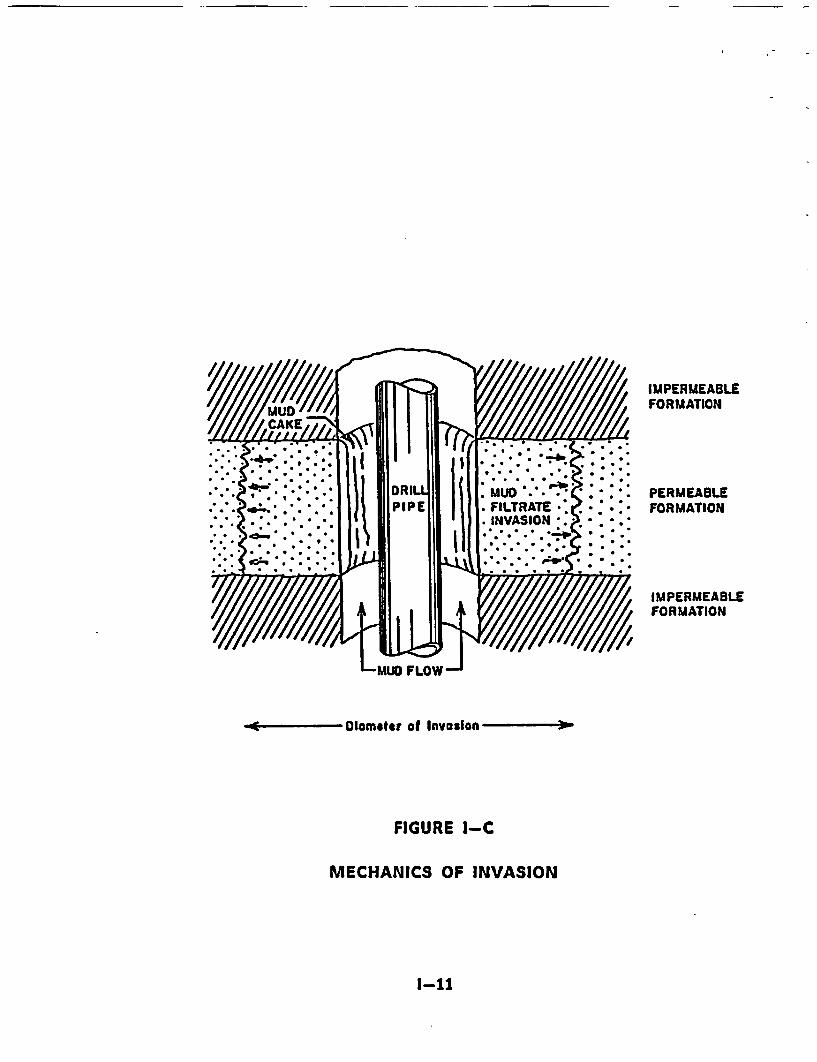
ZONES OF INTEREST SURROUNDINGA MUD-DRILLED WELLBORE
(AFTER SCHLUIMBERGER)
1-12
I
I
I -
30
MEASLflZ-
FOI. 2aR E
FIGURE 11-A
SKETCHES OF LOGGING TOOL ASSEMBLIES(AFTER SCHLUMBERGER)
11-2
OCTOBER 1983 Page 3
BACX tO BASICS
MtAT IS NELL LOGGING?
A well log is a record of a mechanical, electrical, nuclear, or wave energymeasurement made in a borehole. When logging measurements are needed the drillpipe must be withdrawn from the borehole. The logging measurements are made bylowering cylindrical tools into the borehole on a wireline, and pulling the toolsup the hole while recording the measurements at the surface. In analog form, thelog is an x-y chart, where the y axis Is depth from the surface, and the X axisIs the measurement or response of the rock unit at each depth.
A logging tool is made up of a sonde and a cartridge. The sonde is the portionof the tool which gives off energy or receives energy, or both. The cartridgecontains the electrical circuitry to control the downhole equipment, and totransmit and receive data to and from the surface. The wireline supports theweight of the downhole tool, and provides transmission medium for data transfer.
Surface equipment is mounted in a logging truck or van from which all loggingoperations are controlled. The logging unit contains pulling equipment forlowering and raising the tools in the hole, and electronic equipment forcontrolling and recording the downhole measurements. Measurements are recordedin two forms: (1) analog, and (2) digital. The analog data may be recorded onphotographic film or chart recorder, and are the primary data. The same data arecaptured in digital form on magnetic tape for later use in computer-aidedanalysis.
All logging tools and surface equipment must be properly calibrated for the work.Service companies have calibration procedures for all tools, most of which arebased on standards established by the American Petroleum Institute (API). Eachtool must be calibrated at the surface before placing it in the hole to makemeasurements, and must pass certain calibrations after the measurements arecomplete. Some tools also have downhole calibration checks.
After reaching total depth (TD), or some other location of interest in theborehole, measurements are made while pulling the tool upward over severalhundred feet of the borehole. This in called the repeat run, and is used todetermine the repeatability of the measurements when compared to the main loggingpass which follows immediately. After the repeat run is complete, the tool islowered to TD, and a main logging pass is commenced. During the early portion ofthese measurements, the responses are compared to those of the repeat run todetermine that no instrument drift has occurred.
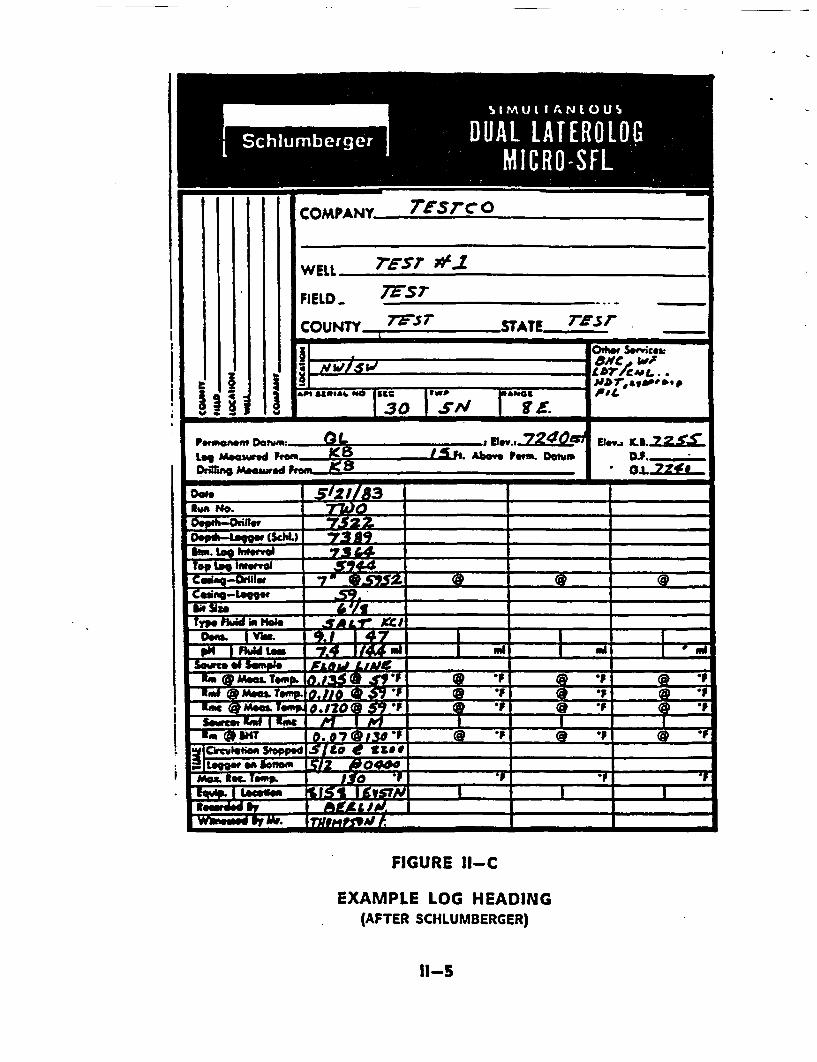
In addition to the actual measurements, the well log record contains Informationabout the logging process which supports use and Interpretation of the data. Thewell name, location, date, surface measurements on the mud system, drill bitsize, casing information, and logging equipment data are standard items found onthe log heading. Any pertinent information regarding the logging job may berecorded in the remarks section. Results of all field calibration tests andrepeats are attached to the bottom of the well log record.
-buds logging ne? Is published monthly by Laren E. "bud' Thompson, Inc.1858 South Wadsworth, Suite 101, LfIwood, Colorado 80228 3/798-0200
Copyright, 1983, Loran E. "bud' Thompson, kc. No part d tis" publication may be mprduced hI any formor by any means without the written permission of the publisher.
OCTOBER 1983 Page 4
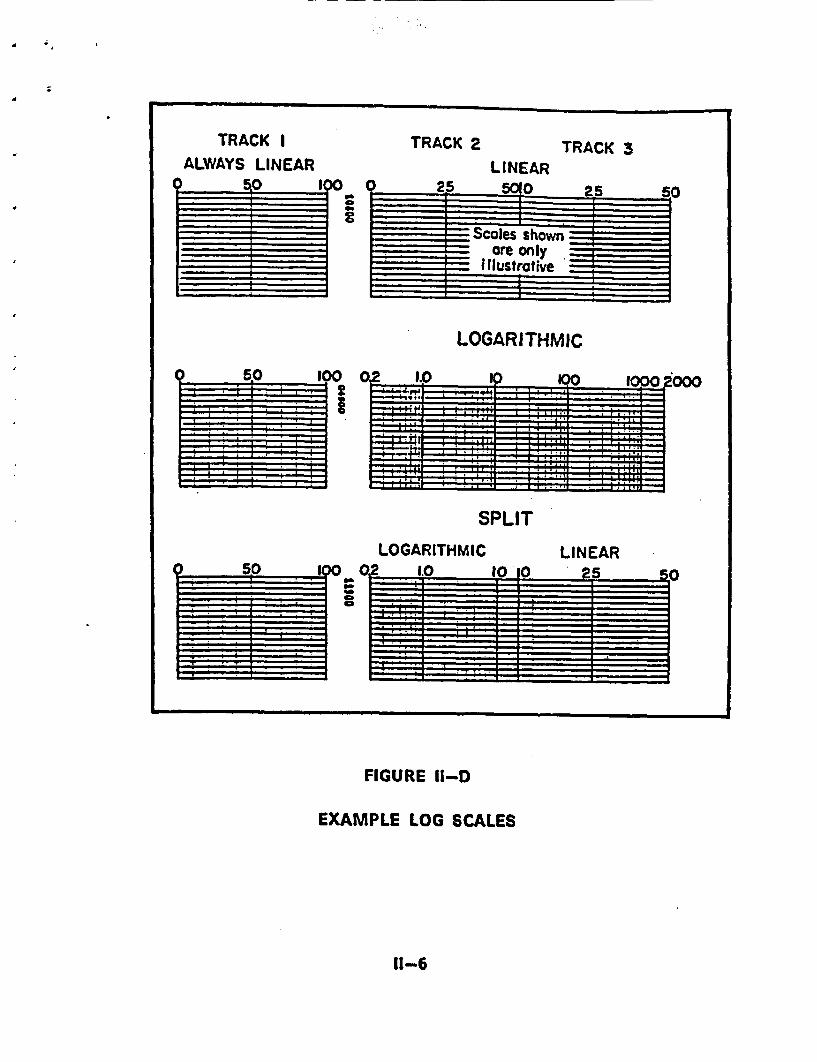
Standard depth (y coordinate) scales used in the U.S. are 5 inches per 1I3 ft.,and half scale 2 inches per 11I ft. International logs may be presented inmetric scales of 6 inches per 199 ft. The log response or measurement recordedon the x coordinate is scaled in various units depending upon the type ofmeasurement being made. in analoq form, the data are recorded in tracks acrossthe film or paper. A two and one half inch wide track on the left side is calledtrack one, and two similar tracks appear on the right side of the log. Betweentrack one and track two is a narrow open space called the depth track where thedepth is recorded.
The quality of the data is paramount to accurate analysis of logs. Since openhole tools cannot make measurements through iron casing, it is imperative thatadequate quality control be exercised during the original logging process, whilethe hole is open and uncassed.
"YOU CANNOT RECALL A LOG POR REPAIR"
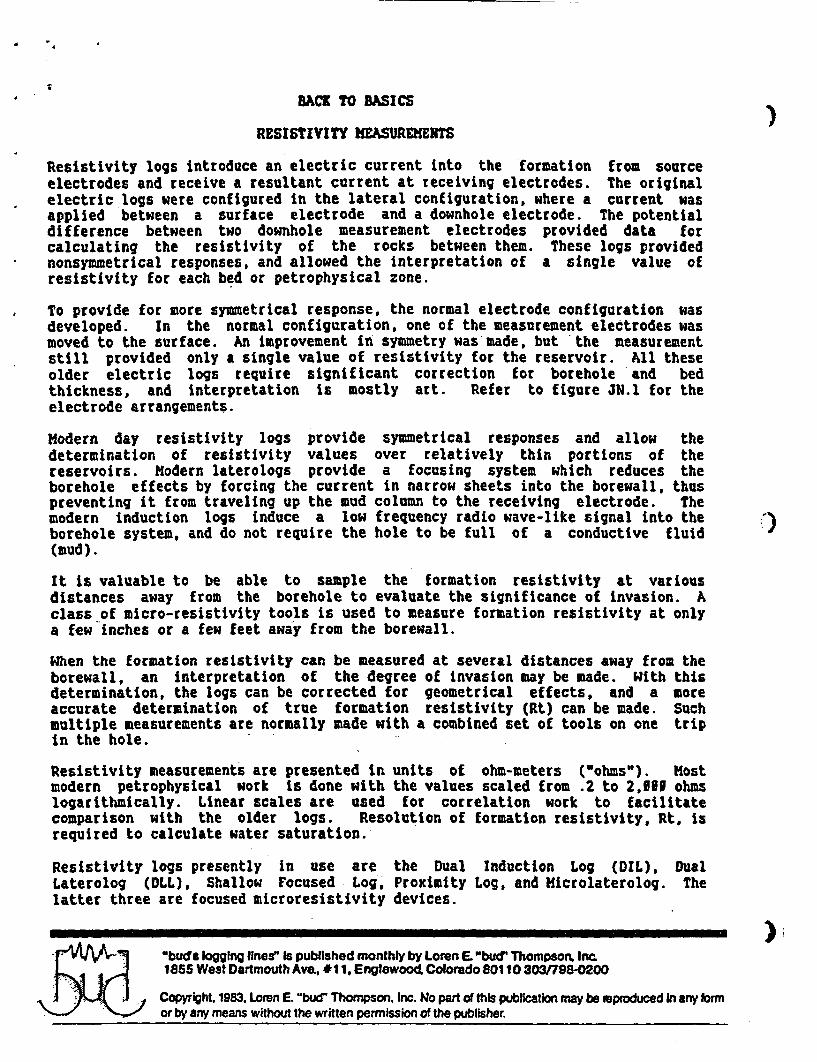
- LOGGING TOOL
AMPLIFIER AND- OSCILLATOR HOUSING
(After Schlumberger)
~- RECEIVER COIL-4
6
--- TRANSMITTER COIL
BOREHOLE
- - -
%bud's logging Ines' Ls published monthly by Loren E. "bud"Thompson, Ic.158 South Wadswortt% Suite 101, Lakewood. Colorado 80226 3O3I79 2O
Copyright 1983. Loren E. "bud' Thompson, Inc. No par d this publication may be reproduced in any formor by any means without the written permission of the publisher.
'I
0
'ma~
COMPANY Trsrc 0
WELL rrsT #11FIELD_ - ES -
COUNTYr , ,STATE -rr -. . ~~~~~~~~
Al;i .;i mwi/sw
oI S .vicma&VC Lw;lwTACL. -
JJT,a,*"* p.6,LI II
U- -
30 I 59y IgZ.a
L moamd Prm I_ - . AKom /Pwa. Do.F.Orm" m ed G . Ko1L
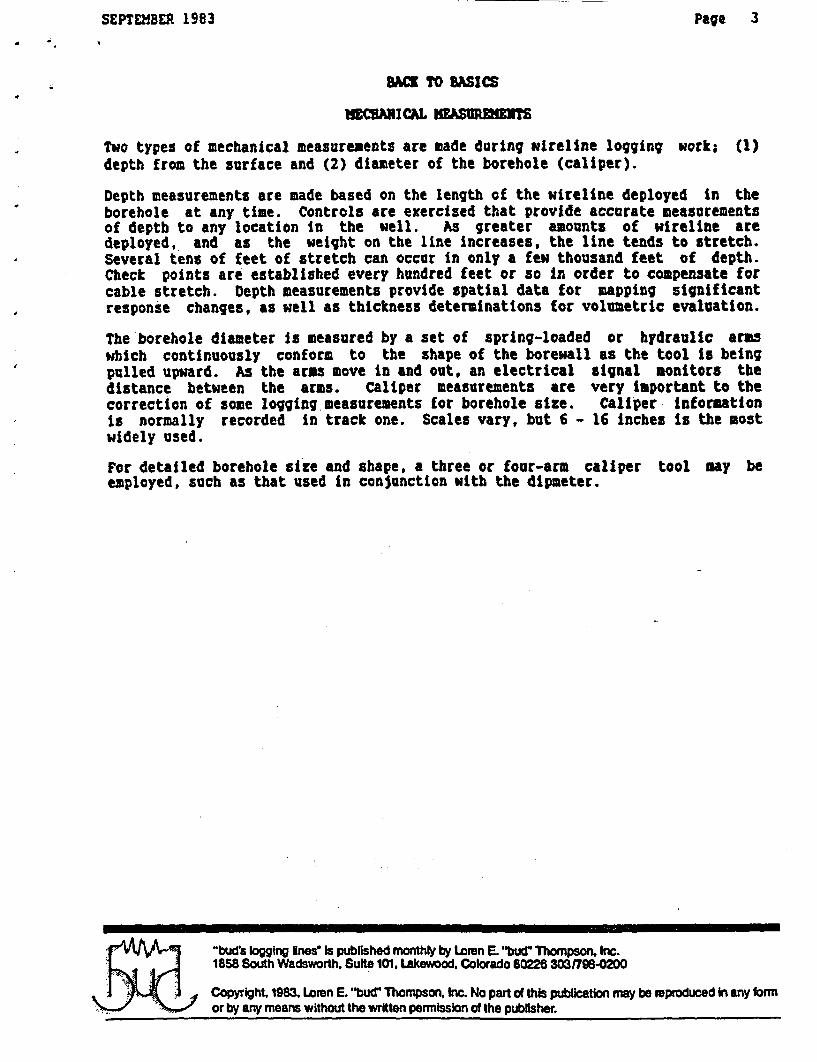
Two types of mechanical measurements are made during wireline logging work;depth from the surface and (2) diameter of the borehole (caliper).
(1)
Depth measurements are made based on the length of the wireline deployed in theborehole at any time. Controls are exercised that provide accurate measurementsof depth to any location in the well. As greater amounts of wireline aredeployed, and as the weight on the line increases, the line tends to stretch.Several tens of feet of stretch can occur in only a few thousand feet of depth.Check points are established every hundred feet or so in order to compensate forcable stretch. Depth measurements provide spatial data for mapping significantresponse changes, as well as thickness determinations for volumetric evaluation.
The borehole diameter is measured by a set of spring-loaded or hydraulic armswhich continuously conform to the shape of the borewall as the tool is beingpulled upward. As the arms move in and out, an electrical signal monitors thedistance between the arms. Caliper measurements are very important to thecorrection of some logging measurements for borehole size. Caliper informationis normally recorded in track one. Scales vary, but 6 - 16 inches is the mostwidely used.
For detailed borehole size and shape, a three or four-arm caliperemployed, such as that used in conjunction with the dipmeter.
tool say be
'bud's logging ines Is published monthly by Loran E. "bud Thompson. Inc.1858 South Wadsworth, Suite 101, Lakewood, Colorado 802 3 n798-02D0
Copyright, 1983, Loren E. 'I Thompson, Inc. No part of this publication may be Eproduced In any 1ormor by any means without the written permission of the publisher.
FIGURE III-D
SP CURRENTS IN A LIQUID-FILLED BOREHOLE
(AFTER DRESSER)
Ill-11
DECEMBER 1983ae Page 4
BACK TO BASICS
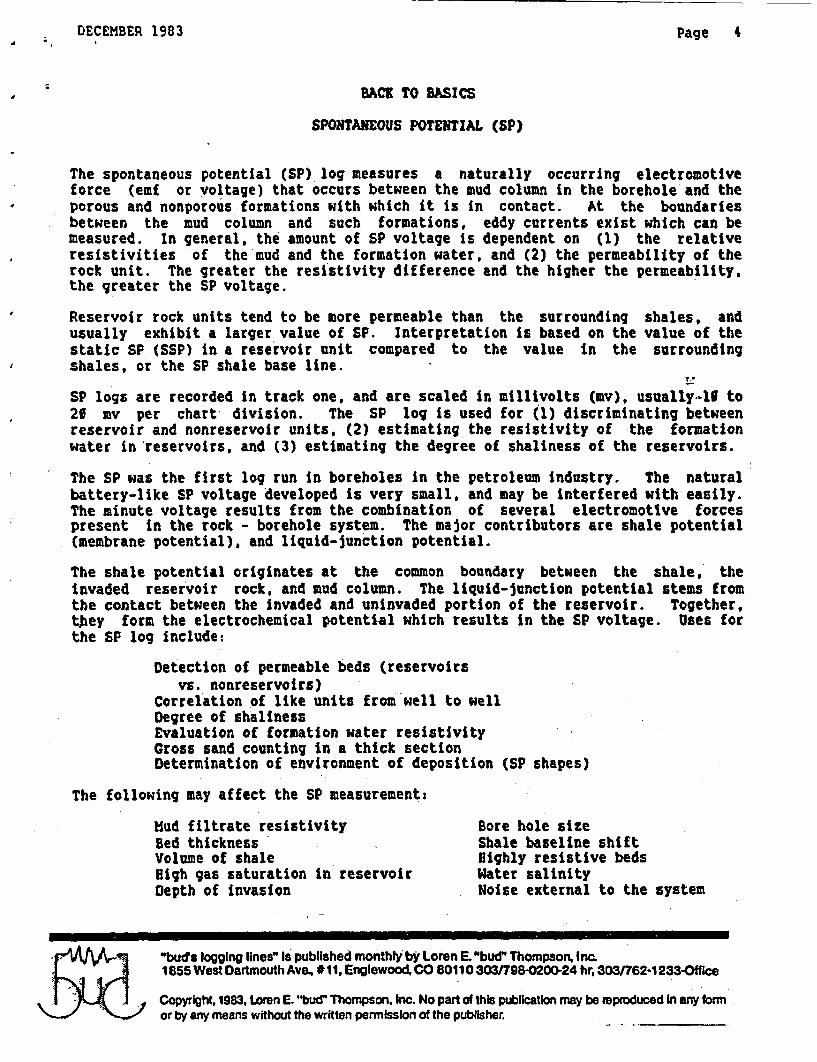
SPONTANEOUS POTENTIAL (SP)
The spontaneous potential (SP) log measures a naturally occurring electromotiveforce (emf or voltage) that occurs between the mud column in the borehole and theporous and nonporous formations with which it is in contact. At the boundariesbetween the mud column and such formations, eddy currents exist which can bemeasured. In general, the amount of SP voltage is dependent on (1) the relativeresistivities of the mud and the formation water, and (2) the permeability of therock unit. The greater the resistivity difference and the higher the permeability,the greater the SP voltage.
Reservoir rock units tend to be more permeable than the surroundingusually exhibit a larger value of SP. Interpretation is based on thestatic SP (SSP) in a reservoir unit compared to the value in theshales, or the SP shale base line.
shales, andvalue of thesurrounding
I..
SP logs are recorded in track one, and are scaled in millivolts (mv), usually-lU to20 mv per chart division. The SP log is used for (1) discriminating betweenreservoir and nonreservoir units, (2) estimating the resistivity of the formationwater in 'reservoirs, and (3) estimating the degree of shaliness of the reservoirs.
The SP was the first log run in boreholes in the petroleum industry. The naturalbattery-like SP voltage developed is very small, and may be interfered with easily.The minute voltage results from the combination of several electromotive forcespresent in the rock - borehole system. The major contributors are shale potential(membrane potential), and liquid-junction potential.
The shale potential originates at the common boundary between the shale, theinvaded reservoir rock, and mud column. The liquid-junction potential stems fromthe contact between the invaded and uninvaded portion of the reservoir. Together.tjhey form the electrochemical potential which results in the SP voltage. Uses forthe SP log include:
Detection of permeable beds (reservoirsvs. nonreservoirs)
Correlation of like units from well to wellDegree of shalinessEvaluation of formation water resistivityGross sand counting in a thick sectionDetermination of environment of deposition (SP shapes)
The following may affect the SP measurement:
Mud filtrate resistivityBed thickness 'Volume of shaleHigh gas saturation in reservoirDepth of invasion
Bore hole sizeShale baseline shiftHighly resistive bedsWater salinityNoise external to the system
"bud's logging lines" Is published monthtl by Loren E. 'bud" Thompson, Inc.1855 West Dartmouth Avem *11, Englewoodc CO 80110 303/798-0200-24 hr, 3031762-1233-Office
Copyright, 1983. Loren E. "bud" Thompson. Inc. No part of this publication may be epfoduced In any formor by any means without the written permission of the publisher.
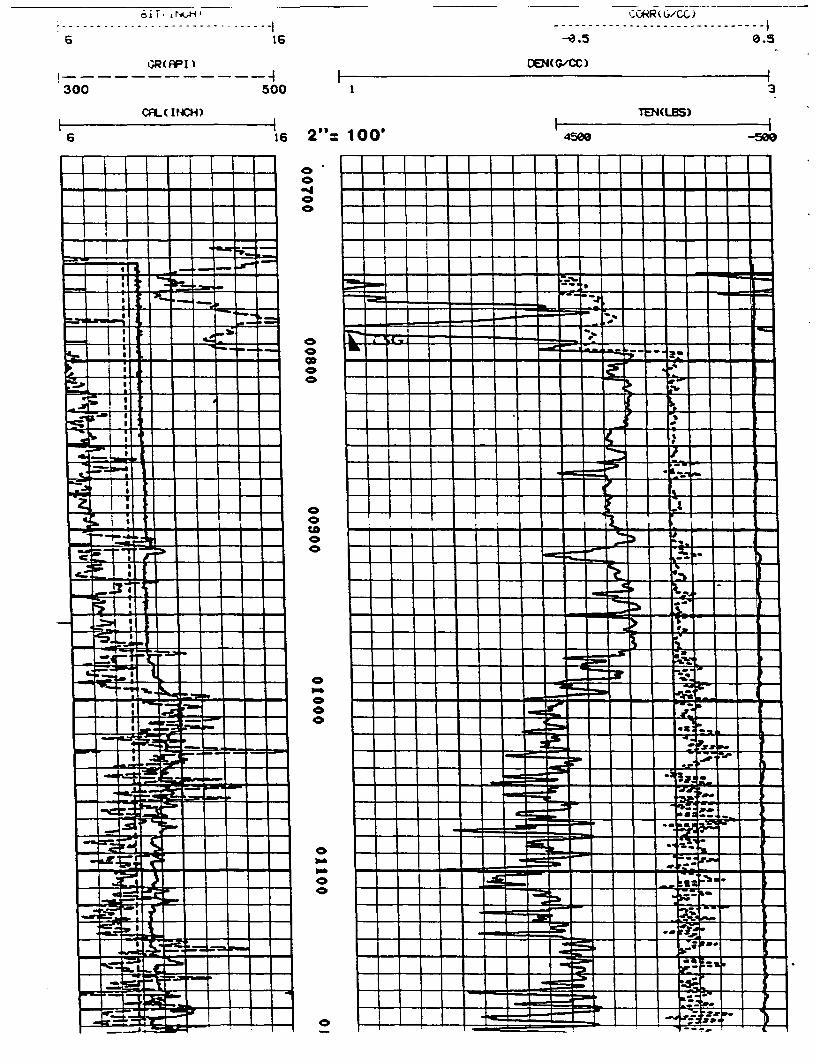
OiT' 9 NtkH
-I-e0.5 0.56 16
GR(FI I
300 500
CFL(INCH)
cEN(G/CC)
I 3
TENWLBS)Ii
6 i6 2": 100' 4s5 -500
- I nf L
- 1.- ****.. 1 1 1 - I I I-
191111
______
__s r :Lt I -
-- V1 11111 * - - -I -
:71 i i r~
L I 1 1 1
Coo
0
-d0
0
00
00
00Coo
0
0
00
0
0
0
0
0
'U-
-
p.
Ia.
sO
-i--si-
AUGUST 1983 Page 3
*BACK TO BASICS
GABA RAY HEASURET
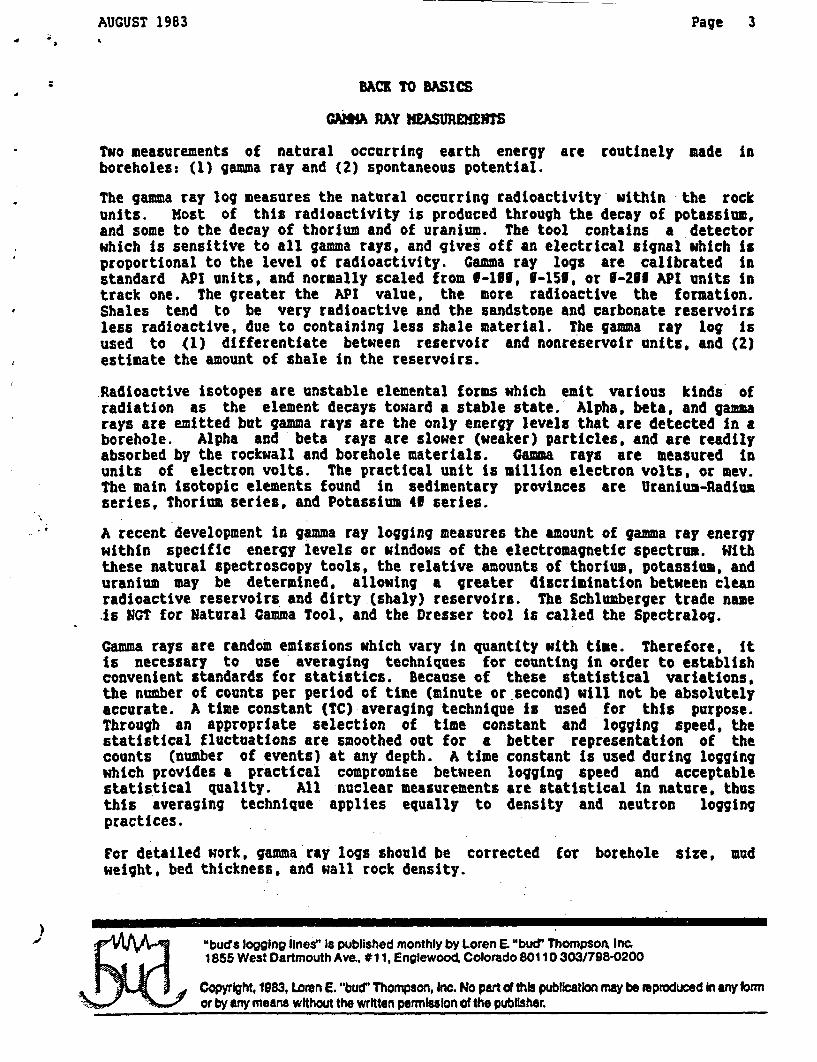
Two measurements of natural occurring earth energy are routinely made inboreholes: (1) gamma ray and (2) spontaneous potential.
The gamma ray log measures the natural occurring radioactivity within the rockunits. Most of this radioactivity is produced through the decay of potassium.and some to the decay of thorium and of uranium. The tool contains a detectorwhich is sensitive to all gamma rays, and gives off an electrical signal which isproportional to the level of radioactivity. Gamma ray logs are calibrated instandard API units, and normally scaled from 6-101, 1-151, or 6-201 API units intrack one. The greater the API value, the more radioactive the formation.Shales tend to be very radioactive and the sandstone and carbonate reservoirsless radioactive, due to containing less shale material. The gamma ray log isused to (1) differentiate between reservoir and nonreservoir units, and (2)estimate the amount of shale in the reservoirs.
Radioactive isotopes are unstable elemental forms which emit various kinds ofradiation as the element decays toward a stable state. Alpha, beta, and gammarays are emitted but gamma rays are the only energy levels that are detected in aborehole. Alpha and beta rays are slower (weaker) particles, and are readilyabsorbed by the rockwall and borehole materials. Gamma rays are measured inunits of electron volts. The practical unit is million electron volts, or mev.The main isotopic elements found in sedimentary provinces are Uranium-Radiumseries, Thorium series, and Potassium 41 series.
A recent development in gamma ray logging measures the amount of gamma ray energywithin specific energy levels or windows of the electromagnetic spectrum. Withthese natural spectroscopy tools, the relative amounts of thorium, potassium, anduranium may be determined, allowing a greater discrimination between cleanradioactive reservoirs and dirty (shaly) reservoirs. The Schlumberger trade name.is NGT for Natural Gamma Tool, and the Dresser tool is called the Spectralog.
Gamma rays are random emissions which vary in quantity with time. Therefore, itis necessary to use averaging techniques for counting in order to establishconvenient standards for statistics. Because of these statistical variations,the number of counts per period of time (minute or second) will not be absolutelyaccurate. A time constant (TC) averaging technique is used for this purpose.Through an appropriate selection of time constant and logging speed, thestatistical fluctuations are smoothed out for a better representation of thecounts (number of events) at any depth. A time constant is used during loggingwhich provides a practical compromise between logging speed and acceptablestatistical quality. All nuclear measurements are statistical in nature, thusthis averaging technique applies equally to density and neutron loggingpractices.
For detailed work, gamma ray logs should be corrected for borehole size, mudweight, bed thickness, and wall rock density.
a? , Zbuds logging linesa Is published monthly by Loren E "bud' Thompson, Inc.1855 West DartmouthAve. #11, Englewood, Colorado80110 303/798-0200
Copyright. 1983, Loren E. "bud" Thompson, Inc. No part of this publication may be mproduced In any brmor by any means without the written permission of the publisher.
I. I
IiI
IiI
. kI N(. r - r)F.TECTOR L.O:ArF.D ; S () FT.. 12-r
4ccc:'
;'ILE I 'ae-jAN-19?1 :6:56
. - -- ----
I -- J)4N- 19 9 1 2 1, " B
900
1000
1100
1200
Page 5April 1984
ADVANCED STUFP
NATURAL SPECTROSCOPY LOGGING
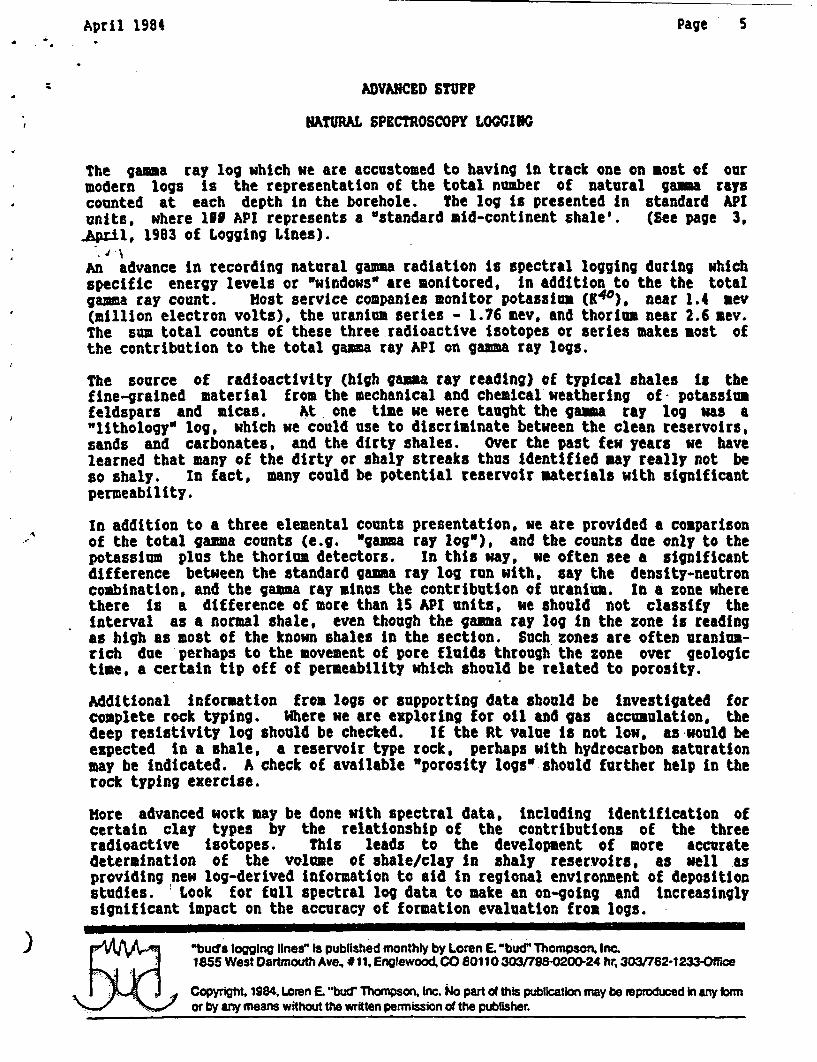
The gamma ray log which we are accustomed to having in track one on most of ourmodern logs is the representation of the total number of natural gamma rayscounted at each depth in the borehole. The log is presented in standard APIunits, where lAG API represents a wstandard mid-continent shale'. (See page 3,.April, 1983 of Logging Lines).
7,
An advance in recording natural gamma radiation is spectral logging during whichspecific energy levels or "windows" are monitored, in addition to the the totalgamma ray count. Host service companies monitor potassium (K40), near 1.4 mev(million electron volts), the uranium series - 1.76 mev, and thorium near 2.6 3ev.The sum total counts of these three radioactive isotopes or series makes most ofthe contribution to the total gamma ray API on gamma ray logs.
The source of radioactivity (high gamma ray reading) of typical shales is thefine-grained material from the mechanical and chemical weathering of- potassiumfeldspars and micas. At one time we were taught the gamma ray log was a"lithology" log, which we could use to discriminate between the clean reservoirs,sands and carbonates, and the dirty shales. Over the past few years we havelearned that many of the dirty or shaly streaks thus identified may really not beso shaly. In fact, many could be potential reservoir materials with significantpermeability.
In addition to a three elemental counts presentation, we are provided a comparisonof the total gamma counts (e.g. 'gamma ray log'), and the counts due only to thepotassium plus the thorium detectors. In this way, we often see a significantdifference between the standard gamma ray log run with, say the density-neutroncombination, and the gamma ray minus the contribution of uranium. In a zone wherethere is a difference of more than 15 API units, we should not classify theinterval as a normal shale, even though the gamma ray log in the zone is readingas high as most of the known shales in the section. Such zones are often uranium-rich due perhaps to the movement of pore fluids through the zone over geologictime, a certain tip off of permeability which should be related to porosity.
Additional information from logs or supporting data should be Investigated forcomplete rock typing. Where we are exploring for oil and gas accumulation, thedeep resistivity log should be checked. If the Rt value Is not low, as would beexpected in a shale, a reservoir type rock, perhaps with hydrocarbon saturationmay be indicated. A check of available 'porosity logs':should further help in therock typing exercise.
More advanced work may be done with spectral data, including identification ofcertain clay types by the relationship of the contributions of the threeradioactive isotopes. This leads to the development of more accuratedetermination of the volume of shale/clay in shaly reservoirs, as well asproviding new log-derived information to aid in regional environment of depositionstudies. Look for full spectral log data to make an on-going and increasinglysignificant impact on the accuracy of formation evaluation from logs.
abuds logging lines" Is published monthly by Loren E. "bud" Thompson, Inc._1855 West Dartmouth Ave, # I 1, Englewood, CO 80110 303/798-0200-24 hr. 303/762-1233-Ofrice
Copyright, 1984, Loren E. "budr Thompson, Inc. No part of this pubication may be mpmduced i any bfmor by any means without the written permission of the publisher.
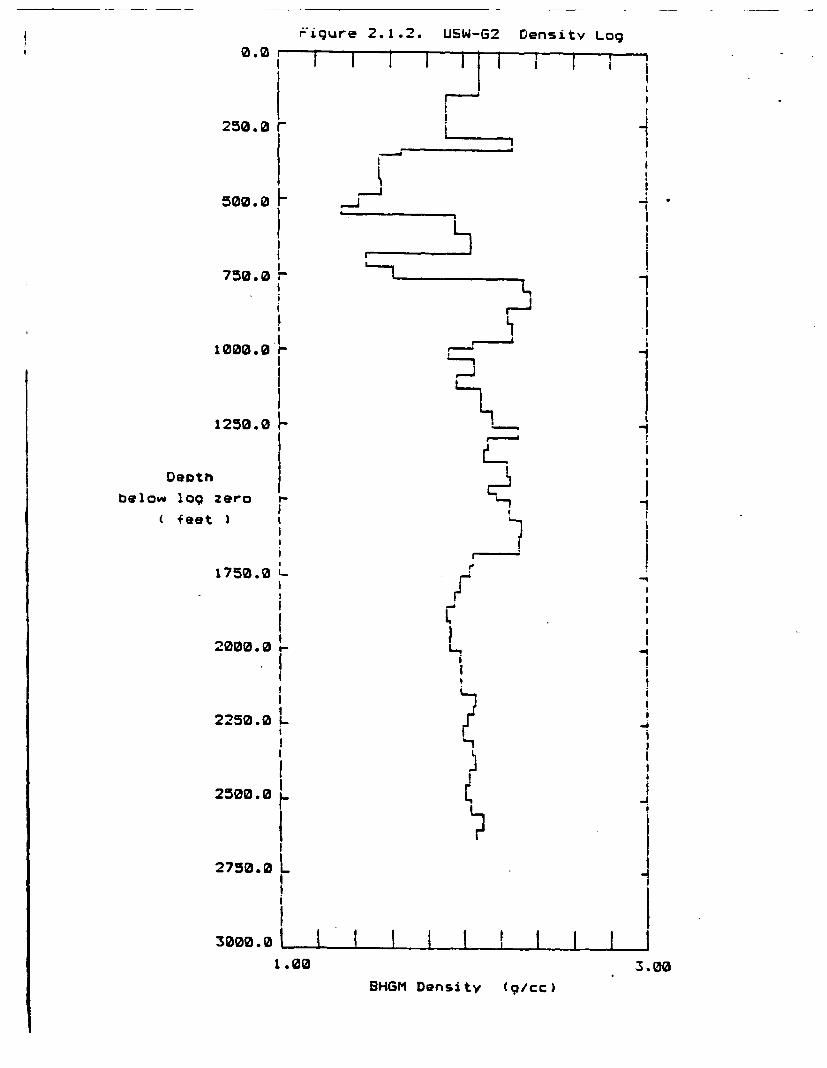
II -igure 2.1.2. USW-G2 Density Log
i 0.0
I250.0 1-
500.0
750.0 r
1000.0 I-
1250.0 1
DeDthm ]
below~ log Zero w
fe et
1750.0 e..
1
2000.0 l
2
12:50Z.0L
g~~~~ I I i
_~~~ I
1I
- -1
A_ I
I-
l~~~~
L -i
I:-I
Irj
25000.0 L
2750.0 L
3000 .0 I I I I 1 e I I I
1.00 3.00
BHGM Density (9/cc)
Pebruary 1984 Page 3
BACK TO USICS
BORUOLS GRAVITY LOG
(Note: There are only a few of these instruments In captivity. When I lastchecked, the USCS had two, and Amoco Production Research had three or four. Theonly source of cotuercial borehole gravity services of which I an aware is EDCONin Denver, Colorado. - Ed.)
A measurement of the force of gravity Is made using a small, sensitive LaCosteand Romberg Borehole Gravity Meter (BUGM). The basic Instrument used and measure-sent made are the same as for surface gravity surveys. The spring balance equip-sent is thermostatically controlled, packaged in a Dewar flask, and kept at con-stant temperature to protect it from wellbore temperature changes. An intricatesystem of tri-axial drive motors keeps the down hole meter horizontal In deviatedholes.
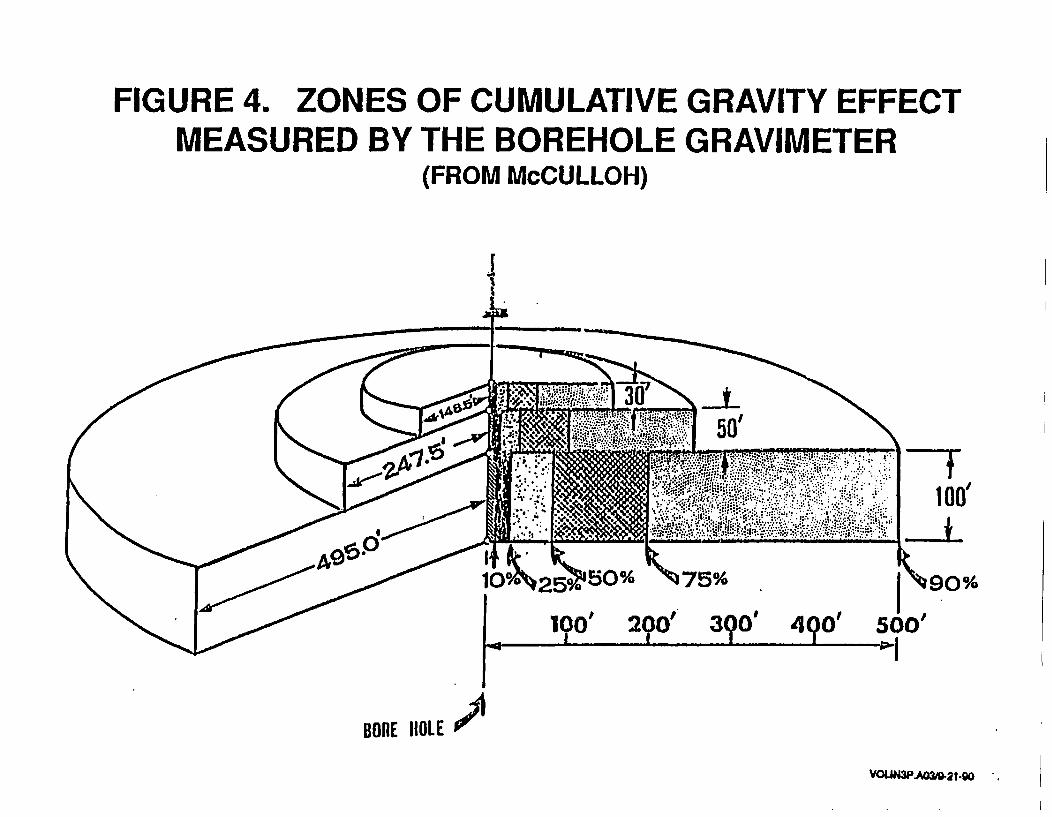
Stationary measurements are made at various depths in the borehole. Typical sea-surement time is from five to ten minutes for a station. Iith a value of gravi-tational attraction for each station, the vertical change in gravity, A~g over aslab thickness, A : can be determined. The bulk density of the rock between anytwo measurements may then be calculated, and Is virtually unaffected by wellcasing, washouts, and othar near-wellbore considerations. Compared to conven-tlonal logging tools, the volume of investigation and subsequent depth of investi-gation is very large, and may generally be related to station spacing.
The meter is so sensitive that earthquakes and underground nuclear tests have beendetected thousands of miles away. Under favorable conditions, rock bulk densitiesmay be determined within 0.01 go/cc Or less over ten foot vertical intervals Inthe wellbore.
For most applications In petroleum exploration and development, the gravity-derived density Is compared to the conventional nuclear type density log made inthe open hole. Since the nuclear density log has only several lnches of Investi-gation around the wellbore, differences between the density log and BsaG densitymay be explained by a difference in porosity (or pore fluid composition) away fromthe borehole. The natural extension of this concept Is the detection of fluid-filled fracture systems which do not Intersect the borehole, and near-eell reefcomplexes which were missed while drilling. Much success in the latter applica-tion has been reported in the Michigan reef plays. 1f a gas zone is highlyinvaded and logged with open hole logs prior to dissipation, a subsequent BOUGsurvey will detect the presence of gas In the uninvaded zone.
SHCM studies have been used for three ain purposess (1) structural mapping, (2)formation evaluation in conjunction with open hole resistivity logs, and (3)reservoir analysis, normally involving the monitoring of residual oil saturationat time intervals during production.
The meter is sensitive to shock, and is usually transported within the passengercompartment of commercial airliners an the way to the location. Because of thereplacement costs of new tools, it is preferable to run the surveys in casedholes, but open-hole surveys are made under favorable hole conditions.
",bud' logging linesr Is published monthly by Loren E. bud" Thompson, Inc.1855 West Dartmouth Ave.* 11 Engtewooc, CO 80110 303/798-0200.24 hr, 303/762-1233-Office
Copyright, 1984, Loren E. "bud" Thompson, Inc. No part of this publication may be ieproduced hi any formor by any means without the written permission of the publisher.
FIGURE 4. ZONES OF CUMULATIVE GRAVITY EFFECTMEASURED BY THE BOREHOLE GRAVIMETER
(FROM McCULLOH)
I~~~~
;
\ ^9~~~~~~~~5 I 0/ 75/°250% 75% j 90%
BORE 11OLE
VOUN3P.AO2&g21.90
d . ,
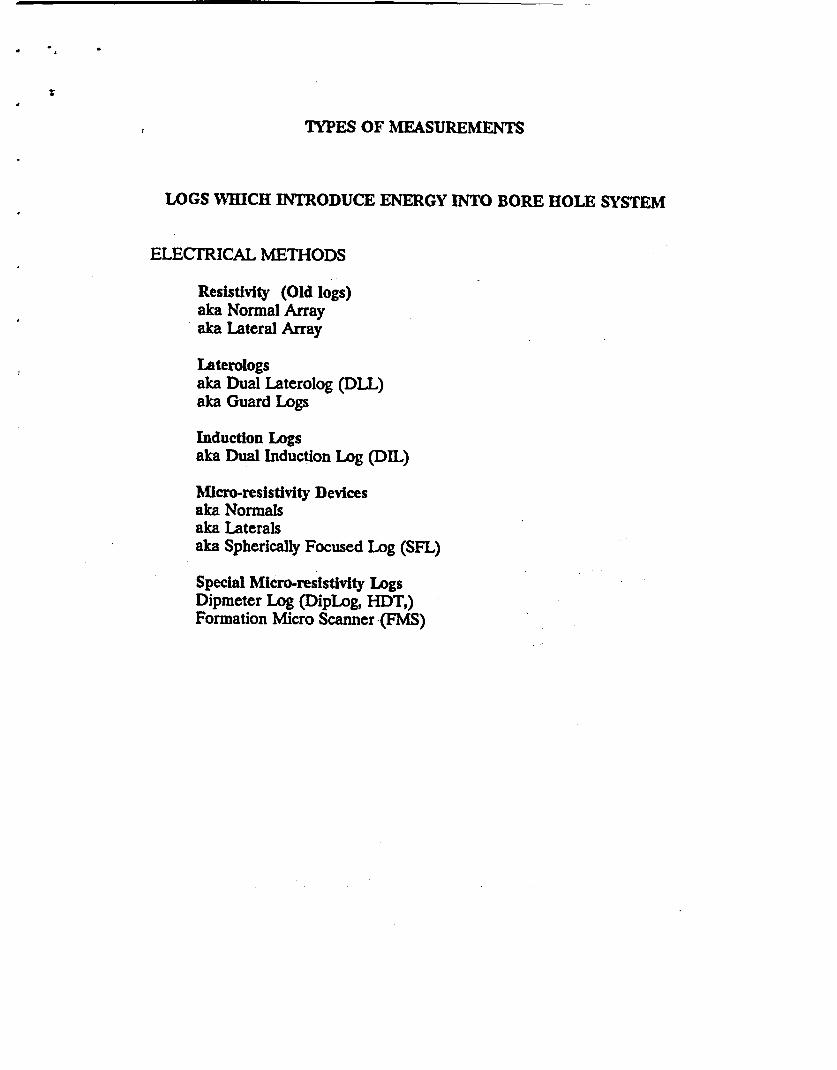
TYPES OF MEASUREMENTS
LOGS WHICH INTRODUCE ENERGY INTO BORE HOLE SYSTEM
ELECTRICAL METHODS
Resistivity (Old logs)aka Normal Arrayaka Lateral Array
Special Micro-resistivity LogsDipmeter Log (DipLog, HDT,)Formation Micro Scanner (FMS)
NORMAL LATERAL
FIGURE III-E
NORMAL AND LATERAL ARRAYS
(AFTER DRESSER)
111-14
a
BACK TO BASICS
RESISTIVITY MEASUREMENTS
Resistivity logs introduce an electric current into the formation from sourceelectrodes and receive a resultant current at receiving electrodes. The originalelectric logs were configured in the lateral configuration, where a current wasapplied between a surface electrode and a downhole electrode. The potentialdifference between two downhole measurement electrodes provided data forcalculating the resistivity of the rocks between them. These logs providednonsymmetrical responses, and allowed the interpretation of a single value ofresistivity for each bed or petrophysical zone.
To provide for more symmetrical response, the normal electrode configuration wasdeveloped. In the normal configuration, one of the measurement electrodes wasmoved to the surface. An improvement in symmetry was made, but the measurementstill provided only a single value of resistivity for the reservoir. All theseolder electric logs require significant correction for borehole and bedthickness, and interpretation is mostly art. Refer to figure JN.1 for theelectrode arrangements.
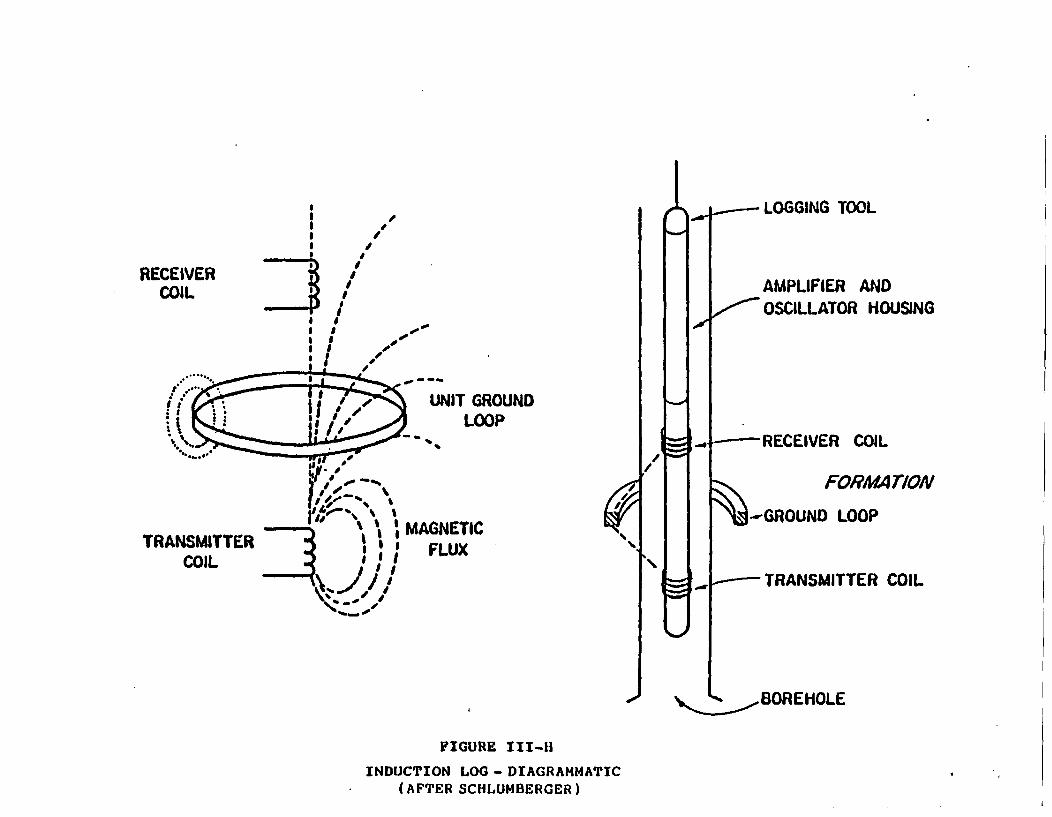
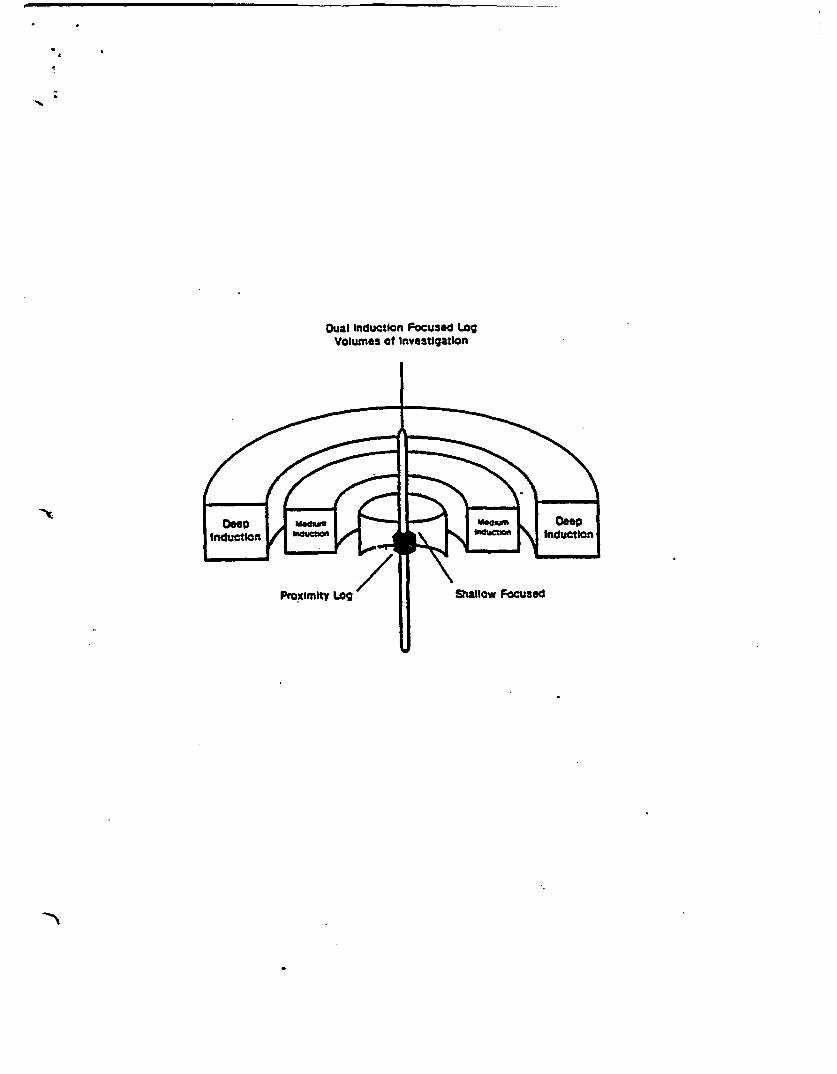
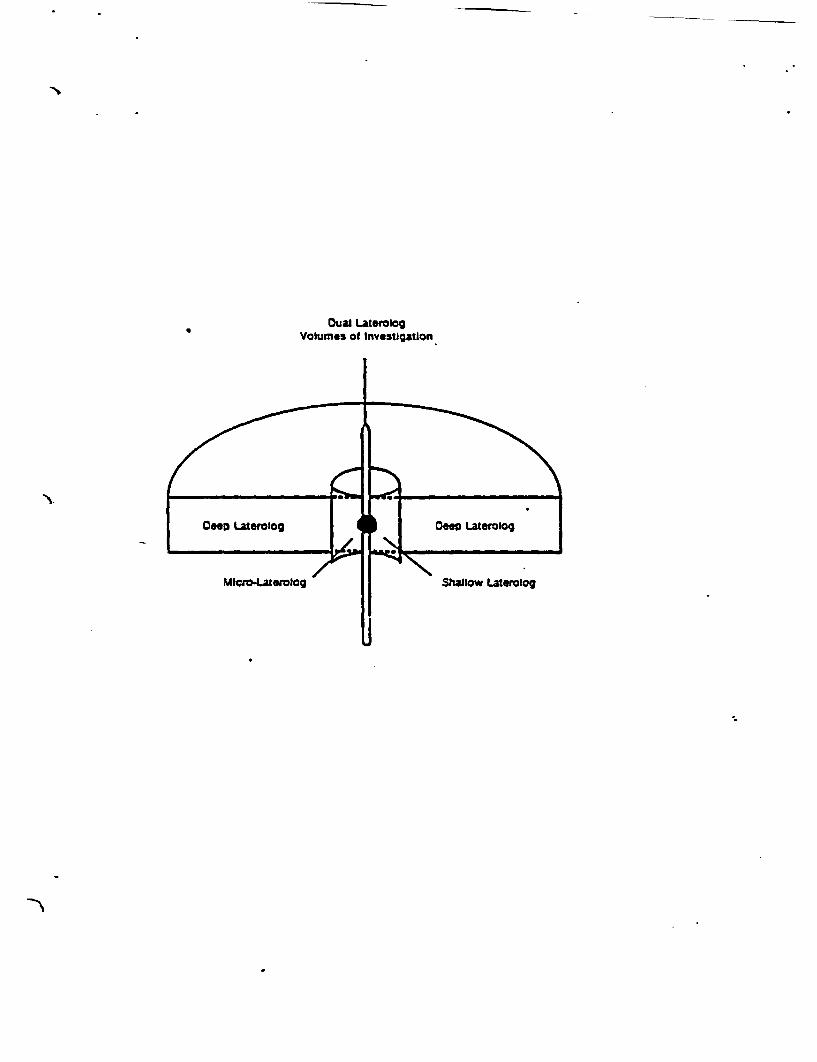
Modern day resistivity logs provide symmetrical responses and allow thedetermination of resistivity values over relatively thin portions of thereservoirs. Modern laterologs provide a focusing system which reduces theborehole effects by forcing the current in narrow sheets into the borewall, thuspreventing it from traveling up the mud column to the receiving electrode. Themodern induction logs induce a low frequency radio wave-like signal into theborehole system, and do not require the hole to be full of a conductive fluid(mud).
It is valuable to be able to sample the formation resistivity at variousdistances away from the borehole to evaluate the significance of invasion. Aclass of micro-resistivity tools is used to measure formation resistivity at onlya few inches or a few feet away from the borewall.
When the formation resistivity can be measured at several distances away from theborewall, an interpretation of the degree of invasion may be made. With thisdetermination, the logs can be corrected for geometrical effects, and a moreaccurate determination of true formation resistivity (Rt) can be made. Suchmultiple measurements are normally made with a combined set of tools on one tripin the hole.
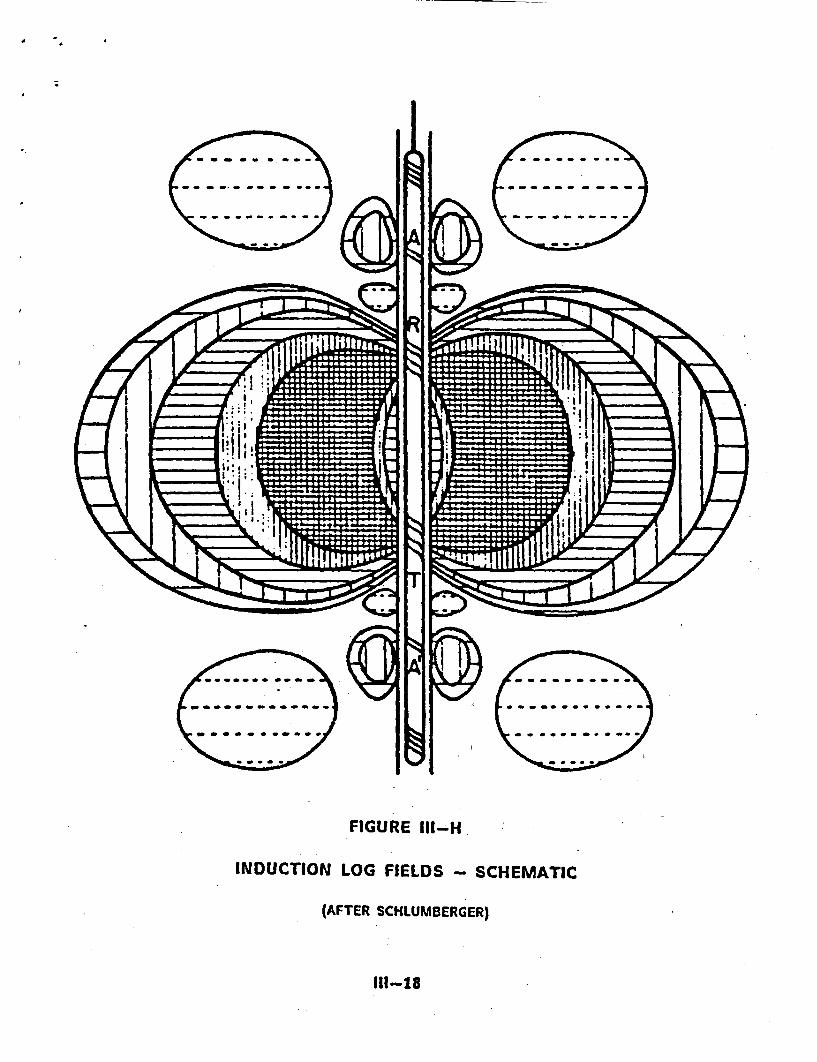
Resistivity measurements are presented in units of ohm-meters ("ohms"). Mostmodern petrophysical work is done with the values scaled from .2 to 2,0IE ohmslogarithmically. Linear scales are used for correlation work to facilitatecomparison with the older logs. Resolution of formation resistivity, Rt, isrequired to calculate water saturation.
Resistivity logs presently in use are the Dual Induction Log (DIL), DualLaterolog (OLL), Shallow Focused Log, Proximity Log, and Microlaterolog. Thelatter three are focused microresistivity devices.
)Obuda logging lines Is published monthly by Loren E "bud' Thompson, Inc.1855 West Dartmouth Ave, #11, Englewood, Colorado 80110 303/798-0200
Copyright. 1983. Loren E. "bud' Thompson, Inc. No part of this publication may be reproduced In any formor by any means without the written permission of the publisher.
LaterQlogs measure the resistivtty of the rocks surrounding the borehole by using the rockmaterial as a conductor of electric current. Obeying Ohm's law, the current flows more freelythrough the path of least resistance which in the case of aquifers is through the water in the poresystem. Modern laterolog presentations are scaled in ohms logarithmically (usually from 0.2 -2000) across tracks two and three on the 5 in./100 ft. log. Available presentations are much thesame as with modern induction logs (see page 3, May, 1986 Logging Lines - Ed.)
The basic laterolog system is a takeoff on the original"electric log" normal array which was comprised of sonde-mounted current electrode A and voltage electrode M, and v 'distant voltage electrode N ( usually on the cable), and Nreturn current electrode B at the surface (mud pit). The Noriginal electric logs suffer from adverse borehole and nearborehole (invaded zone) effects when the salinity of the mudis high. With the original electric logs it is impossible to getadequate resistivity measurements under "salt mudconditions". Where the path of least resistance is throughthe borehole mud column little or no energy is propagatedinto the rocks.
M RockTo combat the borehole effects, GUARD or buckingelectrodes (G in the figure) are placed on the sondesurrounding the A electrode. The guards are connectedtogether (equal potential) and are at the same polarity as theA electrode, thus forcing the electric current away from the r Gguards and into the formation in order to complete thecircuit to the return electrode. The current to the guard _electrodes is automatically adjusted in response to resistivity _changes so that the potential difference between guards and athe A electrode is always zero. The applied current is a low _frequency pulsating direct current which keeps the down holeelectrodes from changing resistivity with use. -
The laterolog current is said to be "focused", and is depicted ftd Rockas being propagated in "sheets" perpendicular to the sonde,Linto the formation, even in highly saline muds. Focusingprovides excellent thin bed resolution. LA EROLOG
(SCHEMATIC)Modern laterologs have many electrodes and various spacings,providing measurements at different depths of investigation away from the borehole. Ensuingmeasurements are accurate in higher resistivity rocks than those from induction logs. Laterologsare the choice: (1) in low porosity aquifers, and (2) where the ratio Rmf/Rw becomes smaller,such as high salinity muds and/or fresh formation waters.
By understanding how the measurements are made, you will be
LOOKING SMARTER FOR OIL.SMNot to be confused with lateral, a special array of original electric log.
SSalas Ma* *f Loren En "bud' Thompson, nc.
.~ 1L~apI2U~ 5Is Published monthly by 'Loren E. "bud" Thompson, Inc..~±~nlQflEs 9316 West Iowa Place, Lakewood, CO 90226-4445 USA
Telephones (303) 980-1600 Office, (303) 426-3395 24-hour answering service.%:opyright 1256, Lomn E. *bud' Thompson, Inc. No part of this publication may be reproduced hI any form or by any means withoutthe written permission of the pulfisher.
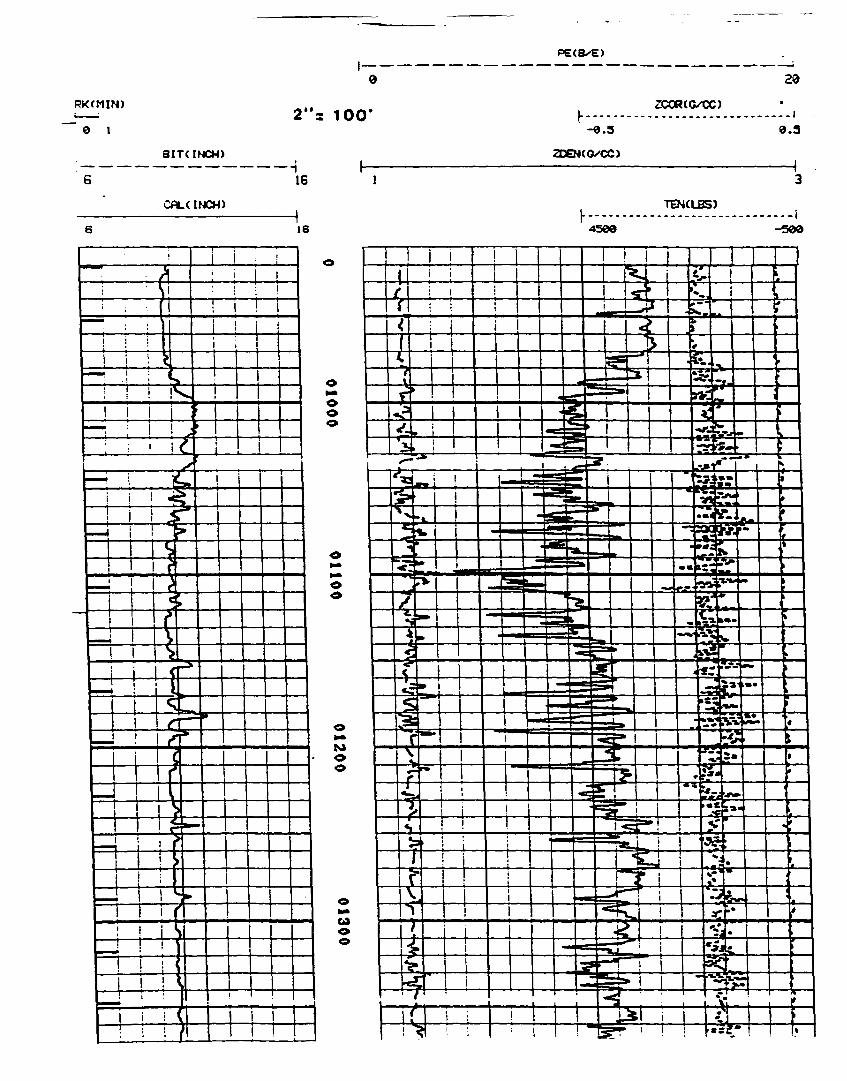
1. A radioactive source (usually Cesium 137) emits high energy gamma rays ofapproximately 1.1 Hev directly into the borewall face.
2. The gamma rays (or photons) react in several ways with atoms in the rack andborehole system. Major reactions include Compton scattering. photoelectriceffect, and pair production. Through proper tooldesign, source-to-detector spacings, and choice ofsource strength, the basic density tool respondsprimarily to Compton scattering whereby an incidentphoton (gamma ray) ejects an electron from itsorbit. 833. The scattered gamma rays, having lost some oftheir initial energy to the ejected electron, arecounted by a near- and by a far-spaced detector.
The count rate (number of scattered gamma rayscounted per unit of time) at each detector isdirectly porportional to the electron density of the 3material between the source and detector(s). Use oftwo different detector spacings results in co- 2-pensation for mudcake through a "spline and ribs"computation relating the near and far count rates, 2 oand mud cake thickness.
In sedimentary basins logged for water, oil, or gasaccumulations the bulk density of the reservoir and S 1source rocks is nearly equal to their respectiveelectron densities. The ratio of atomic number to TOOLatomic weight for most of these sedimentary FaMTICNmaterials is nearly constant (Z/A = 1.5). The HUresult, after a slight mathematical correction, is alog of the bulk density of the formation opposite NUDCAREthe tool.
The porosity of the rock investigated may be determined from the bulk density ifthe density of the rock matrix is known. Matrix density is related to themineral assemblage or lithology of the formation.
In litho density-type systems, the photo electric effect of of the formation ismeasured, and an estimate of lithology independent of porosity may be determined
The major pitfall in making bulk density measurements is the need for intimatepad contact during logging. Rugose holes often provide inaccurate densityreadings, tending to be erroneously low, resulting in high apparent porosities.
By understanding how the measurements are made, you will be
LOOKING SMARTER POR OIL.
buda' logging line' Is published monthly by Loren E 'bud' Thompson, Inc.9316 West Iowa Place. Lakewood. CO 80226 (303) s8o-1600 office, (303) 426-3395 Ans. Service
Copyright, 1986. Loren E. "bud" Thompson, Inc. No part of Othi publicafton may be reproduced In anyform or by any means without the written permission of the publisher.
H I
GRCFe!)
e0. 360
LSN(CPS)I -I
a * ese
CNt%)r
so eSSN(CPS)
I
0 2060
rTT [Fbis
~ti. -~ -
I 1!i -E
00
0
co
.aa0
0
0
40
400
0000
o~~~~~~~~TILS
o…
o~~~~~~~~~~~~~~~~~
oo~~ I'- i
o a ;--
1o 111--o~~~' I 11
o~~~~~~~~~~~~~~III
o ~ I
+ I I - -
_ _ a a a - a - I a a - _ = za
… f g I_ ,[
… _
…F_ IIIi_ =
I aI I a I
l l l l l l I - -I - -'* - - - -
I… I - III…~~~ A0tL11 V T 1 <
…-~~ -5 ITI I I I I 1 1 T-
a a a a a aI a a1- L 1- a a aT Taa
-I- I -1- -1 I I -111T T
I 1- I I II I -~lI lIII 1 I- I I -E
> ~~~~~~~~~I I II1'S, wI I ! ! !, _ -
March 1986 3
BACK TO BASICS
BASIC NEUTRON LOGGING SYSTEMS
1. A radioactive source (PuBe, or AmBe) bombards the formation near the borewall with highenergy (high-speed) neutrons.
2. The neutrons are slowed down through billiard ball-like collisions with borehole and rocksystem atoms, most notably hydrogen.
3. Once the neutrons are slowed to thermal velocities, or"thermalized", some are captured by the hydrogen atoms,while others permeate through the system. TOM
4. In some systems, detectors count the remaining thermalneutrons, and in others gamma rays which are emitted as EXXMTInCa result of the capturing process are counted. Through tooldesign and dual detector spacing, borehole compensation / Imay be affected. 4
Hydrogen occurs in the pores of rocks in water, oil, and gas.Thermalization takes place closer to the source (farther fromthe detectors) in high-porosity rocks (high hydrogencontent). Where thermalization takes place close to thedetectors flow-porosity rocks) count rates are higher (lessabsorption). Regardless of detector type, counting rates are 4inversely proportional to the amount of hydrogen Kencountered due to absorption.
Service companies calibrate their neutron systems to astandard set by the API and maintained at the University ofHouston. Development tools are calibrated in the test pit\which contains limestone of known porosity values and 2 _range. Hence the industry has adopted a primary standard l ibased on limestone porosity units. Hydrogen index maybe related to limestone porosity through these calibration EXMATIzCstandards.
A major pitfall when using the older neutron logs Is thesignificant borehole effect which can distort the data.Large or irregular boreholes result in abnormally high apparent neutron porosity due to thepresence of mud near the source. Where mud interferes with the source thermalization takesplace close to the source, resulting In low count rates at the detectors. The rule of thumb is -if you do not know the borehole size, you do not know the porosity with an older neutron log.Remember - though related, bit size and borehole size may not be the same.
Pad-type epithermal (SNP) and modem compensated (CNL) logs are run eccentered withreal-time caliper data being available for hole size correction.
Neutron logging provides a measure of the hydrogen index of the materials investigated which,through appropriate computation and calibration, may be related to lithology-dependentporosity. By understanding how the measurements are made, you will be
LOOKING SMARTER FOR OIL.
buds loing lines, Is published monthly by Loren E Obud" Thompson. Inc.9316 West Iowa Place. Lakewood. CO 80226 (303) 080-1600 Office. (303) 42643395 Ana. Service
Copyright, 1986, Loren E. "bud" Thompson, Inc. No part of this publication may be reproduced in anyform or by any means without the written permission of the publisher.
Dual Detector Neutron Lifetime Log® (DNLL) NThe Dual Detector Neutron Lifetime Logs measures themacroscopic thermal neutron absorption cross section,Sigma (1). of the bulk formation. Sigma is primarily afunction of the porosity, of formation water salinity, ofquantity and type of hydrocarbon in the pore spaces, andof the type of rock matrix. Sigma decreases with incrcas-ing hydrocarbon content, but increases with increasingporosity and with increasing water salinity.
In cased holes, the DNLL can be used to discriminatebetween gas. oil and saltwater bearing formations. Themeasurements are not, however, restricted to cased holes.Valuable reservoir data can also be obtained from theDNLL in open hole environments.
An array of transducers is mounted on a centralized borehole sonde. The basic array consists ofa transmitting transducer and two receiving transducers. The sonde is milled in a maze-likepattern creating a long path for sound waves, effectively decoupling it from the transducers.
Each transducer is composed of plzeoelectric material which,when subjected to pressure, emits an emf (voltage).Alternatively, when a voltage is applied to a transducer, itchanges volume. When an alternating voltage is used, a R2pressure pulse with frequency content is transmitted awayfrom the device. (Remember the stone thrown in thequiescent lake and the resultant ripples?)
AtA pulse wavelet (usually 20 khz) excites the transmitter (T)at time To , and the resultant pressure wave travels throughthe mud at the velocity of the mud, enters the borewall -I-.material, and travels along the borewall at the faster rock t2velocity. A complex acoustic wave is generated at the mud-rock interface, but it is the compressional mode (earliest orfastest) which is of primary interest in basic systems. to
The wave leaves the rock, travels back through the mud, andis detected as a pressure pulse by the receivers (R 1, R2)which register a voltage change. The total time requiredfrom transmitter to each receiver (ti and t1) is measured andthrough simple trigonometry, the time (At required to travel Tthrough the rock portion of the path is determined. Thestandard system of presentation is travel time (4) inmicroseconds (1/1000 sec), or .isec pgr foot. The velocity ofthe rock, VR, in feet per second = 1(P/(usec/ft).
In practice, the borehole array consists of two transmitters BASIC ACMIMC LONG TOMLand four receivers, arranged such that several measurements (St EATIC)of travel time are made for each evaluation. Using averagesand simple math, the effects of the mud path, boreholeirregularities, and sonde tilt are eliminated, resulting in a borehole compensated measurement oftravel time. Depth of investigation is less than two inches, and-is radial around the borehole.
The porosity of the rock material near the borewall may be estimated if the matrix travel time(A ma) of the rock is known or assumed. Acoustic' porosities are reliable over the range of .06 -.2Sp.u. Acoustic tools are calibrated to measure the travel time of a water-filled aluminumtube. In the hole, an acoustic log should be checked by measuring the travel time in free(unbonded) pipe or surface casing (At pipe -57.5 usec/ft.)
More advanced tools have arrays with multiple T-R spacings, including long spacings to helpseparate out the various component modes of the complex wave. Such long-spaced tools areused for rock typing (lithology identification), and research into the nature of the total acousticwave. By understanding how the measurements are made, you will be
LOOKING SMARTER FOR OIL.S'9*11-q-ie-t Mnrk of I orn F 1,titd IMnmwmn tNg
-bud's logging lines is published monthly by Loren E. "bud, Thompson, Inc.9316 West Iowa Place. Lakewood CO 80226 (303) 980-1600 Office. (303) 426-3395 An. Service
Copyright, 1986, Loren E. "bud" Thompson. Inc. No part of this publicatnon may be reproduced in anyform or by any means without the wntten permission of the publisher.
Novrer 1964 Pogo 3
AD sniW
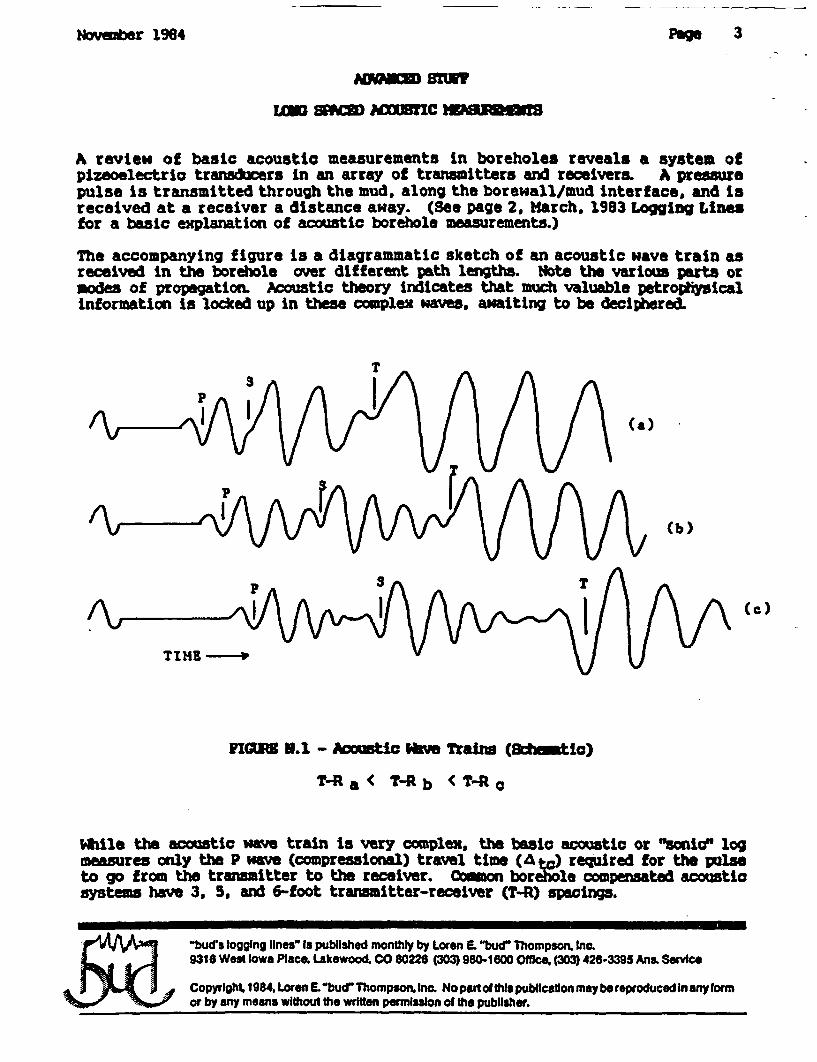
A review of basic acoustic measurements in boreholes reveals a system ofpizeoelectric transidcers In an array of transmitters and receivers. A pressurepulse is transmitted through the mud, along the borewall/mud interface, and isreceived at a receiver a distance away. (See page 2, March, 1983 Logging Linesfor a basic explanation of acoustic borehole measurements.)
The accompanying figure 15 a diagrammatic sketch of an acoustic wave train asreceived in the borehole over different path lengths. Note the various parts ormodes of propagation. Acoustic theory indicates that much valuable petrophysicalinformation is locked up In these complex waves, awaiting to be deciihered
T
(a)
~~~~~~~~~~~~~~~~~(b)
(~~~~~~~~~~~~~~~~~~~~~~~~~~~~~~~
UIGRS H.1 - Acwmti Wm Traiw (8*intIc)
T-R a ( T-R b < S-R a
uhile the acoustic wave train is very complex, the basic acoustic or "sonic" logmeasures only the P wave (compressional) travel time (A tc) required for the pulseto go from the transmitter to the receiver. Common borehole compensated acousticsystems have 3, 5, and 6-foot transmitter-recelver (T-R) spacings.
(c )
-bud's logging lines Is published monthly by Loren E. lxbu Thompson. Inc.9316 Wost Iowa Place, Lakewood. CO 80226 (303) 980-1600 Office, (303) 426-3395 Ana SOMice
Copyright 1984. Loren E"bud Thompson. Ic. No pal Ithispublication may be reproduced in anyformor by any means without the written permission of the publisher.
Na~er 1964
~*re it is desirable to meare S mm (shear) mode travel times,phase or group velocities, special equimnt is often employed.spings in excess of 8 feet have bem coi over the Past fivelong spaced tools hav T-R spacings of 20 feet and more.
Nige 4
or investiaTools with T-Ryears. nodem
The main reason for increased T-R specing is to spread out the acoustic wa trainso the Individual modes or packets are separated and thus easier to observe anddigitize. With proper T-R spacing, the damped compressional wave will loonssufficient energy so it does not interfere with the onset of the later sheararrival. As the arrival time for each succesively slower mode is Increased, thewave train is elongated, and the individual modes become more discernable.Pigures N.1 a, b, and c are schematic representations of wave trains fromrespectively increased T-R spacings.
In addition to more accurate raw compressional and shear travel times (AT) forporosity estimates, other attributes of the propagation of acoustic energy throughporous media may now be studied. Investigators are able to tell us more about therock fabric and contained fluids by cataloging the frequency, energy, andspectral composition of the acoustic wv train and the varous es.
Of particular interest is the attenation o£ the component parts over a specificinterval of rock.: Mobill reported gratifying results after determiningpermeability through the investigation of the energy loss of the tube "ave. Theyalso indicate a significant correlation bet"een tube wave velocity andpermeability.
Not all advances are due to the increased T-R spacing. Recent improvements inmicroelectronics, including signal-to noise ratios, signal detection, analog-to-digital conversion, and digital recording techniques have contributed Mreasrablyto our newfound understanding of these complex borehole waves.
8PWA Transactions, 1984 Paper "T
"buds ging lnes" t published montl by Loren E. Ib Thompon kc.9316 Wst bowa Place, lakewood, CO 80226 (303) 980-1600 Office, (03) 42649S Ana. Service
Copyrght 184, Loren E. bud" Thompson. Inc No partfthis pubcaton maybe eproduced Inanytormor by any means without Me wrn permission of the pubisr.
Full waveform logs in Tertiaryfluvial sediments, including the tube waveamplitude (left) and the variable density log(VDL, right).
February 1984 Page S
;
1.. ADVANCED STUPF
ACOUSTIC CEENT SOM LOGS
(There is such misunderstanding about the Cement Bond Log (CBL).this one. - Ed).
Good luck with
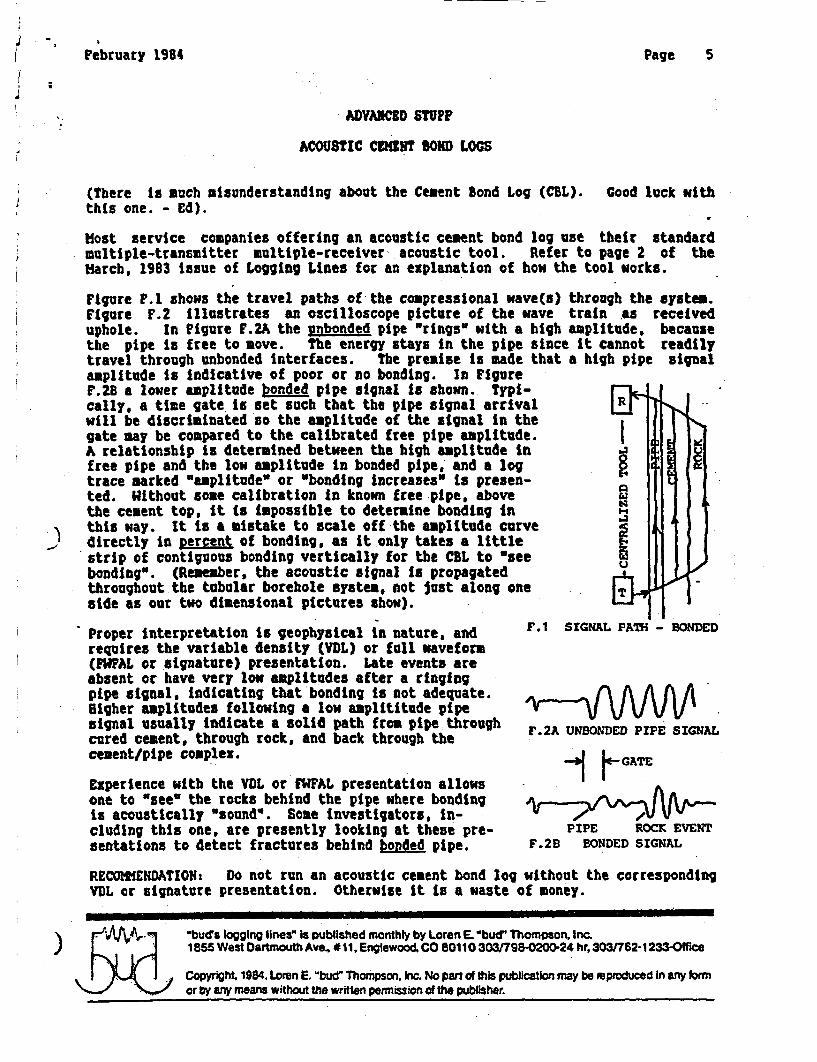
Host service companies offering an acoustic cement bond log use their standardmultiple-transmitter multiple-receiver acoustic tool. Refer to page 2 of theMarch, 1983 issue of Logging Lines for an explanation of how the tool works.
Figure P.1 shows the travel paths of the compressional wave(s) through the system.Figure F.2 Illustrates an oscilloscope picture of the wave train as receiveduphole. In Figure F.2A the unbonded pipe wringsw with a high amplitude, becausethe pipe is free to move. The energy stays in the pipe since it cannot readilytravel through unbonded interfaces. The premise is made that a high pipe signalamplitude is indicative of poor or no bonding. In FigureF.28 a lower amplitude bonded pipe signal is shown. Typi-cally, a time gate is set such that the pipe signal arrival Rwill be discriminated so the amplitude of the signal In thegate may be compared to the calibrated free pipe amplitude.A relationship is determined between the high amplitude infree pipe and the low amplitude in bonded pipe, and a logtrace marked "amplitude3 or 'bonding Increases" is presen-ted. Without some calibration In known free pipe, above Nthe cement top, it is Impossible to determine bonding inthis way. It is a mistake to scale off the amplitude curvedirectly in percent of bonding, as It only takes a little Istrip of contiguous bonding vertically for the CBL to "seebonding". (Remember, the acoustic signal is propagatedthroughout the tubular borehole system, not just along one ,side as our two dimensional pictures show).
Proper interpretation is geophysical in nature, andrequires the variable density (VDL) or full waveform(FWPAL or signature) presentation. Late events areabsent or have very low amplitudes after a ringingpipe signal, Indicating that bonding Is not adequate.Higher amplitudes following a low amplititude pipesignal usually indicate a solid path from pipe throughcured cement, through rock, and back through thecement/pipe complex.
Experience with the YDL or MWFAL presentation allowsone to "see" the rocks behind the pipe where bondingis acoustically "sound". Some investigators, in-cluding this one, are presently looking at these pre-sentations to detect fractures behind bonded pipe.
P.1 SIGNAL - BONDED
F.2A UNBONDED PIPE SIGNAL
A p-GATE
PIPE ROCK EVENTF.2B BONDED SIGNAL
RECOME£NDATION: Do not run an acoustic cement bond log without the correspondingVDL or signature presentation. Otherwise it Is a waste of money.
) "bud's logging lines" Is published monthly by Loren E. Obud" Thompson, Inc.1855 West Dartmouth Ave. #11, Englewood. CO 80110 303/798-0200-24 hr, 303/762-1233-Office
Copyright. 1984, Lorn E. "bud" Thompson, Inc. No part d this publication may be veproduced In any formor by any means without the written permission ot the publisher.
I a
.30 -A
§1~I , .
IA r.� vmi, N-I'lI I . 'Ii
�A t�-�. *.*� �
,F
- I
Dielectric Log_ H
Ii i' .
The Dielectric logging instrument is used to investigateformation characteristics in areas of brackish or low for-mation water salinity. Two types of Dielectric logginginstruments are available: a 47-MHz instrument thatresponds to formation properties beyond the invadedzone, and a 200-MHz instrument that investigates theflushed zone. The 47-MHz instrument is a "slick" toolwhich is operated in a centralized position in theborehole. The 200-MHz instrument is a pad-type whichis operated in contact with the formation. The two in-struments can be combined to run as a Dual DielectricLog and to increase wellsite efficiency.
Both tools operate on the same principles, but the dif-ferent frequencies provide different depths of investiga-tion and different responses according to thecharacteristics of the formation. The curves of the Dielec-tric logging instrument are as follows: Amplitude at
,. .......... .
Receivers I and 2 and the ratio of amplitude arepresented in track I. The computed resistivity ispresented in track 2. The phase shift (in degrees) anddielectric constants are presented in track 3. The presen-tation can be changed according to customer request.
APPLICATIONS:
3 Determine flushed and deep water saturations
. Identify moveable oil
,. Identifv shale-content
2 Determine sand content (high resolution)
2 Identify Oomoldic and dead-end porosity
I
... .. .. .. .. .. .. .. ..a
............... !!� ............ I
47 MHzSPECIFICATIONS:
200 MHz
Q)
TYPES OF MEASUREMENTS
PRODUCTION LOGS
Fullbore Flowmeter
Continuous Flowmeter
Radioactive Tracer
Pressure Gauge (transducer)
Thermometer (high resolution)
Manometer
Gradiomanometer
Fluid Density Log (radioactive source)
Bore Hole TV Camera
PI.oUcnON WOOONG
PET* Production Logging ToThe Production Logging tool provides simultaneous mea-surements from downhole sensors used for the analysis ofproducing or injection wells. The tool measures fluid entriesand exits, standing fluid levels, bottomhole flowing andshut-in pressures, pressure losses in the tubing, and theintegrity of the gravel pack and hardware assemblies. Sincethe measurements are made simultaneously, their correlationis unaffected by any well instability that might cause down-hole conditions to vary over a period of time.
Interpretation of the PLT data determines the quantity ofunrecovered hydrocarbons, the pressure drop across the res-ervoir and completion, the permeability of the perforatedinterval. and skin losses in the completion. In addition. itidentifies zones not contributing to production, develops apressure loss correlation for the tubing string, and comparesthe actual flow profile to the theoretical flow profile calcu-lated from the Producibility log.
The I "/t*inch diameter tool can be run through tubing assmall as 2 inches in diameter to measure producing or injec-ting wells under realistic, dynamic conditions. In addition toa casing collar locator and Gamma Ray tool, the PLT tool canbe run with the following sensors.
Fullbore Flowmeter-The Fullbore Flowmeter is aspinner-type velocimeter which records production and in-jection profiles. The tool uses a spinner which nearly covesthe casing cross section and therefore is little affected byviscosity changes in multiphase flow. The spinner is col-lapsed for running in or out of the hole and can work in a piperange of 3 1/2- to 9 Vl-inch inside diameter.
Continuous Flownieter-The Continuous Flowmeter is aspinner tool which records production and injection profilesin high flow rates. It is particularly suitable for logging ingas wells.
Radioactive Tracer-A Dual Radioactive Tracer Ejectortool records flow profiles and detects channels outside thecasing. With the dual ejectors it is possible to eject selec-tively either water-niscible or oil-miscible tracer mate-rials. The tool is particularly applicable for measuring lowflowrates.
Pressure Gauge-Tbe Hewlett-Packard precision quartzpressure gauge monitors pressure during a pressure-builduptest. It also can be run continuously to monitor the pressureprofile in the well. A temperature measurement is madesimultaneously so that a corrected pressure measurement isprovided in real time.
Thermometer-A high-resolution thermometer records atemperature profile for the study of temperature anomalies as
*1
J.
38
PRODUCTION LooGGING '
small as 0.5° F. A differential temperature can also be dis-played. The principal applications are to locate fluid entries.determine flow behind pipe, detect gas leaks, and correctpressure measurements.
Manometer-The Manometer sensor provides a contin-uous monitor of the pressure in the well. This pressure pro-file is a useful aid in interpreting other production loggingmeasurements.
Gradiomanometer*-The Gradiomanometer sensor re-cords a specific gravity profile in the well. The tool is adifferential-pressure measuring device with a 2-foot spacingbetween sensitive membrane-type pressure sensors. The av-erage density of the fluids in the casing between the twosensors is measured. Principal applications are to define fluidcontacts. locate gas entries in oil wells, and assist flowmeterinterpretation in two-phase flow.
Callper-The three-arm through-tubing caliper provides ahole-size profile. The measurement is used to interpret flow-meter surveys and to locate casing problems.
Audio* tool-Two types of Audio logs are available fornoise detection and analysis. The continuous Audio log is
Specifications
used to detect gas and liquid entries, locate flow behind thecasing, and detect leaks. A multifrequency Audio tool forstationary measurements is also available.
Gravel Pack Logging tool-The Gravel Pack Loggingtool is a radioactive device that evaluates the condition of thegravel pack. It provides a quantitative analysis of the areas inthe pack that need to be replaced before the well is placed onproduction.
Pressure-Temperature sonde-In some areas, a pressure-temperature sonde is available which provides highly accu-rate dynamic pressure, temperature. and density mea-surements. These new PTS sondes replace the standardpressure gauge, thermometer, Manometer, and Gra-diomanometer sensors.
Press. Density Terppsi g/ee *F
Resolution 1 0.004 0.01Accuracy t1o 0.040 1.80
twith dead weight tester calibration
Max.Press.
Max.Temp
Sensor Range psi -
Fullbore Flowmeter 50 BID min 20,000 390Continuous Flowmeter 400 BID min 15,000 350Dual 'lacer Ejector 17,500 350PressureGauge 0-300( F 12,000 300Thermometer 0-3500 F 15,000 350Manometer 0-l5.000psi 15,000 350Gradiomanometer 0-1.6g/cc 15,000 350Caliper 2-8 in. 15,000 350Audio 16,500 350Gravel Pack 20,000 350
PTS Sensors
Temperature 0-350' F 15,000 350Density 0-2 g/cc 15,000 350Pressure 0-15,000 psi 15,000 350
*MUtO(SChlumbe*
39
I '>-l1 __
,~A-
*;z
I . Fluid Density Log HiMThe Fluid Density Log is a radioactive log of the gamma-gamma ray type. While the Gamma Ray Log is ameasurement of natural gamma rays, the Fluid DensityLog data is a record of the density difference betweenwater, oil and gas. and is generated by use of a chemicalgamma ray source. The density measurement is made byobserving the relative absorption of gamma rays passingthrough the borehole fluid in a sampling channel. Thebasic unit of measure is a count of residual gamma rays.This counting rate is inversely proportional to the densi-ty of the sample and is a function of the activity of thegamma rav source. The log density data are recorded ingrams per cubic centimeter.
The Fluid Density instrument, unaffected by high-angleboreholes, fluid viscosity or fluid velocity, is a good in-dicator of the type of fluid entering, leaving or presentin the borehole.
APPUCATIONS:
2 Locate entry of primary and secondary fluids in a 2or 3-phase production stream
7 Provide a density profile in a multi-phase produc-tion stream
2 Locate borehole fluid contacts in static conditions
2 Locate product levels in storage wells
2 Locate tubing and casing leaks when the leaks resultin multi-phase flow
COMPENSATED DENSILOG COMPENSATED NEUTRON 0 BHC ACOUSTiLOG 0- U -
Transmiller.
I -i_~ .
Near =-1-Receiver= -
. I
._ *1
FarReceiver-
_ _ _ ._~~~~~~~~~~~~~~
I
I
-1
SI
Borehol.
I X -
. Formation Formation Formation
if r
Dual induction Focused Logvolumes at Investigation
Dual La~toemVolumes of Investigation
microoAerolog Shallow Laterclog;
PETROPHYSICAL THOUGHT PROCESS
The complexity and interdependence of modern open hole wireline log measurements hasalmost negated the use of "Cook Book" analysis where a number is simply picked from alog and used in a nomograph.
The wise modern investigator approaches analysis by asking the question:
"What are these measurements trying to tell me about the materials and fluids near theborewall?"
We now have a better understanding of the various influences that changes in fluid typesand saturations, in matrix materials, and borehole size, etc. have on the log responses.
Using the petrophysical thought process, we investigate all possible reasons why a singlelog measurement may be changing values with depth. (A change in matrix porosity isnot the only reason a "porosity" log changes value). By cataloging all possiblepetrophysical reasons for changes on all measurements in question, it is possible,through a process of elimination, to better interpret what the logs are telling us abouttheir environment.
Using this accumulated information it is possible to group the reservoir materials intopetrophysical rock types, i.e., groups of rocks which have similar log responses. In mostcases, such groups are coincidental with rock groups for engineering purposes.
An understanding of the two principlesPresented in the following few pages isthe most important difference betweenan earth scientist who is working withlogsand one who can make logs workfor him/her.
VI-1
POROSITY FROM LOGS
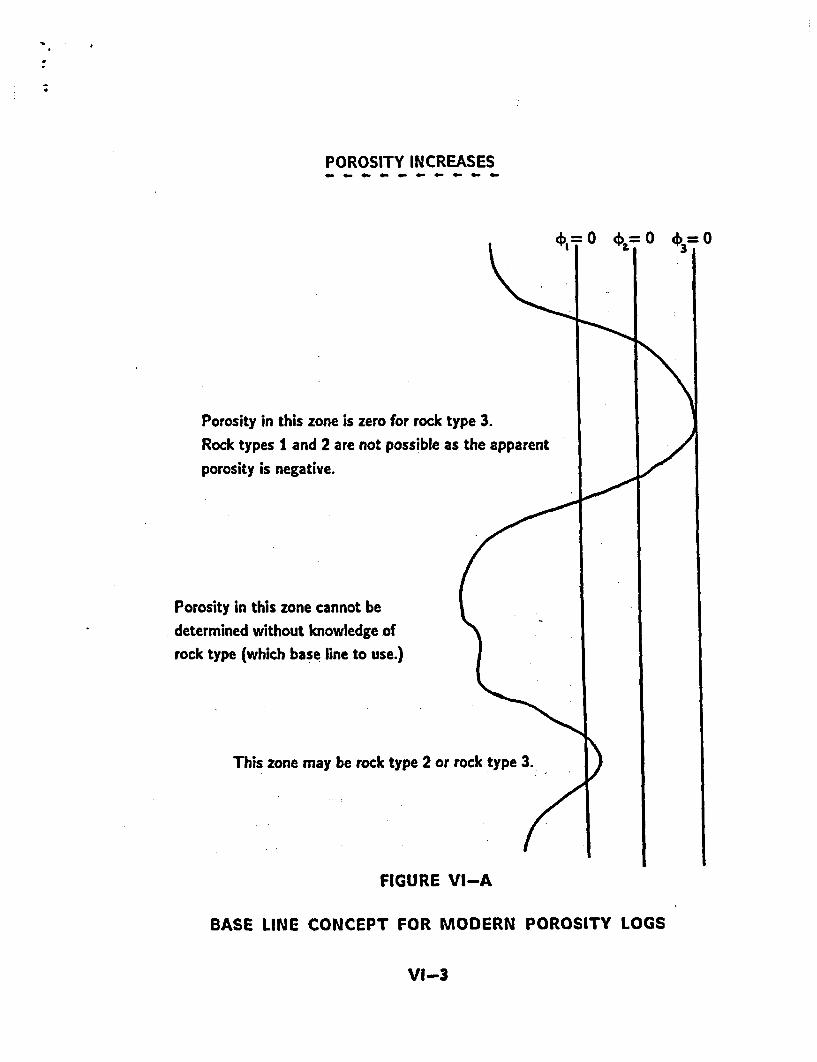
None of the so-called "porosity logs" actually measures reservoir porosity. Each of thethree logs, acoustic, density, and neutron makes a determination of a reservoir propertythat can be related to porosity. When only one porosity log is available, the porosity ofa reservoir cannot be determined unless the rock type (lithology) is known, or assumed.
The base line concept for porosity can be applied to all three logs. The matrix base lineis the response (x-coordinate) of the log to zero porosity in that specific matrix; thatis, where only rock matrix with no porosity exists opposite the tool. Departures fromthe base line toward positive values of porosity may be interpreted for value only whenthe tool is opposite the appropriate rock type.
While it certainly does not occur in nature, negative porosity has significancepetrophysically. Where a porosity log gives negative numbers, the base line is no longervalid, and must be re-established to determine the porosity. Unfortunately, this is truefor some positive log readings where the measurements are being made in a rock typedifferent than the base line assumption. Figure VI-A illustrates this base line principle.
V1-2
-
POROSITY INCREASES_ _. O_ _ _ _ _ _ _
0
Porosity in this zone is zero for rock type 3.Rock types 1 and 2 are not possible as the apparentporosity is negative.
Porosity in this zone cannot bedetermined without knowledge ofrock type (which base line to use.)
This zone may be rock type 2 or rock type 3.
FIGURE VI-A
BASE LINE CONCEPT FOR MODERN POROSITY LOGS
VI-3
THIN BED EFFECTS AND ZONING LOGS
Apparent log values within thin beds are just that - apparent values. Appropriatecorrections may alter the apparent values as much as 50 - 80%, which means if youtake the value directly from the log without adequate corrections, you are putting anincorrect value into a computation for porosity, Vsh, Rw, Sw, etc.
Thin bed responses may also alter accurate determination of bed boundaries, thusreducing accuracy for volumetric determinations. Important log values in a reservoirnear the boundary with a thin contrasting bed may be masked by the boundary effects.
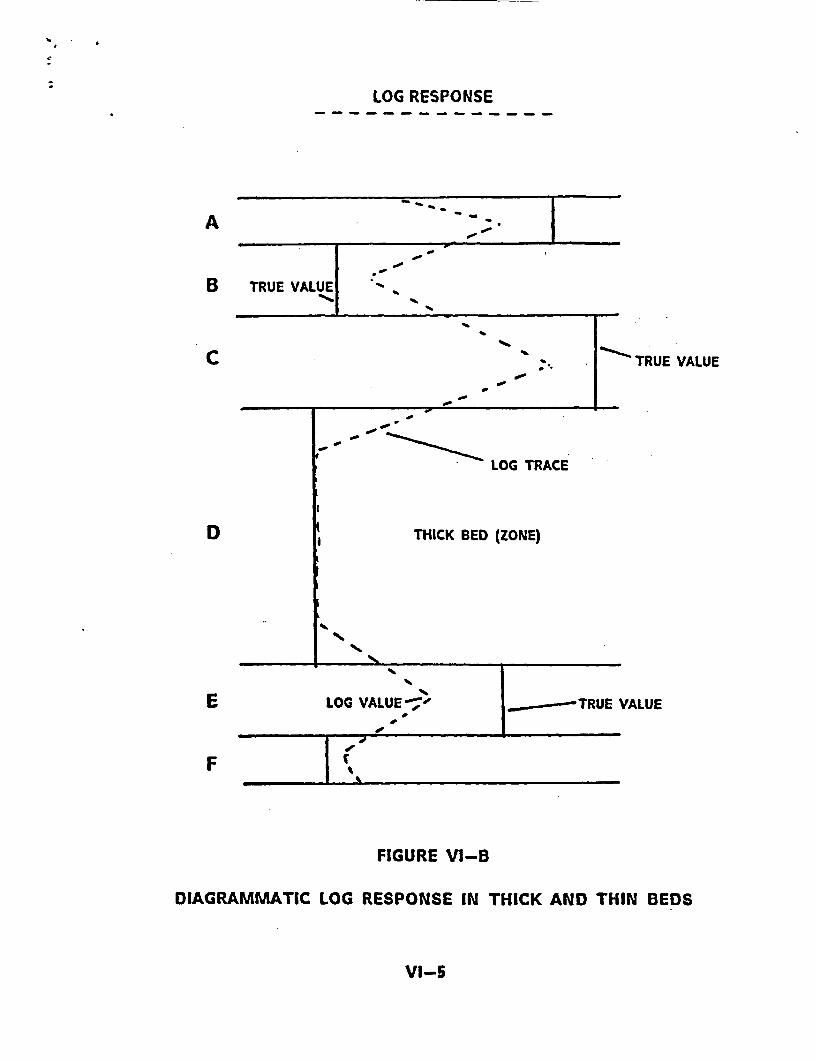
Figure VI-B is a schematic showing: (1) the ideal response of a tool, and (2) the realworld response of the tool as the measurements are made through a series of beds ofvarious thicknesses. The type of tool is not important. The importance is placed on thethickness of the bed relative to the vertical response (generally governed by a T-Rspacing and/or source strength) of the tool being used.
In theory, the resultant measurement would yield the actual value in each bed as shownby the solid (squared) line. Because of boundary effects, notice that the actual responsein a thin bed is never as much as the actual value - never as low when going towardlower values, and never as high when going toward higher values. Idealized bedthickness corrections would correct the apparent log reading downward or upwardaccordingly. Near the boundary between contrasting beds, the measurement is adverselyaffected by averaging over the volume of investigation and the vertical resolution of thetool. This leads to the generalization of picking the mathematical inflection point as thedelineation (bed boundary) between two beds. This is satisfactory where each of thebeds is a "thick" bed, but the inflection point may not describe the depth of the bedboundary, where one or both of the beds are "thin".
When picking log values "by hand" in a thin bed, it is preferable to pick the peak value(either to the right or to the left), rather than using an eyeball average. Averagingaggravates the situation, yielding an even more incorrect log value. This is the conceptof petrophysical zoning, where log values are picked based on the petrophysical responseof the tool.
VI-4
c
LOG RESPONSE_ _ _ _ _ _ _ _ _ _
A
B
C
D
E
VALUE
F
FIGURE VI-B
DIAGRAMMATIC LOG RESPONSE IN THICK AND THIN BEDS
VI-5
If you have been thinking "bed" as a geologic unit (with several feet of thickness)consider now that the thickest bed on Figure Vt-B is only two feet or so thick. In thiscase, the entire figure may be depicting a single reservoir unit (A to F) from the geologicor engineering viewpoint, but several beds (BCD etc.) from the petrophysical responsecharacteristics of the tool. Now the individual changes in log values reflect changes inthe petrophysical rock type, such as pore geometry, grain size or distribution, matrixmaterial, degree of shaliness, etc., or saturations. These changes must be recognized toadequately describe the reservoir for accurate formation evaluation from logs.
Adding to the problem is the fact that we use measurements from several tools withvastly different T-R spacings (thus volumes of investigations) for our analysis. Someof these tools average over eight or more feet of material, and others only 15 to 30inches. We normally take an absolute value for each log as the trace crosses a finitedepth marker on the log, and combine the values in our various evaluation algorithms.
This is the way we pick and use log values in the computer, since computers, bydefinition are very precise. In the future we will have extensive mathematical modelingavailable via the computer, and will be able to zone reservoirs in a more realistic way.
NOTES
V1-6
-
0
4)Sehlurniorgor -lo
25
it~~~~~~~o ~~5 CL
O001cc
Io0
0
50
N L cor NEUTRON POROSITY INDEIX, p. u.
(APPARENT LIMESTONE POROSITY)
-~~~~~~~~~~~~~~~~~I
-FIG;URE V-E
NEUTRON-DENSITY CROSSPLOT
(AFTER SCHLeUMBERGER)
V-12
Oa'c
March 1985 Page 3
BACK TO BASICS
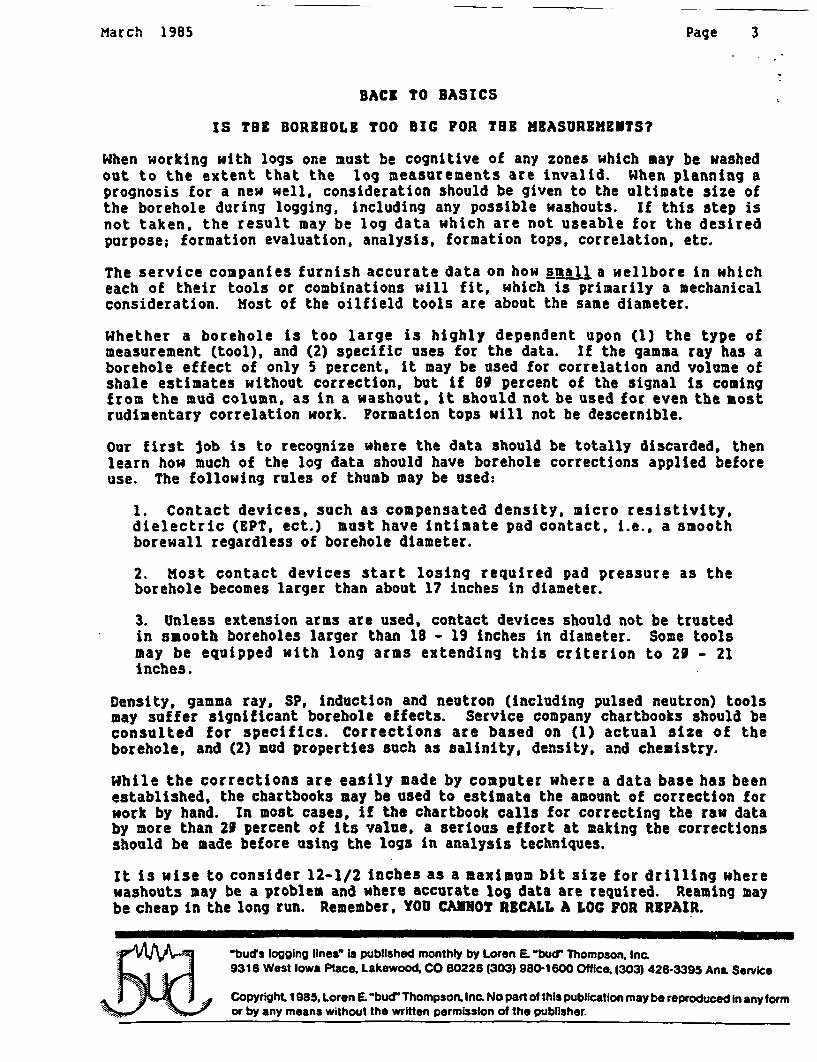
IS TOE BOREBOLE TOO BIG FOR TOE MEASUREYHETS?
When working with logs one must be cognitive of any zones which may be washedout to the extent that the log measurements are invalid. When planning aprognosis for a new well, consideration should be given to the ultimate size ofthe borehole during logging, including any possible washouts. If this step isnot taken, the result may be log data which are not useable for the desiredpurpose; formation evaluation, analysis, formation tops, correlation, etc.
The service companies furnish accurate data on how &MAll a wellbore in whicheach of their tools or combinations will fit, which is primarily a mechanicalconsideration. Most of the oilfield tools are about the same diameter.
Whether a borehole is too large is highly dependent upon (1) the type ofmeasurement (tool), and (2) specific uses for the data. If the gamma ray has aborehole effect of only 5 percent, it may be used for correlation and volume ofshale estimates without correction, but if 89 percent of the signal is comingfrom the mud column, as in a washout, it should not be used for even the mostrudimentary correlation work. Formation tops will not be descernible.
Our first job is to recognize where the data should be totally discarded, thenlearn how much of the log data should have borehole corrections applied beforeuse. The following rules of thumb may be used:
1. Contact devices, such as compensated density, micro resistivity,dielectric (EPT, ect.) must have intimate pad contact, i.e., a smoothborewall regardless of borehole diameter.
2. Host contact devices start losing required pad pressure as theborehole becomes larger than about 17 inches in diameter.
3. Unless extension arms are used, contact devices should not be trustedin smooth boreholes larger than 18 - 19 inches in diameter. Some toolsmay be equipped with long arms extending this criterion to 29 - 21inches.
Density, gamma ray, SP, induction and neutron (including pulsed neutron) toolsmay suffer significant borehole effects. Service company chartbooks should beconsulted for specific. Corrections are based on (1) actual size of theborehole, and (2) mud properties such as salinity, density, and chemistry.
While the corrections are easily made by computer where a data base has beenestablished, the chartbooks may be used to estimate the amount of correction forwork by hand. In most cases, if the chartbook calls for correcting the raw databy more than 29 percent of its value, a serious effort at making the correctionsshould be made before using the logs in analysis techniques.
It is wise to consider 12-1/2 inches as a maximum bit size for drilling wherewashouts may be a problem and where accurate log data are required. Reaming maybe cheap in the long run. Remember, YOU CANNOT RECALL A LOG FOR REPAIR.
abucts logging lines" Is published monthly by Loren E. 'bud' Thompson. Inc9318 West Iowa Place, Lakewood, CO 80226 (303) 980-1600 Office, (303) 426-3395 AnL Service
Copyright. 1985, Loren E. "bud" Thompson. Inc. No part of this publication may be reproduced in any formor by any means without the written permission of the publisher.
June 1985 Page 3
-
Part One of Two PartsBACK TO BASICS
LOGS SHOULD BE PART OF TIE SOLUTION,NOT PART OF TIE PROBLEMs
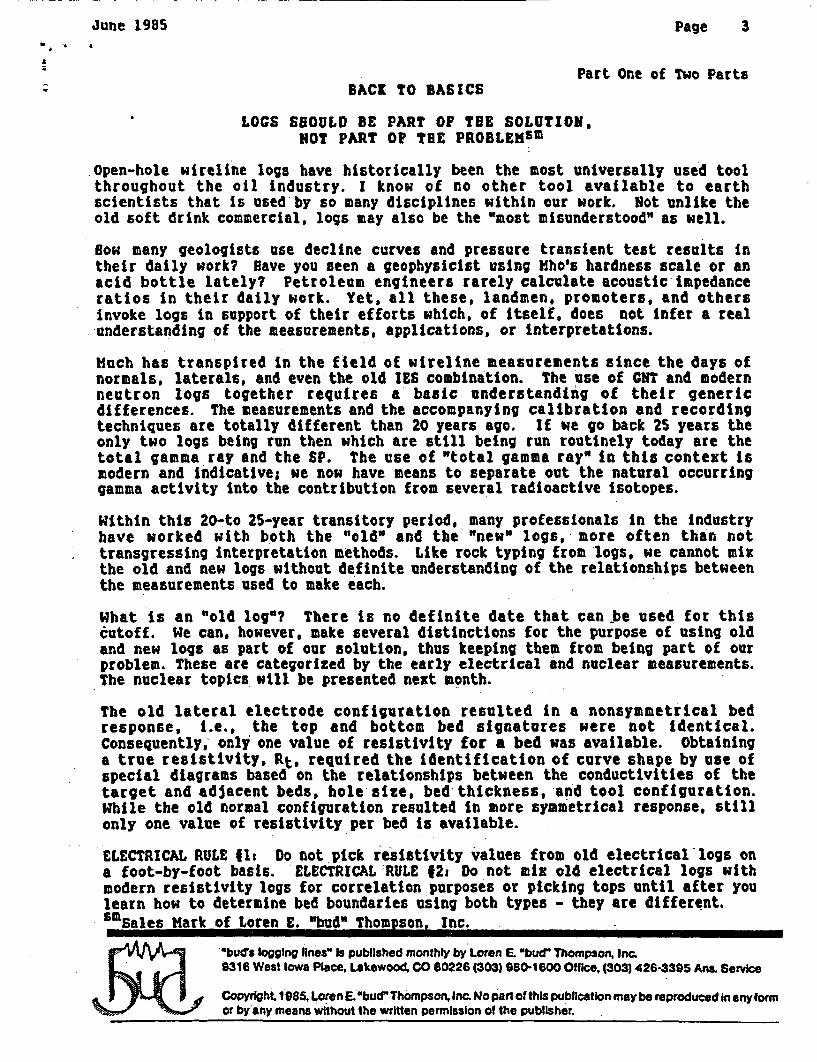
Open-hole wireline logs have historically been the most universally used toolthroughout the oil industry. I know of no other tool available to earthscientists that is used by so many disciplines within our work. Not unlike theold soft drink commercial, logs may also be the "most misunderstood" as well.
How many geologists use decline curves and pressure transient test results intheir daily work? gave you seen a geophysicist using Mho's hardness scale or anacid bottle lately? Petroleum engineers rarely calculate acoustic impedanceratios in their daily work. Yet, all these, landmen, promoters, and othersinvoke logs in support of their efforts which, of itself, does not infer a realunderstanding of the measurements, applications, or interpretations.
Much has transpired in the field of wireline measurements since the days ofnormals, laterals, and even the old IES combination. The use of CNT and modernneutron logs together requires a basic understanding of their genericdifferences. The measurements and the accompanying calibration and recordingtechniques are totally different than 20 years ago. If we go back 25 years theonly two logs being run then which are still being run routinely today are thetotal gamma ray and the SP. The use of "total gamma ray" in this context ismodern and Indicative; we now have means to separate out the natural occurringgamma activity into the contribution from several radioactive isotopes.
Within this 20-to 25-year transitory period, many professionals in the industryhave worked with both the "old" and the "new" logs,- more often than nottransgressing interpretation methods. Like rock typing from logs, we cannot mixthe old and new logs without definite understanding of the relationships betweenthe measurements used to make each.
What is an 'old log"? There Is no definite date that can be used for thiscutoff. We can, however, make several distinctions for the purpose of using oldand new logs as part of our solution, thus keeping them from being part of ourproblem. These are categorized by the early electrical and nuclear measurements.The nuclear topics will be presented next month.
The old lateral electrode configuration resulted in a nonsymmetrical bedresponse, i.e., the top and bottom bed signatures were not identical.Consequently, only one value of resistivity for a bed was available. obtaininga true resistivity, Rt, required the identification of curve shape by use ofspecial diagrams based on the relationships between the conductivities of thetarget and adjacent beds, hole size, bed thickness, and tool configuration.While the old normal configuration resulted in more symmetrical response, stillonly one value of resistivity per bed is available.
ELECTRICAL RULE Iis Do not pick resistivity values from old electrical-logs ona foot-by-foot basis. ELECTRICAL RULE 12: Do not mix old electrical logs withmodern resistivity logs for correlation purposes or picking tops until after youlearn how to determine bed boundaries using both types - they are different.
Sales Mark of Loren E. "bud" Thompson. Inc.
abuds logging lines" Is published monthly by Loren E "bud' Thompson. Inc.931 6 West Iowa Piace, Lakewood. CO 60226 (303) 080-1600 Office, (303) 426-3395 Ans, Service
CopyrIght. 1885, Loren E."bud" Thompson. Inc No part of this publication maybe reproduced In mnyformor by any means without the written permission of the publisher.
September 1984 nrILPIM 3saw.l.-
ADZ O CMITRL
LOG CMUBRATIC5
"Open hole wireline logs are calibrated at three times and two places", is how Istart off the log calibration session of my Logging Quality Control seminar. Thethree times are (1) before, (2) during and (3) after the survey, and the twoplaces are at the surface and in the hole.
While somewhat oversimplified it does serve as a beginning of understanding oftool calibrations for those of us who are not involved with the intricacies oftool design, electronics, or neuclear physics.
SURFACE CNLIBRATIoN -Logging tools must first meet an industry standard (API) forresponse to the environment which is being measured - whether that be low energynatural gamma radiation, higher energy induced nuclear activity, or rockresistivity. The purpose is to maintain a standardization so that the gamma ray,bulk density, resistivity measurements, etc. provided by all service companies inthe same hole, under the same conditions would be nearly identical. After all,the true resistivity of a given volume of rock is a finite value, as is the bulkdensity, etc.
Most of the API base standards are located at the University of Houston, and arein the form of test pits. Ideally, when a service company develops a new tool,the prototype is tested in the appropriate test pit, and the instrument responseis established on a scale to represent the standard.
For development work some service companies maintain their own standards whichhave been matched to the API standards. The next level of physical standard,usually located at the service company field office, is used for "shopcalibration". Most tools are checked in the shop at least every 30 days, and someeach time the truck returns to the shop. The results of shop calibrations shouldbe available on location for client inspection and should be included on the filmwith the field calibrations.
The final level for calibrating at the surface is well site calibration.Environmental chambers, test jigs, "pills", rings, and other devices are carriedon the trucks to establish proper tool operation prior to making a logging run orsurvey.
Once the logging run is complete and the tool is out of the hole, the fieldcalibrations are again checked to determine if there has been any instrument driftsince the before survey calibrations. Once the tool passes the next shopcalibrations, the cycle is complete, and you can be assured the tool wasfunctioning properly for your logging job.
Through the sequential series of standardizations carried from the base standardthrough the service company system to your catwalk, the tools should operate inyour well the same as they would in the API test pit. Remember -
Y OU CANNOT RECALL A LOG FOR REPAIR
).."bud's logging lines" Is published monthly by Loren E "bud' Thompson, Inc.A5 ' t 9318 West Iowa Place. Lakewood, CO 80226 (303) 980-1600 Office. (303) 428-3395 Ans. Service
Copyright. 1984. Loren E. bud" Thompson. Inc. No part of this publication may be reproduced in any ormor by any means without the written permission of the publisher.
July 1985 Page 3.-
Part Two of Two PartsBACK TO BASICS
LOGS SHOULD BE PART OF THE SOLUTION,NOT PART OP TOE PROBLEMSm
(Last month we offered caution when mixing old and new resistivity logs - now asimilar concern when using old and new neutron logs is outlined).
"Old" neutron logs come in as many varieties as Heinz products. Neutronlogging is where the alphabet soup of mnemonics started in logging, with MNT,GNAM, PuBe, RaBe, etc. being the order of the day.
Except for the caliper, no other open hole measurement, ancient or modern, hassuch a broad response to the borehole. These older logs were not standardizedfor source-to-detector spacing, sonde diameter, or whether run centered orecentered. The number of possible combinations of potential problem areasproliferated with the number of wireline companies offering the service.
The modern counterparts, pad epithermal, SNP (Sidewall Neutron Porosity), anddual-detector compensated, CNL (Compensated Neutron Log), have been designedusing more standardized sources, source strengths, and source-to-detectorspacings. The sondes are especially shielded to minimize the effects of the mudcolumn behind the source and detectors, and the tools are run with specificrelationships to the borewall where possible.
The older logs were run ecentered, sometimes with, but often without a specifiedstandoff, or were run mid-hole by use of centralizers. In most cases a calipermeasurement was not made with the run, and frequently no caliper information isavailable for the hole. A wise old sage once remarked, "A neutron log makes agood caliper log where the porosity is constant'. He should know, he helped inthe design of the tools.
Both old and new neutron logs provide a measure of the Hydrogen Index, and theintention is to convert this to total porosity of the rock near the borewall.This is done through calibration to the API neutron test pits at the Universityof Houston. The modern tools are calibrated in limestone porosity units (pu.),with conversions to other lithologies being available. The older logs werecalibrated with a near-logarithmic scale with the highest counts set at a lowporosity (.01-02), and the lowest counts established at .30 to .40 porosity.
NEUTRON RULE #Is Do not use old neutron logs for a purpose includingcorrelation without reference to a caliper log. NEUTRON RULE F2: Do notsubstitute bit size for caliper to make hole size corrections. NEUTRON RMLE93: Do not transgress rock types when using an established porosity scale on aneutron log or on any "porosity log".
To make logs part of your solution, it is important to have a basicunderstanding of the measurements and their petrophysical significance.
Some of the petrophysical misconceptions floating around out there would knockyour socks off. They are often so misused that they would make WilliamSheridan's Mrs. Malaprop blush.sm Sales Hark of Loren E. 'bud" Thompson, Inc.
wd bu logging lines is published monthly by Loren E. "bud" Thompson. Inc.9316 West Iowa Place, Lakewood. CO 80226 (303) 980-1600 Office, (303) 426-3395 Ana. Service
Copyright. 1985. Loren E lbud" Thompson, Inc. No part of this publication maybe reproduced In any formor by'any means without the written permission of the publisher.