Page 1
1
Modern Transport since 1700: A Momentous Achievement
Dan Bogart
Associate Professor
Department of Economics
University of California, Irvine
[email protected]
Abstract
The transportation sector experienced dramatic changes during the last 300 years. This essay
reviews the major technological and infrastructural developments including the transition from
roads to railways to automobiles, the rise of steamships, and the emergence of air-travel.
Changes in the transport market are also examined, including trends in prices, consumption, and
regulation. The role of government policy is given special attention as market power, network
design, and operational inefficiency have been important historically. Lastly the essay discusses
how transport improvements have played a crucial role in economic growth. Various approaches
to quantifying the contribution of transport innovations are reviewed.
Keywords: Transport, Regulation, Economic Growth, Policy, Infrastructure, Social Savings.
JEL codes: N7, O2, R4
Page 2
2
Introduction
Around the year 1700 much of humanity was stuck in the mud. Unimproved roads made it
extremely costly to move goods and people overland. Many rivers had navigation problems and
ocean vessels were slow and risky. Of course there were exceptions. Some roads leading into
major cities were well maintained and constructed using techniques dating to the Romans.
Navigable rivers like the Thames in Britain or the Yangtze in China served as major
thoroughfares for their respective economies. But these were areas privileged by geography.
Most of the pre-industrial world languished under poor transport systems.
This state of affairs changed dramatically from 1700 to 2000. Much like the rest of the global
economy, transportation experienced a “revolution” in technology, investment, and management.
The speed of the revolution varied dramatically across time and space. In general western
European nations led the way in improving their transport systems during the eighteenth and
early nineteenth centuries. From 1850 onwards European technologies and practices diffused
throughout most of the world. For instance, almost every country in the world had a railway or
steamship arriving at its major port by 1913. Although there were many advances by the early
twentieth century, the speed and freedom of travel was still quite limited. Two innovations
changed the nature of transport once again. The airplane and the automobile were initially
adopted in the world’s leading economies, most notably the United States. Subsequently
automobiles and airplanes became commonplace. Today one can travel by car or by plane even
in the poorest countries of the world.
Technological change is only part of the story of the modern transport sector. Improvements
required substantial infrastructure investments. The building of highways, railways, airports and
Page 3
3
the like involved substantial risks. Their irreversible nature meant that costs could not be easily
recovered if revenue expectations were not realized. Partly for this reason, governments stepped
in and either built the network or designed a framework in which private companies built, owned,
and operated infrastructure. Governments also developed a large body of regulations determining
where infrastructure could be developed and how it was used and priced.
This essay reviews the major technological and infrastructural developments in overland, water,
and air transport. Next, it reviews the major trends in prices and quantities. Like any other sector,
outcomes in the transportation sector were the result of “equilibrium” forces. As technology,
income, and market structures evolved, so did fares and the quantities of services purchased. The
general trend was towards cheaper transport and higher traffic volume because of a combination
of income and productivity growth. However, there remained substantial differences in outcomes
across space, even after holding technology and income levels constant. Some of these
differences in fares and traffic volumes were due to broader economic and political forces. For
example, regulatory authorities sometimes acted to protect favored firms by imposing minimum
fares or restricting entry. In other instances authorities limited the monopoly power of transport
providers or they imposed safety standards. Several cases are given below to illustrate some of
the factors influencing outcomes in transport markets.
This essay also examines the contribution of transport improvements to economic development.
The classic approach is to measure the social savings, or the gain in consumer surplus that
occurred due to a transport innovation. Another approach uses regional or state variation to
measure the effect of transport improvements on income or population. The general conclusion is
that transport improvements contributed to development, but there are sizeable differences across
time and space. The effect of any single transport innovation depends on the quality of
Page 4
4
alternative transport modes in addition to managerial and regulatory decisions. Excessive market
power, poor network design, and inefficiency in operations have all worked to limit the social
benefits from transport innovations.
Finally, some have argued that transport improvements have introduced a number of social costs,
particularly greater pollution. However, the evidence suggests that transport improvements and
innovations have done more good than harm and thus this essay takes a decidedly positive tone
when discussing innovations like the automobile and airplane. Because the literature has yet to
satisfactorily measure the social costs of transport over the last 300 years, it is hoped that in the
future more can be said about this important issue.
Technological and Infrastructural Developments
The history of transport can be told through a series of technological breakthroughs and
infrastructural developments. With this in mind, it is useful to start with the eighteenth century
context where road and river transport were dominant in much of the world. Advances in civil
engineering knowledge marked one of the major breakthroughs of this period. Perhaps the most
famous are the British engineers, John Macadam and Thomas Telford, who developed new
techniques for building roads and bridges. Dutch and French engineers also made advances in
navigation which led to “canalizing” rivers and eventually canals.
New systems of public finance were developed concurrently with advances in engineering know-
how. Governments in several Western European countries entered into contractual arrangements
with the private sector to build and operate roads, canals, and bridges in exchange for levying
tolls. These public-private partnerships of the pre-industrial era were predicated on the existence
of relatively stable political systems in which investments were secure from expropriation (both
Page 5
5
public and private). Just as important, these societies could draw on a range of informal
institutions to govern infrastructure providers, making their exactions more palatable to the
society. Governments also began to heed the call by providing public funds for large projects.
One example is the royal highways of France, which were coordinated and financed by the
monarchy. Another example is the British navy, which played a key role in policing the seas,
principally for British ships. More broadly, however, governments rarely spent large sums on
transport infrastructure before 1800. It was only when military and economic interests coincided
that public spending levels exceeded a few percentage points of central government budgets.
Transport progress was modest outside of Western Europe until the mid-nineteenth century. The
available statistics on transport infrastructure provide one indicator that Europe was ahead. By
the 1880s Europe has 925,000 highway miles and 62,000 miles of navigable waterways. By
comparison the U.S. and Canada had 266,000 highway miles and 25,000 waterway miles. India
was further behind. It had 58,000 and 5000 miles of highways and waterways respectively
(Mulhall 1884: 395).
The nineteenth century witnessed more dramatic changes in technology and infrastructure with
the coming of the railway and the steamship. Steam locomotives were first shown to be
economically superior to wagon transport in the densely populated regions of Britain in the
1820s. Relatively quickly railways spread to the rest of Britain, Europe, and the United States.
By 1910 emerging railway networks could be found in most parts of the world, including India,
China, Latin America, and Africa.
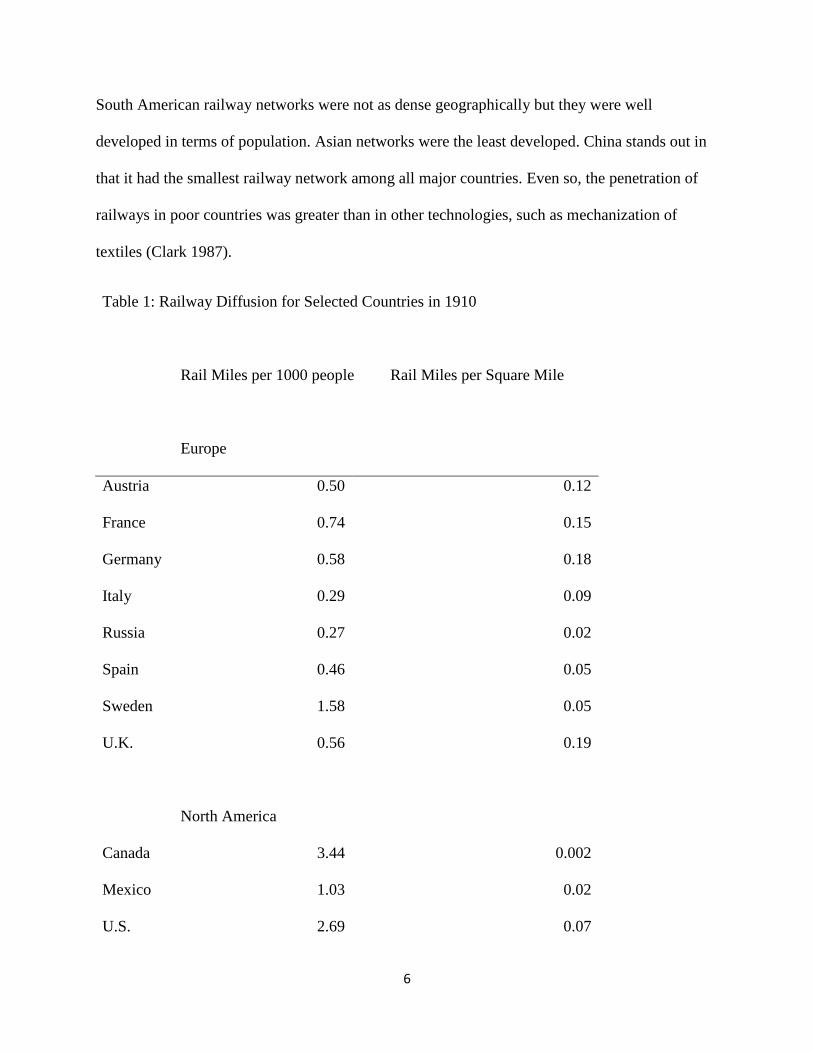
Railway penetration was more extensive in the advanced countries. Table 1 shows European
railway networks were most developed in terms of railway miles per square mile. North and
Page 6
6
South American railway networks were not as dense geographically but they were well
developed in terms of population. Asian networks were the least developed. China stands out in
that it had the smallest railway network among all major countries. Even so, the penetration of
railways in poor countries was greater than in other technologies, such as mechanization of
textiles (Clark 1987).
Table 1: Railway Diffusion for Selected Countries in 1910
Rail Miles per 1000 people Rail Miles per Square Mile
Europe
Austria 0.50 0.12
France 0.74 0.15
Germany 0.58 0.18
Italy 0.29 0.09
Russia 0.27 0.02
Spain 0.46 0.05
Sweden 1.58 0.05
U.K. 0.56 0.19
North America
Canada 3.44 0.002
Mexico 1.03 0.02
U.S. 2.69 0.07
Page 7
7
South America
Argentina 2.64 0.02
Brazil 0.60 0.004
Asia
China 0.01 0.001
India 0.11 0.02
Japan 0.11 0.04
Source: Bogart (2009)
Several factors account for the success of railways as a global technology. One was the
substantial improvements in the design of locomotives, wagons, and rails. By the early 1900s the
cost of adopting railway technologies had decreased dramatically compared to the initial designs.
Developments in global financing and corporate governance also proved crucial. For the first
time in world history it was possible for foreign capitalists to invest and own transportation
facilities in other countries. Colonialism helped to grease the wheels of investment, but other
factors like social networks and the adoption of commercial codes also facilitated diffusion (Ralf
and Gunter 2008). Last but not least, rising global incomes fostered railways. Vast amounts of
railway track were laid in Latin America, India, Russia, and the United States because these
regions had abundant land and Europeans had great demand for their products.
The introduction of the steamship was arguably just as important as the railway in bringing the
nineteenth century world closer together. Steamships came on line in the mid to late 1800s. They
first replaced sail ships along routes where coal was plentiful. They eventually achieved
Page 8
8
dominance in the early 1900s. Like railways, steamships offered capacity and speed. They were
the main vehicle for immigration from Europe to America (Keeling 2008). Probably the most
famous example of a steamship is the Titanic. Its sinking in 1912 was notable in part because it
marked the latest design, combining speed, size, and luxury.
The automobile and the airplane are the two most important transport technologies of the
twentieth century. Prior to 1900 there were experiments with steam-powered automobiles but
none were economically successful. The major breakthrough occurred in the late nineteenth
century when the German Karl Benz developed the internal combustion engine for vehicles.
Automobiles became increasingly common in the 1910s. The development of the assembly line
was one factor. Henry Ford perfected the use of the assembly line at his plants in Michigan and
is credited with a number of organizational innovations. The automobile industry grew
enormously over the ensuing decades. Near its peak in the 1970s, production of motor vehicles,
bodies and trailers, and parts accounted for 15 percent of durable goods production in the U.S.1
The significance of auto production was underlined in 1953 by the assertion of General Motor’s
chairman, Charles Wilson, that ”what’s good for the country is good for General Motors, and
vice-versa.”
Highway expansion was also crucial to the diffusion of automobiles. The auto industry needed
public authorities to provide paved roads. Otherwise their new cars would have been stuck in the
mud. As in the eighteenth century, new systems of public finance were developed to meet this
need. For example, the gasoline tax was increased in the United States in order to help build the
1 Figures obtained from U.S. Department of Commerce, Bureau of Economic Analysis.
http://www.bea.gov/industry/gdpbyind_data.htm.
Page 9
9
Interstate Highway System. Gasoline taxes increased from 1.2% of the U.S. federal government
internal tax revenues in the late 1940s to 2.5% in the 1960s when the interstate highway network
was being built. After the network was built, gasoline taxes declined as a percent of total federal
revenues. In the 1990s they represented 1.7% of all Federal internal tax revenues (Carter et al.
2006: Table Ea609-635).
The airline industry began with the innovations of numerous entrepreneurs and engineers. The
Wright brothers were the first to achieve flight with an airplane. Their design was improved in
the 1920s and 30s, including the introduction of the jet engine. Initially most commercial
aviation firms were small, but by the 1930s the industry became more concentrated. Following a
series of regulations, the U.S. airline industry came to be dominated by Eastern, American,
United, Trans-continental, Western, and Pan American airlines. Each firm was given a regional
monopoly. In some cases their market power has persisted even to the present day.
Like most transport sectors, government involvement in the airline industry is extensive. Cities
or regional governments often own airports. Allocation of scarce airport “slots” has proved to be
a key regulatory tool and has sometimes led to restrictions on entry by rival airlines.
Governments are also largely responsible for safety in air-travel. Major accidents and threats to
security have led to greater government involvement, much like the attacks on the World Trade
Center in 2001 led to the creation of Transportation Safety Administration in the United States.
The Evolution of the Transport Market
Purchases of transportation services have exploded over the past three centuries. Declines in
fares and freight charges have been equally dramatic as have been quality improvements. This
Page 10
10
section provides a brief overview of the market for domestic flights in the U.S. since 1930 to
illustrate these trends for one sector. Comparisons with other sectors are discussed as well.
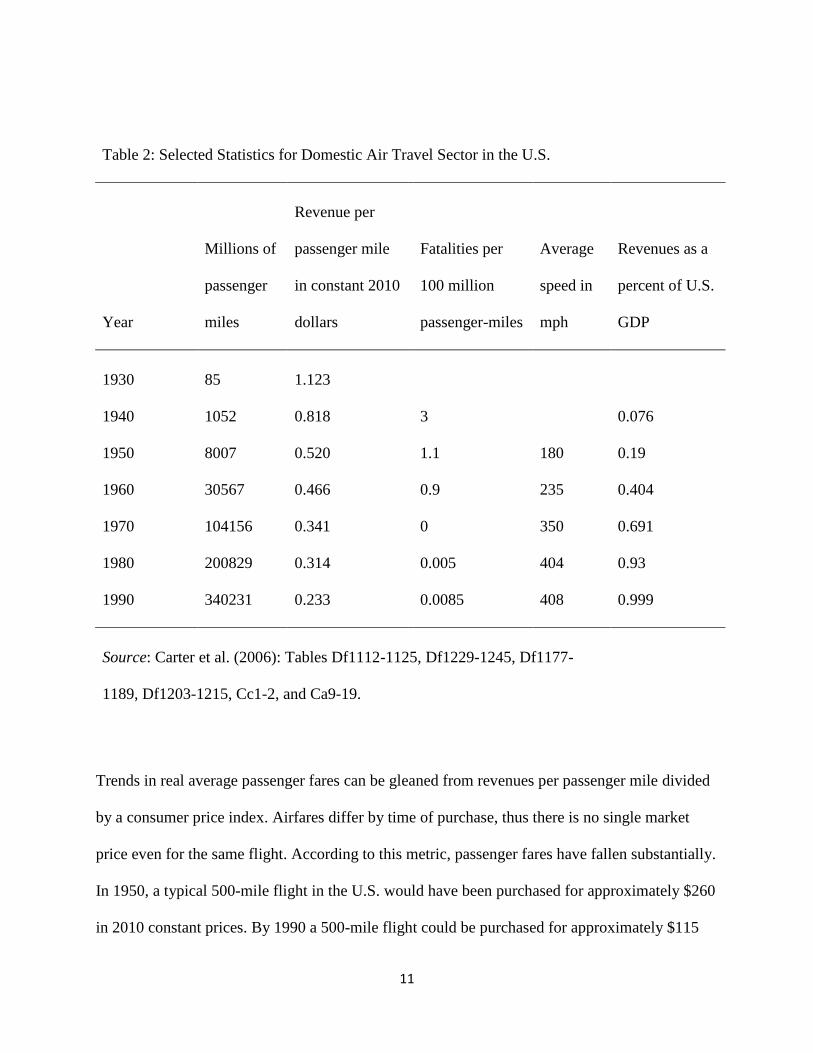
Table 2 reports selected statistics for the domestic airline sector using data from the Historical
Statistics of the United States (Carter et. al. 2006). Passenger miles flown (the main measure of
output) increased from just 85 million in 1930 to more than 340,000 million in 1990. The
average annual growth rate in services was 15% and was especially rapid between 1930 and
1970 when air travel was an emerging industry.
Page 11
11
Table 2: Selected Statistics for Domestic Air Travel Sector in the U.S.
Year
Millions of
passenger
miles
Revenue per
passenger mile
in constant 2010
dollars
Fatalities per
100 million
passenger-miles
Average
speed in
mph
Revenues as a
percent of U.S.
GDP
1930 85 1.123
1940 1052 0.818 3
0.076
1950 8007 0.520 1.1 180 0.19
1960 30567 0.466 0.9 235 0.404
1970 104156 0.341 0 350 0.691
1980 200829 0.314 0.005 404 0.93
1990 340231 0.233 0.0085 408 0.999
Source: Carter et al. (2006): Tables Df1112-1125, Df1229-1245, Df1177-
1189, Df1203-1215, Cc1-2, and Ca9-19.
Trends in real average passenger fares can be gleaned from revenues per passenger mile divided
by a consumer price index. Airfares differ by time of purchase, thus there is no single market
price even for the same flight. According to this metric, passenger fares have fallen substantially.
In 1950, a typical 500-mile flight in the U.S. would have been purchased for approximately $260
in 2010 constant prices. By 1990 a 500-mile flight could be purchased for approximately $115
Page 12
12
dollars. There was an even greater decline in average passenger fares between 1930 and 1950 at
the same time that services were becoming more widespread.
Speed and safety are two of the most important aspects of quality in air travel. Domestic air
travel has become dramatically safer based on the number of fatalities per passenger mile
travelled. The chances of dying in a plane crash in 1990 were a small fraction of what they were
in 1940. The speed of air travel has also increased. Average speeds went from 180 to 350 miles
per hour between 1950 and 1970.
Sectors exhibiting radical decreases in prices and quality improvements usually see a greater
growth relative to other sectors. Air travel was no exception. U.S. domestic airline revenues as a
percentage of GDP increased from less than 0.1% in 1940 to 1% by 1990. A similar story could
be told for other transport sectors as they progressed from novelty to a mature industry. For
example, rail freight services in the U.S. grew by an average of 9.4% per year between 1850 and
1910. The most rapid growth occurred in the 1850s, 60s, and 70s. Railroad freight rates and
travel times also declined to a fraction of their initial level (Fishlow 1966).
What accounts for the rapid growth in output in the transport sector? Higher incomes are
certainly one factor. Travel is a normal good: an individual wants to travel more as his or her
income increases. The same holds in the aggregate as well. Britain was the richest economy in
the early nineteenth century. It also had the largest transport sector (Ville 1990). In the late
nineteenth century, the U.S. became the richest economy in the world. It soon became the largest
consumer of transport services as well.
Greater investment and productivity growth were also driving the growth in transport output. As
mentioned earlier, infrastructure investments like the construction of roads, seaports, canals,
Page 13
13
railway tracks, and airports played a crucial role. The role of productivity is perhaps less obvious.
Productivity growth implies that the same amount of goods or services can be supplied with
fewer inputs, like labor and capital. Productivity growth is significant in any industry because it
allows firms to charge lower prices and still cover their fixed costs of investment. In the U.S.
domestic airline sector, labor productivity (or passenger miles flown per worker) increased by a
factor of 18 between 1930 and 1990.2 Although not as spectacular, labor productivity has
increased in other transport sectors as well. In U.S. railroads, for example, labor productivity is
estimated to have increased by a factor of 3 between 1840 and 1910 (Fishlow 1966).
Technological change is one of the key drivers of productivity growth. In the air and rail sectors
improvements in jet engines and locomotive power increased average haul-sizes and fuel
efficiency. “Organizational” change is another contributing factor. One example was the
reduction in risks associated with the British Navy routing-out piracy in the Caribbean Sea
(North 1958). There is debate in the literature as to the significance of the British Navy’s
contribution to productivity growth when compared with steam power and steel hulls (Harley
1988), nevertheless it is clear that investments in safety were a public good, and without the
assistance of the British Navy, ocean shipping would have been more expensive. Another
example of organizational change involved the turnpike roads of eighteenth century Britain. In
this case tolls were used to finance road improvements because the existing system for financing
highways was inadequate. Following the introduction of turnpikes, carriers adopted larger
wagons and faster carriages, eventually contributing to lower transport costs. In this case, private
investments in vehicles and public investments in roads were complementary (Bogart 2005).
2 Author’s calculation based on Carter et al. (2006): Df1112-1125
Page 14
14
Increases in economic “density” have been another important factor in determining productivity
growth. As urban populations increase, planes, trains, and automobiles can run more frequently
and at a higher percentage of capacity. An excellent example comes from the shipping of grain
and cattle in the nineteenth century. Beef was a desired American import in Europe but a
problem arose because ships could not be filled with beef cattle alone. As it turns out grain was
used to fill the empty cargo space, and when combined in the same ship, cattle and grain freight
rates were reduced to very low levels. However, the opportunity to combine complementary
freight was only available on a certain routes, such as New York to London, where there was a
high volume of services (Harley 2008).
Cost decreases translate into the greatest price reductions when competition is most vigorous.
But obviously competition does not always prevail in transportation. Entry is costly because of
the large fixed costs in setting up transport services. The small number of firms is significant
because it aides efforts in collusion. The Joint Executive Committee is one telling case where
collusion seems to have been partially successful. The Committee fixed the market share among
several railroads shipping grain from the Midwest to the Eastern seaboard of the U.S. in the
1880s. According to some accounts individual railroads were deterred from cheating on the
cartel because they expected to be sanctioned by the other railroads belonging to the Joint
Executive Committee (Porter 1983).
The fear of collusion has led transport users to lobby for government regulation of fares and
freight charges. However, the implementation of regulation has been difficult in practice.
Perhaps the most famous example is the Interstate Commerce Commission (ICC), which was
made responsible for regulating railroads in the U.S. during the late 1800s. Its early success was
limited by a Supreme Court decision that weakened its powers to set railroad rates (Kolko 1965).
Page 15
15
In another case, the colonial government of India introduced maximum freight charges for
railways in the nineteenth century. But it also introduced minimum freight charges to limit
ruinous competition. There is some evidence that the colonial government kept minimum rates
high because it wanted to maintain high profits on the railway lines that it owned (Bell 1894:
205-15). In both of these cases, government regulation was compromised to some degree by the
conflicting interests of governing authorities.
The extent of government ownership has been another important factor in transport markets.
Governments were always involved in building and operating transport infrastructure, but prior
to railways they rarely owned the wagons and ships which provided transport services. In the
nineteenth century governments began to take over these functions. As one indication, the
fraction of world railway miles owned and operated by private companies declined from over 90%
in 1860 to just above 70% in 1912. Government ownership increased because of new
construction and because of nationalizations of privately owned railways. Many of the
nationalizations occurred on a line-by-line basis, as national authorities targeted particular
railway companies. In other cases, like Switzerland and Japan, laws were passed transferring
ownership over much of the network to the central government. The reasons for greater
government ownership varied. Military interests were certainly a factor since railways were an
input into the state’s war machine. Political and economic factors mattered as well. For example,
democratic countries tended to have less nationalization than more autocratic countries (Bogart
2009).
The effect of government ownership on transport performance is a topic of major interest among
scholars and policy makers. In a number of cases it appears that nationalizations of railways in
the nineteenth century reduced operating efficiency (Bogart 2010). One explanation is that
Page 16
16
governments tend to care more about rewarding constituencies with extra railway stations and
employment. Matters are more complicated, however, when privately owned railways receive
substantial government subsidies or when railways represent an important source of tax revenue.
India provides one case in point. Here greater government ownership in the nineteenth century
seems to have reduced operating costs (Bogart and Chaudhary 2012).
The Impact of Transport on Economic Development
It has long been argued that transport improvements generate development. But the size of these
developmental effects is still in debate. This final section reviews the literature studying the
impact of transport improvements. It also discusses the channels by which transport influences
development.
Nineteenth-century boosters often argued that railroads were crucial to economic development,
but they did not have a clear method to test their argument. Economic historians of the 1960s
approached this issue using a novel approach known as the “social-savings” methodology. The
goal is to measure how much consumer surplus was gained from railways at some benchmark
date, say 1860 or 1890. The reasoning is that railway customers would have relied on alternative
transport modes, like wagons and boats, in the absence of railways. A simple approximation for
the gain in consumer surplus is the difference between freight rates for wagons and railroads
multiplied by quantity of rail traffic in 1860 or 1890. Prices are meant to capture the marginal
costs of each technology under perfect competition and the quantity of traffic proxies for
consumer demand.
Early research showed that the social-savings of railways were surprisingly small in the U.S.
According to two prominent studies, U.S. GDP would have been lowered by only a few
Page 17
17
percentage points in 1860 or 1890 had railways never existed (Fishlow 1965, Fogel 1970).
Similar conclusions were reached for railways in European countries (O’Brien 1983). The view
that railways were indispensible for nineteenth century development was largely debunked for
more developed economies. For less developed countries, like Mexico and Brazil, railways had
much larger social savings and could be considered ‘crucial’ if not indispensable (Summerhill
2005, Coatsworth 1979).
The social savings methodology is controversial, however. Critics point to a number of problems.
First, it is not clear what the price of road or water transport would have been in the absence of
railways. Congestion would have increased on roads and rivers with the increased traffic volume.
The cost of using alternative transport modes is arguably underestimated as a result (McClelland,
1968: 114). Second, the social savings calculation omits spillovers. Railways increased demand
for iron and steel and increased competition in manufacturing. The size of these backward and
forward linkages is unclear. There are also changes in economic geography to consider. In theory,
lower transport costs can lead to agglomeration of economic activity, like the emergence of cities.
The standard social savings methodology has no way of measuring the effects on urbanization.
Yet, the social savings methodology has yielded a number of insights that are worth mentioning.
First, railways offered time savings as well as monetary savings. One study quantifies the value
of time saved on British railways and shows it was equal to approximately 10% of GDP in 1913.
Railways were important in this regard because walking was the alternative for many low
income passengers (Leunig 2006). Second, the social savings methodology shows how different
transport modes can serve as substitutes. Countries without effective road and water transport
often had higher social savings from railways. A case in point is Brazil, where mule trains
represented the alternative to railways (Summerhill 2005). A third insight concerns technology
Page 18
18
diffusion and access. Necessarily there must be a large number of customers if any transport
improvement is going to have a large social savings. In some countries, like Spain, the railway
had a smaller impact than it might have had because its total revenues represented a small share
of GDP (Herranz-Loncán 2006). One potential culprit is poor regulation or network design.
A second general method seeks to measure the effects of transport on economic outcomes more
directly. It uses regression analysis to compare income or population density in economies with
and without transport innovations or to measure economic changes before and after transport
innovations are introduced. Most studies in this second vein find that transport improvements
have effects on income and population density. Often the key questions revolve around the size
of the effect. One study estimates the effect of highways on suburbanization in the U.S. between
1950 and 1990. During this period, central city population declined by 17%. The analysis
compares the differences in population across cities depending on the number of new highway
miles. The estimates imply that one new highway passing through a central city reduced its
population by about 18 percent (Baum-Snow 2007).
Estimates of the effects of transport improvements are useful in informing policy discussions.
Transportation improvements are often expensive. If the developmental effects are small relative
to the costs then transport funding should be reduced. More generally if transport innovations
change the way we live, as in the case of suburbanization, then it is useful to know how much.
The literature also speaks to the importance of transport improvements in the development of
economies over the long-run. As transport costs are crucially linked with trade costs and the
extension of markets, transport improvements have been shown to be one of the most important
developments in any economy.
Page 19
19
As a final remark, transport innovations have been difficult to implement historically because
they involve vexing issues like eminent domain and taxation. In addition, some economies have
made inefficient use of their transport infrastructure due to excessive monopoly power and
regulatory failures. History tells us that attention needs to be paid to transport effectiveness if the
social gains of transport are to be realized.
References
Bell, H. (1894) Railway Policy of India: With Map of Indian Railway System, Percival:
Rivington.
Baum-Snow, N. (2007) ‘Did highways cause suburbanization?’ Quarterly Journal of Economics,
122: 775-805.
Bogart, D. (2005) ‘Turnpike trusts and the transportation revolution in eighteenth century
England’, Explorations in Economic History, 42: 479-508.
Bogart, D. (2009) ‘Nationalizations and the development of transport systems: cross-country
evidence from railroad networks, 1860–1912’, Journal of Economic History, 69: 202-37.
Bogart, D. (2010) ‘A global perspective on railway inefficiency and the rise of state ownership,
1880-1912’, Explorations in Economic History, 47: 158-78.
Bogart, D., and Chaudhary, L. (2012) ‘Regulation, Ownership, and Costs: A Historical
Perspective from Railways in Colonial India’, American Economic Journal: Economic Policy, 4:
28-57.
Page 20
20
Carter, S. B., Gartner, S.S., Haines, M.R., Olmstead, A.L., Sutch, R., Wright, G. and Cain, L.P.
(eds.) (2006) Historical Statistics of the United States Millennial Edition, New York: Cambridge
University Press.
Clark, G. (1987) ‘Why isn't the whole world developed? lessons from the cotton mills’, Journal
of Economic History, 47: 141-73.
Coatsworth, J. (1979) ‘Indispensable Railroads in a Backward Economy: The Case of Mexico’,
Journal of Economic History, 39: 939-60
Gunder, D., and Ralf, R. (eds.) (2008) Across the Borders: Financing the World's Railways in
the Nineteenth and Twentieth Centuries, Aldershot: Ashgate.
Fogel, R. (1970) Railroads and American Economic Growth: Essays in Econometric History,
Baltimore: John Hopkins Press.
Fishlow, A. (1966) ‘Productivity and technological change in the railroad sector, 1840-1910’, in
D.S. Brady (ed.) Output, Employment, and Productivity in the United States after 1800, New
York: NBER.
Fishlow, A. (1965) American Railroads and the Transformation of the Ante-bellum Economy,
Cambridge: Harvard University Press.
Harley, C.K. (1988) ‘Ocean freight rates and productivity, 1740-1913: the primacy of
mechanical invention reaffirmed’, Journal of Economic History, 4: 851-76.
Harley, C.K. (2008) ‘Steers afloat”: the North Atlantic meat trade, liner predominance, and
freight rates, 1870–1913’, Journal of Economic History, 68: 1028-58.
Page 21
21
Herranz-Loncan, A. (2006) ‘Railroad impact in backward economies: Spain, 1850 1913’,
Journal of Economic History, 66: 853-81.
Keeling, D. (2008) ‘Transport capacity management and transatlantic migration, 1900-1914’,
Research in Economic History, 25: 225-83.
Kolko, G. (1965) Railroads and Regulation: 1877-1916, Princeton: Princeton University Press.
Leunig, T. (2006) ‘Time is money: a re-assessment of the passenger social savings from
Victorian British railways’, Journal of Economic History, 66: 635-73.
McClelland, P.D. (1968) ‘Railroads, American growth, and the new economic history: a critique’,
Journal of Economic History, 28: 102‐23.
Mulhall, M. (1884) Mulhall’s Dictionary of Statistics, London: George Routledge and Sons.
North, D.C. (1958) ‘Ocean freight rates and economic development, 1750-1913’, Journal of
Economic History, 18: 537-55.
O’Brien, P.K. (1983) Railways and the Economic Development of Western Europe: 1830-1914,
New York: St. Martin’s.
Porter, R. (1983) ‘A study of cartel stability: a study of the Joint Executive Committee, 1880-
1886’, Bell Journal of Economics, 14: 301-14.
Summerhill, W.R. (2005) ‘Big social savings in a small laggard economy: railroad-led growth in
Brazil’, Journal of Economic History, 65: 72-102.
Ville, S. (1990) Transport and the Development of the European Economy, 1750-1918, London:
MacMillan.