Modification of the Palmer Drought Severity Index for Mediterranean environments: Model and application
A. Paulo1, D.S. Martins2,3, P. Paredes2, R.D. Rosa2 and L.S. Pereira2* 1 ESAS, Instituto Politécnico de Santarém, Portugal 2 LEAF Linking Landscape, Environment, Agriculture and Food, Instituto Superior de Agronomia, Universidade de Lisboa, Portugal 3 Instituto Dom Luiz, Faculdade de Ciências, DEGGE, Universidade de Lisboa, Lisboa, Portugal * e-mail: [email protected]
Abstract: This article describes a modification of the Palmer Drought Severity Index (PDSI) as adapted to Mediterranean conditions, resulting in a new index, the MedPDSI. It differs from the original PDSI because the olives crop, a typical Mediterranean perennial resistant to water stress, is assumed as drought reference crop aiming at the application of the soil water balance. The adopted approach modifies the soil water balance computation, with the actual evapotranspiration computed with the FAO-PM reference ETo and a crop coefficient obtained from the FAO dual Kc approach, Kc = Kcb +Ke. The basal crop coefficient Kcb refers to transpiration and is parameterized at the month scale for a typical rainfed olives grove. The soil evaporation coefficient Ke is estimated every month as a function of soil evaporation, thus depending on monthly precipitation, evaporative atmospheric demand and the soil evaporation characteristics following FAO56. The basic computations of PDSI are kept and self-calibration is adopted. MedPDSI was tested for various soil types and locations across Portugal. Comparing results of the water balance with MedPDSI and PDSI, it is apparent a larger actual ET during the rainy months and smaller in the dry months with MedPDSI; coherently, runoff and percolation decrease. It results, however, relatively similar identification of drought and wetness periods, with the MedPDSI responding quicker to changes in precipitation.
Key words: PDSI, MedPDSI drought index, soil water balance, rain-fed olives crop, actual evapotranspiration
1. INTRODUCTION
Drought is a climatic event characterized by a persistent lower than average precipitation with an uncertain frequency, duration and severity resulting in diminished water resources availability. Several drought indices have been developed with the purpose of drought monitoring and drought severity evaluation.
The Palmer Drought Severity Index (Palmer, 1965) is widely used for drought monitoring and in studies on climate change. Precipitation, temperature and soil water holding capacity are required to compute the PDSI. Main limitations of the PDSI refer to the adoption of the Thornthwaite’s potential evapotranspiration and the soil water balance modelling (Alley, 1984).
Considering limitations of the method and developments in the ET and soil water balance domains, an adaptation of the PDSI to Mediterranean conditions, the Mediterranean Palmer Drought Severity Index (MedPDSI) was firstly proposed by Pereira et al. (2007). The MedPDSI has been already compared positively with the PDSI, SPEI and SPI in Portugal (Paulo et al., 2012). The backbone of MedPDSI is the soil water balance applied to an olive orchard, by estimating separately soil evaporation and transpiration of the olive crop adopting the dual crop coefficient approach (Allen et al., 1998) modified for a monthly time scale. The objective of this study is to model MedPDSI adopting a self-calibration procedure and to assess its performance for various locations in mainland Portugal comparatively to PDSI.
A. Paulo et al. 196
2. MODIFICATION OF PDSI AND DEVELOPMENT OF THE MedPDSI
2.1 Palmer’s formulation
The computation of the PDSI begins with a soil water balance described by (Palmer, 1965)
(1)
where P is precipitation, ET is evapotranspiration, RO is runoff, R is soil water recharge and L is soil water loss. The soil is divided in two layers: the surface layer has an available water holding capacity of 25 mm, the water holding capacity of the underlying layer depends on the soil characteristics. The potential evapotranspiration (PET) is computed by the Thornthwaite equation. The ET from the surface layer takes place at its potential rate. ET rate from the underlying layer is a linear function of the ratio between available soil moisture in this layer to water holding capacity of both layers. The water extraction from the underlying layer begins after the total depletion of the surface layer. The recharge of the underlying layer takes place after the surface layer is replenished. Runoff occurs when both layers reach field capacity. The potential terms PRO, PR, PL express a hypothetical maximum of RO, R and L. The precipitation climatically appropriate for existing conditions represents the amount of precipitation expected to maintain normal soil moisture level in a single month i, here denoted by as
(2)
where the coefficients αj, βj, γj, δj are calculated for each month j as the ratio between the average of estimated and potential terms over a calibration period.
The moisture anomaly index z is obtained by
(3)
where kj is the climatic characteristic for the month j, obtained by an equation using central United States data. The PDSI for month i, Xi, is then derived from zi, and the PDSI of month i-1, Xi-1:
(4)
The p and q are called duration factors and express the sensitivity of the index to precipitation. The values p = 0.897 and q = 1/3 were obtained by Palmer using cumulated z during the driest periods of various lengths in two locations. The computation of the PDSI requires the computation of three intermediate indices, X1, X2 and X3 using Eq. 4, X1/X2 representing the severity of a wet/dry spell that is becoming established, X3 the severity index for any wet/dry spell that has become established. The selection of the PDSI from those indices relies on complex operating rules and a backtracking procedure.
The self-calibration of the PDSI replaces kj and p and q by values computed in each location from the historical climatic data. The self-calibration procedure initiates after having calculated d and follows several sequential steps to obtain the self-calibrated PDSI, sc-PDSI (Wells et al., 2004). The methods for defining the wettest and driest periods and the choice of time lengths to obtaining the duration factors are analysed by Dai (2011). The adjustment of the climatic characteristic and the duration factors to local climate conditions allows a better spatial comparability and reduces PDSI range; however the sc-PDSI still does not have a symmetric distribution.
P = ET + RO+ (R− L)
iP
Pi =α jPETi +β jPRi +γ jPROi −δ jPLi
z = k j (Pi − Pi )
Xi = p Xi−1 + q zi = 0.897Xi−1 + zi / 3
European Water 60 (2017) 197
2.2 MedPDSI: the new soil water balance
The modifications base upon considering a rainfed olive crop as water balance reference crop because it is a perennial crop well adapted to water stress and to the Mediterranean environments. The current model to compute MedPDSI is modified from that proposed by Pereira et al. (2007).
The water balance may be performed for a variety of soils. Presently, the soil type may be chosen from nine different soil types, according to texture, the average soil water holding characteristics and soil evaporation parameters as for the dual Kc approach (Allen et al., 1998; Rosa et al., 2012). The soil water balance considers the rooting depth of a mature olive grove and the sensitivity of the olive tree to the water stress. The actual ET (ETa) is computed through the soil water balance. The counterpart potential term is the maximum/standard crop evapotranspiration ETc = Kc ETo where Kc is obtained using the FAO56 dual Kc approach. Other computational procedures follow Palmer´s rules (Section 2.1) and self-calibration is also adopted for MedPDSI.
The monthly weather input data are precipitation (P) and reference evapotranspiration (ETo), computed by the FAO56 Penman-Monteith equation (Allen et al., 1998). The generic equation of the soil water balance is:
(5)
where ΔASW is the variation of the available soil water stored (ASW) in the root zone, Roff is surface runoff due to non-infiltrated precipitation, ETa is actual crop evapotranspiration and Dp is deep percolation through the bottom of the root zone. The deep percolation is computed assuming that drainage from the root zone occurs immediately after excess precipitation (Doorenbos and Pruitt, 1977). Roff = 0 as daily data is required for its computation.
Water use and evapotranspiration of olive orchards has been often studied, recently adopting the dual Kc approach (e.g., Allen and Pereira, 2009; Cammallieri et al., 2014; Paço et al., 2015) thus partitioning ET into crop transpiration and evaporation from the soil. The crop coefficient is Kc = Kcb + Ke. The basal crop coefficient Kcb refers to transpiration and is parameterized at the month scale for a typical rain-fed olive grove with 30% ground cover based upon the referred studies. The resulting Kcb values are: 0.33 for the months of January to April and the autumn months of November and December, 0.28 for the summer months of June through September, and 0.30 for the transition months of May and October. For a rain-fed crop in a Mediterranean climate higher Kcb are expected when rain has refilled the soil and lower Kcb are observed during the dry summer months despite the atmospheric demand for evaporation is high. Ke is the soil evaporation coefficient, which was parameterized for every month based upon Paço et al. (2015) and simulations of the olive crop performed for various Portuguese locations using the SIMDualKc model (Rosa et al., 2012). It was therefore possible to establish the following equation
(6)
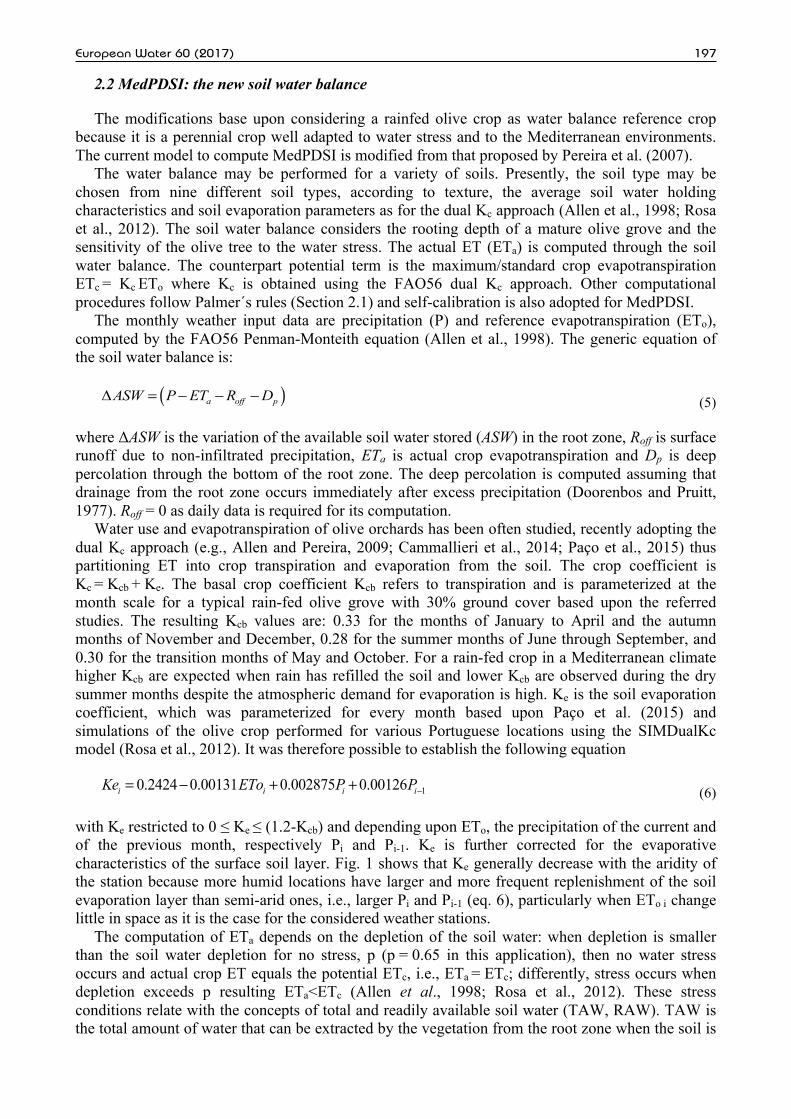
with Ke restricted to 0 ≤ Ke ≤ (1.2-Kcb) and depending upon ETo, the precipitation of the current and of the previous month, respectively Pi and Pi-1. Ke is further corrected for the evaporative characteristics of the surface soil layer. Fig. 1 shows that Ke generally decrease with the aridity of the station because more humid locations have larger and more frequent replenishment of the soil evaporation layer than semi-arid ones, i.e., larger Pi and Pi-1 (eq. 6), particularly when ETo i change little in space as it is the case for the considered weather stations.
The computation of ETa depends on the depletion of the soil water: when depletion is smaller than the soil water depletion for no stress, p (p = 0.65 in this application), then no water stress occurs and actual crop ET equals the potential ETc, i.e., ETa = ETc; differently, stress occurs when depletion exceeds p resulting ETa<ETc (Allen et al., 1998; Rosa et al., 2012). These stress conditions relate with the concepts of total and readily available soil water (TAW, RAW). TAW is the total amount of water that can be extracted by the vegetation from the root zone when the soil is
( )Δ a off pASW P ET R D= − − −
10.2424 0.00131 0.002875 0.00126i i i iKe ETo P P−= − + +
A. Paulo et al. 198
at field capacity while RAW is the fraction of TAW that can be removed from the root zone without stress, i.e., RAW = p TAW. Therefore, adopting these concepts, droughts are differently identified for soils with large or small TAW and, consequently when also the rooting depth is larger or smaller. In this application, the root depth adopted for the olive trees is 1.5 m (Allen et al. 1998).
Figure 1. The monthly soil evaporation coefficient Ke averaged (1941-2006) at all locations
3. APPLICATION
3.1 Soil water balance: comparing MedPDSI with PDSI
The drought indices PDSI and MedPDSI were computed in 14 weather stations across Portugal in the period 1941-2006. The aridity index computed as per UNEP shows that locations cover a good range of climates, from humid to semi-arid. The latitude and longitude of the weather stations and respective aridity indices are shown in Fig. 1.
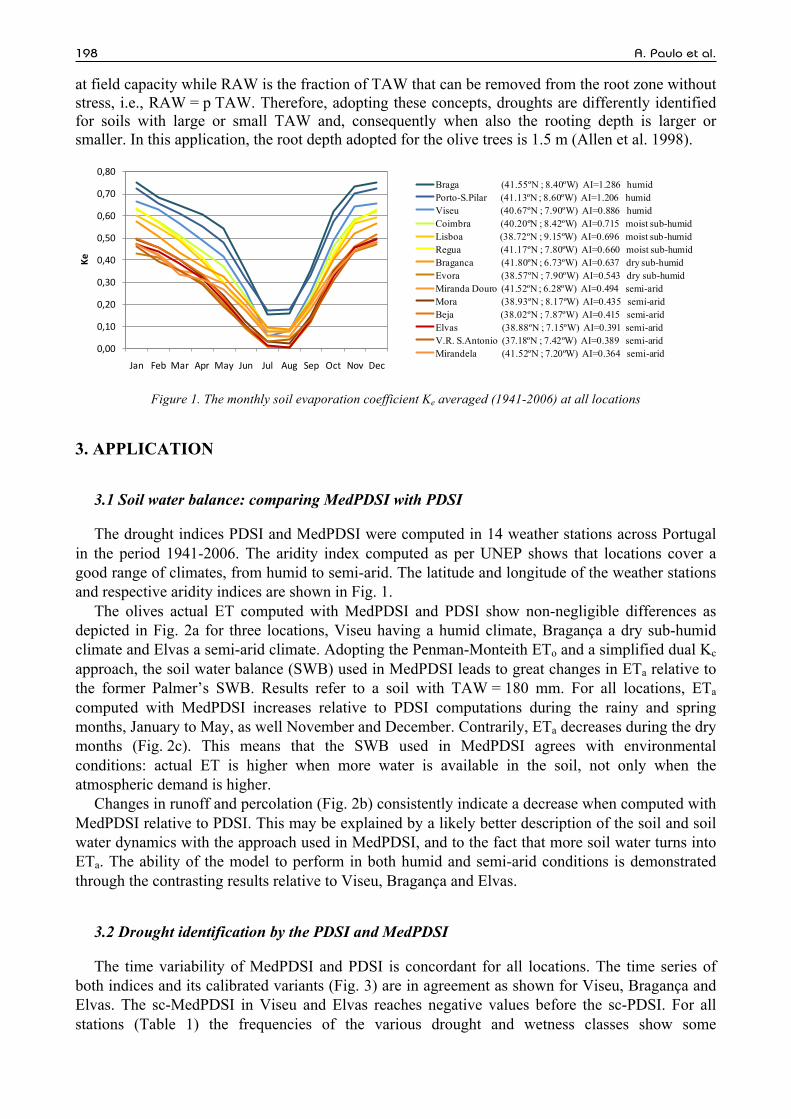
The olives actual ET computed with MedPDSI and PDSI show non-negligible differences as depicted in Fig. 2a for three locations, Viseu having a humid climate, Bragança a dry sub-humid climate and Elvas a semi-arid climate. Adopting the Penman-Monteith ETo and a simplified dual Kc approach, the soil water balance (SWB) used in MedPDSI leads to great changes in ETa relative to the former Palmer’s SWB. Results refer to a soil with TAW = 180 mm. For all locations, ETa computed with MedPDSI increases relative to PDSI computations during the rainy and spring months, January to May, as well November and December. Contrarily, ETa decreases during the dry months (Fig. 2c). This means that the SWB used in MedPDSI agrees with environmental conditions: actual ET is higher when more water is available in the soil, not only when the atmospheric demand is higher.
Changes in runoff and percolation (Fig. 2b) consistently indicate a decrease when computed with MedPDSI relative to PDSI. This may be explained by a likely better description of the soil and soil water dynamics with the approach used in MedPDSI, and to the fact that more soil water turns into ETa. The ability of the model to perform in both humid and semi-arid conditions is demonstrated through the contrasting results relative to Viseu, Bragança and Elvas.
3.2 Drought identification by the PDSI and MedPDSI
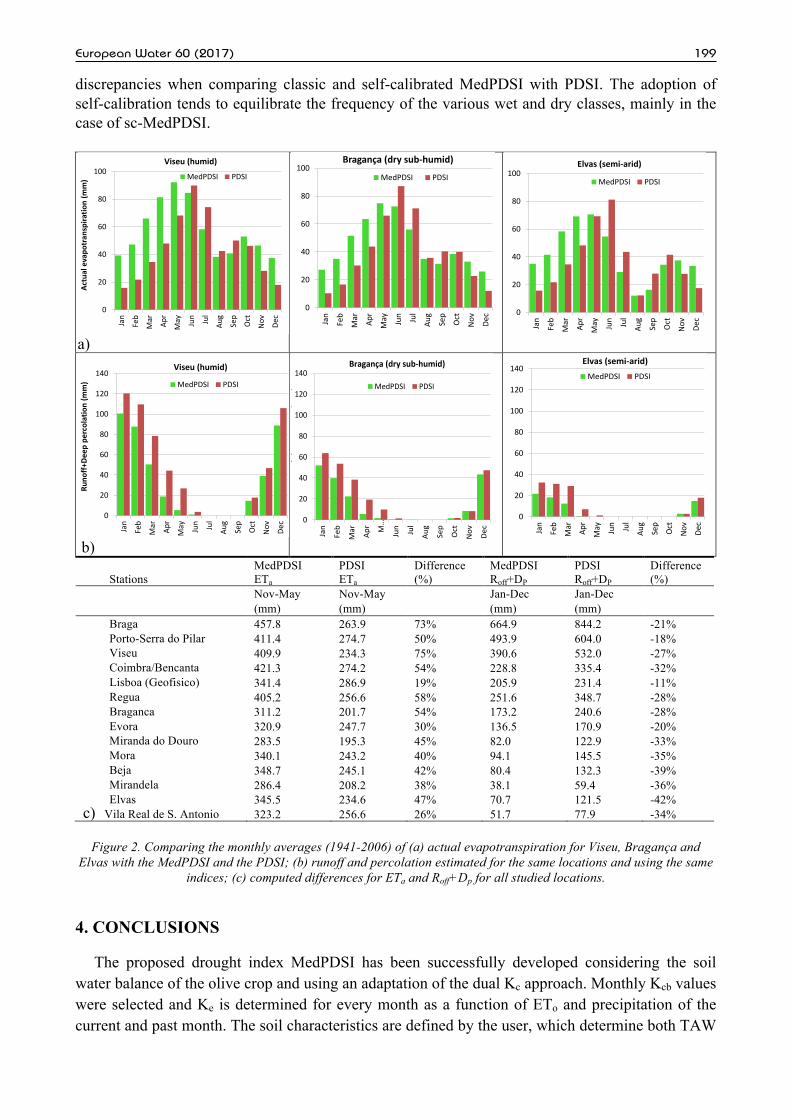
The time variability of MedPDSI and PDSI is concordant for all locations. The time series of both indices and its calibrated variants (Fig. 3) are in agreement as shown for Viseu, Bragança and Elvas. The sc-MedPDSI in Viseu and Elvas reaches negative values before the sc-PDSI. For all stations (Table 1) the frequencies of the various drought and wetness classes show some
discrepancies when comparing classic and self-calibrated MedPDSI with PDSI. The adoption of self-calibration tends to equilibrate the frequency of the various wet and dry classes, mainly in the case of sc-MedPDSI.
c) Vila Real de S. Antonio 323.2 256.6 26% 51.7 77.9 -34%
Figure 2. Comparing the monthly averages (1941-2006) of (a) actual evapotranspiration for Viseu, Bragança and Elvas with the MedPDSI and the PDSI; (b) runoff and percolation estimated for the same locations and using the same
indices; (c) computed differences for ETa and Roff+Dp for all studied locations.
4. CONCLUSIONS
The proposed drought index MedPDSI has been successfully developed considering the soil water balance of the olive crop and using an adaptation of the dual Kc approach. Monthly Kcb values were selected and Ke is determined for every month as a function of ETo and precipitation of the current and past month. The soil characteristics are defined by the user, which determine both TAW
0
20
40
60
80
100
Jan
Feb
Mar Apr
May Jun Jul
Aug
Sep
Oct
Nov Dec
Actualevapo
tran
spira
tion(m
m) MedPDSI PDSI
Viseu(humid)
0
20
40
60
80
100
Jan
Feb
Mar Apr
May Jun Jul
Aug
Sep
Oct
Nov Dec
Actualevapo
tran
spira
tion(m
m)
Bragança(drysub-humid)
MedPDSI PDSI
0
20
40
60
80
100
Jan
Feb
Mar Apr
May Jun Jul
Aug
Sep
Oct
Nov Dec
Actualevapo
tran
spira
tion(m
m) MedPDSI PDSI
Elvas(semi-arid)
0
20
40
60
80
100
120
140
Jan
Feb
Mar Apr
May Jun Jul
Aug
Sep
Oct
Nov Dec
Runo
ff+De
eppercolatio
n(m
m) MedPDSI PDSI
Viseu(humid)
0
20
40
60
80
100
120
140
Jan
Feb
Mar
Apr M…
Jun Jul
Aug
Sep
Oct
Nov Dec
Runo
ff+D
eeppe
rcolation(m
m) MedPDSI PDSI
Bragança(dry sub-humid)
0
20
40
60
80
100
120
140
Jan
Feb
Mar Apr
May Jun Jul
Aug
Sep
Oct
Nov Dec
Runo
ff+De
eppercolatio
n(m
m) MedPDSI PDSI
Elvas(semi-arid)
A. Paulo et al. 200
and soil evaporative conditions. The adoption of the new SWB approach led to larger ETa computed with MedPDSI than with PDSI during the rainy months, thus when more soil water is available. Contrarily, since with MedPDSI more water is used as ETa, it results that the non-used precipitation, runoff and percolation, are smaller than for PDSI.
a) b)
c) d)
e) f)
Figure 3. Time variability (1941-2006) of MedPDSI and PDSI (a, c, e) and self-calibrated MedPDSI and PDSI (b, d, f) in Viseu (a, b), Bragança (c, d) and Elvas (e, f)
The self-calibration for dry and wet periods reduced the asymmetry and balanced the frequency of mild/moderate dry and wet categories. Results from comparing MedPDSI and PDSI through the entire period of records led to conclude that both indices behave similarly in terms of time variability, but the sc-MedPDSI identified more frequently moderate, severe and extreme droughts than the sc-PDSI. This may indicate that the SWB performed with MedPDSI is well linked to the water supply-demand and is likely more realistic that PDSI.
-6
-4
-2
0
2
4
6
MedPDSI PDSI
Viseu(humid)
-6
-4
-2
0
2
4
6
sc-MedPDSI sc-PDSI
Viseu(humid)
-6
-4
-2
0
2
4
6
MedPDSI PDSI
Bragança(drysub-humid)
-6
-4
-2
0
2
4
6
sc-MedPDSI sc-PDSI
Bragança(drysub-humid)
-6
-4
-2
0
2
4
6
MedPDSI PDSI
Elvas(semi-arid)
-6
-4
-2
0
2
4
6
sc-MedPDSI sc-PDSI
Elvas(semi-arid)
European Water 60 (2017) 201
Table 1. Average frequency (%) of drought/wet classes
Class MedPDSI PDSI sc-MedPDSI sc-PDSI Average of all locations Dry Extreme 1.5 2.8 2.0 2.2 Severe 5.5 5.4 6.6 4.4 Moderate 13.6 11.8 11.7 10.2 Mild 37.9 37.2 29.6 33.5 Wet Mild 22.8 23.1 29.7 29.2 Moderate 10.7 11.2 11.6 11.7 Severe 5.4 5.8 6.6 6.9 Extreme 2.6 2.6 2.3 2.0 Average of the humid locations Dry Extreme 0.5 0.8 1.9 3.3 Severe 3.3 5.4 8.0 6.4 Moderate 14.8 12.2 12.1 10.6 Mild 41.6 40.0 27.6 30.3 Wet Mild 24.5 24.6 31.9 31.8 Moderate 8.5 10.2 10.8 10.4 Severe 4.4 4.6 5.1 5.2 Extreme 2.4 2.2 2.5 2.0 Average of the semi-arid locations Dry Extreme 2.0 3.9 1.9 1.8 Severe 7.0 6.3 6.3 3.1 Moderate 13.7 11.1 10.8 9.3 Mild 35.1 34.6 29.6 34.8 Wet Mild 21.9 23.9 29.5 29.6 Moderate 11.3 11.1 12.3 12.3 Severe 5.9 6.1 7.2 7.0 Extreme 3.1 3.0 2.4 2.0
ACKNOWLEDGEMENTS
Authors acknowledge the support of FCT, Lisbon, through the PhD grant SFRH/BD/92880/2013 to the second author, the post-doc grant SFRH/BPD/102478/2014 to the fourth author, and the grant attributed to research unit LEAF (UID/AGR/04129/2013).
REFERENCES
Allen, R. G., Pereira, L. S., 2009. Estimating crop coefficients from fraction of ground cover and height. Irrig. Sci., 28, 17-34. Allen, R. G., Pereira, L. S., Raes, D., Smith, M., 1998. Crop Evapotranspiration. Guidelines for Computing Crop Water
Requirements. FAO Irrigation and Drainage Paper No. 56, FAO, Rome, 300p. Alley, W. M., 1984. The Palmer Drought Severity Index: limitations and assumptions. J. Climate Appl. Meteorol. 23:1100-1109. Cammalleri, C., Rallo, G., Agnese, C., Ciraolo, G., Minacapilli, M., Provenzano, G., 2013. Combined use of eddy covariance and sap
flow techniques for partition of ET fluxes and water stress assessment in an irrigated olive orchard. Agric. Water Manage., 120, 89– 97.
Dai, A., 2011. Characteristics and trends in various forms of the Palmer Drought Severity Index during 1900–2008. Journal of Geophysical Research, 116, D12115, doi:10.1029/2010JD015541, 2011
Doorenbos, J., Pruitt, W. O., 1977. Crop Water Requirements. Irrigation and Drainage Paper No. 24, FAO, Rome, Italy, 197p. Paço, T. A., Pôças, I., Cunha, M., Silvestre, J. C., Santos, F. L., Paredes, P., Pereira, L. S., 2014. Evapotranspiration and crop
coefficients for a super intensive olive orchard. An application of SIMDualKc and METRIC models using ground and satellite observations. J. Hydrol. 519, 2067–2080.
Palmer, W., 1965. Meteorological Drought. U.S. Weather Bureau, Res. Paper No. 45, Washington. Paulo, A. A., Rosa, R. D., Pereira, L. S., 2012. Climate trends and behaviour of drought indices based on precipitation and
evapotranspiration in Portugal. Nat. Hazards Earth Syst. Sci., 12, 1481–1491. Pereira, L. S., Rosa, R. D., Paulo, A. A., 2007. Testing a modification of the Palmer Drought Severity Index for Mediterranean
environments. In: G. Rossi, T. Vega, B. Bonaccorso (eds.) Methods and Tools for Drought Analysis and Management. Springer, Dordrecht, pp. 149-167.
Rosa, R. D., Paredes, P., Rodrigues, G.C., Alves, I., Fernando, R. M., Pereira, L. S., Allen, R. G., 2012. Implementing the dual crop coefficient approach in interactive software. 1. Background and computational strategy. Agric. Water Manage. 103, 8–24.
Wells, W., Goddard, S., Hayes, M., 2004. A self-calibrating Palmer Drought Severity Index. J. Climate 17, 2335-2351.