MODIS LAI/FPAR Team Response to BigFoot Validation Results Y. Knyazikhin 1 , M. Zhao 2 , R. Nemani 2 , J. L. Privette 3 , N. Shabanov 1 , R. B. Myneni 1 , and S.W. Running 2 1 Department of Geography, Boston University 675 Commonwealth Avenue, Boston, MA 022150 E-mails: [email protected]; [email protected]; [email protected]2 The School of Forestry, University of Montana, Missoula, MT 59812 E-mails: [email protected]; [email protected]3 NASA's Goddard Space Flight Center E-mail: [email protected]Distribution: W. Cohen, D. Wickland and C. Justice April 16, 2002
Transcript
MODIS LAI/FPAR Team Response to BigFoot Validation Results
Y. Knyazikhin 1, M. Zhao2, R. Nemani2, J. L. Privette3, N. Shabanov1,R. B. Myneni1, and S.W. Running2
1Department of Geography, Boston University675 Commonwealth Avenue, Boston, MA 022150
Distribution: W. Cohen, D. Wickland and C. Justice
April 16, 2002
2
This document was prepared by the MODIS LAI/FPAR team as a response to BigFoot's results
of MODIS LAI/FPAR product being presented to the community and circulated, without
appropriate caveats as to the validity of the analysis.
The MODIS LAI and FPAR team has invested considerable resources in the validation of the
product. These efforts are ongoing. Some of these are described in five research articles, which
are at various stages of publication in peer-refereed journals (see the list at the end). These
articles and the results presented here are more reflective of the current validation status of the
MODIS LAI/FPAR products. Our experience from these exhaustive and comprehensive efforts
is, the MODIS LAI/FPAR products are of excellent research quality.
The analysis presented by BigFoot as validation of MODIS LAI/FPAR product is a good first
step, in that, it identifies the difficulties of validating moderate resolution satellite data products.
Clearly that analysis is very preliminary and warrants no conclusions about the MODIS
LAI/FPAR product. We have encountered similar difficulties during the earliest development
stages of our validation strategy. Our progress in understanding of the problem of validating
moderate resolution satellite data products is discussed below.
We hope that BigFoot will appreciate the resources spent on preparing this document. We also
suggest that they carefully read our five validation papers, as there is much material which can
aid their analysis. We also suggest that they become familiar with the details of the algorithm
physics, as described in several published articles, which may be accessed from our and MODIS
web sites.
3
The MOD15 LAI/FPAR algorithm uses the 1 km Surface Reflectance Product and 1 km Land
Cover Map to produce LAI and FPAR fields at 1 km resolution. Three random variables impact
the retrievals. They are (a) uncertainties in surface reflectance product (e.g., due to correction for
atmosphere and other environmental effects); (b) uncertainties in landcover identification (e.g.,
due to biome mixture within 1 km pixel), and (c) uncertainties in georegistration. The predicted
LAI value in one pixel, therefore, should be treated as an observation of a random variable and
thus an averaging over a homogeneous area is required to reduce variations due to uncertainties.
In light of the uncertainties, and the sensitivity/insensitivity of surface reflectances to LAI, there
may be multiple acceptable values of parameters which will give the observed reflectances, and
the best one can do is to estimate the most probable value of LAI. The algorithm, therefore, does
not guarantee an accurate value in one pixel. It was designed to provide the distribution of
LAI/FPAR values as if they were derived from ground based measurements (see MOD15
ATBD). Therefore, statistical techniques which allow to compare TWO random variables, field-
measured and satellite-derived LAIs, should be applied to validate the MODIS LAI/FPAR
product. It also means that with a high probability, a pixel by pixel comparison will result in poor
correlation between field-measured and satellite-derived LAIs because such an approach
compares two observations of a random variable. Information on the uncertainties in
georegistration, correction for atmosphere effects, and biome identification are also required to
perform an accurate statistical analysis of retrieved and measured LAI random fields. Examples
which illustrate this statement are discussed below.
4
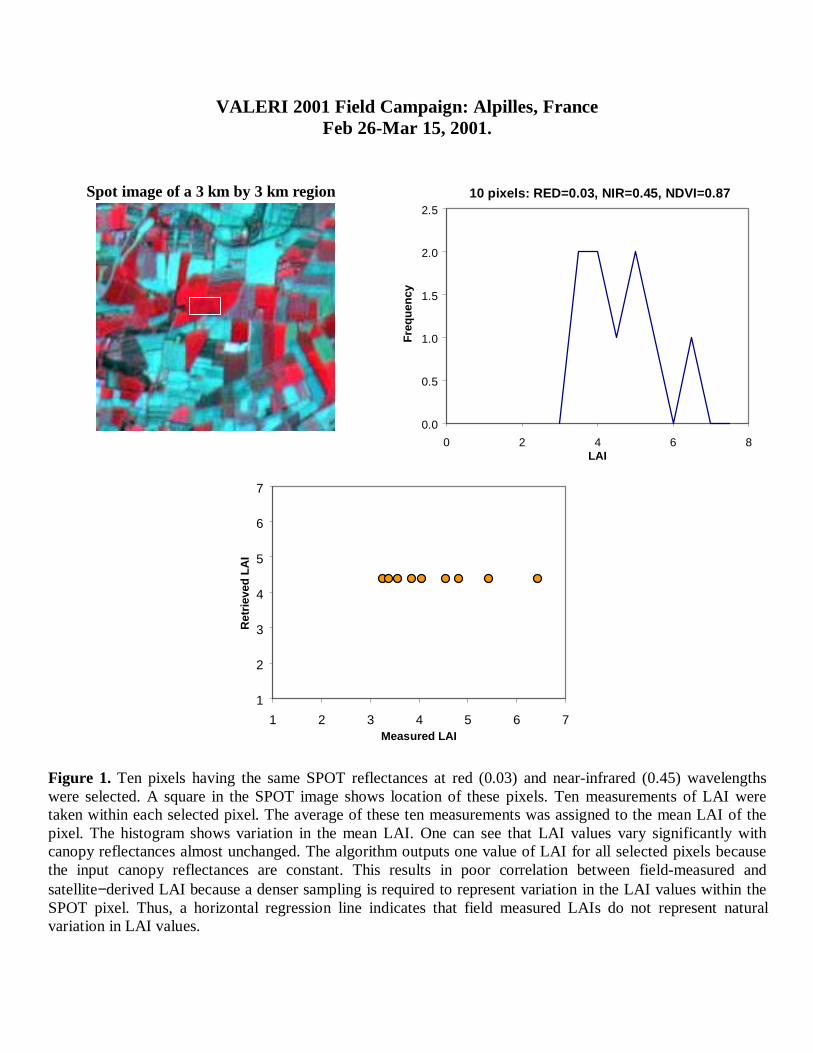
[1] The panels in Figure 1 illustrates why a pixel-by-pixel correlation can lead to a horizontal
line, as it shown in the plot demonstrating the correspondence between BigFoot 2000 LAI and
V003 MODIS maps for 2001 growing season. The explanation is the following.
First, the data used: a 30 m resolution Spot image; field-measured LAI collected during the
VALERI 2001 Field Campaign, Alpilles, France, Feb 26-Mar 15, 2001. Ten pixels having the
same SPOT reflectances at red (0.03) and near-infrared (0.45) wavelengths were selected. A
square in the SPOT image shows location of these pixels. Ten measurements of LAI were taken
within each selected pixel. The average of these ten measurements was assigned to the mean LAI
of the pixel. The histogram shows variation in the mean LAI. One can see that LAI values vary
significantly with canopy reflectances almost unchanged. The algorithm outputs one value of
LAI for all selected pixels because the input canopy reflectances are constant. This results in
poor correlation between field-measured and satellite−derived LAI because a denser sampling is
required to represent variation in the LAI values within the SPOT pixel. Thus, a horizontal
regression line indicates that field measured LAIs do not represent natural variation in LAI
values. The horizontal line appeared in the correspondence between BigFoot 2000 LAI and v003
MODIS maps for 2001 growing season may suggest that BigFoot 2000LAI do not represent
variation in LAI values within 1 km MODIS pixel. In other words, BigFoot 2000 LAI vary
significantly (between 3 and 5) with the MODIS surface reflectances, input to the algorithm,
almost unchanged. Therefore, an analysis of 1 km surface reflectances should be followed by the
creation of such a correlation plot.
5
[2] (a) Correspondence between BigFoot 2000 LAI and v002 MODIS maps for 2000 growing
season. Pixels produced by the back-up algorithm under mixed cloud conditions were selected in
this example (QC=99). It should be noted that the LAI/FPAR algorithm processes pixel
irrespective of cloud state. The back-up algorithm uses NDVI-LAI relationship to retrieve LAI
values and thus is insensitive to uncertainties in input data. The main algorithm performs an
analysis of input data and returns a LAI value only if uncertainties in input data do not exceed a
certain threshold value. QC=99 indicates that the main algorithm failed to retrieve LAI values
because input data were corrupted due clouds (cloud_state=10: "mixed cloud present") and back-
up algorithm was triggered to produce LAI values. Therefore, unreliable retrievals were selected
for validation purposes.
(b) LAI histograms for the 5x5 km area (25 pixels) derived from the BigFoot data (shaded
contour) and MODIS retrieval (black line). For validation purposes, we used values produced by
the main algorithm only and maximized the number of unsaturated pixels. According to these
criteria, the composite for days 241-248 (August 28-September 4, 2000) was selected, where 5 of
the 25 pixels were unsaturated. It should be emphasized that a pixel-by-pixel comparison can not
be performed for reasons mentioned above. A histogram of LAI values derived from ETM+ data
is shown as a red line.
[3] The pixel-by-pixel comparison results in poor correlation between field-measured and
satellite-derived LAI due to uncertainties in georegistration, correction for atmosphere effects,
and biome identification. Typically, the R2 values reported in literature (Wang, 2002b) vary
between 0.38 and 0.66. To validate the algorithm, it is essential to identify multi-pixel patches in
6
the image data. It was found that patch level comparison can dramatically improve the
correlation between field measurements and satellite derived parameters because this reduces the
above mentioned uncertainties. To validate the algorithm, it is essential to identify multi-pixel
patches in the image data. Figures 3 demonstrates a patch level based approach to derive
uncertainties in coarse resolution satellite products (Tian et al., 2002a and 2002b).
Explanation: Data collected during the SAFARI 2000 wet season field campaign and ETM+ and
IKONOS images are used. Validation site: Maun, Botswana. (a) Color RGB image from ETM+
Bands 4, 3, and 2 of a 1km by 1 km region of the Maun site. Symbol "+" represents sampling
points. Note that LAI values have high variation over short distances. (b) Map of the same region
using a segmentation procedure which groups pixels into patches based on their spectral
similarity and adjacency. Patches 3, 5 6, 10, 11, and 14 are shrubs. Patches 1, 2, 4, 7, 8, 9, 12, 13
and 15 are savannas. (c) The MODIS LAI/FPAR algorithm was applied to produce a fine
resolution LAI map. Mean LAI over patches derived from field measurements and ETM data are
shown in this plot.
[4] The patch based comparison method to scale ground-based point measurements to the spatial
scale of satellite observations was applied to validate the MODIS LAI retrievals for a coniferous
forest using data from a field campaign in Roukolahti, Finland, June 14th and June 21st, 2000
(Wang, 2002b). This is illustrated in Figure 4.
Explanation: Data collected during the Roukolahti field campaign, ETM and SSD images are
used. (a) Color RGB image from ETM+ Bands 4, 3, and 2 of a 1km by 1 km region of the
7
Ruokolahti site. (b) Map of the same region using a segmentation procedure which groups pixels
into patches based on their spectral similarity and adjacency. (c) Correlation between simple
ratio and field measured LAI at pixel level; (d) Correlation between simple ratio and field
measured LAI at patch scale. (e) a 30 m resolution LAI map of a 10x10 km region derived from
the ETM + data image using reduced simple ratio. (f) Contour plot of 1 km resolution LAI map
aggregated from the fine resolution RTM+ LAI map. (g) MODIS pixels in the 10x10 km area.
Green: LAI value produced by the main algorithm; Red: LAI is produced by the backup
algorithm; Blue: cloud contaminated pixel; Black: water or barren. (h) Histograms of LAI values
for the 10x10 km area obtained from aggregated ETM+ LAI and the MODIS LAI fields. A t-test
(p=0.83) shows that mean values of these histograms are not significantly different. (i) Patch
level correlation between the MODIS and aggregated LAI values.
[5] Temporal variation in LAI of one selected pixel may miss phenology. This is illustrated in
Figure 5. Data collected during the SAFARI 2000 wet season field campaign. Validation site:
Mongu, South Africa. A MODIS pixel at the center of the Mongu site was selected. (a) Temporal
variation in the MODIS FPAR for the selected pixel. The MODIS FPAR for one pixel does not
show the seasonal trend. (b) Temporal variation in mean MODIS FPAR over a 200x200 km area
(red line) and temporal variation in FPAR of the selected MODIS pixel (black line). (c)
Temporal variation in mean MODIS LAI over a 200x200 km area (red line) and temporal
variation in LAI of the selected MODIS pixel (black line). One can see that the mean MODIS
FPAR and LAI values clearly show the seasonal trends. Predicted FPAR and LAI values in one
pixel vary around the mean FPAR. A predicted value in one pixel should be treated as an
8
observation of a random variable. Averaging over a homogeneous area is required to reduce
variations due to uncertainties.
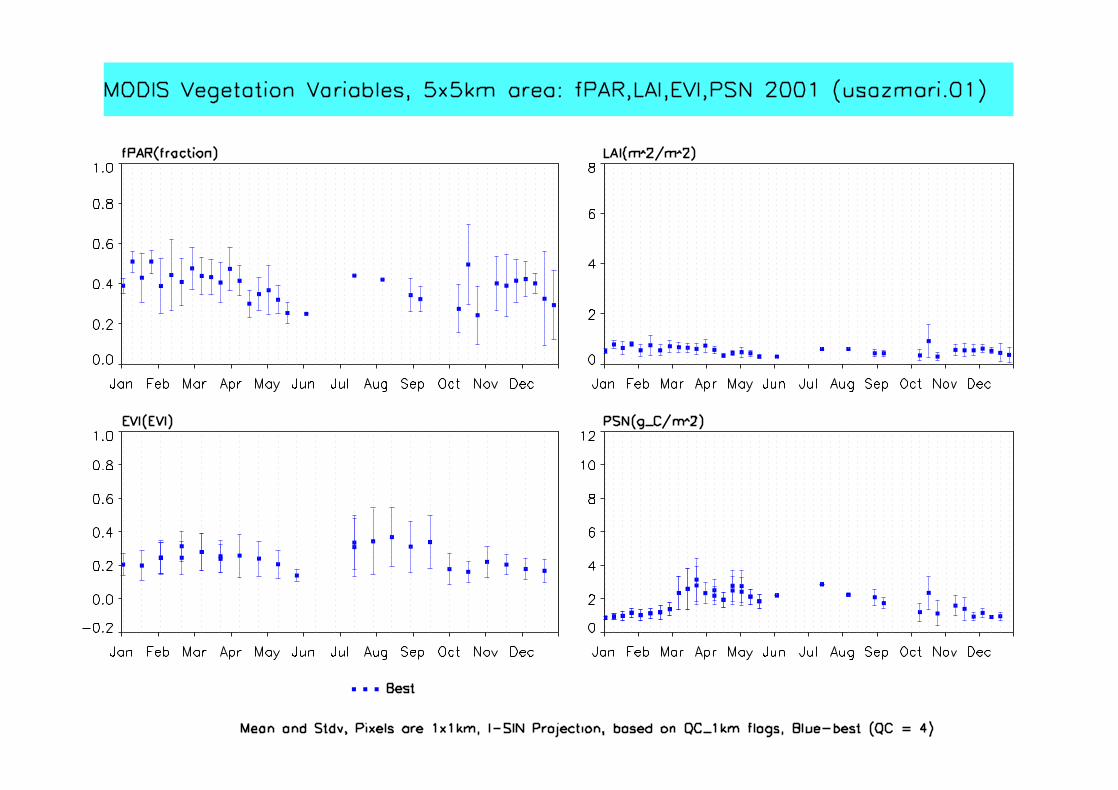
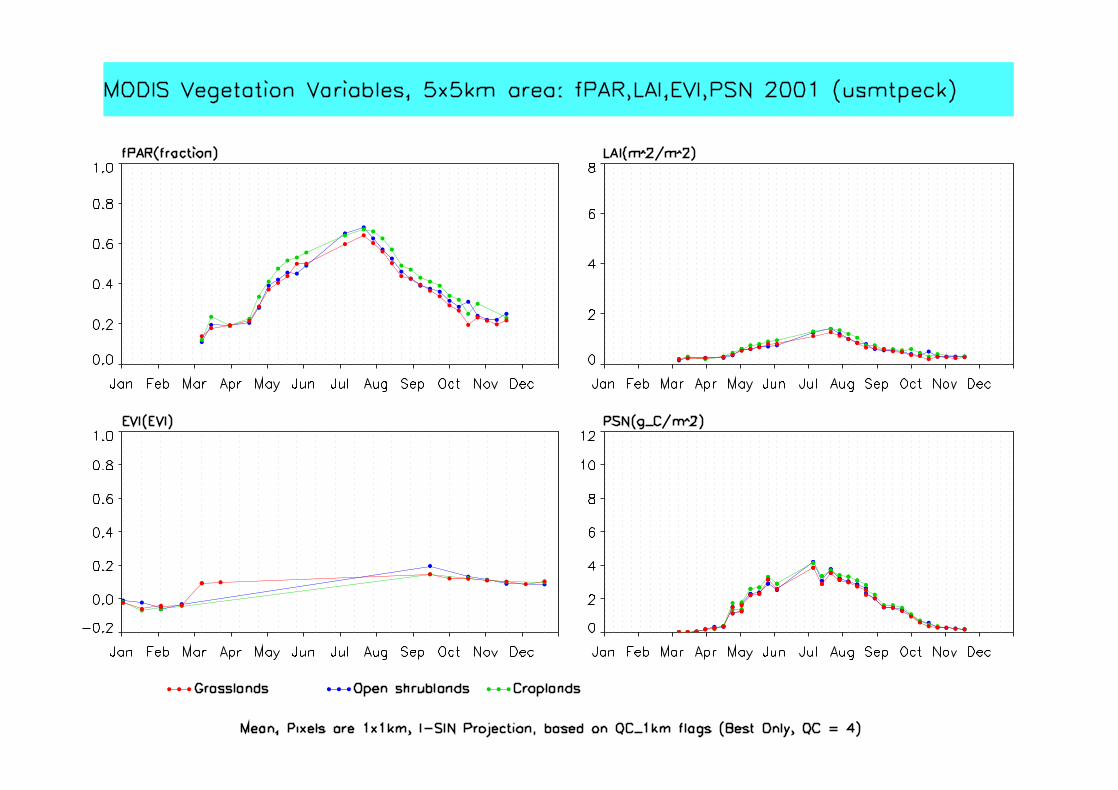
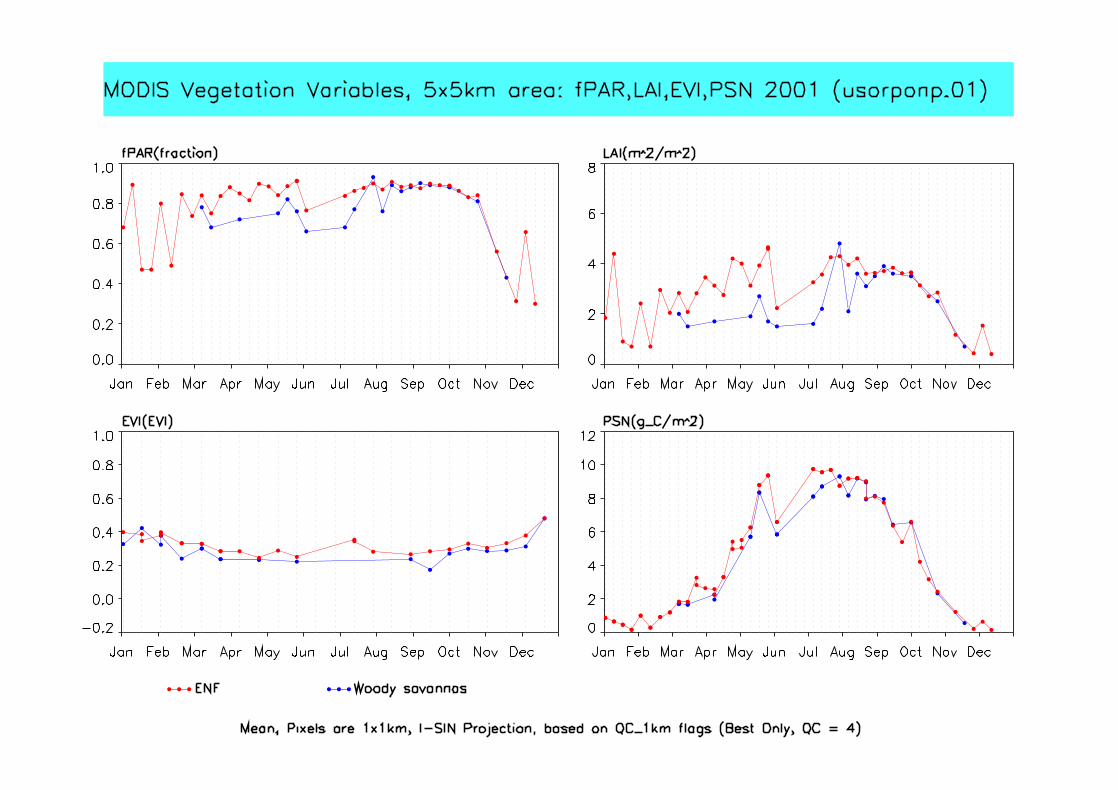
[6] Flux tower sites (Figure 6) measure a number of ecological variables (leaf area index,
biomass and NPP) besides carbon/water and energy fluxes, therefore provide a good opportunity
to test MODIS products. MODIS data are being extracted regularly over these sites. We used
2001 MODIS data extracted over these sites to verify the magnitudes and seasonality of a
number of MODIS products. All the plots following Figure 6 show mean and standard deviation
of a 5x5 grid centered around the tower. Each point represents a 8 day period during the year
2001. The LAI/FPAR data are from the main algorithm only (QC=4). Temporal variation in EVI
are also shown. The plots of PSN represent 8 day net photosynthesis computed from the MOD17
algorithm. MOD17 combines LAI/FPAR products with daily weather data (incident radiation,
temperature and humidity) from the NASA/Data Assimilation Office. One can see that the
MODIS LAI/FPAR product shows seasonality. However, in some cases, values of LAI are
overestimated. This problem is currently under investigation, and we have preliminary indication
that collection 3 MODIS surface reflectance product has some important differences with the
collection 2 product.
[7] Sampling Strategies: The development of appropriate ground based validation techniques is
critical to assessing uncertainties in the MODIS LAI/FPAR product. For instance, using a
hierarchical scene model, we divided LAI and NDVI images from Maun (Botswana), Harvard
Forest (USA) and Ruokulahti Forest (Finland) into individual scale images of classes, regions
and pixels (Tian et al., 2002a and b). Isolating the effects associated with different landscape
9
scales through decomposition of semivariograms not only showed the relative contribution of
different characteristic scales to the overall variation, but also displayed the spatial structure of
the different scales within a scene. We found that (1) patterns of variance at the class, region, and
pixel scale at these sites are different with respect to the dominance in order of the three levels of
landscape organization within a scene; (2) the spatial structure of LAI showed similarity across
the three sites, that is, ranges of semivariograms from scale of pixel, region and class are less
than 1000 m. (3) validation needs to be performed over smaller regions or patches, with more
field measurements and at smaller intervals; (4) the spatial structure of the NDVI is not the same
as that of LAI; and (5) the absolute magnitudes of variance vary significantly across the three
sites.
Knowledge gained from these analyses aided us in formulation of sampling strategies for
validation of MODIS LAI and FPAR fields. For a homogeneous (within class) site, where the
scales of class and region account for most of the spatial variation, a sampling strategy should
focus more on using accurate land cover maps and selection of regions. However, for a
heterogeneous (within class) site, accurate point measurements and GPS readings are needed.
For field validation of LAI, due to the fine resolution of LAI-2000 measurement and
georegistration accuracy, it is difficult to quantify the relation between field measurements and
30 m resolution satellite retrieval. One should either increase the number of point measurements
at 30 m resolution, or use a region-by-region comparison for validation of heterogeneous sites.
These constraints imply that for validation activity, selecting the sample scale on the basis of the
underlying spatial structure of the landscape (as understood through hierarchical decomposition
10
of semivariograms) is necessary and in general, patches are better than individual pixels unless
sample and registration accuracy are outstanding.
BigFoot needs to do similar studies at their validation sites to understand the spatial structure of
vegetation. Their sample strategy of one method fits all needs to be either re-evaluated or
buttressed with critical analysis.
[8] What exactly does the LAI-2000 measure? We addressed this question in Shabanov et al.
(2002). By introducing stochastic concepts of radiative transfer in to the equations of LAI-2000
we were able to develop a formalism that helps understand the measurements of LAI-2000. We
refer you to read this work carefully, and try to understand the physics of the measurement
before accepting the instrument's readings in faith.
References
Please access pdf files of these five articles from http://cybele.bu.edu/modismisr/validation/papers.html
Wang et al., 2002a. Hyperspectral remote sensing of vegetation canopy leaf area index and foliage opticalproperties, Remote Sens. Environ. (submitted Mar 2002).
Wang et al., 2002b. Validation of the MODIS LAI product in coniferous forests of Ruokolahti, Finland. RemoteSens. Environ. (in preparation; draft April 2002).
Shabanov et al., 2002. Validation of the radiative transfer principles of the MODIS LAI/FPAR algorithm with datafrom the Harvard forest, Remote Sens. Environ. (submitted Jan 2002).
Tian et al., 2002a. Multiscale Analysis and Validation of the MODIS LAI Product over Maun, Botswana. I.Uncertainty Assessment. Remote Sens. Environ. (accepted April 2002).
Tian et al., 2002b. Multiscale Analysis and Validation of the MODIS LAI Product over Maun, Botswana. II.Sampling Strategy. Remote Sens. Environ. (accepted April 2002).
VALERI 2001 Field Campaign: Alpilles, FranceFeb 26-Mar 15, 2001.
10 pixels: RED=0.03, NIR=0.45, NDVI=0.87
0.0
0.5
1.0
1.5
2.0
2.5
0 2 4 6 8LAI
Fre
quen
cy
1
2
3
4
5
6
7
1 2 3 4 5 6 7Measured LAI
Ret
rieve
d LA
I
Figure 1. Ten pixels having the same SPOT reflectances at red (0.03) and near-infrared (0.45) wavelengthswere selected. A square in the SPOT image shows location of these pixels. Ten measurements of LAI weretaken within each selected pixel. The average of these ten measurements was assigned to the mean LAI of thepixel. The histogram shows variation in the mean LAI. One can see that LAI values vary significantly withcanopy reflectances almost unchanged. The algorithm outputs one value of LAI for all selected pixels becausethe input canopy reflectances are constant. This results in poor correlation between field-measured andsatellite−derived LAI because a denser sampling is required to represent variation in the LAI values within theSPOT pixel. Thus, a horizontal regression line indicates that field measured LAIs do not represent naturalvariation in LAI values.
Spot image of a 3 km by 3 km region
(a) (b)
HARV 2000 LAI (m 2/m2)
3
4
5
6
7
3 4 5 6 7BigFoot, 4 August
MO
DIS
v00
2, 2
0 A
ugus
t
99
Figure 2. (a) Correspondence between BigFoot 2000 LAI and v002 MODIS maps for 2000 growing season.Pixels produced by the back-up algorithm under mixed cloud conditions were selected in this example(QC=99). (b) LAI histograms for the 5x5 km area (25 pixels) derived from the BigFoot data (shaded contour)and MODIS retrieval (black line). For validation purposes, we used values produced by the main algorithm onlyand maximized the number of unsaturated pixels. According to these criteria, the composite for days 241-248(August 28-September 4, 2000) was selected, where 5 of the 25 pixels were unsaturated. It should beemphasized that a pixel-by-pixel comparison can not be performed for reasons mentioned above. A histogramof LAI values derived from ETM+ data is shown as a red line.
SAFARI 2000 Wet Season Field campaign: Maun, BotswanaMar 3-Mar 18, 2000.
Figure 3. (a) Color RGB image from ETM+ Bands 4, 3, and 2 of a 1km by 1 km region of the Maun site.Symbol "+" represents sampling points. Note that LAI values have high variation over short distances. (b) Mapof the same region using a segmentation procedure which groups pixels into patches based on their spectralsimilarity and adjacency. Patches 3, 5 6, 10, 11, and 14 are shrubs. Patches 1, 2, 4, 7, 8, 9, 12, 13 and 15 aresavannas. (c) The MODIS LAI/FPAR algorithm was applied to produce a fine resolution LAI map. Mean LAIover patches derived from field measurements and ETM data are shown in this plot.
12
3
4
56 7
89
1011
12
1314 15
(a) (b)
(c)(c)
Field campaign in Ruokolahti, FinlandJune 14-June 21, 2000.
Figure 4. (a) Color RGB image from ETM+ Bands 4, 3, and 2 of a 1km by 1 km region of the Ruokolahti site.(b) Map of the same region using a segmentation procedure which groups pixels into patches based on theirspectral similarity and adjacency. (c) Correlation between simple ratio and field measured LAI at pixel level;(d) Correlation between simple ratio and field measured LAI at patch scale.
(a) (b)
(c) (d)
y = 1.0124x
R2 = 0.8508
y = 1.0594x - 0.0607
R2 = 0.8526
0
0.4
0.8
1.2
1.6
2
0 0.4 0.8 1.2 1.6 2
ETM LAI
MO
DIS
LA
I
0 21
0
0.1
0.2
0.3
0.4
0.5
0 1 2 3 4 5
LAI
Fre
quen
cy
ETM
MODIS
(i)(h)
(g)(f)(e)
Main algorithm
Back-up algorithm
Cloud contaminated pixel
Water/ barren
Figure 4 (cont). (e) a 30 m resolution LAI map of a10x10 km region derived from the ETM + data imageusing reduced simple ratio. (f) Contour plot of 1 kmresolution LAI map aggregated from the fineresolution RTM+ LAI map. (g) MODIS pixels in the10x10 km area. Green: LAI value produced by themain algorithm; Red: LAI is produced by the backupalgorithm; Blue: cloud contaminated pixel; Black:water or barren. (h) Histograms of LAI values for the10x10 km area obtained from aggregated ETM+ LAIand the MODIS LAI fields. A t-test (p=0.83) showsthat mean values of these histograms are notsignificantly different. (i) Patch level correlationbetween the MODIS and aggregated LAI values.
SAFARI 2000 Wet Season Field campaign: Mongu
(a) (b)
(c)
Figure 5. A MODIS pixel at the center of the Mongu site was selected. (a) Temporal variation in the MODISFPAR for the selected pixel. The MODIS FPAR for one pixel does not show the seasonal trend. (b) Temporalvariation in mean MODIS FPAR over a 200x200 km area (red line) and temporal variation in FPAR of theselected MODIS pixel (black line). (c) Temporal variation in mean MODIS LAI over a 200x200 km area (redline) and temporal variation in LAI of the selected MODIS pixel (black line). One can see that the meanMODIS FPAR and LAI values clearly show the seasonal trends. Predicted FPAR and LAI values in one pixelvary around the mean FPAR. A predicted value in one pixel should be treated as an observation of a randomvariable. Averaging over a homogeneous area is required to reduce variations due to uncertainties.
0
0.1
0.2
0.3
0.4
0.5
0.6
0.7
0.8
0 30 60 90 120 150 180 210 240 270 300 330 360
Day of Year (2000)
FP
AR
Figure 6. Flux tower sites. A number of ecological variables (leaf area index, biomass and NPP) besidescarbon/water and energy fluxes are measured at these sites. MODIS data are being extracted regularly overthese sites. 2001 MODIS data extracted over these sites were used to verify the magnitudes and seasonality of anumber of MODIS products. The following plots show mean and standard deviations of a 5x5 grid centeredaround the tower. Each point represents a 8 day period during the year 2001. The LAI/FPAR data are from themain algorithm only (QC=4). Temporal variation in EVI are also shown. The plots of PSN represent 8 day netphotosynthesis computed from the MOD17 algorithm. MOD17 combines LAI/FPAR products with dailyweather data (incident radiation, temperature and humidity) from the NASA/Data Assimilation Office. One cansee that the MODIS LAI/FPAR product shows seasonality. However, in some cases, values of LAI areoverestimated. This problem is currently under investigation, and we have preliminary indication that collection3 MODIS surface reflectance product has some important differences with the collection 2 product.