39
America Weighs in on the Current State of Tech September 2015 Tech Perceptions Survey

America Weighs in on the Current State of Tech
September 2015
Tech Perceptions Survey

SURVEY BACKGROUND
Background • Modis fielded a survey regarding behaviors, perceptions and attitudes tied to
technology, job satisfaction and other employment-focused themes.
Methodology • This survey was conducted by Allison+Partners on behalf of Modis, among a
nationally representative sample of 1,010 individuals in the United States over the age of 18, with panel services from Qualtrics.
2
++ +

KEY FINDINGS
3
THE U.S. IS A GLOBAL LEADER IN TECHNOLOGY:
• 60.9% of respondents agree with the statement ‘The U.S. is a global leader in the technology industry today.’ Respondents in the age group of 26 – 34 were most likely to agree with that statement (72%).
• Of respondents who agreed that the U.S. is a global technology leader, 79.1% felt that leadership will continue for the next five years. Additionally, 94% felt that technology education was important in maintaining the United States’ leadership in the technology industry.
• Among respondents who disagreed that the U.S. is a global technology leader, a lack of quality education was the reason most cited as contributing to the United States not being a global leader in the technology industry (56.5%), followed by a lack of government support of tech growth (39.3%) and a lack of financial investment in tech innovation (38.7%).
KEY FINDINGS
4
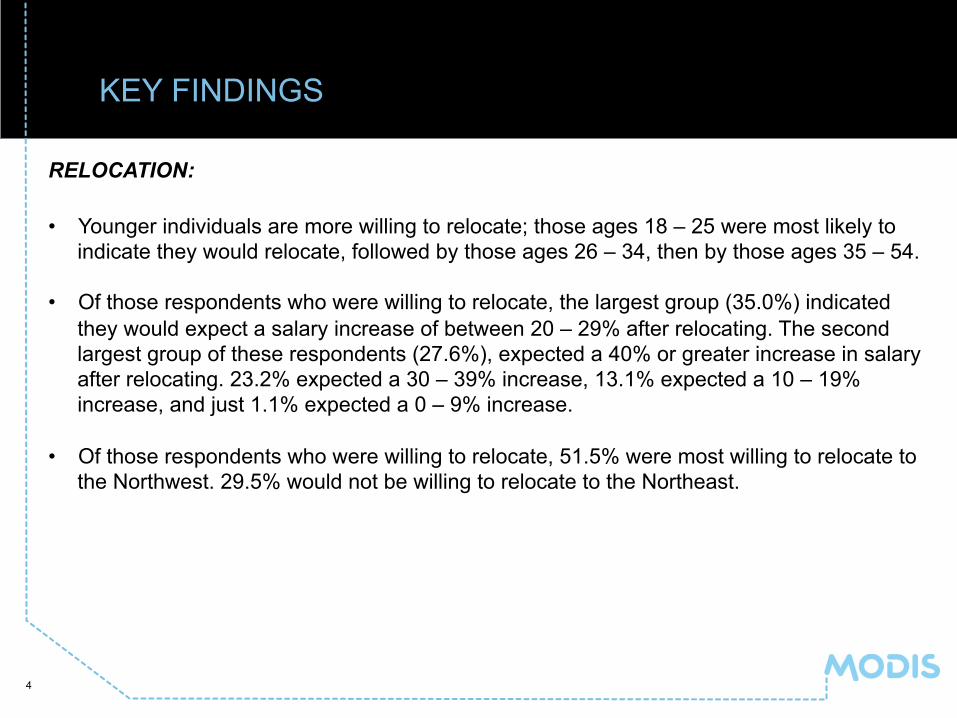
RELOCATION: • Younger individuals are more willing to relocate; those ages 18 – 25 were most likely to
indicate they would relocate, followed by those ages 26 – 34, then by those ages 35 – 54. • Of those respondents who were willing to relocate, the largest group (35.0%) indicated
they would expect a salary increase of between 20 – 29% after relocating. The second largest group of these respondents (27.6%), expected a 40% or greater increase in salary after relocating. 23.2% expected a 30 – 39% increase, 13.1% expected a 10 – 19% increase, and just 1.1% expected a 0 – 9% increase.
• Of those respondents who were willing to relocate, 51.5% were most willing to relocate to
the Northwest. 29.5% would not be willing to relocate to the Northeast.
KEY FINDINGS
5
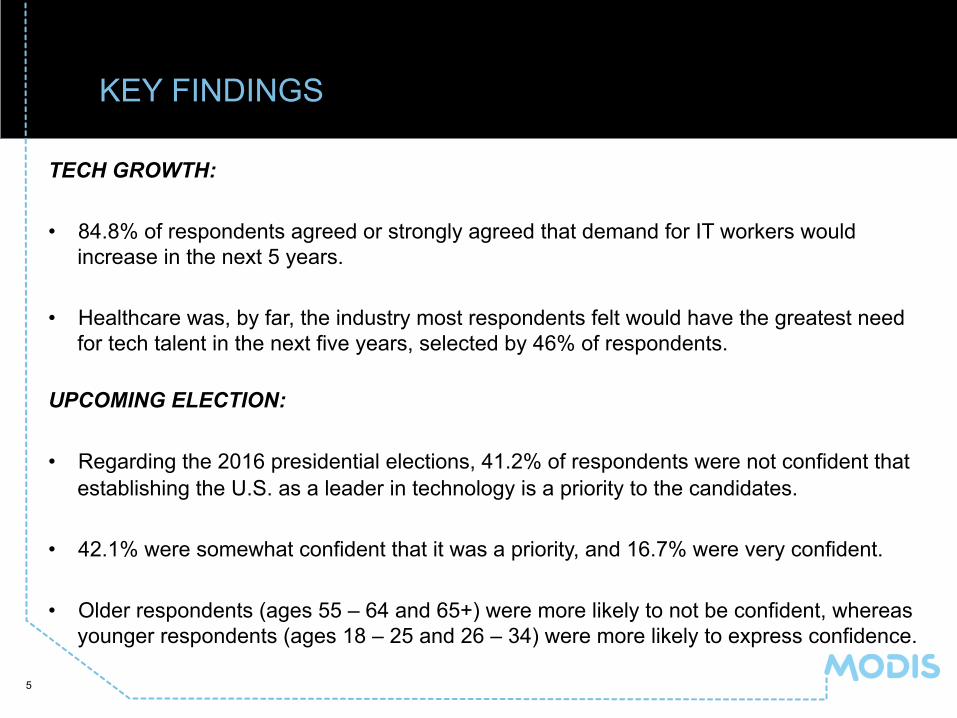
TECH GROWTH: • 84.8% of respondents agreed or strongly agreed that demand for IT workers would
increase in the next 5 years. • Healthcare was, by far, the industry most respondents felt would have the greatest need
for tech talent in the next five years, selected by 46% of respondents. UPCOMING ELECTION: • Regarding the 2016 presidential elections, 41.2% of respondents were not confident that
establishing the U.S. as a leader in technology is a priority to the candidates. • 42.1% were somewhat confident that it was a priority, and 16.7% were very confident. • Older respondents (ages 55 – 64 and 65+) were more likely to not be confident, whereas
younger respondents (ages 18 – 25 and 26 – 34) were more likely to express confidence.

TECH PERCEPTIONS SURVEY: US TECH LEADERSHIP
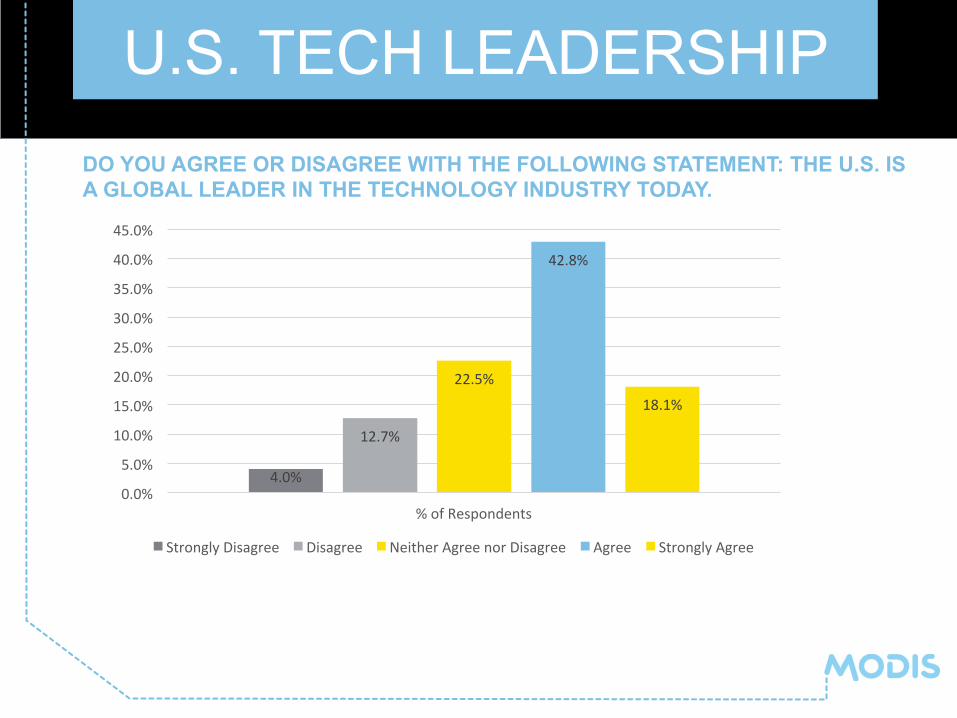
U.S. TECH LEADERSHIP DO YOU AGREE OR DISAGREE WITH THE FOLLOWING STATEMENT: THE U.S. IS A GLOBAL LEADER IN THE TECHNOLOGY INDUSTRY TODAY.
4.0%
12.7%
22.5%
42.8%
18.1%
0.0%
5.0%
10.0%
15.0%
20.0%
25.0%
30.0%
35.0%
40.0%
45.0%
% of Respondents
Strongly Disagree Disagree Neither Agree nor Disagree Agree Strongly Agree
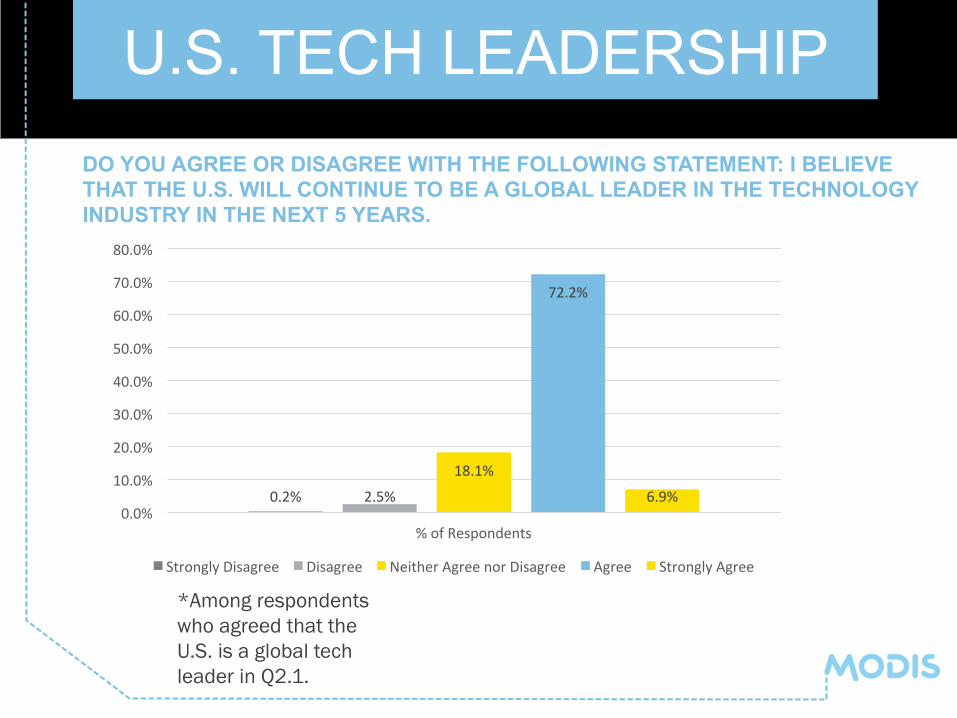
U.S. TECH LEADERSHIP DO YOU AGREE OR DISAGREE WITH THE FOLLOWING STATEMENT: I BELIEVE THAT THE U.S. WILL CONTINUE TO BE A GLOBAL LEADER IN THE TECHNOLOGY INDUSTRY IN THE NEXT 5 YEARS.
0.2% 2.5%
18.1%
72.2%
6.9% 0.0%
10.0%
20.0%
30.0%
40.0%
50.0%
60.0%
70.0%
80.0%
% of Respondents
Strongly Disagree Disagree Neither Agree nor Disagree Agree Strongly Agree
*Among respondents who agreed that the U.S. is a global tech leader in Q2.1.
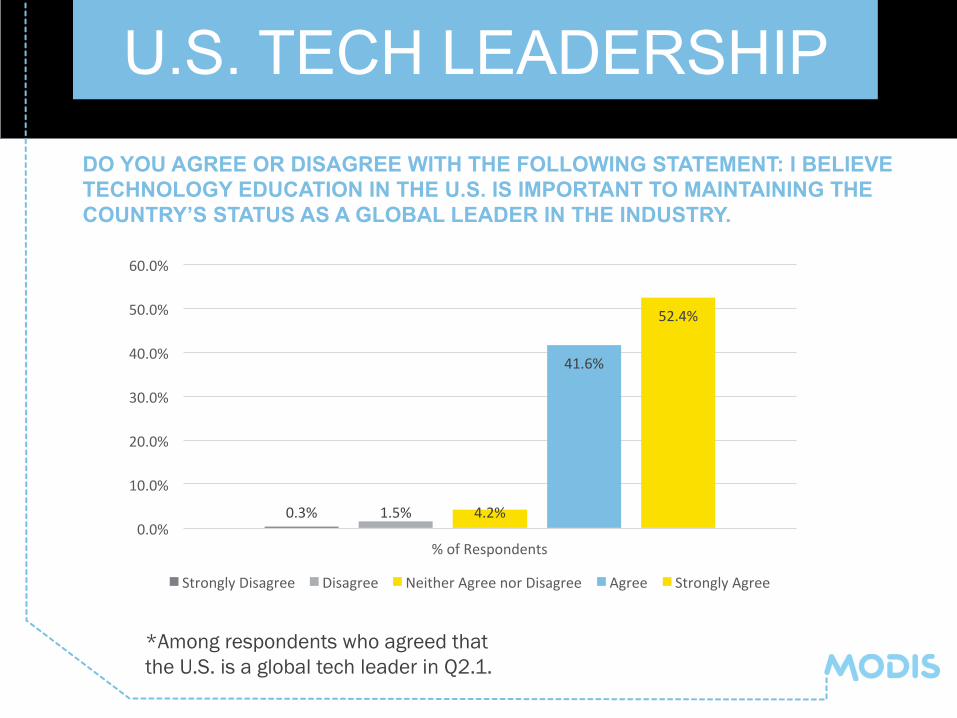
U.S. TECH LEADERSHIP DO YOU AGREE OR DISAGREE WITH THE FOLLOWING STATEMENT: I BELIEVE TECHNOLOGY EDUCATION IN THE U.S. IS IMPORTANT TO MAINTAINING THE COUNTRY’S STATUS AS A GLOBAL LEADER IN THE INDUSTRY.
0.3% 1.5% 4.2%
41.6%
52.4%
0.0%
10.0%
20.0%
30.0%
40.0%
50.0%
60.0%
% of Respondents
Strongly Disagree Disagree Neither Agree nor Disagree Agree Strongly Agree
*Among respondents who agreed that the U.S. is a global tech leader in Q2.1.
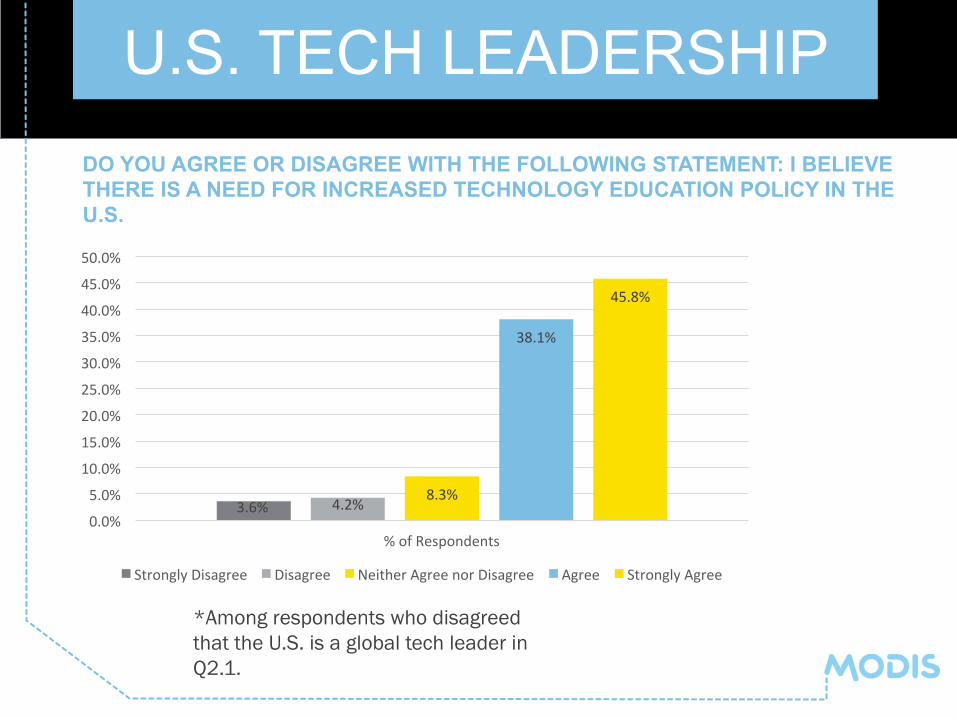
U.S. TECH LEADERSHIP DO YOU AGREE OR DISAGREE WITH THE FOLLOWING STATEMENT: I BELIEVE THERE IS A NEED FOR INCREASED TECHNOLOGY EDUCATION POLICY IN THE U.S.
3.6% 4.2% 8.3%
38.1%
45.8%
0.0%
5.0%
10.0%
15.0%
20.0%
25.0%
30.0%
35.0%
40.0%
45.0%
50.0%
% of Respondents
Strongly Disagree Disagree Neither Agree nor Disagree Agree Strongly Agree
*Among respondents who disagreed that the U.S. is a global tech leader in Q2.1.
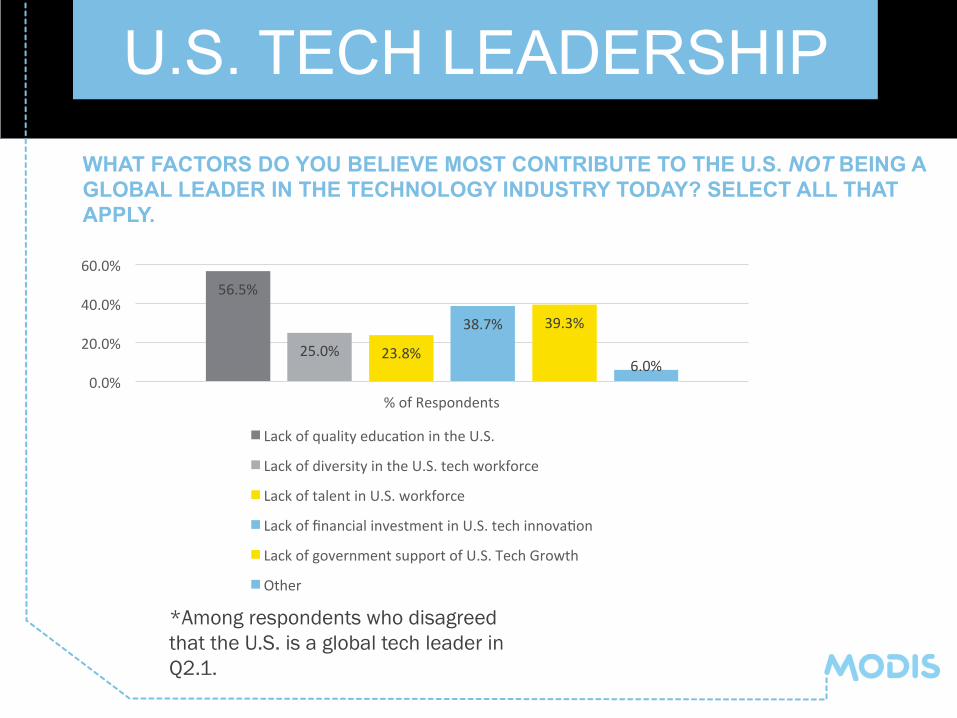
U.S. TECH LEADERSHIP WHAT FACTORS DO YOU BELIEVE MOST CONTRIBUTE TO THE U.S. NOT BEING A GLOBAL LEADER IN THE TECHNOLOGY INDUSTRY TODAY? SELECT ALL THAT APPLY.
56.5%
25.0% 23.8%
38.7% 39.3%
6.0% 0.0%
20.0%
40.0%
60.0%
% of Respondents
Lack of quality educaGon in the U.S.
Lack of diversity in the U.S. tech workforce
Lack of talent in U.S. workforce
Lack of financial investment in U.S. tech innovaGon
Lack of government support of U.S. Tech Growth
Other
*Among respondents who disagreed that the U.S. is a global tech leader in Q2.1.
TECH PERCEPTIONS SURVEY: TECH JOBS

TECH JOBS DO YOU AGREE OR DISAGREE WITH THE FOLLOWING STATEMENT: THE DEMAND FOR TECH PROFESSIONALS IN THE U.S. WILL GROW OVER THE NEXT FIVE YEARS.
2.8% 1.5% 10.6%
46.3%
38.8%
0.0%
5.0%
10.0%
15.0%
20.0%
25.0%
30.0%
35.0%
40.0%
45.0%
50.0%
% of Respondents
Strongly Disagree Disagree Neither Agree nor Disagree Agree Strongly Agree

TECH JOBS DO YOU AGREE OR DISAGREE WITH THE FOLLOWING STATEMENT: TECH JOBS IN THE U.S. ARE LUCRATIVE COMPARED TO JOBS IN OTHER FIELDS.
0.9% 3.5%
22.1%
48.9%
24.7%
0.0%
10.0%
20.0%
30.0%
40.0%
50.0%
60.0%
% of Respondents
Strongly Disagree Disagree Neither Agree nor Disagree Agree Strongly Agree

TECH JOBS DO YOU AGREE OR DISAGREE WITH THE FOLLOWING STATEMENT: SILICON VALLEY IS THE ONLY PLACE IN THE U.S. WITH LUCRATIVE JOBS IN TECHNOLOGY.
15.9%
43.8%
28.6%
7.6% 4.1% 0.0%
5.0%
10.0%
15.0%
20.0%
25.0%
30.0%
35.0%
40.0%
45.0%
50.0%
% of Respondents
Strongly Disagree Disagree Neither Agree nor Disagree Agree Strongly Agree
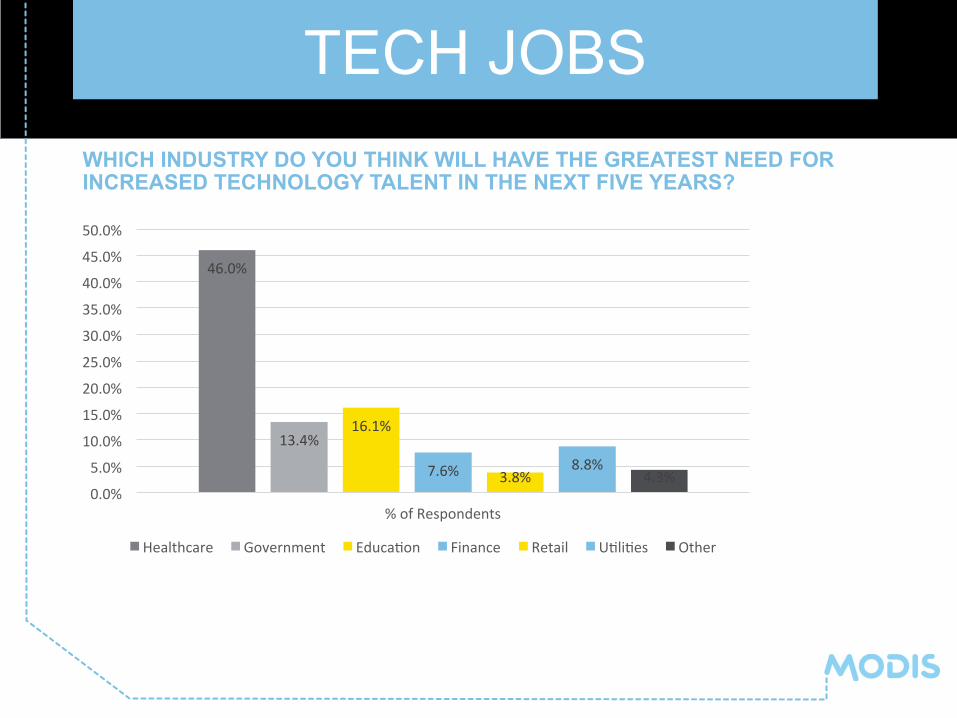
WHICH INDUSTRY DO YOU THINK WILL HAVE THE GREATEST NEED FOR INCREASED TECHNOLOGY TALENT IN THE NEXT FIVE YEARS?
46.0%
13.4% 16.1%
7.6% 3.8% 8.8%
4.3% 0.0%
5.0%
10.0%
15.0%
20.0%
25.0%
30.0%
35.0%
40.0%
45.0%
50.0%
% of Respondents
Healthcare Government EducaGon Finance Retail UGliGes Other
TECH JOBS
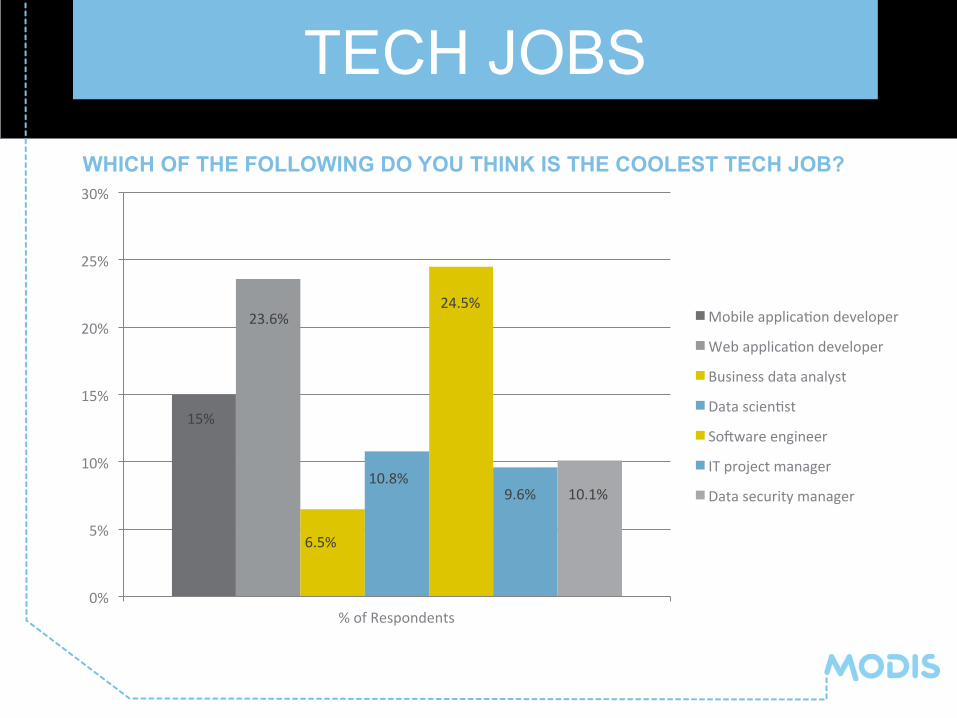
TECH JOBS WHICH OF THE FOLLOWING DO YOU THINK IS THE COOLEST TECH JOB?
0%
5%
10%
15%
20%
25%
30%
% of Respondents
Mobile applicaGon developer
Web applicaGon developer
Business data analyst
Data scienGst
SoWware engineer
IT project manager
Data security manager
15%
23.6%
6.5%
10.8%
24.5%
9.6% 10.1%

TECH PERCEPTIONS SURVEY: RELOCATION

RELOCATION WOULD YOU BE WILLING TO RELOCATE WITHIN THE U.S. FOR A POSITION WITH A HIGHER SALARY?
61.4%
38.6%
0.0%
10.0%
20.0%
30.0%
40.0%
50.0%
60.0%
70.0%
% of Respondents
Yes No

RELOCATION WHAT SALARY INCREASE WOULD YOU EXPECT AFTER AGREEING TO RELOCATE?
1.1%
13.1%
35.0%
23.2%
27.6%
0.0%
5.0%
10.0%
15.0%
20.0%
25.0%
30.0%
35.0%
40.0%
% of Respondents
0 -‐ 9% 10 -‐ 19% 20 -‐ 29% 30 -‐ 39% 40% or greater
*Among respondents who said yes to Q4.1

RELOCATION WHAT U.S. REGION WOULD YOU BE WILLING TO RELOCATE TO? CHOOSE ALL THAT APPLY.
40.0%
46.8% 44.7%
51.5%
45.0% 48.4%
0.0%
10.0%
20.0%
30.0%
40.0%
50.0%
60.0%
% of Respondents
Mid-‐AtlanGc Mid-‐West Northeast Northwest Southeast Southwest
*Among respondents who said yes to Q4.1

RELOCATION WHAT U.S. REGION WOULD YOU NOT BE WILLING TO RELOCATE TO, EVEN WITH A SUBSTANTIAL SALARY INCREASE? SELECT ALL THAT APPLY.
18.9%
26.0%
29.5%
15.3%
27.7%
21.5%
0.0%
5.0%
10.0%
15.0%
20.0%
25.0%
30.0%
35.0%
% of Respondents
Mid-‐AtlanGc Mid-‐West Northeast Northwest Southeast Southwest
*Among respondents who said yes to Q4.1

TECH PERCEPTIONS SURVEY: COMPENSATION & BENEFITS

COMPENSATION DO YOU FEEL THAT YOUR EMPLOYER PAYS YOU APPROPRIATELY FOR YOUR LEVEL OF EXPERIENCE?
35.8% 37.1%
27.0%
0.0%
5.0%
10.0%
15.0%
20.0%
25.0%
30.0%
35.0%
40.0%
% of Respondents
Yes No Don't Know

BENEFITS WHAT BENEFIT WOULD APPEAL MOST TO YOU IN A JOB?
8.2%
50.1%
1.9% 5.1% 4.0% 5.7%
21.0%
4.0% 0.0%
10.0%
20.0%
30.0%
40.0%
50.0%
60.0%
% of Respondents
Paid, long-‐term maternity/paternity leave Flex-‐hours
On-‐site dry cleaning Unlimited on-‐site food
On-‐site gym/fitness classes On-‐site childcare
Unlimited vacaGon Gme SabbaGcals

TECH PERCEPTIONS SURVEY: OTHER KEY FINDINGS

PRIVACY HOW CONFIDENT DO YOU FEEL IN YOUR EMPLOYER’S ABILITY TO SECURE YOUR PERSONAL INFORMATION AND KEEP IT CONFIDENTIAL?
29.2%
48.0%
22.8%
0.0%
10.0%
20.0%
30.0%
40.0%
50.0%
60.0%
% of Respondents
Very Confident Somewhat Confident Not Confident
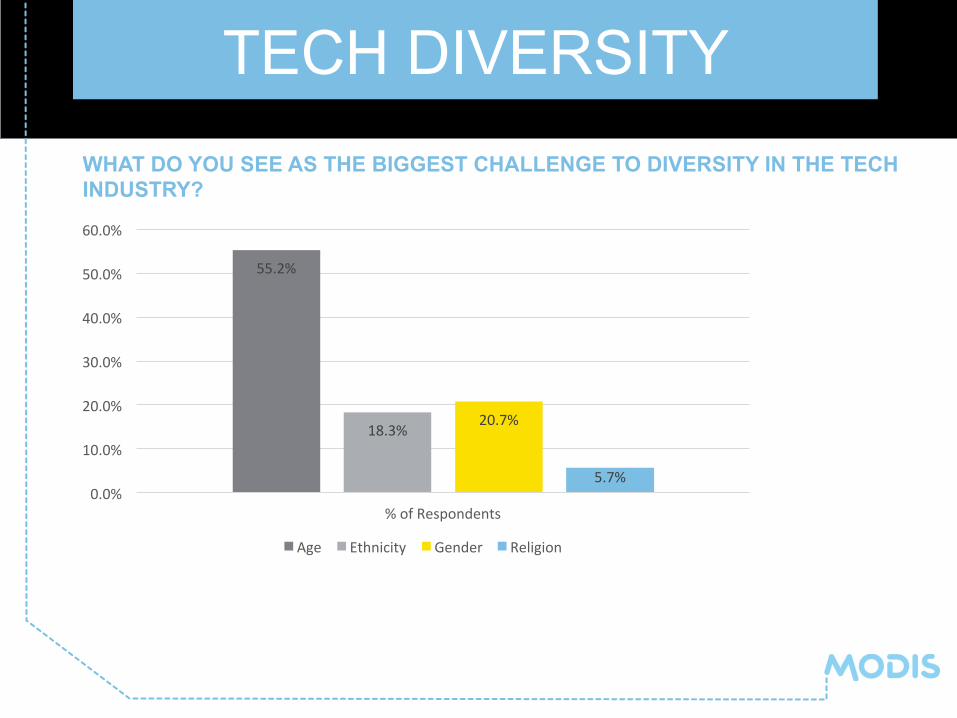
TECH DIVERSITY WHAT DO YOU SEE AS THE BIGGEST CHALLENGE TO DIVERSITY IN THE TECH INDUSTRY?
55.2%
18.3% 20.7%
5.7% 0.0%
10.0%
20.0%
30.0%
40.0%
50.0%
60.0%
% of Respondents
Age Ethnicity Gender Religion
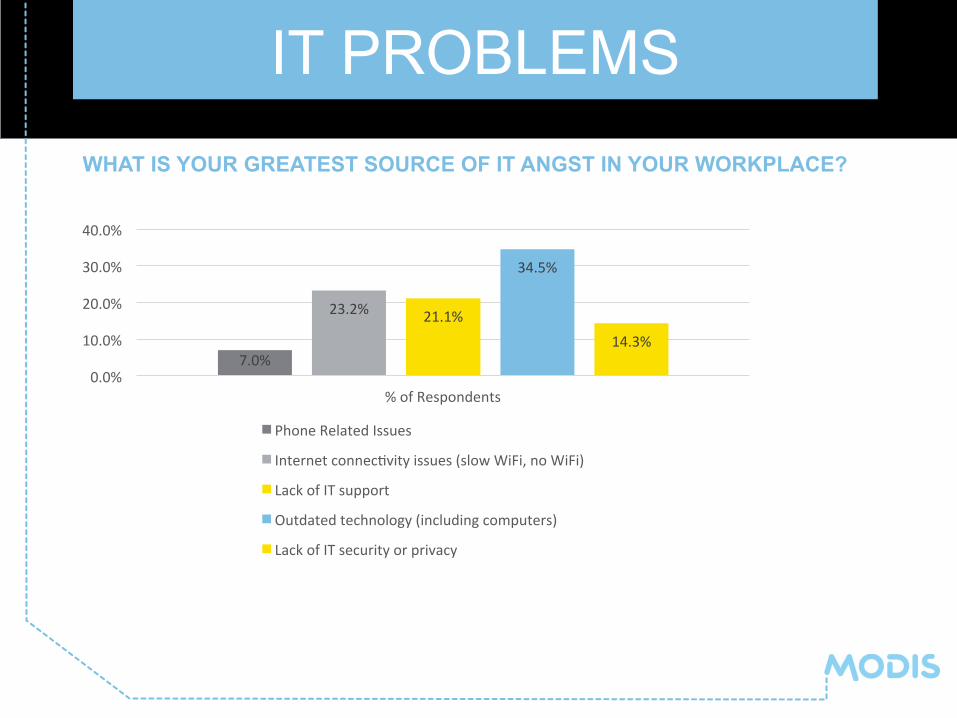
IT PROBLEMS WHAT IS YOUR GREATEST SOURCE OF IT ANGST IN YOUR WORKPLACE?
7.0%
23.2% 21.1%
34.5%
14.3%
0.0%
10.0%
20.0%
30.0%
40.0%
% of Respondents
Phone Related Issues
Internet connecGvity issues (slow WiFi, no WiFi)
Lack of IT support
Outdated technology (including computers)
Lack of IT security or privacy

2016 CANDIDATES WITH THE 2016 PRESIDENTIAL ELECTIONS AROUND THE CORNER, HOW CONFIDENT ARE YOU THAT MAKING THE U.S. A LEADER IN TECHNOLOGY IS A PRIORITY TO THE CANDIDATES?
16.7%
42.1% 41.2%
0.0%
5.0%
10.0%
15.0%
20.0%
25.0%
30.0%
35.0%
40.0%
45.0%
% of Respondents
Very Confident Somewhat Confident Not Confident

Tech Perceptions Survey September 2015?

Modis Survey Key Findings
September 29, 2015
Introduction and Methodology:
Modis fielded a survey regarding behaviors, perceptions and attitudes tied to technology, job satisfaction and other employment-focused themes, aimed at discovering media-friendly data. Allison+Partners surveyed 1,010 individuals in the United States over the age of 18, with panel services from Qualtrics.
Survey Highlights:
• 60.9% of respondents agree with the statement ‘The U.S. is a global leader in the technology industry today.’ Respondents in the age group of 26 – 34 were most likely to agree with that statement (72%).
• Of respondents who agreed that the U.S. is a global technology leader, 79.1% felt that leadership will continue for the next five years. Additionally, 94% felt that technology education was important in maintaining the United States’ leadership in the technology industry.
• Among respondents who disagreed that the U.S. is a global technology leader, a lack of quality education was the reason most cited as contributing to the United States not being a global leader in the technology industry (56.5%), followed by a lack of government support of tech growth (39.3%) and a lack of financial investment in tech innovation (38.7%).
• Healthcare was by far the industry most respondents felt would have the greatest need for tech talent in the next five years, selected by 46% of respondents.
• Younger individuals are more willing to relocate; those ages 18 – 25 were most likely to indicate they would relocate, followed by those ages 26 – 34, then by those ages 35 – 54.
• Of those respondents who were willing to relocate, the largest group (35.0%) indicated they would expect a salary increase of between 20 – 29% after relocating. The second largest group of these respondents (27.6%), expected a 40% or greater increase in salary after relocating. 23.2% expected a 30 – 39% increase, 13.1% expected a 10 – 19% increase, and just 1.1% expected a 0 – 9% increase.
• Of those respondents who were willing to relocate, 51.5% were most willing to relocate to the Northwest. 29.5% would not be willing to relocate to the Northeast.
• Regarding the 2016 presidential elections, 41.2% of respondents were not confident that establishing the U.S. as a leader in technology is a priority to the candidates. 42.1% were somewhat confident that it was a priority, and 16.7% were very confident. Older respondents (ages 55 – 64 and 65+) were more likely to not be confident, whereas younger respondents (ages 18 – 25 and 26 – 34) were more likely to express confidence.

Survey Data:
• Q2.1: Do you agree or disagree with the following statement: The U.S. is a global leader in the technology industry today.
Total Answering 1,010
Strongly Disagree 4.0% Disagree 12.7% Neither Agree nor Disagree 22.5% Agree 42.8% Strongly Agree 18.1%
o 60.9% of respondents agree with the statement. o Respondents in the age group of 26 – 34 were most likely to agree with that
statement (72%).
• Q2.2: Do you agree or disagree with the following statement: I believe that the U.S. will continue to be a global leader in the technology industry in the next 5 years.
Total Answering NOTE: Among respondents who agreed that the U.S. is a global tech leader in
Q2.1 (approx. 616 respondents)
Strongly Disagree 0.2% Disagree 2.5% Neither Agree nor Disagree 18.1% Agree 72.2% Strongly Agree 6.9%
o Of respondents who agreed that the U.S. is a global technology leader, 79.1% felt that leadership will continue for the next five years.
• Q2.3: Do you agree or disagree with the following statement: I believe technology education in the U.S. is important to maintaining the country’s status as a global leader in the industry.
Total Answering NOTE: Among respondents who agreed that the U.S. is a global tech leader in
Q2.1 (approx. 616 respondents)
Strongly Disagree 0.3% Disagree 1.5% Neither Agree nor Disagree 4.2% Agree 41.6% Strongly Agree 52.4%
o Of respondents who agreed that the U.S. is a global technology leader, 94% felt that technology education was important in maintaining the United States’ leadership in the technology industry.

• Q2.4: Do you agree or disagree with the following statement: I believe there is a need for
increased technology education policy in the U.S. Total Answering NOTE: Among respondents who agreed
that the U.S. is a global tech leader in Q2.1 (approx. 616 respondents)
Strongly Disagree 3.6% Disagree 4.2% Neither Agree nor Disagree 8.3% Agree 38.1% Strongly Agree 45.8%
• Q2.5: What factors do you believe most contribute to the U.S. NOT being a global leader in the technology industry today? Select all that apply.
Total Answering NOTE: Among respondents who agreed that the U.S. is a global tech leader in
Q2.1 (approx. 616 respondents)
Lack of quality education in the U.S. 56.5% Lack of diversity in the U.S. tech workforce
25.0%
Lack of talent in U.S. workforce 23.8% Lack of financial investment in U.S. tech innovation
38.7%
Lack of government support of U.S. Tech Growth
39.3%
Other 6.0%
o Among respondents who disagreed that the U.S. is a global technology leader, a lack of quality education was the reason most cited as contributing to the U.S. not being a global leader in the technology industry (56.5%), followed by a lack of government support of tech growth (39.3%) and a lack of financial investment in tech innovation (38.7%).
• Q3.1: Please indicate how strongly you agree or disagree with the following statements.
• Q3.2: Do you agree or disagree with the following statement: The demand for tech professionals in the U.S. will grow over the next five years.
Total Answering 1,010
Strongly Disagree 2.8% Disagree 1.5% Neither Agree nor Disagree 10.6% Agree 46.3% Strongly Agree 38.8%

o 85.1% of respondents felt that demand for tech professionals in the U.S. would grow over the next five years. Individuals 65 years or older were most likely to agree.
• Q3.3: Do you agree or disagree with the following statement: Tech jobs in the U.S. are lucrative compared to jobs in other fields.
Total Answering 1,010
Strongly Disagree 0.9% Disagree 3.5% Neither Agree nor Disagree 22.1% Agree 48.9% Strongly Agree 24.7%
o 73.6% of respondents agreed that tech jobs are lucrative compared to jobs in
other fields. Those ages 65+ were most likely to agree.
• Q3.4: Do you agree or disagree with the following statement: Silicon Valley is the only place in the U.S. with lucrative jobs in technology.
Total Answering 1,010
Strongly Disagree 15.9% Disagree 43.8% Neither Agree nor Disagree 28.6% Agree 7.6% Strongly Agree 4.1%
o Even though Silicon Valley may be the first place people think of when it comes to technology, most people do not see technology jobs as being limited to Silicon Valley.
o Interestingly, respondents between ages 26 and 34 were the group most likely to agree with the premise, while those ages 55 – 64 and 65+ were most likely to disagree.
• Q4.1: Would you be willing to relocate within the U.S. for a position with a higher salary? Total Answering 1,010
Yes 61.4% No 38.6%
o Younger individuals are more willing to relocate; those ages 18 – 25 were most
likely to indicate they would relocate, followed by those ages 26 – 34, then by those ages 35 – 54.

• Q4.2: What salary increase would you expect after agreeing to relocate? Total Answering NOTE: Respondents who responded yes
to Q4.1 (approx. 616 respondents)
Percentage Increase Percentage of Respondents 0-9% 1.1% 10-19% 13.1% 20-29% 35.0% 30-39% 23.2% 40% or greater 27.6%
o Of those respondents who were willing to relocate, the largest group (35.0%)
indicated they would expect a salary increase of between 20 – 29% after relocating. The second largest group of these respondents (27.6%), expected a 40% or greater increase in salary after relocating. 23.2% expected a 30 – 39% increase, 13.1% expected a 10 – 19% increase, and just 1.1% expected a 0 – 9% increase.
• Q4.3: What U.S. region would you be willing to relocate to? Choose all that apply. Total Answering NOTE: Respondents who responded yes
to Q4.1 (approx. 616 respondents)
Mid-Atlantic 40.0% Mid-West 46.8% Northeast 44.7% Northwest 51.5% Southeast 45.0% Southwest 48.4%
• Q4.4: What U.S. region would you NOT be willing to relocate to, even with a substantial salary increase? Select all that apply.
Total Answering NOTE: Respondents who responded yes to Q4.1 (approx. 616 respondents)
Mid-Atlantic 18.9% Mid-West 26.0% Northeast 29.5% Northwest 15.3% Southeast 27.7% Southwest 21.5%

• Q5.1: In general, do you think tech professionals are overpaid, paid enough or underpaid?
Total Answering 1,010
Overpaid 10.2% Paid enough 73.7% Underpaid 16.1%
• Q5.2: Do you feel that your employer pays you appropriately for your level of
experience? Total Answering 1,010
Yes 35.8% No 37.1% Don’t know 27.0%
o Of people who are employed (approx. 585 respondents), about half (48.2%) think
their employer pays them appropriately for their level of experience compared to about half that think their employer does not (43.6%).
o Individuals between the ages of 26 and 34 were most likely to indicate they felt their employer paid them appropriately for their experience.
• Q5.3: How confident do you feel in your employer’s ability to secure your personal
information and keep it confidential? Total Answering 1,010
Very confident 29.2% Somewhat confident 48.0% Not confident 22.8%
o 77.2% of respondents felt at least somewhat confident that their employer had
the ability to secure their personal information and keep it confidential. Younger respondents were more likely to be very confident in their employer (42% of those ages 18 – 25 and 47% of those ages 26 – 34) than others.
o In addition, respondents with a professional degree were more likely to be very confident (50% of those with a JD or MD) in their employer.
• Q5.4: Which industry do you think will have the greatest need for increased technology talent in the next five years?
Total Answering 1,010
Heathcare 46.0% Government 13.4% Education 16.1% Finance 7.6% Retail 3.8%
Utilities 8.8% Other 4.3%
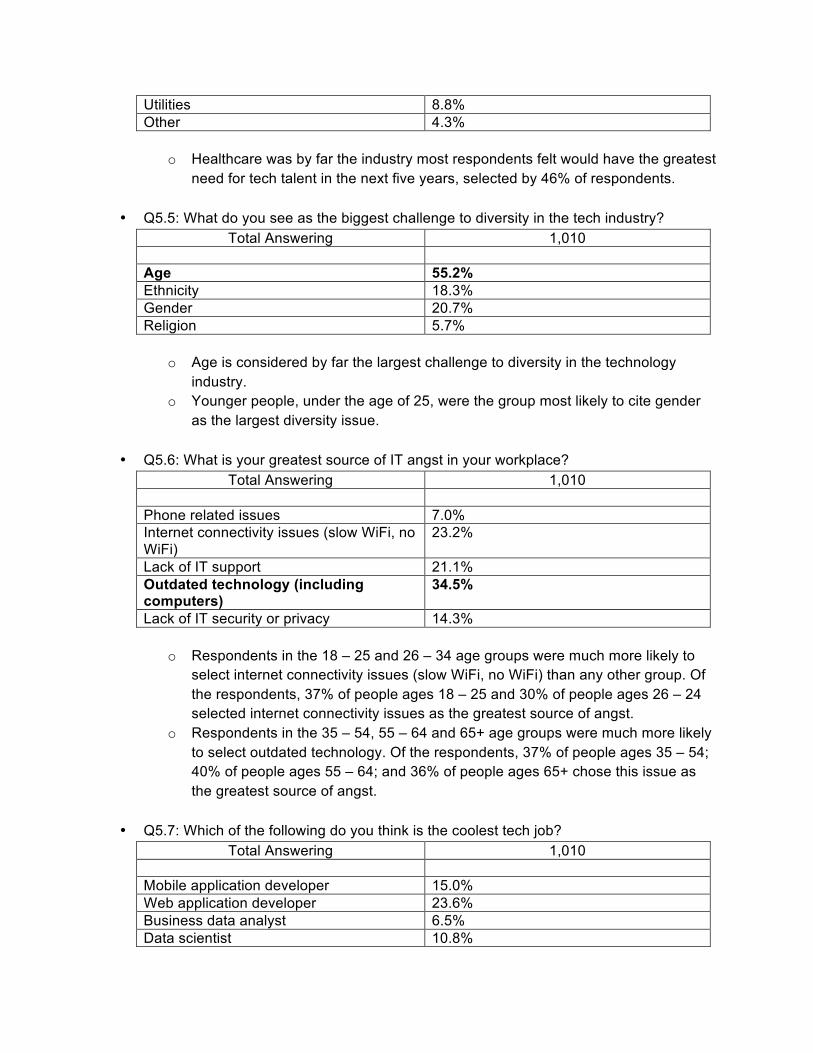
o Healthcare was by far the industry most respondents felt would have the greatest need for tech talent in the next five years, selected by 46% of respondents.
• Q5.5: What do you see as the biggest challenge to diversity in the tech industry? Total Answering 1,010
Age 55.2% Ethnicity 18.3% Gender 20.7% Religion 5.7%
o Age is considered by far the largest challenge to diversity in the technology industry.
o Younger people, under the age of 25, were the group most likely to cite gender as the largest diversity issue.
• Q5.6: What is your greatest source of IT angst in your workplace? Total Answering 1,010
Phone related issues 7.0% Internet connectivity issues (slow WiFi, no WiFi)
23.2%
Lack of IT support 21.1% Outdated technology (including computers)
34.5%
Lack of IT security or privacy 14.3%
o Respondents in the 18 – 25 and 26 – 34 age groups were much more likely to select internet connectivity issues (slow WiFi, no WiFi) than any other group. Of the respondents, 37% of people ages 18 – 25 and 30% of people ages 26 – 24 selected internet connectivity issues as the greatest source of angst.
o Respondents in the 35 – 54, 55 – 64 and 65+ age groups were much more likely to select outdated technology. Of the respondents, 37% of people ages 35 – 54; 40% of people ages 55 – 64; and 36% of people ages 65+ chose this issue as the greatest source of angst.
• Q5.7: Which of the following do you think is the coolest tech job? Total Answering 1,010
Mobile application developer 15.0% Web application developer 23.6% Business data analyst 6.5% Data scientist 10.8%
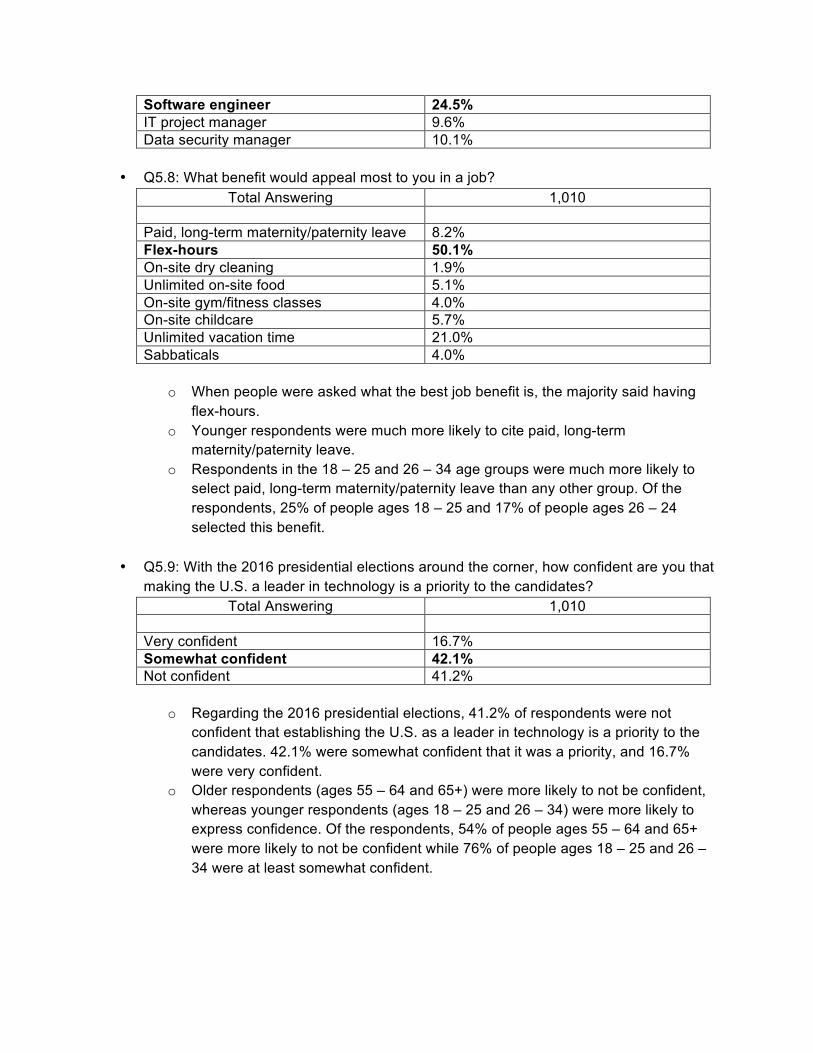
Software engineer 24.5% IT project manager 9.6% Data security manager 10.1%
• Q5.8: What benefit would appeal most to you in a job? Total Answering 1,010
Paid, long-term maternity/paternity leave 8.2% Flex-hours 50.1% On-site dry cleaning 1.9% Unlimited on-site food 5.1% On-site gym/fitness classes 4.0% On-site childcare 5.7% Unlimited vacation time 21.0% Sabbaticals 4.0%
o When people were asked what the best job benefit is, the majority said having flex-hours.
o Younger respondents were much more likely to cite paid, long-term maternity/paternity leave.
o Respondents in the 18 – 25 and 26 – 34 age groups were much more likely to select paid, long-term maternity/paternity leave than any other group. Of the respondents, 25% of people ages 18 – 25 and 17% of people ages 26 – 24 selected this benefit.
• Q5.9: With the 2016 presidential elections around the corner, how confident are you that making the U.S. a leader in technology is a priority to the candidates?
Total Answering 1,010
Very confident 16.7% Somewhat confident 42.1% Not confident 41.2%
o Regarding the 2016 presidential elections, 41.2% of respondents were not
confident that establishing the U.S. as a leader in technology is a priority to the candidates. 42.1% were somewhat confident that it was a priority, and 16.7% were very confident.
o Older respondents (ages 55 – 64 and 65+) were more likely to not be confident, whereas younger respondents (ages 18 – 25 and 26 – 34) were more likely to express confidence. Of the respondents, 54% of people ages 55 – 64 and 65+ were more likely to not be confident while 76% of people ages 18 – 25 and 26 – 34 were at least somewhat confident.


