General rights Copyright and moral rights for the publications made accessible in the public portal are retained by the authors and/or other copyright owners and it is a condition of accessing publications that users recognise and abide by the legal requirements associated with these rights. • Users may download and print one copy of any publication from the public portal for the purpose of private study or research. • You may not further distribute the material or use it for any profit-making activity or commercial gain • You may freely distribute the URL identifying the publication in the public portal If you believe that this document breaches copyright please contact us providing details, and we will remove access to the work immediately and investigate your claim. Downloaded from orbit.dtu.dk on: Sep 11, 2018 Modular 5-UTR hexamers for context-independent tuning of protein expression in eukaryotes Petersen, Søren Dalsgård; Zhang, Jie; Lee, Jae Seong; Jakociunas, Tadas; Grav, Lise Marie; Kildegaard, Helene Faustrup; Keasling, Jay; Jensen, Michael Krogh Published in: Nucleic Acids Research Link to article, DOI: 10.1093/nar/gky734 Publication date: 2018 Document Version Peer reviewed version Link back to DTU Orbit Citation (APA): Petersen, S. D., Zhang, J., Lee, J. S., Jakoinas, T., Grav, L. M., Kildegaard, H. F., ... Jensen, M. K. (2018). Modular 5-UTR hexamers for context-independent tuning of protein expression in eukaryotes. Nucleic Acids Research, [gky734]. DOI: 10.1093/nar/gky734
Transcript
General rights Copyright and moral rights for the publications made accessible in the public portal are retained by the authors and/or other copyright owners and it is a condition of accessing publications that users recognise and abide by the legal requirements associated with these rights.
• Users may download and print one copy of any publication from the public portal for the purpose of private study or research. • You may not further distribute the material or use it for any profit-making activity or commercial gain • You may freely distribute the URL identifying the publication in the public portal
If you believe that this document breaches copyright please contact us providing details, and we will remove access to the work immediately and investigate your claim.
Downloaded from orbit.dtu.dk on: Sep 11, 2018
Modular 5-UTR hexamers for context-independent tuning of protein expression ineukaryotes
Petersen, Søren Dalsgård; Zhang, Jie; Lee, Jae Seong; Jakociunas, Tadas; Grav, Lise Marie; Kildegaard,Helene Faustrup; Keasling, Jay; Jensen, Michael KroghPublished in:Nucleic Acids Research
Link to article, DOI:10.1093/nar/gky734
Publication date:2018
Document VersionPeer reviewed version
Link back to DTU Orbit
Citation (APA):Petersen, S. D., Zhang, J., Lee, J. S., Jakoinas, T., Grav, L. M., Kildegaard, H. F., ... Jensen, M. K. (2018).Modular 5-UTR hexamers for context-independent tuning of protein expression in eukaryotes. Nucleic AcidsResearch, [gky734]. DOI: 10.1093/nar/gky734
Modular 5′-UTR hexamers for context-independenttuning of protein expression in eukaryotesSøren D. Petersen1, Jie Zhang1, Jae S. Lee1, Tadas Jakociunas1, Lise M. Grav1, HeleneF. Kildegaard1, Jay D. Keasling1,2,3,4,5,6 and Michael K. Jensen1,*
1Novo Nordisk Foundation Center for Biosustainability, Technical University of Denmark, 2800 Kgs. Lyngby, Denmark,2Joint BioEnergy Institute, Emeryville, CA 94608, USA, 3Biological Systems and Engineering Division, LawrenceBerkeley National Laboratory, Berkeley, CA 94720, USA, 4Department of Chemical and Biomolecular Engineering,University of California, Berkeley, CA 94720, USA, 5Department of Bioengineering, University of California, Berkeley,CA 94720, USA and 6Center for Synthetic Biochemistry, Institute for Synthetic Biology, Shenzhen Institutes ofAdvanced Technologies, Shenzhen 518055, China
Received March 09, 2018; Revised July 24, 2018; Editorial Decision July 30, 2018; Accepted August 01, 2018
ABSTRACT
Functional characterization of regulatory DNA ele-ments in broad genetic contexts is a prerequisite forforward engineering of biological systems. Transla-tion initiation site (TIS) sequences are attractive touse for regulating gene activity and metabolic path-way fluxes because the genetic changes are minimal.However, limited knowledge is available on tuninggene outputs by varying TISs in different genetic andenvironmental contexts. Here, we created TIS hex-amer libraries in baker’s yeast Saccharomyces cere-visiae directly 5′ end of a reporter gene in various pro-moter contexts and measured gene activity distribu-tions for each library. Next, selected TIS sequences,resulted in almost 10-fold changes in reporter out-puts, were experimentally characterized in variousenvironmental and genetic contexts in both yeast andmammalian cells. From our analyses, we observedstrong linear correlations (R2 = 0.75–0.98) betweenall pairwise combinations of TIS order and gene ac-tivity. Finally, our analysis enabled the identificationof a TIS with almost 50% stronger output than a com-monly used TIS for protein expression in mammaliancells, and selected TISs were also used to tune geneactivities in yeast at a metabolic branch point in or-der to prototype fitness and carotenoid productionlandscapes. Taken together, the characterized TISssupport reliable context-independent forward engi-neering of translation initiation in eukaryotes.
INTRODUCTION
Control of protein expression is critical for cellular develop-ment, differentiation and adequate response to intra- andextracellular conditions (1). From simple bacteria to multi-cellular eukaryotes, control of protein expression involvesthe sequence composition of the 5′-untranslated regions(5′-UTRs) of existing messenger RNAs (mRNAs). Specif-ically, translation initiation, where the AUG start codon isidentified by ribosomes and decoded by methionyl-(transferRNAs) tRNAs (met-tRNAs), is recognized as one of themost crucial steps in translation (1–4). As a consequence, alarge number of studies have been performed to deduce therelationship between 5′-UTR sequences and protein expres-sion (5–11).
In bacteria, simple base-pairing between the 6-nt Shine–Dalgarno (SD) sequence located immediately 5′ end of thestart codon and the anti-SD sequence in the peptidyl de-coding site of the 16S ribosomal subunit controls trans-lation initiation from 50 to 70% transcripts by modulat-ing the ribosomal accessibility to the SD sequence (12,13).Moreover, deep sequence–function characterization of SDlibraries has enabled the development of predictive algo-rithms for tuning of protein expression over several ordersof magnitude by simple modulation of the SD sequence (4–6).
In eukaryotes, translation is initiated at the 5′ end ofmRNA by the recruitment of the 40S ribosomal subunit,auxiliary initiation polypeptides and the met-tRNA, col-lectively the 43S pre-initiation complex (PIC) (14). Differ-ent from translation initiation in bacteria, once recruited,PIC scans along a much larger sequence space of eukary-otic 5′-UTRs, often several hundred nucleotides in length,until encountering an AUG codon (14–16). During scan-ning, a number of 5′-UTR sequence features are known toaffect translation, including mRNA secondary structures,
*To whom correspondence should be addressed. Tel: +45 6128 4850; Fax: +45 4525 8001; Email: [email protected] address: Jae S. Lee, Department of Molecular Science and Technology, Ajou University, Suwon 16499, Republic of Korea.
Downloaded from https://academic.oup.com/nar/advance-article-abstract/doi/10.1093/nar/gky734/5073280by gueston 15 August 2018
2 Nucleic Acids Research, 2018
decoy AUG codons, PIC stalling at upstream open readingframes (uORFs) and the sequence context surrounding thecognate AUG for translation, commonly referred to as theKozak sequence (17–29).
Similar to the algorithms established in bacteria for tun-ing protein expression, major efforts have been performedto mine the causal sequence elements of native eukaryotic5′-UTRs, in order to attempt to model and forward engi-neer 5′-UTRs with predictive protein expression outputs(7,9). Initially, Kozak et al. reported GCCRCCAUGGG (R= A/G, start codon underlined) to effectively control ribo-somal recognition of AUG and thereby initiation of trans-lation (30–32). In particular the positioning of a purine atposition -3 and a guanine at position +4 from the AUGcodon has later been adopted for efficient translation initi-ation (33–35). Expanding on this, in mammalian cell lines,Noderer et al. have systematically probed the efficiency ofstart codon recognition for all possible translation initiationsites (TISs) flanking the AUG start codon at positions -6 to-1, and +4 and +5, totaling ∼65 000 TIS sequences, con-cluding that the motif RYMRMVAUGGC (Y = U or C,M = A or C, R = A or G and V = A, C, or G, start codonunderscored) enhanced start codon recognition and GFPtranslation efficiency (8). Likewise, in yeast, recent studieshave attempted to accurately estimate TIS efficiencies on re-porter protein expression by randomizing 5′-UTR elementsup to 50 nt upstream AUG (uAUG) and training computa-tional models on smaller subfractions (4 × 10⁻²⁶ – 0.2%) ofthese libraries (7,9). Here, both studies pointed out that inaddition to uORFs and mRNA secondary structure, posi-tions -3 to -1 from the AUG start codon are the most impor-tant parameters for tuning protein expression, ultimatelyenabling the construction of an algorithm explaining up to70% of the observed variation in protein levels (7). Morerecently, the computational model by Dvir et al. has beenfurther validated with new experimental data, again investi-gating the interactions with polymorphism in nucleotides atpositions -10 to -1 relative to the start codon, but this timealso placing the TIS in genomic contexts of two differentreporter proteins and two different promoters (10). Here,similar correlations between experimental data and modelpredictions were observed (R2 = 0.36–0.73), ultimately sug-gesting that the ∼30% variation observed for which the cur-rent models cannot account for arises from experimentalnoise and yet-uncharacterized biological factors (7). Like-wise, though Noderer et al. showed strong linear relation-ships between GFP expression in different mammalian celllines and cultivation media, comparisons of TIS efficienciesof GFP expression compared to other reporter genes sug-gested some context-dependence of TISs and open readingframe (ORF; R2 = 0.39–0.76), in line with the model beingtrained on ORF-specific library sequences including the +4and +5 positions (8). Taken together, the above studies indi-cate that systematic characterization of the impact of shortTISs on protein expression in broad contexts still remainsto be elucidated before TISs can be used as a tool for pre-dictable tuning of protein expression.
In this study, we sought to establish a robust, simple andexperimentally validated workflow to assess the sequence–function relationship of TISs in diverse genomic and envi-ronmental contexts (Figure 1). To do so, we created three
TIS libraries spanning more than 4500 designs for nu-cleotide positions -6 to -1 directly upstream of an ORFof GFP controlled by three different promoters in yeast.Based on fluorescence-activated cell sorting (FACS) andsingle clone validations, a diverse sample of TIS hexam-ers with a robust output range of ∼10-fold was selected forfurther characterization in the context of different ORFs,promoters, host chassis, growth medium and cell densities(Figure 1). In general, the linear relationship between rel-ative fluorescence output from selected TIS sequences ob-tained in different contexts was high, with correlation co-efficients ranging from 0.77 to 0.98. Moreover, testing TISsderived from yeast in mammalian cell lines, we specificallyuncovered a TIS sequence stronger than the Kozak ele-ment commonly used to drive protein production in mam-malian cell factories. In addition, we used selected TIShexamers to investigate the carotenoid production land-scape in yeast by tuning dual protein activities at an essen-tial metabolic branch point, thereby prototyping the fitnessand carotenoid production landscape in a simple and cost-effective manner. Our detailed, experimental analyses allowus to put forward a list of short sequence-validated TISs tobe used as a method for predictable tuning of protein ex-pression in diverse genomic and environmental contexts.
MATERIALS AND METHODS
Strains, cell lines and growth media
Baker’s yeast Saccharomyces cerevisiae strains were de-rived from CEN.PK2-1C (EUROSCARF, Germany). Yeaststrains were cultured in yeast synthetic drop-out media(Sigma-Aldrich) at 30◦C. CHO-S cells (ThermoFisher) andderivative cells were maintained in CD CHO medium(Gibco Cat. #10743-029) supplemented with 8 mM L-glutamine (Lonza Cat. #BE17-605F) and 2 ml/L anti-clumping agent (Gibco Cat.#0010057AE) in 125 ml Erlen-meyer shake flasks (Corning Inc., Acton, MA), incubatedat 37◦C, 5% CO2 at 120 rpm and passaged every 2–3 days.Escherichia coli DH5� were cultured in Luria-Bertani (LB)medium containing 100 mg/l ampicillin (Sigma-Aldrich) at37◦C.
Plasmid and strain construction
Yeast integrative plasmids were created by USER cloning(36) and propagated in E. coli DH5a. Yeast transformationswere performed by LiAc/SS carrier DNA/PEG method(37). Plasmids and polymerase chain reaction (PCR) prod-ucts were purified using kits from Macherey-Nagel. Bio-bricks for USER assembly were amplified using PhusionU Hot Start PCR Master Mix (ThermoFisher), parts fortransformation by Phusion High-Fidelity PCR Master Mixwith HF Buffer (ThermoFisher), whereas colony PCRswere performed using 2xOneTaq Quick-Load Master Mixwith Standard Buffer (New England Biolabs). Oligos, du-plex oligos and gBlocks were purchased from IntegratedDNA Technologies (IDT). Sequencing was performed byEurofins. All primers, plasmids, yeast strains and CHO celllines are listed in Supplementary Tables S1, S2, S3 and S4,respectively.
Downloaded from https://academic.oup.com/nar/advance-article-abstract/doi/10.1093/nar/gky734/5073280by gueston 15 August 2018
Nucleic Acids Research, 2018 3
yeGFPNNNNNNPromoter
50 100 150 250200 300
Nor
mal
ized
cou
nts
Fluorescence (a.u.)0
Cou
nts
Fluorescence (a.u.)
2. TIS screening
1 2 3 4 5 6 7 8
Promoter
GOI
Media
Chassis
3. Selection of clonal TIS variants 1. TIS library construction 4. Test of TIS context-dependence
TIS no.
Figure 1. Workflow for TIS library construction and characterization.
Constructions of TIS libraries
Three TIS libraries were constructed using the EasyClonemethod (38) with slight modifications. Briefly, 0.1 pmolof promoter REV1 (389 bp upstream position +1 ofYOR346W; Supplementary Table S5), RPL18B (700 bp;upstream position +1 of YNL301C) and TEF1 (420 bp;upstream position +1 of YPR080W) were cloned togetherwith yeast-enhanced GFP (yeGFP; Supplementary TableS6) (39) with six randomized nucleotides upstream thestart codon, into 0.03 pmol linearized EasyClone vectorpCfB261 amplified from a vector excluding a ccdB cas-sette (suicide gene (40); pCFB8168) to counterselect fornon-linear vector template. Correctly assembled EasyCloneplasmids (0.5 pmol) containing the yeGFP cassette undereither REV1, RPL18B or TEF1 promoter was linearizedby NotI (Fermentas) and transformed into TC-3 cells for re-combination at the EasyClone site XII-5 facilitated by Cas9(41). Escherichia coli and Saccharomyces cerevisiae librarycolonies were scraped and pooled from five individual trans-formation plates. In E. coli, TIS library sizes in the contextof REV1, RPL18B and TEF1 promoters were estimated bycolony count to ∼1180, 4600 and 4520, respectively. In S.cerevisiae, REV1, RPL18B and TEF1 library sizes were es-timated to ∼845, 3300 and 2750, respectively.
Construction of promoter and reporter strains
Thirty-two yeast strains were constructed similarly to theTEF1 promoter TIS library, by combinatorial assembly ofpromoter, TIS and reporter sequences using the CasEM-BLR method with assemblies integrated into EasyClonesite XII-5 (38,42). For these strains, the TIS was definedas one of eight sequences TGATAT, CGACTT, ACGTTC,GGGGGT, TAGGTT, AGGACA, TGTGAA or TCGGTC. Eight of the 32 strains were constructed by transfor-mation of the alcohol dehydrogenase II (ADH2) promoterfragment (700 bp upstream position +1 of YMR303C), andone of eight TIS-yeGFP into strain TC-3 (43) for recombi-nation at the XII-5 site. Homology between fragments was30 bp, with up and down fragments of at least 450 bp forhomologous recombination into EasyClone site XII-5. Theremaining 24 strains were constructed similarly by transfor-mations of the previously used TEF1 promoter fragment,with each of 24 fragments made by combination of theeight TIS sequences with the three reporter genes encodingymUkG1 (44), yeGFP and mKate2 (45).
Construction of carotenoid strains
A background carotenoid expression strain was cre-ated by first, amplifying genes crtI and crtYB fromplasmid YIplac211-YB/I/E* (46). Second, genes wereUSER cloned together with bidirectional promoter(pTDH3 pTEF1) into linearized vector pCfB390 (38) tocreate a plasmid pTAJAK-11. Third, linearized pTAJAK-11 was integrated into CEN.PK2-1C strain, XI-3 siteas described in Jensen et al. (38), and the strain wasnamed TC-9. Fourth, TC-9 was transformed with theCas9 expression plasmid pCfB176 to create strain TC-10.Further, carotenoid strains were constructed by trans-forming (i) linear 90-bp DNA donor fragments spanningErg9 promoter and coding sequence introducing eitherTIS no. 1 (TGATAT), no. 5 (TAGGTT) or no. 8 (TCG-GTC) directly upstream the start codon, (ii) a pCfB261upstream part with phosphoglycerate kinase gene (PGK1)promoter (YCR012W; 984 bp) and (iii) either TIS no.1 (TGATAT), no. 5 (TAGGTT) or no. 8 (TCGGTC)directly upstream the crtE start codon with a pCfB261downstream homology part into EasyClone site XII-5 ofstrain TC-10 by the CasEMBLR method (Erg9 gRNAsequence: CACATATCACACACACACAA; XII-5 gRNAsequence: TTGTCACAGTGTCACATCAG) (42).
Construction of the CHO reporter cell pools
CHO reporter cell pools were derived from a master cellline harboring a recombinase-mediated cassette exchange(RMCE) landing pad. The master cell line was made byCRISPR-mediated homology directed targeted integrationof CHO-S cells as previously described (47), with minorchanges in the homology-directed repair (HDR) donorplasmid. The mCherry coding sequence in the HDR-donor plasmid (pCFB8173) has been flanked by a loxPsequence at the 5′ end and a lox2272 sequence at the 3′end (pEF1�-loxP-mCherry-lox2272-BGHpA), and the 5′and 3′ homology arms target a non-coding region. Pro-moterless and polyAless RMCE vectors were constructedby assembly of PCR fragments containing TIS sequencesno. 1 (TGATAT), no. 5 (TAGGTT), no. 8 (TCGGTC) orthe mammalian consensus TIS (GCCACC) in combina-tion with mammalian-enhanced GFP (meGFP) (48) or Zs-Green1 (Clontech #632428) that were flanked by loxP andlox2272 sequences. The CHO master cell line at a con-centration of 1 × 10⁶ cells/ml was transfected with TIS-GFP or TIS-ZsGreen1 RMCE reporter plasmids and Cre-
Downloaded from https://academic.oup.com/nar/advance-article-abstract/doi/10.1093/nar/gky734/5073280by gueston 15 August 2018
4 Nucleic Acids Research, 2018
recombinase vector in 3:1 ratio (w:w) in six-well platesusing FreeStyle™ MAX transfection reagent to exchangemCherry coding sequence with TIS-GFP or TIS-ZsGreen1cassettes. For Cre recombinase expression, PSF-CMV-CRErecombinase vector (OGS591, Sigma-Aldrich) was used.Transfected cell pools were passaged two times after trans-fection. After 7 days, cell pools were analyzed by flow cy-tometry. Flow cytometry revealed that 1–3% of the cells inall cell pools were changed from mCherry to GFP positive.
Next-generation sequencing of TIS libraries
Genomic DNA was extracted from over night cultures us-ing PureLink Genomic DNA Purification Kit (Invitrogen).Genomic DNA extracts were used as template in PCR am-plifying ∼300 bp overlapping the TIS sequence within thefirst 50 bp. Purified PCR products were indexed with Nex-tera XT indexing. The indexed amplicons were quantifiedusing Qubit 2.0 Fluorometer (Life Technologies), pooledin equimolar quantities and sequenced on Illumina MiSequsing 75-bp reads. TIS sequences were extracted from se-quencing reads using the cutadapt command line tool (49)treating the TIS sequence flanking regions as anchoredadapters. Reads shorter than 70 bp was removed and up to5 bp mismatches in the flanking regions were allowed in to-tal. From 4.1 million usable reads from the three sequencedlibraries, we identified 4037, 4093 and 4037 (or 98.6–99.9%)of the 4096 possible hexameric TIS sequences for each li-brary. Of these 1721, 2174 and 844 TISs exceeded our cutoffof 100 reads for reliable quantification.
Flow cytometry and TIS library sorting by FACS
Yeast cells were grown in 96-well microtiter plates ON tosaturation, diluted to OD600 0.025 (measured by reading theabsorbance at 600 nm on Microplate Reader, BioTek) andincubated for 4–6 h (until OD600 reached 0.1–0.2) before be-ing measured by flow cytometry using a MACSquant VYB(Miltenyi) or BD Fortessa (BD Biosciences) flow cytometer.CHO reporter cell pools in exponential phase were analyzedby flow cytometry using a BD FACSJazz cell sorter (BDBiosciences). Fluorescence of yeGFP, ymUkG1, meGFPand ZsGreen1 was measured after excitation by 488 nmlaser and detected through 525/50 nm bandpass filters. Flu-orescence of mKate2 and mCherry was measured after ex-citation by 561 nm laser and detected through a 615/20 nmbandpass filter. Cells were gated based on FSC-A and FSC-H (singlets) as well as FSC-A and SSC-A profiles for robustmeasurements. All fluorescence data presented are medianvalues for at least 10 000 or 5000 cells from yeast and CHOcells, respectively. Flow cytometry data were analyzed us-ing FlowLogic version 700.2A (Inivai Technologies). Fluo-rescence measurements from each fluorescent protein weremean normalized (each measurement divided by the meanand multiplied by 100).
The TIS library in the context of the TEF1 promoter wasdivided into 10 equal gates based on yeGFP signal, and 48cells were sorted out from each gate using BD FACS ARIAII (BD Biosciences). In total 480 cells were spotted ontoagar plates, grown in liquid cultures and validated by flowcytometry (BD Fortessa, BD Biosciences). Eight colonies
spanning the range of fluorescence were selected and se-quenced to reveal the corresponding TISs.
Characterization of carotenoid strains
Pre-cultures were inoculated from glycerol stock and incu-bated for 48 h before 2 �l culture was spotted onto SD agar.Pictures of colonies on agar plates were taken after incu-bation for 48 h at 30◦C and 72 h at 5◦C. Maximum spe-cific growth rates (μmax) were calculated using the Easylin-ear function from the growth rates R package (50) and set-ting the number of consecutive data points to 10 (h = 10).Growth were measured in 200 �l cultivations (Growth Pro-filer 960, EnzyScreen).
�-Carotene extraction and quantification by HPLC
Measurements were performed using a method describedby (51) with a few modifications. �-Carotene was extractedfrom 2 ml culture broth. The pelleted cells were lysed with250 �l glass beads and in 500 �l ethyl acetate supplementedwith 0.01% 3,5-di-tert-4-butylhydroxy toluene (BHT). Fi-nally, 300 �l ethyl acetate was evaporated from cell ex-tracts and the pellet was redissolved in 1.5 ml ethanolwith 0.01% BHT for high pressure liquid chromatography(HPLC) measurements.
Data analysis
Data analysis were mainly done using the R statisti-cal environment (version 3.4.1). Additional analysis usingRNAfold from the Vienna RNA package (version 2.4.6),the yUTR-calculator by Decoene et al. (10) and cutadaptversion 1.13 was performed in a Python 3.5 environment.Systematic names of yeast genes using one of TISs 1 to 8were found using the find Motif search tool in CLC MainWorkbench (version 7.7.2) on the CEN.PK113-7d genome(Genbank ID: AEHG01000000).
RESULTS
Construction and characterization of TIS libraries
Our first aim was to characterize in high-throughput howshort TIS sequences affect protein expression in eukaryotes.In yeast and mammalian cells, earlier studies have charac-terized TIS libraries ranging from -50 to -1, -10 to -1, -6 to+4 and -6 to +5 positions relative to the AUG start codon(7–9,33,52). From those studies, it has been inferred that (i)positions -3 to -1 from the AUG start codon, (ii) a purine(R) in position -3 or lack of G in position +4, (iii) mRNAsecondary structure and (iv) out-of-frame uAUGs are themost important parameters for tuning protein expression.In order to experimentally investigate in greater detail thepotential for identifying a list of hexameric TISs spanningthe -6 to -1 position that can be used to predictably tuneprotein expression in a context-independent manner (i.e.promoter or gene of interest (GOI) proximal sequences),we initially constructed three TIS libraries, each contain-ing a yeGFP expression cassette controlled by either a weak(REV1), medium (RPL18B) or strong (TEF1) constitutive
Downloaded from https://academic.oup.com/nar/advance-article-abstract/doi/10.1093/nar/gky734/5073280by gueston 15 August 2018
Nucleic Acids Research, 2018 5
promoter, which span approximately three orders of mag-nitude in expression level (53) and have <54% similarityin the -50 to -7 position (Supplementary Figure S1). Be-tween promoter and gene, we cloned randomized hexam-eric TISs and genomically integrated the reporter expres-sion cassettes (Figure 2A). For each of the three libraries, wealso constructed a corresponding control strain by substi-tuting the randomized nucleotides with -6 to -1 positionednucleotides, AAAACA, from the strong PGK1 promoter(54) (Figure 2A). From the 4096 possible hexamer vari-ants, DNA sequencing revealed library coverages of 42%(1721), 53% (2174) and 21% (844) from the REV1, RPL18Band TEF1 TIS libraries, respectively (Supplementary Fig-ure S2). Both the per base position and overall frequencyof nucleotides A, C, G and T were ∼20%, 10%, 45% and25%, respectively (Supplementary Figure S3). Flow cytom-etry analysis of the three TIS libraries revealed variances inyeGFP fluorescence of ∼2, >3 and >4 orders of magnitudefor the REV1, RPL18B and TEF1 promoters, respectively(Figure 2B–D). Also, none of the three libraries includedTIS variants that exceeded the fluorescence measurementsobserved in cells expressing the PGK1 TIS AAAACA (Fig-ure 2B–D, red).
In order to identify, and further characterize, TISs show-ing a high degree of protein expression tunability, we sortedthe TIS library in the context of the TEF1 promoter, whichshowed the highest detectable variance of the three libraries.Briefly, we selected 480 single cells based on gating (Sup-plementary Figure S4), thereby covering a large fraction ofthe yeGFP expression range (Figures 1 and 3A). Follow-ing single clonal validation of fluorescence, we selected eightstrains uniformly covering the maximum 10-fold range inyeGFP expression observed in our TIS library and deter-mined the TISs by sequencing (Figure 3A). Importantly, asthe chromophore formation is an O2-dependent autocat-alytic process (55), it is critical to consider cell density ofthe small cultivation volumes (150 �l) used when compar-ing fluorescence intensities of cell populations expressing in-dividual TIS variants. Accordingly, as we observed a rapiddecrease in maximum per cell fluorescence with increasingcell densities, we analyzed yeGFP expression at OD600 =0.1–0.2 as also reported from studies in bacteria (Supple-mentary Figure S5) (56).
Modular TISs show context-independent tuning of proteinexpression in yeast
In eukaryotes, earlier studies of TIS libraries, spanninglarger sequence spaces (e.g positions -50 to -1 or -6 to+5), have focused on building computational models to en-able forward engineering of protein expression levels (7–10).Though these efforts have enabled high-throughput enu-meration of sequence parameters of importance for predic-tive tuning of protein expression, the predicted protein ex-pression levels from placing TISs in new genomic contexts(i.e. promoter or gene of interest) have so far not been ableto explain >30% of the variation observed between experi-mentally deduced behavior compared to the genomic con-text in which the TIS algorithms were originally designed(7,10).
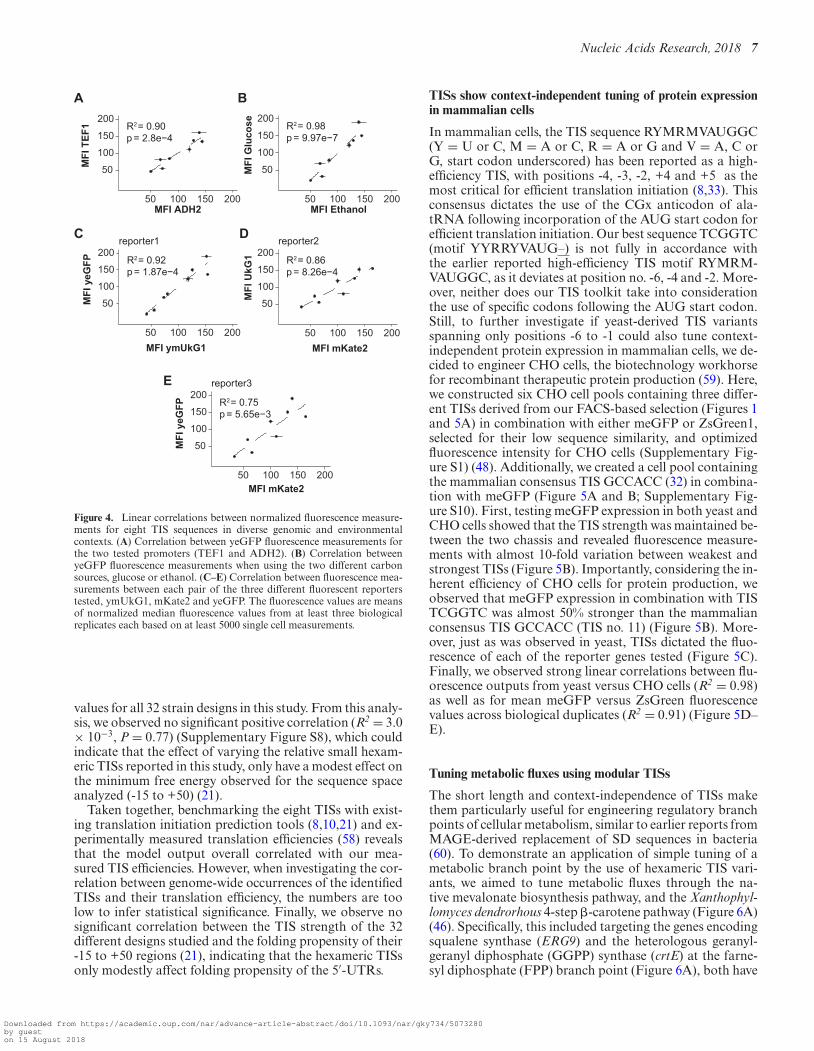
To investigate if shorter TIS variants selected from ourFACS analysis (Figure 3A) would have context-dependenteffects in protein expression, we placed the TIS sequencesin the context of a different promoter, different genes of in-terest (GOI) and in another cultivation medium, and usedstandard flow cytometry to analyze protein expression froma total of 32 genomic designs (Figure 3B and Supplemen-tary Figure S9). Specifically, in addition to the strong con-stitutive TEF1 promoter, we also tested the eight selectedTISs in the context of the glucose-repressed ADH2 pro-moter, and for GOI we included two other fluorescent re-porters: ymUKG1 and mKate2 (44). The selection of GOIsand promoter contexts was based upon maximal sequencediversity and carbon source dependent expression, respec-tively (57) (Supplementary Figure S1). Next, from the 32designs we experimentally validated, fluorescence measure-ments revealed from 2- to 10-fold variation, with glucoseand TEF1 contexts displaying the largest fold changes be-tween the weakest (TIS 1, TGATAT) and the strongest (TIS8, TCGGTC) TISs (Figure 3C–E). The five strongest TISsall had a purine in position -3, which is in line with earlierreports (7,8,10,52). Furthermore, the TIS sequence dictatesthe fluorescence in a similar manner across all tested ge-nomic and environmental conditions, as evidenced by thelinear correlations between mean fluorescence values be-tween individual promoter or reporter contexts (Pearson’s,R2 = 0.75–0.98) (Figure 4). This range overlaps with previ-ous studies based on larger number of TISs (8).
Benchmarking measured TIS efficiencies
When comparing the measured relative expression values ofall 32 combinatorial designs with existing computational al-gorithms for predicting translation initiation (8,10), we ob-serve substantial correlation coefficients (R2 = 0.44–0.86)between measured and predicted values (SupplementaryFigures S6 and S7), with the model inferred by Nodereret al. generally displaying stronger correlations comparedto the model generated by Decoene et al. However, as re-ported in these previous modeling studies, translation effi-ciency for some TISs (in our case TIS no. 4) would requireadditional experimental validation (incl. context) to furtherrefine predictive tuning of protein expression (8).
Complementary to these observations, we performed agenome-wide search for the occurence of the eight differ-ent TISs and compared the result with the translation effi-ciency of the native gene products as reported by Lathvee etal. (58). Briefly, this analysis identified TISs 2, 3, 5, 6 and 7in the -6 to -1 position in a total of 11 genes of which fourgenes with TISs 5, 6 and 7 had translation efficiencies re-ported (58). From this small number of hits, the translationefficiencies of the two genes with TIS 6 were higher than theefficiency reported for the gene with TIS 5, whereas the genewith TIS 7 had the lowest translation efficiency reportedamong the four genes (Supplementary Table S6).
Moreover, one critical parameter known to influencetranslation initiation efficiency is the folding propensity of5′-UTRs (17,20,30). To further benchmark translation ini-tiation efficiencies of TIS 1–8, we calculated the minimumfree energy (kcal/mol) for bases at positions -15 to +50 byRNAfold as a function of normalized mean fluorescence
Downloaded from https://academic.oup.com/nar/advance-article-abstract/doi/10.1093/nar/gky734/5073280by gueston 15 August 2018
6 Nucleic Acids Research, 2018
0
103
104
105
FITC
-A50 100 150 200 250
FSC- A
0
103
104
105
FITC
-A
50 100 150 200 250FSC- A
0
103
104
105
FITC
-A
50 100 150 200 250FSC- A
REV1 NNNNNNREV1 AAAAACANo yeGFP
RPL18B NNNNNNRPL18B AAAAACANo yeGFP
TEF1 NNNNNNTEF1 AAAAACANo yeGFP
TEF1yeGFPREV1pro NNNNNNRPL18BproTEF1pro
A B C DLibraries:
Controls:
XII-5
Cas9
yeGFPPromoter AAAACA
Chr.
Figure 2. Distribution of reporter gene activities of three TIS libraries. (A) Schematic outline of the TIS library designs in the context of three different pro-moters (REV1, REPL18B and TEF1) controlling the expression of yeGFP. Negative control strain was without yeGFP expression. Fluorescence outputsfor all three libraries were compared to yeGFP expression under the control of the TIS AAAACA from the strong PGK1 promoter. Libraries and controldesigns were integrated into yeast chromosome XII, EasyClone site 5 by CRISPR-mediated double-strand breaking and homologous recombination. (B)Fluorescence (FITC-A) as a function of forward scatter (FSC-A) of the TIS library in the context of REV1 promoter. (C) Fluorescence (FITC-A) as afunction of forward scatter (FSC-A) of the TIS library in the context of RPL18b promoter. (D) Fluorescence (FITC-A) as a function of forward scatter(FSC-A) of the TIS library in the context of TEF1 promoter. Scatter plots in (B–D) are displayed together with control populations having TIS AAAACA(red) and wild-type cells without yeGFP expressed (gray).
1 2 3 4 5 6 7 8
TIS no.
Promoter contextTEF1ADH2
1 2 3 4 5 6 7 8
TIS no.
GOI contextymUkG1mKate2yeGFP
1 2 3 4 5 6 7 8
TIS no.
Environmental contextGlucoseEthanol
TEF1
ADH2
yeGFPor
Nor
mal
ized
fluo
resc
ence
TIS
Nor
mal
ized
fluo
resc
ence
Nor
mal
ized
fluo
resc
ence
50 100 150 250200 300
Nor
mal
ized
cou
nts
Fluorescence (a.u.)0
Gate No. Sequence
TIS 1: -TGATAT-
TIS 2 -CGACTT-
TIS 3: -ACGTTC-
TIS 4: -GGGGGT-
TIS 5: -TAGGTT-
TIS 6: -AGGACA-
TIS 7: -TGTGAA-
TIS 8: -TCGGTC-
mKate2or
orymUKG1
Glucose or Ethanol
150
100
200
50
150
100
200
50
150
100
200
50
A B
C D E
Figure 3. Investigation of interaction effects between TIS sequences and promoter, gene of interest (GOI) or growth culture condition. (A) Fluorescencehistograms of gated populations of single clonal variants from the TIS library in the context of the TEF1 promoter. To the right, selected TISs fromeach of the populations are represented. (B) Schematic outline of the experimental design used to investigate interaction effects. (C) Normalized medianfluorescence measured for the eight different selected TIS sequences in the context of a constitutive promoter (TEF1) and a glyconeogenic promoter(ADH2). (D) Normalized median fluorescence measured for the eight different selected TIS sequences in the context of three different GOI; ymUkG1,mKate2 and yeGFP. (E) Normalized median fluorescence measured for the eight different selected TIS sequences in the context of two different carbonsources present in the growth medium; glucose or ethanol. In plots (D–E), the TIS sequence order is selected from the TIS library controlling yeGFPexpression under the control of the TEF1 promoter. In plot (C–E), median fluorescence values are shown for at least three biological replicates each basedon at least 5000 single cell measurements.
Downloaded from https://academic.oup.com/nar/advance-article-abstract/doi/10.1093/nar/gky734/5073280by gueston 15 August 2018
Nucleic Acids Research, 2018 7
R2 = 0.90p = 2.8e−4
50
100
150
200
50 100 150 200MFI ADH2
MFI
TEF
1 R2 = 0.98p = 9.97e−7
50
100
150
200
50 100 150 200MFI Ethanol
MFI
Glu
cose
R2 = 0.92p = 1.87e−4
50
100
150
200
50 100 150 200 MFI ymUkG1
MFI
yeG
FP
reporter1
R2 = 0.86p = 8.26e−4
50
100
150
200
50 100 150 200MFI mKate2
MFI
UkG
1reporter2
R2 = 0.75p = 5.65e−3
50
100
150
200
50 100 150 200MFI mKate2
MFI
yeG
FP
reporter3
A B
C D
E
Figure 4. Linear correlations between normalized fluorescence measure-ments for eight TIS sequences in diverse genomic and environmentalcontexts. (A) Correlation between yeGFP fluorescence measurements forthe two tested promoters (TEF1 and ADH2). (B) Correlation betweenyeGFP fluorescence measurements when using the two different carbonsources, glucose or ethanol. (C–E) Correlation between fluorescence mea-surements between each pair of the three different fluorescent reporterstested, ymUkG1, mKate2 and yeGFP. The fluorescence values are meansof normalized median fluorescence values from at least three biologicalreplicates each based on at least 5000 single cell measurements.
values for all 32 strain designs in this study. From this analy-sis, we observed no significant positive correlation (R2 = 3.0× 10⁻³, P = 0.77) (Supplementary Figure S8), which couldindicate that the effect of varying the relative small hexam-eric TISs reported in this study, only have a modest effect onthe minimum free energy observed for the sequence spaceanalyzed (-15 to +50) (21).
Taken together, benchmarking the eight TISs with exist-ing translation initiation prediction tools (8,10,21) and ex-perimentally measured translation efficiencies (58) revealsthat the model output overall correlated with our mea-sured TIS efficiencies. However, when investigating the cor-relation between genome-wide occurrences of the identifiedTISs and their translation efficiency, the numbers are toolow to infer statistical significance. Finally, we observe nosignificant correlation between the TIS strength of the 32different designs studied and the folding propensity of their-15 to +50 regions (21), indicating that the hexameric TISsonly modestly affect folding propensity of the 5′-UTRs.
TISs show context-independent tuning of protein expressionin mammalian cells
In mammalian cells, the TIS sequence RYMRMVAUGGC(Y = U or C, M = A or C, R = A or G and V = A, C orG, start codon underscored) has been reported as a high-efficiency TIS, with positions -4, -3, -2, +4 and +5 as themost critical for efficient translation initiation (8,33). Thisconsensus dictates the use of the CGx anticodon of ala-tRNA following incorporation of the AUG start codon forefficient translation initiation. Our best sequence TCGGTC(motif YYRRYVAUG–) is not fully in accordance withthe earlier reported high-efficiency TIS motif RYMRM-VAUGGC, as it deviates at position no. -6, -4 and -2. More-over, neither does our TIS toolkit take into considerationthe use of specific codons following the AUG start codon.Still, to further investigate if yeast-derived TIS variantsspanning only positions -6 to -1 could also tune context-independent protein expression in mammalian cells, we de-cided to engineer CHO cells, the biotechnology workhorsefor recombinant therapeutic protein production (59). Here,we constructed six CHO cell pools containing three differ-ent TISs derived from our FACS-based selection (Figures 1and 5A) in combination with either meGFP or ZsGreen1,selected for their low sequence similarity, and optimizedfluorescence intensity for CHO cells (Supplementary Fig-ure S1) (48). Additionally, we created a cell pool containingthe mammalian consensus TIS GCCACC (32) in combina-tion with meGFP (Figure 5A and B; Supplementary Fig-ure S10). First, testing meGFP expression in both yeast andCHO cells showed that the TIS strength was maintained be-tween the two chassis and revealed fluorescence measure-ments with almost 10-fold variation between weakest andstrongest TISs (Figure 5B). Importantly, considering the in-herent efficiency of CHO cells for protein production, weobserved that meGFP expression in combination with TISTCGGTC was almost 50% stronger than the mammalianconsensus TIS GCCACC (TIS no. 11) (Figure 5B). More-over, just as was observed in yeast, TISs dictated the fluo-rescence of each of the reporter genes tested (Figure 5C).Finally, we observed strong linear correlations between flu-orescence outputs from yeast versus CHO cells (R2 = 0.98)as well as for mean meGFP versus ZsGreen fluorescencevalues across biological duplicates (R2 = 0.91) (Figure 5D–E).
Tuning metabolic fluxes using modular TISs
The short length and context-independence of TISs makethem particularly useful for engineering regulatory branchpoints of cellular metabolism, similar to earlier reports fromMAGE-derived replacement of SD sequences in bacteria(60). To demonstrate an application of simple tuning of ametabolic branch point by the use of hexameric TIS vari-ants, we aimed to tune metabolic fluxes through the na-tive mevalonate biosynthesis pathway, and the Xanthophyl-lomyces dendrorhous 4-step �-carotene pathway (Figure 6A)(46). Specifically, this included targeting the genes encodingsqualene synthase (ERG9) and the heterologous geranyl-geranyl diphosphate (GGPP) synthase (crtE) at the farne-syl diphosphate (FPP) branch point (Figure 6A), both have
Downloaded from https://academic.oup.com/nar/advance-article-abstract/doi/10.1093/nar/gky734/5073280by gueston 15 August 2018
8 Nucleic Acids Research, 2018
mCherryEF1a pro BGHpA
loxP lox2272
RMCE genomic landing pad
CHO cell
EF1a promeGFP
+ Cre recombinase
meGFP (a.u.)
mC
herr
y (a
.u.)
101 103
101
103
101
103
101
103
101
103
GOI
TIS 1
TIS 5TIS 8
EF1a pro BGHpA
loxP lox2272
RMCE genomic landing pad
CHO cell
GOI
TIS 11
Nor
mal
ized
fluo
resc
ence
1 5 8 11TIS no.
Chassisyeastcho
1 5 8TIS no.
ReportermeGFPZsGreen1-DR
R2 = 0.98p = 0.040
50
100
150
200
0 50 100 150CHO
Yeas
t
ChassisR2 = 0.91p = 4.02e−3
50
100
150
200
0 50 100 150meGFP
ZsG
reen
1-D
R Reporter
50
100
150
200
A B C D
E F
Figure 5. Comparison of interaction effects between TIS sequences and eukaryote chassis. (A) Schematic outline of the RMCE methodology used forintroducing GOI with varying TISs into the genomic landing pad. In this study we compared hexameric TIS no. 1 (TGATAT), 5 (TAGGTT) and 8(TCGGTC), with the mammalian consensus TIS no. 11 (GCCACC). (B) Scatter plots of CHO singlets with genomically integrated reporter meGFP inthe context of TIS no. 1, 5, 8 or 11. Dashed lines indicate the distribution of the gated population from meGFP expressed in the context of TIS no. 11.(C) Comparison of yeast and CHO cells expressing meGFP under the control of varying TISs. (D) Comparison of two reporters (meGFP and ZsGreen1)expressed under the control of varying TISs. (E) Correlation between fluorescence measurements for three TIS sequences in yeast and CHO. (F) Correlationbetween fluorescence measurements for two reporters (meGFP and ZsGreen1) in CHO cells. In (E), the data shown are means of the normalized medianfluorescence for each of the three TIS sequence with paired measurements from (C). In (C–F), the fluorescence values are means of normalized medianfluorescence values from at least two biological replicates each based on at least 5000 single cell measurements.
Phytoene
Lycopene
β-carotene
crtE, Bts1
crtYB
crtI
crtYB
Erg9
GPP
FPP
GGPPSqualene
Acetyl-CoAMevalonate
pathway
sisehtnysoi bl or etS
si seht nysoi bdi onet or a
C
Ergosterol
TIS no. 1: 5: 8:
PGK1 pro: crtE:
pERG9 ERG9
XII-5Cas9
gRNAsDonors+
A B C D
a
b, c
b
a
b, c, d
b, c, d
a
d
d
1_1
1_5
1_8
5_1
5_5
5_8
8_1
8_5
8_8
0 10 20Beta-carotene, (µg/ml)/OD
TIS
com
bina
tion
(Erg
9, c
rtE)
a
a
a
b
b
1_1
1_5
1_8
5_1
5_5
5_8
8_1
8_5
8_8
0.0 0.1 0.2Growth rate, h−1
TIS
com
bina
tion,
(Erg
9, c
rtE)
Figure 6. Effect of balancing Erg9 and crtE protein expression on carotenoid production. (A) Map of the carotenoid pathway and its connection to thenative metabolism in yeast. The dashed lined boxes indicate sectioned native and heterologous metabolic pathways, with the branch point genes, Erg9 andcrtE, colored in red. (B) Schematic outline of the TISs tested and the genome engineering approach (top), and the resulting phenotypic landscape observedfrom multiplex TIS targeting of crtE (on Chr. XII-5) and Erg9 loci on the yeast genome (bottom). (C and D) �-Carotene quantification and phenotypeof carotenoid strains with variable duplex TISs controlling the expression of Erg9 and CrtE. Mean �-carotene content and maximum specific growth rateare shown (with standard errors, n = 6). Mean values with different lettering are significantly different according to pairwise Tukey HSD test (P < 0.05).Phenotypes are depicting three biological replicates.
earlier been reported to impact isoprenoid production inyeast (43,61,62).
Here, starting from a baseline strain with Cas9 and the4-step �-carotene pathway genes integrated, we performeda one-pot transformation of a double guide RNA (gRNA)construct and repair templates introducing TISs (no. 1, 5and 8) controlling the expression of ERG9 at the native site,as well as the crtE under the control of the PGK1 promotergenomically integrated at EasyClone site XII-5 (Figure 6B).
Following library transformation, colonies stably dis-played diverse carotenoid-associated orange coloring andcolony sizes (Figure 6B). Having observed the wide phe-notypic distribution offered from combinatorial perturba-tion of TISs, we next re-constructed nine defined designs
by duplex integration of TISs no. 1, 5 and 8 to controlErg9 and CrtE protein expression in all combinations inour background strain (Figure 6B) (46), and then quanti-fied �-carotene levels as well as measured growth rates forall designs. From this analysis we observed up to 16-folddifferences in �-carotene levels (Figure 6C), as well as up to50% differences in growth rate (Figure 6D, and Supplemen-tary Figure S11, R2 = 0.79–0.99 with a mean R2 = 0.97).Though no linear effect between fitness and production wasobserved, it is evident that stronger TISs (TISs 5 or 8) areneeded to drive the expression of crtE in order to direct fluxtoward carotenoid production (Figure 6C). Interestingly,the strains with TIS 1 controlling ERG9 showed the high-est growth rates. This finding is surprising in light of Erg9p
Downloaded from https://academic.oup.com/nar/advance-article-abstract/doi/10.1093/nar/gky734/5073280by gueston 15 August 2018
Nucleic Acids Research, 2018 9
being an essential enzymatic step for conversion of FPP tosqualene. However, acknowledging the intricate transcrip-tional and product-inhibited regulation of Erg9, low trans-lation initiation efficiency of Erg9 could relieve ergosterolfeedback inhibition and lead to upregulation of transcrip-tion (63,64). Alternatively, we could imagine the accumu-lation of toxic intermediates causing a reduction in growthrates for some of the strains with TISs 5 and 8 engineeredto control Erg9 translation initiation (65).
Taken together, this example corroborates the simple de-sign, rapid construction and testing of intricately regu-lated production and fitness landscapes offered from librarytransformations of hexameric TIS variants.
DISCUSSION
In this study, we have characterized and classified hexam-eric TISs according to their impact on protein expressionin yeast and mammalian cells. Starting from three TIS li-braries collectively covering 4739 TIS variants in yeast, weidentified TISs that can tune protein expression up to 10-fold irrespective of the diverse genomic (38–54% similar-ity of the -54 to +13 positions, Supplementary Figure S1)and environmental (cell density or growth medium) condi-tions. Importantly, in terms of applicability, we showed thatTIS TCGGTC was stronger than the mammalian consen-sus TIS GCCACC frequently used for protein productionin CHO cells, and that a multiplex transformation of TISvariants targeting an essential metabolic branch point couldbe used to probe the production and fitness landscape ofyeast cell factory designs. Though the combined use of largede novo synthesized TIS libraries and FACS screens to de-duce sequence to function relationships has recently beenreported in both bacteria and eukaryotes (6–9,66), the se-quence space (positions -6 to -1) covered in this study isto our knowledge the smallest space systematically stud-ied in broad genomic and environmental contexts, yet thedynamic range covered is similar to variants selected fromlarger TIS sequence spaces (7). Moreover, as the TISs char-acterized in this study only cover positions upstream theAUG start codon, protein expression of any ORF shouldtechnically be possible by a simple hexameric 5′-end primerextension using said ORF as a template. As such, both scal-ability and cost-effectiveness in both design and construc-tion of engineered cells are ensured.
In the further positioning of our findings in relation toearlier studies, we find the five strongest TISs identified inour study have a purine at position -3 (Figure 3), consis-tent with earlier studies (33,34). Also, the degree of tunabil-ity observed in this study is similar to the ∼7-fold changesin protein expression observed from studies characterizinglarger 5′-UTR sequence space (e.g positions -50 to -1 or -6 to+5) (7,8), underscoring the potential to use hexameric TISsfor efficient protein expression tuning. Interestingly, amongthe five different fluorescent reporter genes tested in thisstudy, the ones displaying the largest tunability in the con-text of varying TISs are the yeGFP and mammalian GFP(Figures 3 and 5; Supplementary Figure S1). The ORFsof these two genes are the only ones not having a guanineat position +4, otherwise reported to be important for ef-ficient translation initiation (8,33–34), suggesting that the
TISs identified in this study could be recalcitrant to ORFsequence diversity at this exact position.
More generally speaking, one immediate observationfrom studies of TISs in eukaryotes is that even though smallTIS sequence spaces can robustly tune protein expressionin a predictable manner, the degree of tuning is several or-ders of magnitude lower than the tuning offered by TISvariants in bacteria (6,67). This is largely due to more in-tricate regulatory mechanisms associated with translationinitiation in eukaryotes compared to bacteria, including ri-bosome scanning mode-of-action, longer 5′-UTRs, 5′-endcapping of mRNA, assembly of eukaryotic initiation fac-tors, internal ribosome entry sites, uAUGs and uORFs ob-served in eukaryotes (10). Yet, engineering excessively short5′-UTR (≤20 nt) may not provide TISs with higher tunabil-ity, as genome-wide mapping of yeast 5′-UTRs with suchshort 5′-UTRs has been observed to be detrimental to trans-lation initiation control and exhibit below-average transla-tional efficiency (68), and hence is not considered a viableroute to dereplicate the impact combinations of native 5′-UTR elements would have on translation initiation.
Furthermore, looking ahead, it is important to considersystem-level limitations of protein expression (69), and con-tinue to improve current and new models for predicting TISstrengths in broad genomic contexts and, cellular and envi-ronmental conditions (5–10). Also, from the range of fluo-rescent outputs observed in our TIS libraries in three pro-moter contexts (Figure 2), it is evident that the native tran-scriptional regulation, conferred by promoter usage, con-trols the absolute quantitative impact TISs will have on pro-tein expression, as was recently reported from genome-widestudies in yeast (58). As such, we envision that in orderto engineer synthetic translation initiation elements withhigher dynamic output ranges based on the existing featuresof the translation machinery, a more detailed understand-ing of both cis and trans initiation mechanisms is expectedto enhance our ability to predictably control larger spans ofprotein expression levels.
Finally, when quantifying changes in protein expressionwithin an order of magnitude as observed from varyingshort TISs, mitigating experimental noise and conformingto standardized experimental procedures become essentialfor deducting sequence–function relationships (7,70). Withthe ongoing development of advanced genome engineeringtechnologies, especially in relation to <100-bp edits (71,72),and the drop in DNA synthesis costs, we expect that TISswill be particularly useful baits for multiplex targeting, tun-ing and optimization of protein expression levels in robustgenomic contexts, thereby expectedly improving signal-to-noise ratios, and ultimately enabling predictable and ratio-nal tuning of genetic circuits and cellular behavior.
SUPPLEMENTARY DATA
Supplementary Data are available at NAR Online.
ACKNOWLEDGEMENTS
The authors would like to thank Saranya Nallapareddy forhelp with CHO transfections, Nachon Charanyanonda Pe-tersen for help with flow cytometry analyses, and Larissa
Downloaded from https://academic.oup.com/nar/advance-article-abstract/doi/10.1093/nar/gky734/5073280by gueston 15 August 2018
Tramontin and Kanchana Kildegaard for help with HPLC.Also, a warm thanks to colleagues at the Novo NordiskFoundation Center for Biosustainability for fruitful discus-sions and comments.
FUNDING
Novo Nordisk Foundation; European Commission Hori-zon 2020 programme (PAcMEN, No. 722287). Funding foropen access charge: Novo Nordisk Foundation and Euro-pean Commission HZ2020 Programme.Conflict of interest statement. J.D.K. has a financial interestin Amyris, Lygos, Demetrix, Constructive Biology, MapleBio and Napigen.
REFERENCES1. Sonenberg,N. and Hinnebusch,A.G. (2009) Regulation of translation
initiation in eukaryotes: mechanisms and biological targets. Cell, 136,731–745.
2. Jackson,R.J., Hellen,C.U.T. and Pestova,T.V. (2010) The mechanismof eukaryotic translation initiation and principles of its regulation.Nat. Rev. Mol. Cell Biol., 11, 113–127.
3. Allen,G.S., Zavialov,A., Gursky,R., Ehrenberg,M. and Frank,J.(2005) The cryo-EM structure of a translation initiation complexfrom Escherichia coli. Cell, 121, 703–712.
4. Seo,S.W., Yang,J.-S., Kim,I., Yang,J., Min,B.E., Kim,S. and Jung,G.Y.(2013) Predictive design of mRNA translation initiation region tocontrol prokaryotic translation efficiency. Metab. Eng., 15, 67–74.
5. Salis,H.M. (2011) The ribosome binding site calculator. MethodsEnzymol., 498, 19–42.
6. Bonde,M.T., Pedersen,M., Klausen,M.S., Jensen,S.I., Wulff,T.,Harrison,S., Nielsen,A.T., Herrgard,M.J. and Sommer,M.O.A. (2016)Predictable tuning of protein expression in bacteria. Nat. Methods,13, 233–236.
7. Dvir,S., Velten,L., Sharon,E., Zeevi,D., Carey,L.B., Weinberger,A.and Segal,E. (2013) Deciphering the rules by which 5′-UTRsequences affect protein expression in yeast. Proc. Natl. Acad. Sci.U.S.A., 110, E2792–E2801.
8. Noderer,W.L., Flockhart,R.J., Bhaduri,A., Diaz de Arce,A.J.,Zhang,J., Khavari,P.A. and Wang,C.L. (2014) Quantitative analysisof mammalian translation initiation sites by FACS-seq. Mol. Syst.Biol., 10, 748.
9. Cuperus,J.T., Groves,B., Kuchina,A., Rosenberg,A.B., Jojic,N.,Fields,S. and Seelig,G. (2017) Deep learning of the regulatorygrammar of yeast 5′ untranslated regions from 500,000 randomsequences. Genome Res., 27, 2015–2024.
10. Decoene,T., Peters,G., De Maeseneire,S.L. and De Mey,M. (2018)Toward predictable 5′UTRs in saccharomyces cerevisiae:development of a yUTR calculator. ACS Synth. Biol., 7, 622–634.
12. Shine,J. and Dalgarno,L. (1974) The 3′-terminal sequence ofEscherichia coli 16S ribosomal RNA: complementarity to nonsensetriplets and ribosome binding sites. Proc. Natl. Acad. Sci. U.S.A., 71,1342–1346.
13. Ludwig,P., Huber,M., Lehr,M., Wegener,M., Zerulla,K., Lange,C.and Soppa,J. (2018) Non-canonical Escherichia coli transcriptslacking a Shine-Dalgarno motif have very different translationalefficiencies and do not form a coherent group. Microbiology, 164,646–658.
14. Leppek,K., Das,R. and Barna,M. (2017) Functional 5′ UTR mRNAstructures in eukaryotic translation regulation and how to find them.Nat. Rev. Mol. Cell Biol., 19, 158–174.
15. Grillo,G., Turi,A., Licciulli,F., Mignone,F., Liuni,S., Banfi,S.,Gennarino,V.A., Horner,D.S., Pavesi,G., Picardi,E. et al. (2010)UTRdb and UTRsite (RELEASE 2010): a collection of sequencesand regulatory motifs of the untranslated regions of eukaryoticmRNAs. Nucleic Acids Res., 38, D75–D80.
16. Tuller,T., Kupiec,M. and Ruppin,E. (2009) Co-evolutionary networksof genes and cellular processes across fungal species. Genome Biol.,10, R48.
17. Ringner,M. and Krogh,M. (2005) Folding free energies of 5′-UTRsimpact post-transcriptional regulation on a genomic scale in yeast.PLoS Comput. Biol., 1, e72.
18. Hinnebusch,A.G., Dever,T.E. and Asano,K. (2007) 9 Mechanism oftranslation initiation in the yeast saccharomyces cerevisiae. ColdSpring Harbor Monogr. Arch., 48, 225–268.
19. Zhang,Z. and Dietrich,F.S. (2005) Mapping of transcription startsites in Saccharomyces cerevisiae using 5′ SAGE. Nucleic Acids Res.,33, 2838–2851.
20. Kozak,M. (2005) Regulation of translation via mRNA structure inprokaryotes and eukaryotes. Gene, 361, 13–37.
21. Robbins-Pianka,A., Rice,M.D. and Weir,M.P. (2010) The mRNAlandscape at yeast translation initiation sites. Bioinformatics, 26,2651–2655.
22. Kochetov,A.V. (2005) AUG codons at the beginning of proteincoding sequences are frequent in eukaryotic mRNAs with asuboptimal start codon context. Bioinformatics, 21, 837–840.
23. Nakagawa,S., Niimura,Y., Gojobori,T., Tanaka,H. and Miura,K.-I.(2008) Diversity of preferred nucleotide sequences around thetranslation initiation codon in eukaryote genomes. Nucleic AcidsRes., 36, 861–871.
24. Tzani,I., Ivanov,I.P., Andreev,D.E., Dmitriev,R.I., Dean,K.A.,Baranov,P.V., Atkins,J.F. and Loughran,G. (2016) Systematic analysisof the PTEN 5′ leader identifies a major AUU initiated proteoform.Open Biol., 6, 150203.
25. Ben-Yehezkel,T., Zur,H., Marx,T., Shapiro,E. and Tuller,T. (2013)Mapping the translation initiation landscape of an S. cerevisiae geneusing fluorescent proteins. Genomics, 102, 419–429.
26. Diaz de Arce,A.J., Noderer,W.L. and Wang,C.L. (2018) Completemotif analysis of sequence requirements for translation initiation atnon-AUG start codons. Nucleic Acids Res., 46, 985–994.
27. Chew,G.-L., Pauli,A. and Schier,A.F. (2016) Conservation of uORFrepressiveness and sequence features in mouse, human and zebrafish.Nat. Commun., 7, 11663.
28. Tholen,M., Hillebrand,L.E., Tholen,S., Sedelmeier,O., Arnold,S.J.and Reinheckel,T. (2014) Out-of-frame start codons preventtranslation of truncated nucleo-cytosolic cathepsin L in vivo. Nat.Commun., 5, 4931.
29. Zur,H. and Tuller,T. (2013) New universal rules of eukaryotictranslation initiation fidelity. PLoS Comput. Biol., 9, e1003136.
30. Kozak,M. (1986) Influences of mRNA secondary structure oninitiation by eukaryotic ribosomes. Proc. Natl. Acad. Sci. U.S.A., 83,2850–2854.
31. Kozak,M. (1987) At least six nucleotides preceding the AUG initiatorcodon enhance translation in mammalian cells. J. Mol. Biol., 196,947–950.
32. Kozak,M. (1987) An analysis of 5′-noncoding sequences from 699vertebrate messenger RNAs. Nucleic Acids Res., 15, 8125–8148.
33. Kozak,M. (1995) Adherence to the first-AUG rule when a secondAUG codon follows closely upon the first. Proc. Natl. Acad. Sci.U.S.A., 92, 2662–2666.
34. Harte,R.A., Farrell,C.M., Loveland,J.E., Suner,M.-M., Wilming,L.,Aken,B., Barrell,D., Frankish,A., Wallin,C., Searle,S. et al. (2012)Tracking and coordinating an international curation effort for theCCDS Project. Database, 2012, bas008.
35. Pesole,G., Gissi,C., Grillo,G., Licciulli,F., Liuni,S. and Saccone,C.(2000) Analysis of oligonucleotide AUG start codon context ineukariotic mRNAs. Gene, 261, 85–91.
37. Gietz,R.D. and Schiestl,R.H. (2007) Quick and easy yeasttransformation using the LiAc/SS carrier DNA/PEG method. Nat.Protoc., 2, 35–37.
38. Jensen,N.B., Strucko,T., Kildegaard,K.R., David,F., Maury,J.J.,Mortensen,U.H., Forster,J., Nielsen,J. and Borodina,I. (2014)EasyClone: Method for iterative chromosomal integration of multiplegenes in Saccharomyces cerevisiae. FEMS Yeast Res., 14, 238–248.
39. Cormack,B.P., Bertram,G., Egerton,M., Gow,N.A., Falkow,S. andBrown,A.J. (1997) Yeast-enhanced green fluorescent protein
Downloaded from https://academic.oup.com/nar/advance-article-abstract/doi/10.1093/nar/gky734/5073280by gueston 15 August 2018
Nucleic Acids Research, 2018 11
(yEGFP): a reporter of gene expression in Candida albicans.Microbiology, 143, 303–311.
40. Bernard,P., Gabant,P., Bahassi,E.M. and Couturier,M. (1994)Positive-selection vectors using the F plasmid ccdB killer gene. Gene,148, 71–74.
41. Jessop-Fabre,M.M., Jakociunas,T., Stovicek,V., Dai,Z., Jensen,M.K.,Keasling,J.D. and Borodina,I. (2016) EasyClone-MarkerFree: avector toolkit for marker-less integration of genes into Saccharomycescerevisiae via CRISPR-Cas9. Biotechnol. J., 11, 1110–1117.
42. Jakociunas,T., Rajkumar,A.S., Zhang,J., Arsovska,D., Rodriguez,A.,Jendresen,C.B., Skjødt,M.L., Nielsen,A.T., Borodina,I., Jensen,M.K.et al. (2015) CasEMBLR: Cas9-Facilitated multiloci genomicintegration of in vivo assembled DNA parts in Saccharomycescerevisiae. ACS Synth. Biol., 4, 1226–1234.
44. Kaishima,M., Ishii,J., Matsuno,T., Fukuda,N. and Kondo,A. (2016)Expression of varied GFPs in Saccharomyces cerevisiae: codonoptimization yields stronger than expected expression andfluorescence intensity. Sci. Rep., 6, 35932.
45. Lee,S., Lim,W.A. and Thorn,K.S. (2013) Improved blue, green, andred fluorescent protein tagging vectors for S. cerevisiae. PLoS One, 8,e67902.
46. Verwaal,R., Wang,J., Meijnen,J.P., Visser,H., Sandmann,G., Van DenBerg,J.A. and Van Ooyen,A.J.J. (2007) High-level production ofbeta-carotene in Saccharomyces cerevisiae by successivetransformation with carotenogenic genes from Xanthophyllomycesdendrorhous. Appl. Environ. Microbiol., 73, 4342–4350.
47. Lee,J.S., Kallehauge,T.B., Pedersen,L.E. and Kildegaard,H.F. (2015)Site-specific integration in CHO cells mediated by CRISPR/Cas9 andhomology-directed DNA repair pathway. Sci. Rep., 5, 8572.
48. Grav,L.M., Lee,J.S., Gerling,S., Kallehauge,T.B., Hansen,A.H.,Kol,S., Lee,G.M., Pedersen,L.E. and Kildegaard,H.F. (2015)One-step generation of triple knockout CHO cell lines usingCRISPR/Cas9 and fluorescent enrichment. Biotechnol. J., 10,1446–1456.
50. Petzoldt,T. (2017) growthrates: Estimate Growth Rates fromExperimental Data. R package version 0.7.1.https://CRAN.R-project.org/package=growthrates.
51. Kildegaard,K.R., Adiego-Perez,B., Domenech Belda,D.,Khangura,J.K., Holkenbrink,C. and Borodina,I. (2017) Engineeringof Yarrowia lipolytica for production of astaxanthin. Synth. Syst.Biotechnol., 2, 287–294.
52. Kozak,M. (1986) Point mutations define a sequence flanking theAUG initiator codon that modulates translation by eukaryoticribosomes. Cell, 44, 283–292.
53. Lee,M.E., Aswani,A., Han,A.S., Tomlin,C.J. and Dueber,J.E. (2013)Expression-level optimization of a multi-enzyme pathway in theabsence of a high-throughput assay. Nucleic Acids Res., 41,10668–10678.
54. Tuite,M.F., Dobson,M.J., Roberts,N.A., King,R.M., Burke,D.C.,Kingsman,S.M. and Kingsman,A.J. (1982) Regulated high efficiencyexpression of human interferon-alpha in Saccharomyces cerevisiae.EMBO J., 1, 603–608.
55. Zhang,L., Patel,H.N., Lappe,J.W. and Wachter,R.M. (2006) Reactionprogress of chromophore biogenesis in green fluorescent protein. J.Am. Chem. Soc., 128, 4766–4772.
56. Salis,H.M., Mirsky,E.A. and Voigt,C.A. (2009) Automated design ofsynthetic ribosome binding sites to control protein expression. Nat.Biotechnol., 27, 946–950.
57. Reider Apel,A., d’Espaux,L., Wehrs,M., Sachs,D., Li,R.A.,Tong,G.J., Garber,M., Nnadi,O., Zhuang,W., Hillson,N.J. et al.(2017) A Cas9-based toolkit to program gene expression inSaccharomycescerevisiae. Nucleic Acids Res., 45, 496–508.
58. Lahtvee,P.-J., Sanchez,B.J., Smialowska,A., Kasvandik,S.,Elsemman,I.E., Gatto,F. and Nielsen,J. (2017) Absolutequantification of protein and mRNA abundances demonstratevariability in Gene-Specific translation efficiency in yeast. Cell Syst.,4, 495–504.
59. Kim,J.Y., Kim,Y.-G. and Lee,G.M. (2012) CHO cells inbiotechnology for production of recombinant proteins: current stateand further potential. Appl. Microbiol. Biotechnol., 93, 917–930.
60. Wang,H.H., Isaacs,F.J., Carr,P.A., Sun,Z.Z., Xu,G., Forest,C.R. andChurch,G.M. (2009) Programming cells by multiplex genomeengineering and accelerated evolution. Nature, 460, 894–898.
61. Ro,D.-K., Paradise,E.M., Ouellet,M., Fisher,K.J., Newman,K.L.,Ndungu,J.M., Ho,K.A., Eachus,R.A., Ham,T.S., Kirby,J. et al.(2006) Production of the antimalarial drug precursor artemisinic acidin engineered yeast. Nature, 440, 940–943.
62. Mitchell,L.A., Chuang,J., Agmon,N., Khunsriraksakul,C.,Phillips,N.A., Cai,Y., Truong,D.M., Veerakumar,A., Wang,Y.,Mayorga,M. et al. (2015) Versatile genetic assembly system (VEGAS)to assemble pathways for expression in S. cerevisiae. Nucleic AcidsRes., 43, 6620–6630.
63. Asadollahi,M.A., Maury,J., Møller,K., Nielsen,K.F., Schalk,M.,Clark,A. and Nielsen,J. (2008) Production of plant sesquiterpenes inSaccharomyces cerevisiae: effect of ERG9 repression on sesquiterpenebiosynthesis. Biotechnol. Bioeng., 99, 666–677.
64. Smith,S.J., Crowley,J.H. and Parks,L.W. (1996) Transcriptionalregulation by ergosterol in the yeast Saccharomyces cerevisiae. Mol.Cell. Biol., 16, 5427–5432.
65. Martin,V.J.J., Pitera,D.J., Withers,S.T., Newman,J.D. andKeasling,J.D. (2003) Engineering a mevalonate pathway inEscherichia coli for production of terpenoids. Nat. Biotechnol., 21,796–802.
66. Ben Yehezkel,T., Rival,A., Raz,O., Cohen,R., Marx,Z., Camara,M.,Dubern,J.-F., Koch,B., Heeb,S., Krasnogor,N. et al. (2016) Synthesisand cell-free cloning of DNA libraries using programmablemicrofluidics. Nucleic Acids Res., 44, e35.
67. Espah Borujeni,A., Channarasappa,A.S. and Salis,H.M. (2014)Translation rate is controlled by coupled trade-offs between siteaccessibility, selective RNA unfolding and sliding at upstreamstandby sites. Nucleic Acids Res., 42, 2646–2659.
68. Arribere,J.A. and Gilbert,W.V. (2013) Roles for transcript leaders intranslation and mRNA decay revealed by transcript leadersequencing. Genome Res., 23, 977–987.
69. Huang,M., Bao,J., Hallstrom,B.M., Petranovic,D. and Nielsen,J.(2017) Efficient protein production by yeast requires global tuning ofmetabolism. Nat. Commun., 8, 1131.
70. Canton,B., Labno,A. and Endy,D. (2008) Refinement andstandardization of synthetic biological parts and devices. Nat.Biotechnol., 26, 787–793.
71. Garst,A.D., Bassalo,M.C., Pines,G., Lynch,S.A.,Halweg-Edwards,A.L., Liu,R., Liang,L., Wang,Z., Zeitoun,R.,Alexander,W.G. et al. (2016) Genome-wide mapping of mutations atsingle-nucleotide resolution for protein, metabolic and genomeengineering. Nat. Biotechnol., 35, 48–55.
72. Barbieri,E.M., Muir,P., Akhuetie-Oni,B.O., Yellman,C.M. andIsaacs,F.J. (2017) Precise editing at DNA replication forks enablesmultiplex genome engineering in eukaryotes. Cell, 171, 1453–1467.
Downloaded from https://academic.oup.com/nar/advance-article-abstract/doi/10.1093/nar/gky734/5073280by gueston 15 August 2018