JOURNALOF NEUROPHYSIOLOGY Vol. 51, No. 4, April 1984. Printed in U.S.A. Modular Distribution of Neurons With Slowly Adapting and Rapidly Adapting Responses in Area 3b of Somatosensory Cortex in Monkeys MRIGANKA SUR, JOHN T. WALL, AND JON H. KAAS Departments of PsychoZogy and Anatomy, Vanderbilt University, Nashville, Tennessee 37240 SUMMARY AND CONCLUSIONS 1. Recordings from the representations of the glabrous digits in area 3b of the somato- sensory cortex of owl and macaque monkeys revealed two types of neurons. Rapidly adapt- ing (RA) neurons responded only at the onset and offset of a l-s skin indentation. Slowly adapting (SA) neurons also responded to stimulus onset and offset but, in addition, they responded throughout the l-s skin indenta- tion. 2. RA neurons were found in all cortical layers while SA neurons were found only in the middle cortical layers. In electrode pen- etrations perpendicular to the layers, some penetrations encountered only RA neurons (RA penetrations), while other penetrations first encountered RA neurons, then SA neu- rons, and finally RA neurons again (SA pen- etrations). 3. When closely spaced electrode penetra- tions were made throughout the representation of a single digit, it was apparent that RA and SA penetrations were not randomly distrib- uted. The distribution suggested the existence of separate clusters or bands of SA and RA neurons in the middle layers of cortex. The predominant orientation of the SA and RA regions was rostrocaudally along the lengths of the digit representations. The SA and RA bands varied in width, had no systematic po- sition in the representation of individual digits, and often crossed from the representation of one digit to another. 4. Because of overlapping receptive fields for neurons in adjoining bands, the SA and RA bands appeared to represent the digits separately. This would allow all skin surfaces for each digit to be subserved by both types of neurons. INTRODUCTION In early landmark studies of somatosensory cortex, Mountcastle (29) proposed that cortical areas are not uniform in function and instead are divided into functionally distinct modules or vertical “columns” of cells. The concept of modular organization within cortical fields has received considerable support, especially for primary visual cortex (seeRef. 2 1 for review), and it is obviously important to consider the issue of how cell classes are distributed within any cortical area. For the present study we considered the distributions of two types of neurons in area 3b of the somatosensory cortex of monkeys. In our previous electrophysio- logical mapping studies of area 3b in monkeys (8, 23, 28, 34, 41) and prosimians (40), we noted that while neurons throughout the rep- resentation were activated by cutaneous stim- uli, some of these neurons responded to only stimulus change, while others continued to respond to a steady indentation. Others have described these two classes of neurons in so- matosensory cortex and have referred to them as rapidly (fast or quickly) adapting (RA) and slowly adapting (SA) neurons (2, 5, 7, 18, 29, 3 1, 37). In order to determine the area1and laminar distribution of thesetwo types of neu- rons, it was necessary to record and classify large numbers of neurons in a restricted region of cortex. We decided to use an electrome- chanical stimulator and simply determine if neurons at given recording sitesresponded to the transients of a l-s skin indentation, and thereby would be classified as RA, or re- sponded also during the steady-state inden- 724 0022-3077/84 $1.50 Copyright 0 1984 The American Physiological Society
Transcript
JOURNALOF NEUROPHYSIOLOGY Vol. 51, No. 4, April 1984. Printed in U.S.A.
Modular Distribution of Neurons With Slowly Adapting and Rapidly Adapting Responses in Area 3b of Somatosensory Cortex in Monkeys
MRIGANKA SUR, JOHN T. WALL, AND JON H. KAAS
Departments of PsychoZogy and Anatomy, Vanderbilt University, Nashville, Tennessee 37240
SUMMARY AND CONCLUSIONS
1. Recordings from the representations of the glabrous digits in area 3b of the somato- sensory cortex of owl and macaque monkeys revealed two types of neurons. Rapidly adapt- ing (RA) neurons responded only at the onset and offset of a l-s skin indentation. Slowly adapting (SA) neurons also responded to stimulus onset and offset but, in addition, they responded throughout the l-s skin indenta- tion.
2. RA neurons were found in all cortical layers while SA neurons were found only in the middle cortical layers. In electrode pen- etrations perpendicular to the layers, some penetrations encountered only RA neurons (RA penetrations), while other penetrations first encountered RA neurons, then SA neu- rons, and finally RA neurons again (SA pen- etrations).
3. When closely spaced electrode penetra- tions were made throughout the representation of a single digit, it was apparent that RA and SA penetrations were not randomly distrib- uted. The distribution suggested the existence of separate clusters or bands of SA and RA neurons in the middle layers of cortex. The predominant orientation of the SA and RA regions was rostrocaudally along the lengths of the digit representations. The SA and RA bands varied in width, had no systematic po- sition in the representation of individual digits, and often crossed from the representation of one digit to another.
4. Because of overlapping receptive fields for neurons in adjoining bands, the SA and RA bands appeared to represent the digits separately. This would allow all skin surfaces
for each digit to be subserved by both types of neurons.
INTRODUCTION
In early landmark studies of somatosensory cortex, Mountcastle (29) proposed that cortical areas are not uniform in function and instead are divided into functionally distinct modules or vertical “columns” of cells. The concept of modular organization within cortical fields has received considerable support, especially for primary visual cortex (see Ref. 2 1 for review), and it is obviously important to consider the issue of how cell classes are distributed within any cortical area. For the present study we considered the distributions of two types of neurons in area 3b of the somatosensory cortex of monkeys. In our previous electrophysio- logical mapping studies of area 3b in monkeys (8, 23, 28, 34, 41) and prosimians (40), we noted that while neurons throughout the rep- resentation were activated by cutaneous stim- uli, some of these neurons responded to only stimulus change, while others continued to respond to a steady indentation. Others have described these two classes of neurons in so- matosensory cortex and have referred to them as rapidly (fast or quickly) adapting (RA) and slowly adapting (SA) neurons (2, 5, 7, 18, 29, 3 1, 37). In order to determine the area1 and laminar distribution of these two types of neu- rons, it was necessary to record and classify large numbers of neurons in a restricted region of cortex. We decided to use an electrome- chanical stimulator and simply determine if neurons at given recording sites responded to the transients of a l-s skin indentation, and thereby would be classified as RA, or re- sponded also during the steady-state inden-
724 0022-3077/84 $1.50 Copyright 0 1984 The American Physiological Society
MODULAR DISTRIBUTION OF NEURONS 725
tation, and thereby would be classified as SA. Our previous understanding of the somato- topic organization of area 3b in owl and ma- caque monkeys (28, 34) allowed us to explore the complete representation of a given body part in great detail with a finely spaced grid of electrode penetrations. Because of the large number of recordings that were required for any given region of area 3b, it was impractical to study all parts, and the experiments typically concentrated on the representation of the gla- brous surface of a single digit of the hand, often digit 3 or 4. The experiments were con- ducted on New World owl monkeys, where the exposed somatosensory cortex was more easily studied, and on Old World macaque monkeys, where results may be more appli- cable to higher primates, including humans. For a preliminary report, see Ref. 42.
METHODS
Experiments were conducted on six adult owl monkeys (Lotus trivirgatus) and nine adult ma- caque monkeys (Macaca fascicularis). The monkeys were anesthetized with ketamine HCl (35 mg/kg, im) and the parietal cortex was exposed for re- cording. In some monkeys, recording stability was achieved by exposing a wide region of cortex, com- parable to that exposed in microelectrode mapping experiments (28, 34). A well constructed of acrylic plastic held silicone fluid over the brain. In other monkeys, a Plexiglas chamber was cemented over a smaller opening, and brain pulsations in the chamber were reduced by a layer of a 4% agar solution covered with dental wax. In both prepa- rations, glass-insulated platinum-iridium electrodes (2- 10 Ma at 1 kHz) were used to record neural activity within area 3b.
The goal in each experiment was to sample neu- rons in the cortical representation of a single digit densely. In owl monkeys, where the relevant cortex is exposed on the surface of the brain, electrode penetrations were made normal to the cortical sur- face and spaced in a grid of 3040 penetrations per square millimeter of tissue. The spacing of electrode penetrations was not completely regular, since sur- face blood vessels were avoided, but electrode pen- etration separations of loo-250 pm were typical, and as many as 58 penetrations were made within the representation of a single digit. In macaque monkeys, the relevant portion of area 3b is hidden in the caudal bank of the central sulcus. Thus, in order to make electrode penetrations that were nor- mal to the surface of area 3b, it was necessary to extend penetrations caudally through the motor cortex. Alternatively, electrode penetrations were angled more vertically into the postcentral gyrus
so as to traverse long portions of the underlying area 3b.
In all penetrations, an effort was made to examine response properties of single units along a sequence of recording sites as the electrode was advanced through cortex. Conventional procedures were used to isolate the action potentials of single cortical neurons with a window discriminator and to mon- itor the stability and waveform of isolated units with an oscilloscope and an audio monitor. For some of the recording sites, however, complete iso- lation of a single unit was not achieved. Rather than lose information at those sites, the window discriminator was adjusted to accept the discharges from several of the larger amplitude spikes. These procedures allowed us typically to obtain recordings at 50- to loo-pm intervals along each electrode tract: all recordings of neural spikes were compiled into peristimulus histograms with a PDP-8 com- puter.
The response of the single neuron or the neuron cluster at each recording site was classified as rapidly adapting (RA), if there was no slowly adapting component, and slowly adapting (SA), if such a component was detected. In order to classify the response, the receptive-field location was first de- termined with hand-held stimuli. Next, the probe of an electromechanical stimulator (I) was centered in the receptive field. The stimulator produced a repeating trapezoidal skin indentation with l-s on and off times and 25.5-ms rise and fall times. In- dentation depths of either 500 or 700 pm were used in different experiments, since such indentations produce responses that are intermediate between threshold and saturation for most cortical units (30) as well as for primary afferent units (IO). A peri- stimulus time (PST) histogram of the response was obtained at each recording site for classification into SA or RA types (see RESULTS). Lesions were made along or at the ends of selected electrode penetrations by passing current through the re- cording electrode (5- 10 PA/~ s). These lesions were later used to assign depths to recording sites.
At the end of each recording experiment, the monkey was perfused with saline followed by 10% formal-saline and the explored portion of the brain was frozen and cut in the parasagittal plane. Sections stained with cresyl violet were examined for mi- crolesions and were used to reconstruct the mapped region of the brain.
RESULTS
The major results of this study concern the vertical and area1 distributions of SA and RA neurons within area 3b of the somatosensory cortex in owl and macaque monkeys. Similar results were obtained from both monkeys and are described in turn for each.
726 SUR, WALL, AND KAAS
For both owl and macaque monkeys, neu- rons in all electrode penetrations in the por- tions of area 3b devoted to digits of the hand (Fig. 1) responded to skin indentation. Within individual penetrations, cutaneously driven neurons were found over a range of depths from near the cortical surface to near the white matter. All responsive neurons had increased discharge rates during stimulus onset and off- set transients, but only some of these contin- ued to respond to maintained skin indenta- tions. All neurons that responded at a higher than spontaneous rate during maintained skin indentation were classified as slowly adapting (SA), while all neurons with increased firing rates only at stimulus change were classified as rapidly adapting (RA). At sites where the activity of more than one neuron was re- corded, a slowly adapting component classified the site as SA. Thus, in the present analysis,
SA sites have a slowly adapting component but could also have a rapidly adapting co’m- ponent, while RA sites had no detectable slowly adapting component.
Verlical distribution of SA and RA neuruas in owl monkeys
One important observation was that while both SA and RA recording sites were found in the middle layers of the cortex in owl mon- keys, only RA sites were found deep and su- perficial to the middle layers. In “vertical” electrode penetrations passing perpendicularly through the cortical layers, either a continuous sequence of RA sites was noted or the re- cording sites changed from IRA to SA in the middle layers and then back to RA in the deep layers.
Figure 2 illustrates a penetration typical of those containing both RA and SA neurons.
I FACE
AREA ‘3B HAND REPRESENTATION
AL t
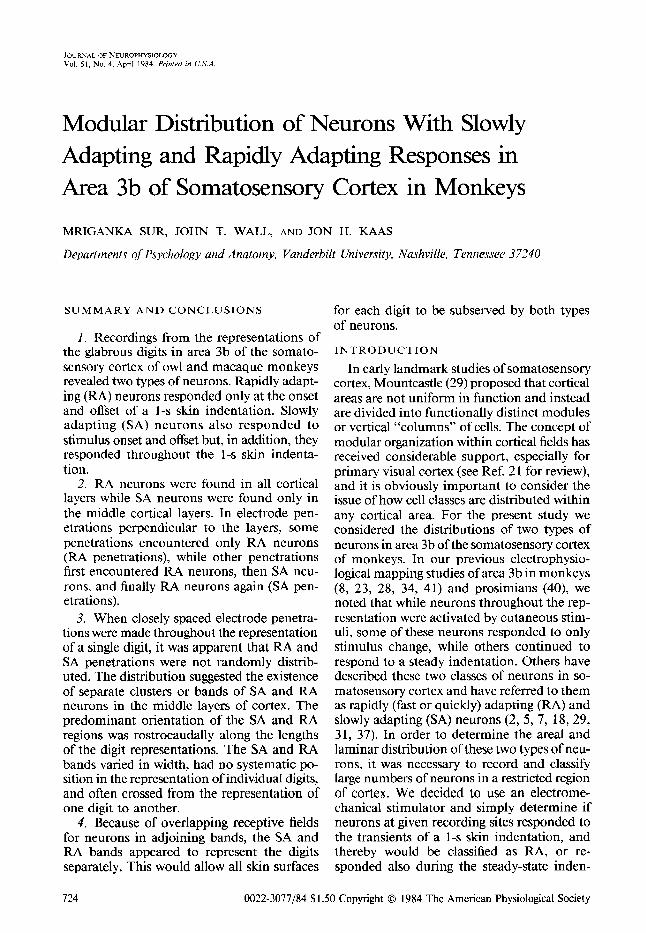
FIG. 1. Representation of the hand in area 3b of owl and macaque monkeys. The owl monkey (A) has no central sulcus, and the hand representation is on the exposed brain surface. In the macaque monkey (C), the hand representation and most of area 3b is buried on the posterior bank of the central sulcus. The hand representations of the owl monkey (B) and the macaque monkey (D) are similar in that digits l-5 are represented successively from lateral to medial in area 3b. In both monkeys, digit tips are “rostraI” toward the area 3a border, and the proximal digits are caudal toward the area 1 border. Macaque monkeys differ in having representations of digits extending to the area 1 border and the representation of the palm displaced medially and laterally. In addition, proportionately more cortex is devoted to the distal phalanges. Based on Refs. 23, 28, 34.
MODULAR DISTRIBUTION OF NEURONS 727
3b
400 t 1.307p
ON OFF 3001 +
! I
+
200
300
200
100
:I_
2. 412~
L 3. 542~
SECONDS
400
300
200
100
h&&&L-- 5. 848~
6. 978p
500
300
100 jl_ 1..
700 7. 1027~
500.
1 1 I 0.0 1.0 2.0
SECONDS
8. 1142~
0.0 1.0 2.0
SECONDS
FIG. 2. Laminar distribution of rapidly adapting (RA) and slowly adapting (SA) neurons in area 3b of owl monkeys. Peristimulus time histograms of responses to 25-50 presentations of a l-s indentation of the skin are shown for 11 recording sites in an electrode penetration passing through the cortex (upper left). Histograms 4, 8, 9, and 11 are from single units, while other recordings reflect the activity of more than one unit. Because this electrode penetration encountered both SA and RA neurons, it was classified as an SA penetration (see text). Arrows mark borders of area 3b. Receptive fields were on the distal phalange of digit 4. Recording depths are indicated for each response. SA responses (sites 7-9) have a maintained component during indentation.
Initially, neurons with RA responses, l-6, were recorded in layers II and III. These neu- rons responded to both the onset and offset of the indentation of the skin on the distal phalange of digit 4, with no detectable response during the maintained indentation. Next, three SA neurons, 7-9, were encountered while the electrode was passing through layer IV. These neurons also responded to the stim- ulus onset and somewhat less to the stimulus offset, but there was a clearly elevated response rate during the maintained skin indentation. Two subsequent neurons in layer V were poorly driven to stimulus onset but showed no elevated response to the maintained skin indentation. The pattern seen in Fig. 2 was repeated in all penetrations with mixed RA and SA responses; that is, the response type
would change in these penetrations from RA to SA and then back to RA, with the SA re- sponses recorded in the middle layers of the cortex, typically in or near layer IV.
In other electrode penetrations, only IL4 neurons were encountered. Figure 3 illustrates one such penetration. Neurons at all recording depths, including those in layer IV, 7-9, re- sponded at stimulus onset and offset but did not show increased discharge rates during the maintained skin indentation. For conve- nience, we refer to penetrations with only RA responses as RA penetrations and to penetra- tions with SA responses in the middle layers as SA penetrations.
The results from individual penetrations suggest that given regions of cortex contain RA neurons in all layers of the cortex or con-
SUR, WALL, AND KAAS
3b
80:-p 400. 10.
1425 )I 300.
800 I
800.
lmm
800 1 8. 989p
I 200 1
4001 2. I
3001 523 )r
200 I
800.
600.
400.
looI! 400
300
200
100
1
6538.p 8.
I
1229p 13.
1854 p
L . m . . . . . . . . .
9. 1320 p
0.0 1.0 2.0
SECONDS SECONDS SECONDS
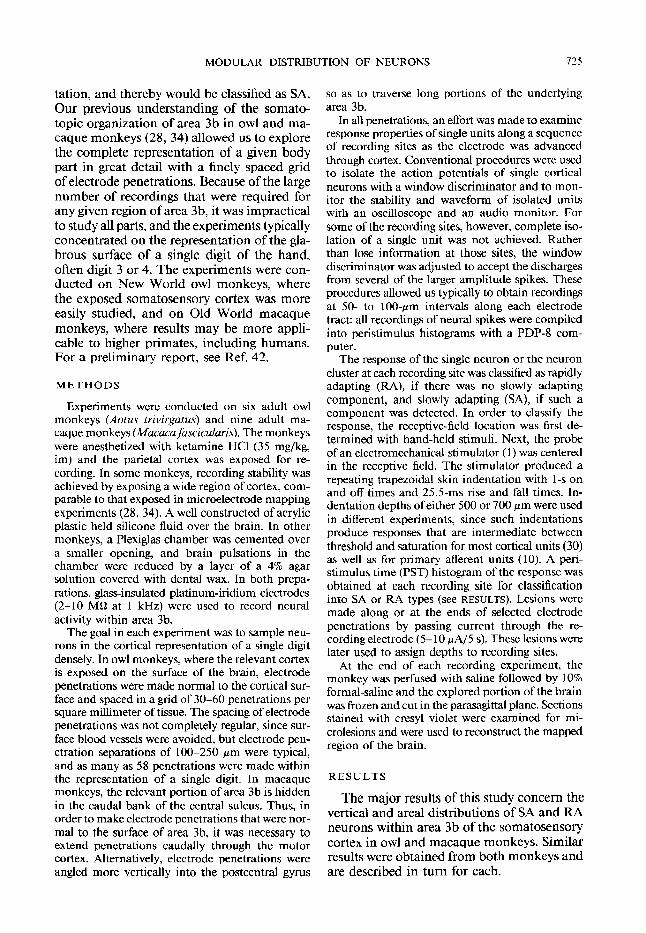
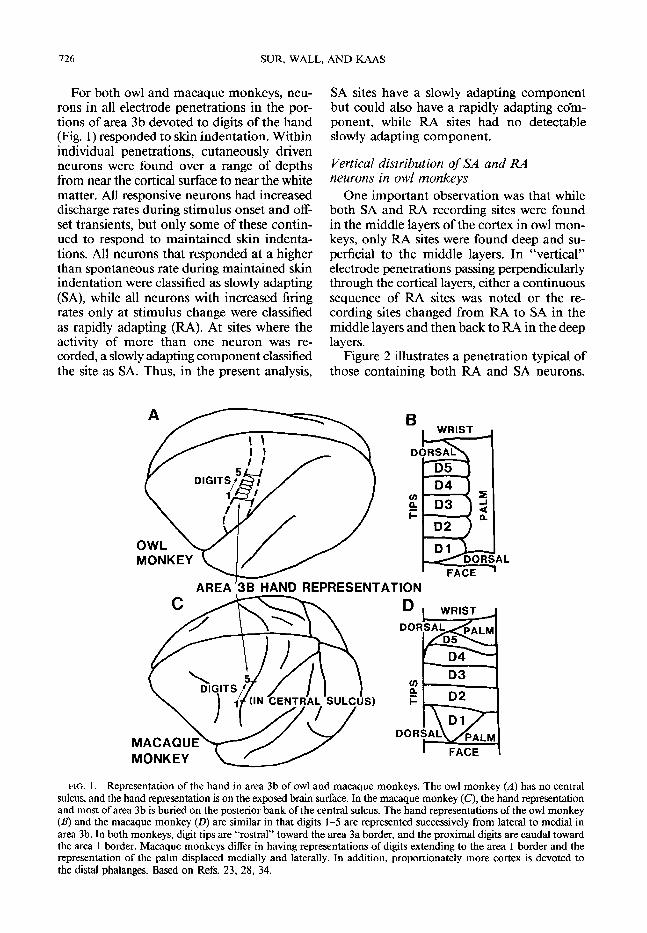
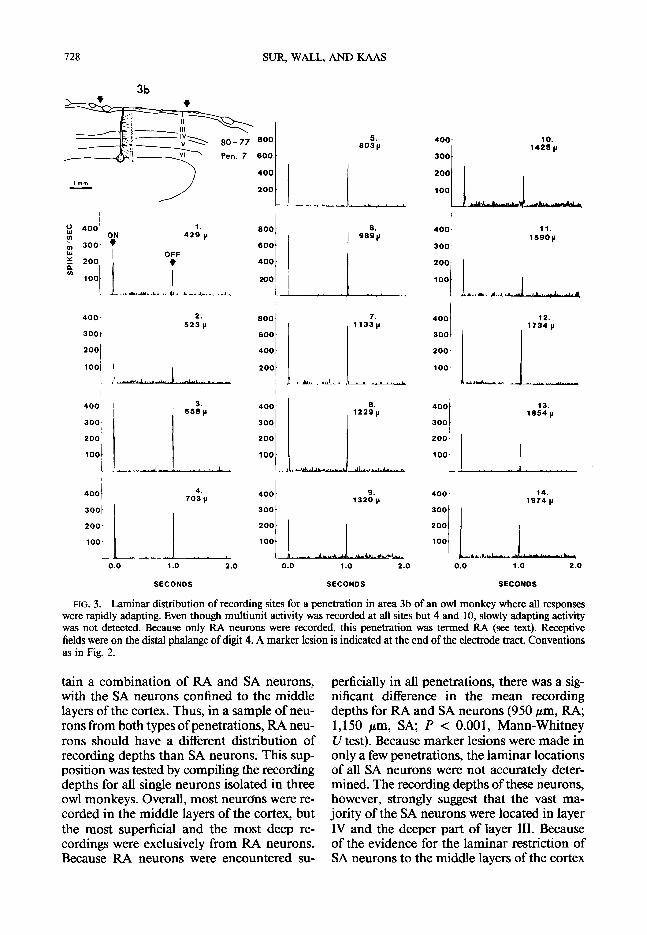
FIG. 3. Laminar distribution of recording sites for a penetration in area 3b of an owl monkey where all responses were rapidly adapting. Even though multiunit activity was recorded at all sites but 4 and 10, slowly adapting activity was not detected. Because only RA neurons were recorded, this penetration was termed RA (see text). Receptive fields were on the distal phalange of digit 4. A marker lesion is indicated at the end of the electrode tract. Conventions as in Fig. 2.
tain a combination of RA and SA neurons, perficially in all penetrations, there was a sig- with the SA neurons confined to the middle nificant difference in the mean recording layers of the cortex. Thus, in a sample of neu- depths for RA and SA neurons (950 pm, RA; rons from both types of penetrations, RA neu- 1,150 pm, SA; P < 0.001, Mann-Whitney rons should have a different distribution of U test). Because marker lesions were made in recording depths than SA neurons. This sup- only a few penetrations, the laminar locations position was tested by compiling the recording of all SA neurons were not accurately deter- depths for all single neurons isolated in three mined. The recording depths of these neurons, owl monkeys. Overall, most neurons were re- however, strongly suggest that the vast ma- corded in the middle layers of the cortex, but jority of the SA neurons were located in layer the most superficial and the most deep re- IV and the deeper part of layer III. Because cordings were exclusively from RA neurons. of the evidence for the laminar restriction of Because RA neurons were encountered su- SA neurons to the middle layers of the cortex
MODULAR DISTRIBUTION OF NEURONS 729
and the probability that good isolation of larger neurons in infra- and supragranular layers were achieved most often with our electrodes, it is unlikely that the encounter rates of SA and RA neurons in our sample accurately re- flect the proportions of these neurons. How- ever, of 127 single cells isolated in four owl monkeys, 38 were SA and 89 were RA.
Area1 distribution of SA and RA penetrations in owl monkeys
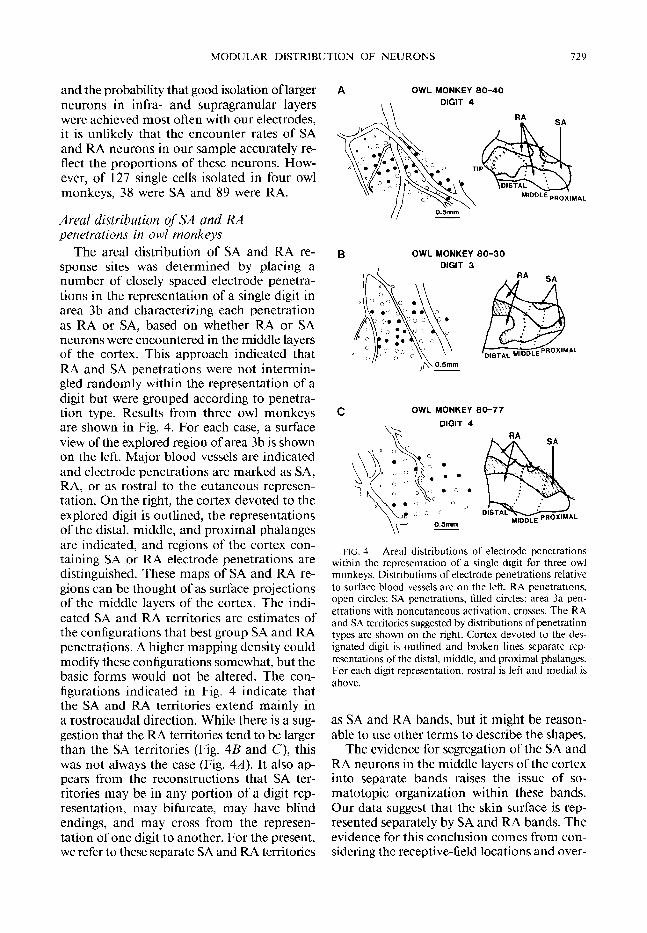
The area1 distribution of SA and RA re- sponse sites was determined by placing a number of closely spaced electrode penetra- tions in the representation of a single digit in area 3b and characterizing each penetration as RA or SA, based on whether RA or SA neurons were encountered in the middle layers of the cortex. This approach indicated that RA and SA penetrations were not intermin- gled randomly within the representation of a digit but were grouped according to penetra- tion type. Results from three owl monkeys are shown in Fig. 4. For each case, a surface view of the explored region of area 3b is shown on the left. Major blood vessels are indicated and electrode penetrations are marked as SA, RA, or as rostra1 to the cutaneous represen- tation. On the right, the cortex devoted to the explored digit is outlined, the representations of the distal, middle, and proximal phalanges are indicated, and regions of the cortex con- taining SA or RA electrode penetrations are distinguished. These maps of SA and RA re- gions can be thought of as surface projections of the middle layers of the cortex. The indi- cated SA and RA territories are estimates of the configurations that best group SA and RA penetrations. A higher mapping density could modify these configurations somewhat, but the basic forms would not be altered. The con- figurations indicated in Fig. 4 indicate that the SA and RA territories extend mainly in a rostrocaudal direction. While there is a sug- gestion that the RA territories tend to be larger than the SA territories (Fig. 4B and C), this was not always the case (Fig. 4A). It also ap- pears from the reconstructions that SA ter- ritories may be in any portion of a digit rep- resentation, may bifurcate, may have blind endings, and may cross from the represen- tation of one digit to another. For the present, we refer to these senarate SA and RA territories
A MONKEY
DIGIT 4
B
c
OWL MONKEY
DIGIT 3
80-30
OWL MONKEY 80-77
DIGIT 4
FIG. 4. Area1 distributions of electrode penetrations within the representation of a single digit for three owl monkeys. Distributions of electrode penetrations relative to surface blood vessels are on the left. RA penetrations, open circles; SA penetrations, filled circles; area 3a pen- etrations with noncutaneous activation, crosses. The RA and SA territories suggested by distributions of penetration types are shown on the right. Cortex devoted to the des- ignated digit is outlined and broken lines separate rep- resentations of the distal, middle, and proximal phalanges. For each digit representation, rostra1 is left and medial is above.
as SA and RA bands, but it might be reason- able to use other terms to describe the shapes.
The evidence for segregation of the SA and RA neurons in the middle layers of the cortex into separate bands raises the issue of so- matotopic organizati .on within these bands. Our data suggest that the skin surface is rep- resented separately by SA and RA bands. The evidence for this conclusion comes from con- sidering the receptive-field locations and over-
730 SUR, WALL, AND KAAS
lap for all SA and RA penetrations within each experiment where the representation of a single digit was fully explored. Figure 5 shows typical results from one case (80-40). The re- lation of recording sites to receptive-field lo- cations indicates there is an overall somato- topic organization involving penetrations in both the RA and SA bands. Thus, the pro- gression from rostra1 to caudal sites come- sponds to a tip-to-palm progression of recep- tive fields. It is also apparent that receptive fields for recording sites on the lateral margin of the digit representation tend to be on the radial side of the digit, and receptive fields for recording sites on the medial side tend to be on the ulnar side of the digit. Nevertheless, there was enough overlap of receptive fields so that when RA and SA penetrations were considered separately, the same parts of the digit were found to be represented in both subdivisions of the representation. The digit tip, for example, was clearly represented by both RA (fields 9-l 1) and SA (fields H-L) neurons.
In part, the separate RA and SA represen- tations may be accomplished, not only by overlapping receptive fields, but by receptive- field scatter or departures from strict somato-
SLOWLY ADAPTING
topic organization. Receptive field E (Fig. 5), for example, corresponds to an electrode pen- etration centered in the digit representation, yet the receptive field was displaced toward the side of the digit very much like the re- ceptive field for penetration 5 near the margin of the digit representation. Another observa- tion was that the receptive fields for SA neu- rons tended to be larger, often covering much of the width of a phalanx, than those for RA neurons. This observation may relate to the tendency for SA bands to be smaller than RA bands.
Vertical distribution of SA and RA neurons in macaque monkeys
Experiments on cynomolgus macaque monkeys provided results that were consistent with those from owl monkeys. However, the deep central sulcus in macaque monkeys re- quired different experimental strategies for making electrode penetrations and recon- structing data. Thus, the distribution of SA and RA neurons as a function of depth or- thogonal to the pial surface in area 3b was investigated by angling electrode penetrations caudally through the motor cortex so as to intersect area 3b and pass through its layers
RAPIDLY ADAPTING
FIG. 5. Receptive-field locations for recording sites in slowly adapting and rapidly adapting territories in the representation of a digit in area 3b of an owl monkey. Receptive fields for SA penetrations overlap those for RA penetrations. For the digit representation, rostra1 is above and medial is right.
MODULAR DISTRIBUTION OF NEURONS 731
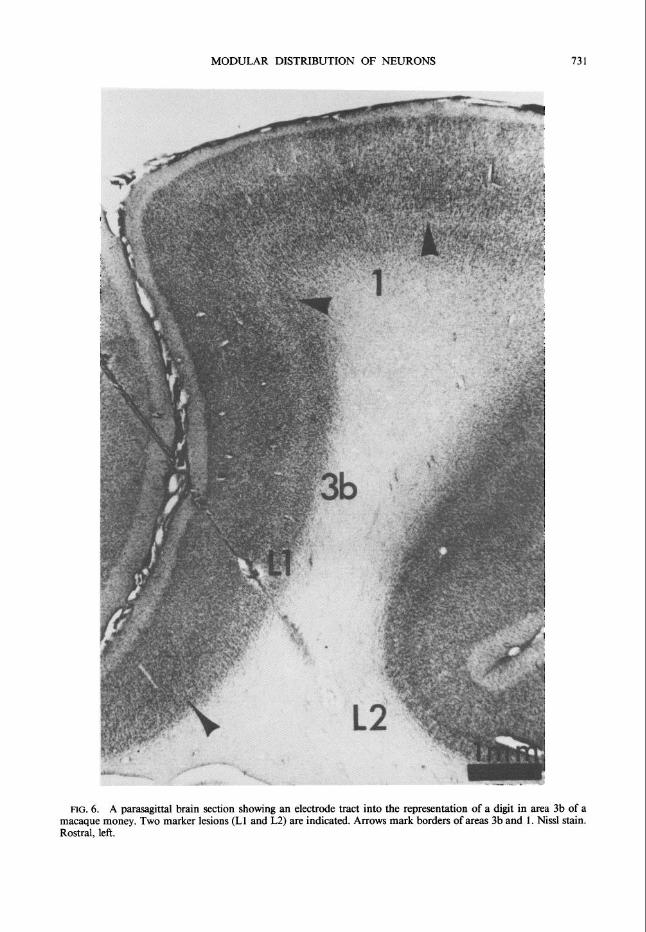
LOG. 6. A parasagittal brain section showing an electrode tract into the representation of a digit in area 3b of a macaque money. Two marker lesions (Ll and L2) are indicated. Arrows mark borders of areas 3b and 1. Nissl stain. Rostral, left.
732 SUR, WALL, AND KAAS
approximately normally. Figure 6 shows a photomicrograph of one such penetration with two marker lesions, one at the recording site of an SA cell and the other 2 mm deeper. Because the slope of the central sulcus was not apparent during the experiment, the angle of the electrode penetrations often was not precisely normal to the surface, and correc- tions were necessary for constructing surface views.
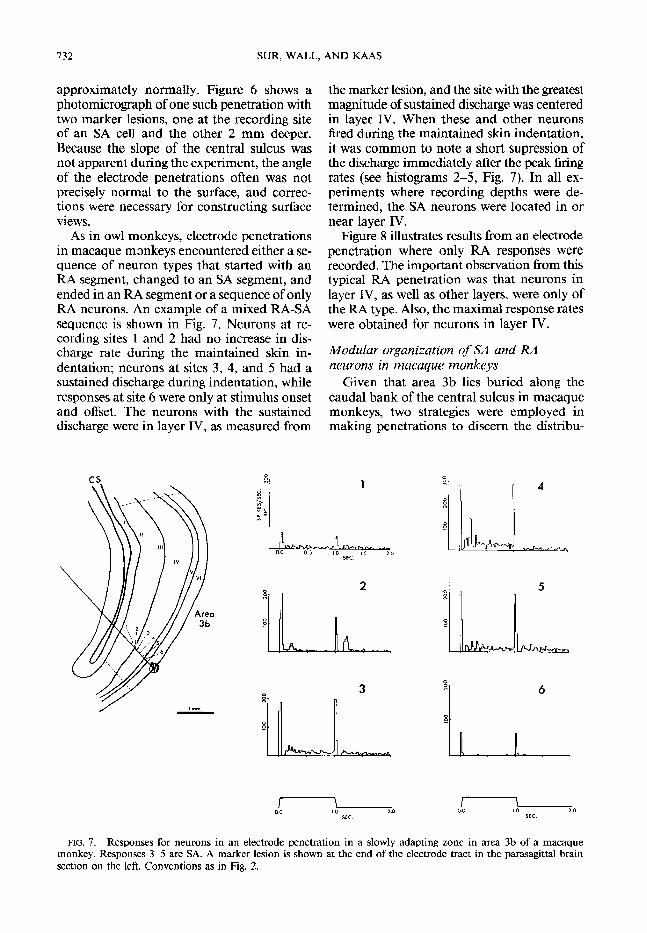
As in owl monkeys, electrode penetrations in macaque monkeys encountered either a se- quence of neuron types that started with an RA segment, changed to an SA segment, and ended in an RA segment or a sequence of only RA neurons. An example of a mixed RA-SA sequence is shown in Fig. 7. Neurons at re- cording sites 1 and 2 had no increase in dis- charge rate during the maintained skin in- dentation; neurons at sites 3, 4, and 5 had a sustained discharge during indentation, while responses at site 6 were only at stimulus onset and offset. The neurons with the sustained discharge were in layer IV, as measured from
the marker lesion, and the site with the greatest magnitude of sustained discharge was centered in layer IV. When these and other neurons fired during the maintained skin indentation, it was common to note a short supression of the discharge immediately after the peak firing rates (see histograms 2-5, Fig. 7). In all ex- periments where recording depths were de- termined, the SA neurons were located in or near layer IV.
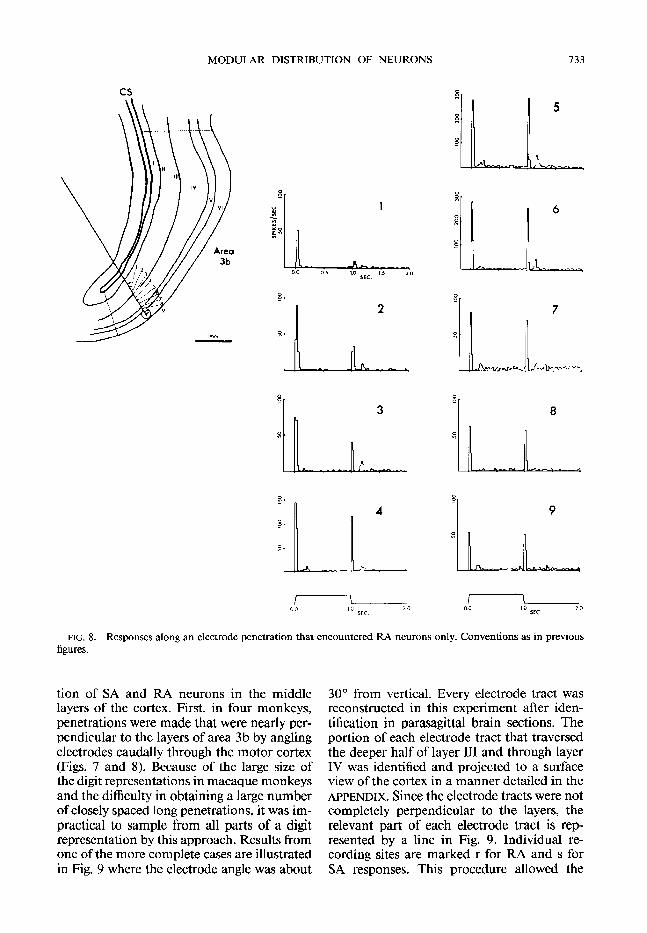
Figure 8 illustrates results from an electrode penetration where only RA responses were recorded. The important observation from this typical RA penetration was that neurons in layer IV, as well as other layers, were only of the IL4 type. Also, the maximal response rates were obtained for neurons in layer IV.
Mudulur organization of SA and RA neurons in macaque munkeys
Given that area 3b lies buried along the caudal bank of the central sulcus in macaque monkeys, two strategies were employed in making penetrations to discern the distribu-
1
SEC.
c 7 0.0 I.0 2.0
SEC. 0.0 IO 2.0
SEC.
FIG. 7. Responses for neurons in an electrode penetration in a slowly adapting zone in area 3b of a macaque monkey. Responses 3-5 are SA. A marker lesion is shown at the end of the electrode tract in the parasagjttal brain section on the left. Conventions as in Fig. 2.
MODULAR DISTRIBUTION OF NEURONS
8 2 5: LL-
733
8 -I 8
I 7 00 10 20 SEC
I 7 00 10
SEC 20
FIG. 8. Responses along an electrode penetration that encountered RA neurons only. Conventions as in previous figures,
tion of SA and RA neurons in the middle layers of the cortex. First, in four monkeys, penetrations were made that were nearly per- pendicular to the layers of area 3b by angling electrodes caudally through the motor cortex (Figs. 7 and 8). Because of the large size of the digit representations in macaque monkeys and the difficulty in obtaining a large number of closely spaced long penetrations, it was im- practical to sample from all parts of a digit representation by this approach. Results from one of the more complete cases are illustrated in Fig. 9 where the electrode angle was about
30’ from vertical. Every electrode tract was reconstructed in this experiment after iden- tification in parasagittal brain sections. The portion of each electrode tract that traversed the deeper half of layer III and through layer IV was identified and projected to a surface view of the cortex in a manner detailed in the APPENDIX. Since the electrode tracts were not completely perpendicular to the layers, the relevant part of each electrode tract is rep- resented by a line in Fig, 9. Individual re- cording sites are marked r for RA and s for SA responses. This procedure allowed the
SUR, WALL, AND KAAS
10 mm
.
0.5 mm
. l
l l
l .
l .
l 0
a
-l Medial
Rostra t 0.5 m m
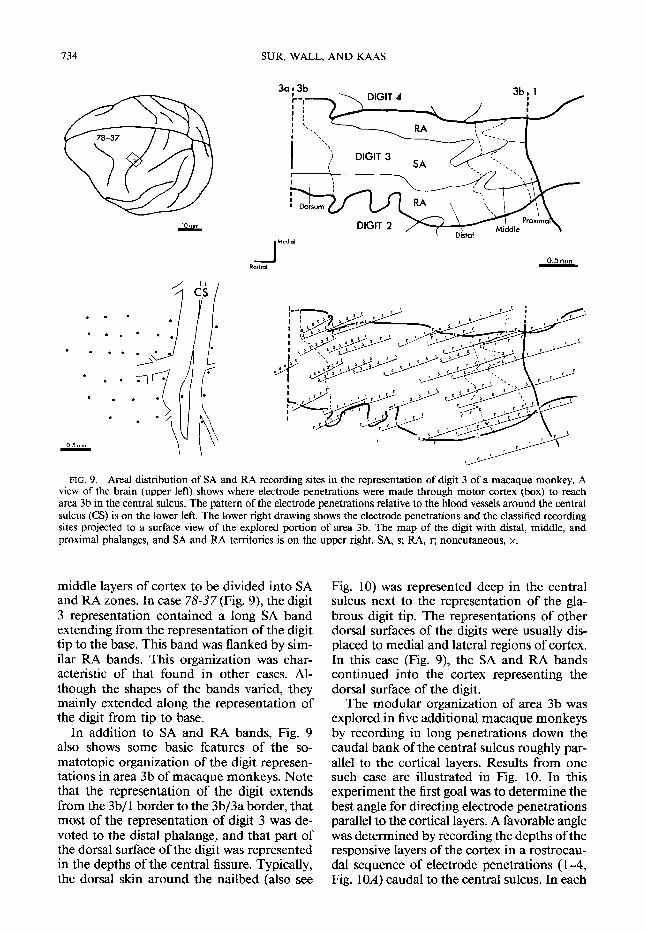
FIG. 9. Area1 distribution of SA and RA recording sites in the representation of digit 3 of a macaque monkey. A view of the brain (upper left) shows where electrode penetrations were made through motor cortex (box) to reach area 3b in the central sulcus. The pattern of the electrode penetrations relative to the blood vessels around the central sulcus (CS) is on the lower left. The lower right drawing shows the electrode penetrations and the classified recording sites projected to a surface view of the explored portion of area 3b. The map of the digit with distal, middle, and proximal phalanges, and SA and RA territories is on the upper right. SA, s; RA, r; noncutaneous, x.
middle layers of cortex to be divided into SA and RA zones. In case 78-37 (Fig. 9), the digit 3 representation contained a long SA band extending from the representation of the digit tip to the base. This band was flanked by sim- ilar RA bands. This organization was char- acteristic of that found in other cases, Al- though the shapes of the bands varied, they mainly extended along the representation of the digit from tip to base.
In addition to SA and RA bands, Fig. 9 also shows some basic features of the so- matotopic organization of the digit represen- tations in area 3b of macaque monkeys. Note that the representation of the digit extends from the 3b/l border to the 3b/3a border, that most of the representation of digit 3 was de- voted to the distal phalange, and that part of the dorsal surface of the digit was represented in the depths of the central fissure. Typically, the dorsal skin around the nailbed (also see
Fig. 10) was represented deep in the central sulcus next to the representation of the gla- brous digit tip. The representations of other dorsal surfaces of the digits were usually dis- placed to medial and lateral regions of cortex. In this case (Fig. 9), the SA and RA bands continued into the cortex representing the dorsal surface of the digit.
The modular organization of area 3b was explored in five additional macaque monkeys by recording in long penetrations down the caudal bank of the central sulcus roughly par- allel to the cortical layers. Results from one such case are illustrated in Fig. 10. In this experiment the first goal was to determine the best angle for directing electrode penetrations parallel to the cortical layers. A favorable angle was determined by recording the depths of the responsive layers of the cortex in a rostrocau- da1 sequence of electrode penetrations (l-4, Fig. 1OA) caudal to the central sulcus. In each
MODULAR DISTRIBUTION OF NEURONS 735
penetration, the zone of responsive neurons was noted, and these data were used to cal- culate the 25” angle (Fig. 1 OB) used in making electrode penetrations 5- 12. A surface-view distribution of the SA and RA response sites (Fig. 1OC) led to the reconstruction of SA and RA regions shown in Fig. 1OD. Again the ori- entations of the SA and RA bands were largely along the length of the representation of the digit, For the representation of the skin around the nailbed, SA responses predominated.
Results from the experiment illustrated in Fig. 10 were unusual in that the responses from one group of recording sites were difficult to classify (large open circles, Fig. 1OC). Re- sponses recorded at these sites did not have a sustained component for the duration of the l-s skin indentation, yet the response decay after stimulus onset was not as sharp as that for previously illustrated RA neurons. These unusual responses were observed along three different electrode penetrations, but they were not found in other experiments. For purposes of reconstruction, we classified these neurons as RA (Fig. 1OD).
Since the RA and SA bands appeared to extend along the length of the digit represen- tation, it was possible to obtain evidence for the organization of these bands over more of the representation of the hand by recording in long penetrations extending at an angle across the representations of the digits. In one experiment, the electrode penetrations were not only slanted to pass along the layers of the cortex of the posterior bank of the central sulcus, but they were also slanted substantially from medial to lateral to course across the representations of the digits (Fig. 11). Four electrode penetrations in this experiment passed through the middle layers of area 3b in the representation of the glabrous digits of the hand. The representations of all five digits were included in the recordings, and record- ings along the electrode tracts were classified as SA or RA. Results projected to a surface view (Fig. 11, bottom left) and summarized (Fig. 11, bottom right) show that SA and RA neurons are segregated into bands that extend dorsoventrally in the central sulcus. These bands had variable widths, ranging from 0.25 to 1 mm or more, and were continuous across the representations of different digits. The representations of each digit had both SA and RA regions. Finally, SA and RA bands did not have a fixed relation to the representation
of each digit, and each type of band could be found at the center or the edge of a digit rep- resentation.
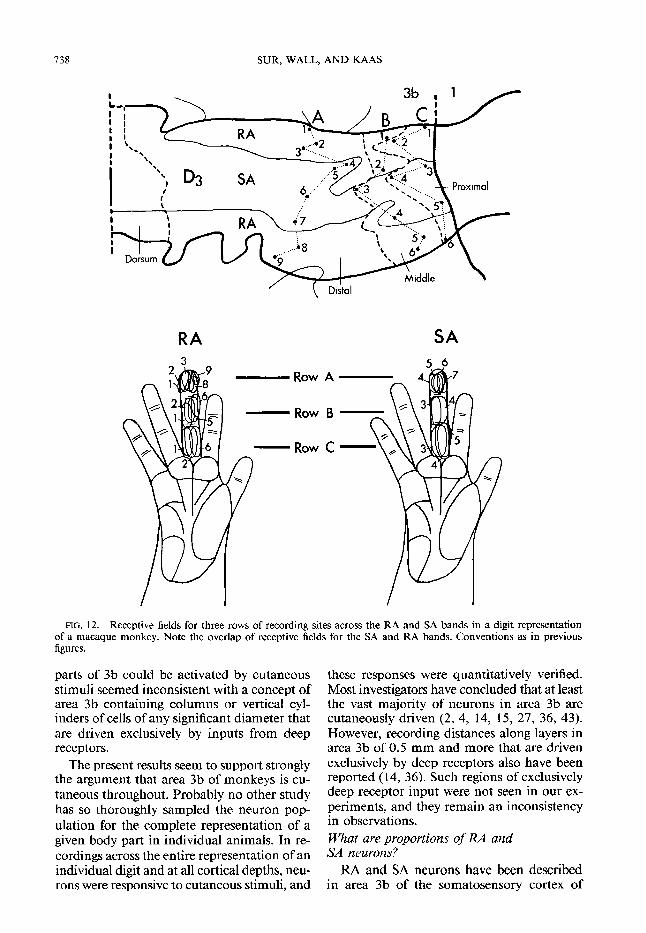
As for owl monkeys, the SA and RA bands seemed to represent a digit independently. Evidence for this conclusion is presented in Fig. 12. Receptive fields for three rows of re- cording sites across the representation of digit 3 are shown. In row A, receptive fields for three recording sites, 1-3, in the medial RA band progressed from the ulnar margin to the middle of the digit tip. The middle to the radial margin of the digit tip was represented in the more lateral RA band, sites 8 and 9. In be- tween the two RA sequences, receptive fields for the middle SA band, 4-7, traverse the same skin surface in the same ulnar to radial se- quence. Similar results were obtained for re- cording sites in rows B and C. The conclusion supported by these results is that the middle layers of cortex containing the SA and RA bands separately relate to the same skin sur- face.
DISCUSSION
Two aspects of the functional organization of area 3b of the somatosensory cortex of monkeys are described in this paper. First, the middle layers of the cortex have both slowly and rapidly adapting neurons, while the su- perficial and deep layers appear to have largely or only rapidly adapting neurons. Second, SA and RA neurons in the middle layers of cortex are segregated from each other in alternating territories or bands of tissue that are elongated in the rostrocaudal direction for the region representing digits of the hand. These results raise a series of questions about the organi- zation of area 3b in primates.
Do all parts of area 3b representation receive inputs from cutaneous receptors?
While area 3b in monkeys has been de- scribed as a mixture of columns of neurons devoted to subcutaneous receptors and col- umns of neurons related to cutaneous recep- tors (e.g., Refs. 14,36), the results of our map- ping studies (8, 23, 29, 34, 41) lead us to the conclusion that all parts of area 3b receive cutaneous inputs. This conclusion does not deny the possibility of inputs from deep re- ceptors or even the exclusive activation of some neurons by inputs from deep receptors. Rather, the finding that neurons in all explored
736 SUR, WALL, AND KAAS
PEFJETRATION
4 3 2 1
POSTERIOR + + + + ANTERlOR A
C PENETRATION
12 11 10 9 a 7 6 5 t++v+$v+
. l l
l .
0 0 l *
I 0 0
l l a
0.5 mm l . 0” 0 :a 0 o 0 RAPIDLY 0 0 oo* ADAPTING
Cl
u
0 0
0 0
0 0 0
0 0 0 0 80, O
0 0 0 . 0
0 l
0 0
0 l
0
0 l l \ * 0 0 SLOWLY
0 0 a ADAPTING 0 0
0
0 0 0 * 0 0
0 0 0 .
0 0
0 0 l 0
0 0
0 0
l .
0 0 *
0 l 0 0 0
0 0 a
0
0 l
l 0 0
l 0
l a 0
0 0 .
a 0
X . 0
x x X
x X
x4NONCUTANEOUS
0.5 mm
D AREA 3b DIGIT 5
DORS AL
RAPIDLY
cl
SLOWLY
ADAPTING ADAPTING
MODULAR DISTRIBUTION OF NEURONS 737
3b /
r 1 r
r r /
FIG. 11. Distribution of RA and SA sites for electrode penetrations angled across representations of di, gits. Locations of four electrode penetrations are shown on the upper left on a view of the brain and part of one penetration is indicated on a parasagittal brain section on the upper right. SA (s), RA (r), and noncutaneous (x) sit es along these tracts are projected to a surface view and a map of the digit representations on the lower left. The resulting distribution of the RA and SA regions is on the lower right.
FIG. 10. RA and SA territories for the representation of digit 5 for macaque monkey 80-21. Four vertical penetrations (1-4 in A and B) were first used to determine the angle of the central sulcus. In B, circles mark responsive and crosses mark unresponsive recording sites in a portion of a parasagittal brain section. Penetrations 5-12 (see A) were placed at a 25” angle (see B) to record from the middle layers of cortex of the caudal bank of the central sulcus. In C, the pattern of the recording sites is shown as projected to a surface view of cortex. Unusual RA sites are indicated with large open circles; small open circles mark RA, filled small dots mark SA sites, and crosses mark sites in area 3a that were unresponsive to cutaneous stimuli. In D, the distribution of RA and SA territories are shown on a surface view. The dotted region denotes the unusual RA sites (see text).
738 SUR, WALL, AND KAAS
RA SA 3
Row A
- Row B
- Row C -
FIG. 12. Receptive fields for three rows of recording sites across the RA and SA bands in a digit representation of a macaque monkey. Note the overlap of receptive fields for the SA and RA bands. Conventions as in previous figures.
parts of 3b could be activated by cutaneous these responses were quantitatively verified. stimuli seemed inconsistent with a concept of Most investigators have concluded that at least area 3b containing columns or vertical cyl- the vast majority of neurons in area 3b are inders of cells of any significant diameter that cutaneously driven (2, 4, 14, 15, 27, 36, 43). are driven exclusively by inputs from deep However, recording distances along layers in receptors. area 3b of 0.5 mm and more that are driven
The present results seem to support strongly exclusively by deep receptors also have been the argument that area 3b of monkeys is cu- reported (14, 36). Such regions of exclusively taneous throughout. Probably no other study deep receptor input were not seen in our ex- has so thoroughly sampled the neuron pop- periments, and they remain an inconsistency
ulation for the complete representation of a in observations.
given body part in individual animals. In re- What me proportions of RA and cordings across the entire representation of an SA neurons? individual digit and at all cortical depths, neu- RA and SA neurons have been described rons were responsive to cutaneous stimuli, and in area 3b of the somatosensory cortex of
MODULAR DISTRIBUTION OF NEURONS 739
monkeys in several reports (2, 14, 3 1, 35,38), but the proportions of these two types of neu- rons are uncertain. Most investigators have found SA neurons to be uncommon. Darian- Smith et al. (2), for example, recently esti- mated the proportion of SA neurons as under 20%, and in a study of 272 neurons in areas 3b, 1, and 2, Hyvgrinen and Poranen ( 14) found only 17 SA neurons. In contrast, Paul et al. (35) concluded that over 50% of the neurons in area 3b were SA. To some extent the differences in observed proportions of SA and RA neurons may relate to recording pro- cedures.
One possible source of differences in ob- served proportions of SA and RA neurons is that investigators differently sampled cortical layers. The present results indicate that at least for the representations of the glabrous digits of the hand, the proportions of SA and RA neurons in area 3b varies according to cortical layer. Because layer IV neurons are segregated into SA and RA bands, the sizes of the bands provide a rough estimate that 30-50% of layer IV neurons are SA. However, since SA neu- rons appear to be largely or only in the middle layers of the cortex, SA neurons must represent a much smaller percentage of the total number of neurons in area 3b. In previous experiments where the goal has been to isolate single neu- rons best, larger pyramidal cells above and below layer IV may have been oversampled, and thereby these experiments would under- estimate the proportion of SA neurons. On the other hand, Paul et al. (35) used low- impedence electrodes and multiunit record- ings largely to sample layer IV of area 3b, and thereby probably produced overestimates (37.2-66%) of the total amount of SA activity. Our estimate of the amount of layer IV related to SA activation is of the order of 30-50%, which is somewhat less than the average value of Paul et al. (35) of 55.8%.
Some of our recordings were from area 1, and mainly RA responses were found for these sites. This finding is consistent with the con- clusion of Paul et al. (35) and Sur (38) that fewer SA neurons are found in area 1. How- ever, more systematic studies are needed (see Ref. 3 1).
What determines respmse type of urea 3b neurons?
Previ ous investigators have suggested or implied that segregated and para llel pathways
from first-order peripheral SA and RA affer- ents account for the SA and RA properties of cortical neurons in monkeys (32,33,35). More specifically, the rapid adaptation properties, the restricted receptive fields, and the relative insensitivity to high-frequency vibration of cortical RA neurons in area 3b are consistent with the notion that these neurons ultimately receive inputs from Meissner corpuscles rather than pacinian corpuscles. The slowly adapting response characteristics and the restricted re- ceptive fields of area Jb SA neurons are con- sistent with the activation of SA neurons from SA mechanoreceptors, including Merkel cells (e.g., Refs. 16, 17). In addition, there is evi- dence that SA and RA channels are segregated all the way to the ventroposterior nucleus, where separate groups of SA and RA neurons are found ( 18, 20). Segregated projections of these neurons could create SA and RA bands in layer IV and lower layer III of area 3b, since thalamocortical terminations are concentrated in these middle layers (9, 18; also see Refs. 25, 26). However, RA neurons are found in SA bands below and above the middle cortical layers. If vertical processing in cortex predom- inates (e.g., Ref. 30), RA inputs would not exclusively activate the neurons located im- mediately above and below the layer IV SA inputs. Thus, while it is plausible that layer IV neurons reflect the properties of RA or SA ventroposterior inputs, the RA properties of neurons in the superficial and deep layers of the cortex above and below SA neurons may result from intralaminar processing. We pro- pose that the sustained component of the re- sponse is removed by inhibition for those cor- tical cells that are one or more steps removed from secure thalamocortical driving. Area 3b is characterized by a number of intrinsic GABAergic neurons (11) that could provide inhibition. Even the layer IV SA neurons may be subject to inhibition, since their initial bursts of activity are typically followed briefly by complete response suppression. Similar modifications of sustained responses appear to occur in the primary visual cortex, since neurons with sustained responses to a un- changing stimulus are rare and are most no- table in layer IV (3).
What is somatotopic organization of ureu 3b?
Paul et al. (35) first suggested that area 3b of monkeys contains a complete representa-
740 SUR, WALL, AND KAAS
tion of the body surface. These investigators explored the representation of the hand and found digits l-5 represented in a lateromedial sequence, with the representations of the digit tips directed toward the depths of the central sulcus and the bases of the digits near the 3b/l junction near the top of the sulcus. Sub- sequently we have found this basic organi- zation in four different monkey species (8,23, 28,34,4 1; however, see Ref. 27). Furthermore, the present results are completely consistent with those from our earlier studies, and they also show in great detail how individual digits are represented in area 3b of both owl and macaque monkeys. Glabrous digit surfaces are clearly represented from base to tip in a cau- dorostral direction in owl monkeys and down the face of the caudal bank of the central sulcus in macaque monkeys.
The results also illustrate some differences between owl and macaque monkeys. In owl monkeys, as previously noted (28), the rep- resentations of the digits typically do not cross the rostrocaudal width of area 3b but instead, the pads of the palm are represented caudal to the digits. In macaque monkeys, as pre- viously noted (34), it is common to have the representations of the digits extend all the way to the area 1 border. Another species difference that is obvious from the present results is that much more of the representation of a digit is devoted to the distal phalange in macaque monkeys (compare Figs. 5 and 10). In fact, so much of the representation is occupied by the distal phalange in macaque monkeys that it would be easy to miss the representations of the middle and proximal phalanges without closely spaced recording sites.
A further feature of the somatotopic maps is suggested by our conclusion that within layer IV, SA and RA neurons are separated into narrow alternating bands. If these bands are subserved by different peripheral receptors and these receptors are intermixed in the skin, then the RA and SA bands must separately rep- resent the same skin surfaces. This deduction is strongly supported by the present evidence that the receptive fields for neurons in ad- joining RA and SA bands overlap and, in the mediolateral direction in the cortex, there was evidence for the representation of the same skin surfaces in adjoining parts of SA and RA bands. It is possible that a single, perhaps cruder, map is constructed in nongranular cortical layers by the merging of inputs from
the granular layer. A similar double map may exist in layer IV of area 17 of some primates, where Hubel and Wiesel (13) have hypothe- sized that fine-grain mapping would reveal remaps of the same visual space in adjoin- ing ocular dominance bands. These separate maps would merge in the binocular layers of area 17.
What is nature of modular organization of area 3b?
We have postulated that area 3b of monkeys is divided into alternating SA and RA bands. These bands are in some ways similar to the ocular dominance bands of the striate cortex. A set of RA and SA bands are about the same width as a pair of ocular dominance columns, and they may combine to form something akin to the visual “hypercolumn” (13). The width of this somatosensory hypercolumn is of the order of the width of a region of cortex that would be activated in area 3b by the skin within a given peripheral receptive field (35). As for ocular dominance columns, the dis- tinction between SA and RA bands is obvious only in the granular layers of cortex, Also, the SA and RA bands may be only one type of functional organization that exists in somato- sensory hypercolumns. Other types of orga- nization, akin to the orientation bands in area 17, for example, may be discovered in future experiments. Finally, it is useful to stress that although ocular dominance bands were first demonstrated electrophysiologically, the area1 pattern of these bands were ultimately revealed in great detail by anatomical experiments (see Ref. 13). An anatomical demonstration of the shapes of SA and RA bands would constitute a significant advance. It is possible that the rostrocaudal strips of thalamacortical termi- nations in area 3b that are revealed by focal injections of tracers in the ventroposterior nu- cleus (20) already constitute, in a limited manner, such an anatomical demonstration.
Is SA information lost? An interesting question here is what hap-
pens to the SA information. Apparently few, if any, of the output cells of area 3b relay the SA type of response, since output cells are in the infragranular and supragranular cortical layers. It follows that if SA information in area 3b is reflected in the output functions of the field, the SA information is coded in some fashion other than by the process of main- taining the discharge pattern of the SA first-
MODULAR DISTRIBUTION OF NEURONS 741
QR= PQ sin8
RS = PQ cod sin+
QS= &is3
o(= tan” (tan9 /sin 4)
XY= a.1 mm
YZ = 44 s4xtions
=2.2 mm
78-37
x5qJ
9
r\
8 = tan-‘%
=15.2m
\9 Y
Z
FIG. 13. A: procedures for calculating penetration mapping distances. Left: three penetrations are shown angled caudally on a parasagittal brain section. Bars A, B, and C indicate the resulting “horizontal” distances explored in area 3b. Right: geometric relations used to calculate distances. See text for details. B: procedures for calculating the angle of the electrode tract relative to the midsagittal plane and to the radial fibers of the cortex. Left: tracing of an electrode tract through a series of 50-pm parasagittaf brain sections from 46-90, as shown on section 90. The relevant calculations for deriving the angle between the electrode tract and the midsagittal plane are given below. Right: measurements of angles between electrode tracts and the radial fiber pattern in the cortex. See text for details.
742 SUR, WALL, AND KAAS
order neuron. Perhaps RA output neurons above and below SA neurons code significant aspects of the SA signal, even though the re- sponse of the output neuron is RA. It is pos- sible then that such RA neurons may be part of an SA “labeled line.”
Are cats like monkeys? The segregation of RA and SA neurons into
alternating zones apparently is not restricted to area 3b of primates. In the primary so- matosensory cortex of cats, separate zones of RA and SA responses are found that have been characterized as alternating bands that appear to be elongated mediolaterally rather than rostrocaudally (5,6,37). However, single thalamocortical SA or RA fibers appear to have patches or clumps of terminations that are distributed mediolaterally in SI, suggesting that SA and RA territories in cats may be anteroposteriorly oriented (25, 26). As in monkeys, parts of the body appear to be sep- arately represented in SA and RA regions of the cortex in cats (37). Also as in monkeys, RA bands appear to have only RA neurons, while SA bands have both RA and SA neurons (6). It is presently uncertain if RA and SA bands evolved independently in carnivore and primate lines or if such a segregation is basic to the mammalian somatosensory cortex.
APPENDIX
A penetration angled posteriorly from the vertical so as to intersect portions of area 3b buried in the central sulcus traverses varying distances along area 3b (Fig. 13A, left). A geometric representation of relations within the cortex in area 3b is shown in Fig. 13A, right. PQ, electrode track length in middle layers of cortex; PR, projection of electrode track PQ on midsagittal plane; PS, radial fibers in cortex; QS, projection of electrode track PQ on plane of area 3b; QRS, plane surface in area 3b perpendicular to radial fibers; PRS, plane parallel to midsagittal
REFERENCES
1. CHUBBUCK, J. G. Small-motion biological stimulator. APL Tech. Dig. May-June: 18-23, 1966,
2, DARIAN-SMITH, I., SUGITANI, M., HEYWOOD, J., KARITA, K., AND GOODWIN, A. Touching textured surfaces: cells in somatosensory cortex respond both to finger movement and to surface features, Science 218: 906-909, 1982.
3. DOW, B. M. Functional classes of cells and their lam-
plane of brain; 8, angle between electrode track and midsagittal plane; 4, angle between electrode track projection on midsagittal plane and radial fibers; and cy, angle between electrode track projection on area 3b and midsagittal plane.
To reconstruct an electrode track through the middle layers of cortex on a face-on view of area 3b (e.g., Fig. 9) we need length QS and angle a. From the relations shown in Fig, 13B, right, we can derive QS and cu from the track distance PQ and the angles 8 and 4.
Track length PQ is obtained by correlating depths of neurons during recording with neuron locations in electrode tracks reconstructed from parasagittal sections and retaining the track length between deep layer III through the bottom edge of layer IV.
We obtain angle 0 as shown in Fig. 13B, left. An electrode track (made in this case in cortex separate from the region studied intensively) is reconstructed through successive sections. The angle between the track and the midsagittal plane (the plane of section) is then derived from the distance measured between the top and bottom of the track and the thickness of tissue traversed.
The angle 4 is obtained for each electrode track by direct measurement from the brain section con- taining the electrode track (Fig. 13B, right).
8 remains the same for all electrode tracks. PQ and 4 are different, in general, for each track and are obtained separately for each. The projection of each track, QS, and the angle LY between the pro- jection and the midsagittal plane are used to draw each electrode track on a face-on unfolded view of area 3b (Fig. 9, right). In such a view, the midsagittal plane of course appears as a horizontal line.
ACKNOWLEDGMENT
This study was supported Health Grant NS 1 6446.
by National Institutes of
inar distribution in monkey visual cortex. J. Neu- rophysiol. 37: 927-946, 1974.
4. DREYER, D.A., LoE,P.R.,METz,C. B., AND WHIT- SEL, B. L. Representation of head and face in post- central gyrus of the macaque. J. Neurophysiol. 38: 714-733, 1975.
5. DYKES, R. W. AND GABOR, A. Magnification factors and organization of submodality-specific bands in SI
MODULAR DISTRIBUTION OF NEURONS 743
6.
7.
8.
9.
10.
11.
12.
13,
14.
15.
16.
17.
18.
19.
20.
cortex of the cat. J. Cowlp. Neural. 202: 597-620, 1981. DYKES, W. R., RASMUSSON, D. H., AND HOELTZELL, P. B. Organization of primary somatosensory cortex in the cat, J. Neurophysiol. 43: 1527-l 546, 1980. DYKES, R. W., SUR, M., MERZENICH, M. M., KAAS, J. H., AND NELSON, R. J. Regional segregation of neurons responding to quickly adapting, slowly adapting, deep and Pacinian receptors within thalamic ventroposterior lateral and ventroposterior inferior nuclei in the squirrel monkey (Saimiri sciureus). Neuroscience 6: 1687, 198 1. FELLEMAN, D. J., NELSON, R. J., SUR, M., ANDKAAS, J. H. Organization of the somatosensory cortex in cebus monkeys. Brain Res. 268: 15-26, 1983. FRIEDMAN, D. P. AND JONES, E. G. Focal projection of electrophysiologically defined groupings of thalamic cells on the monkey somatic sensory cortex. Brain Res. 19 1: 249-252, 1980. HARRINGTON, T. AND MEKZENICH, M. M. Neural coding in the sense of touch: human sensations of skin indentation compared with the responses of slowly adapting mechanoreceptor afferents innervating the hairy skin of monkeys. Exp. Brain Res. 10: 25 l- 264, 1970. HENDRY, S. H. C, AND JONES, E. G. Sizes and dis- tributions of intrinsic neurons incorporating tritiated GABA in monkey sensory-motor cortex. J. Neurosci. 4: 390-408, 1981. HUBEL, P. H, AND WIESEL, T. N. Uniformity of mon- key striate cortex: a parallel relationship between field size, scatter and magnification factor, J. Comp. Neural. 158:295-302, 1974. HUBEL, P, H. AND WIESEL, T. N. Functional archi- tecture of macaque monkey visual cortex. Proc. R. Sot. London Ser. B 198: I-59, 1977. HYVARINEN, J. AND PORANEN, A. Receptive field integration and submodality convergence in the hand area of the post-central gyrus of the alert monkey. J. Physiol. London 283: 539-556, 1978. HYVARINEN, J., PORANEN, A., AND JOKINEN, S, In- fluence of attentive behavior on neuronal responses to vibration in primary somatosensory cortex of the monkey. J. Neurophysiol, 43: 970-982, 1980. IGGO, A. AND ANDRES, K. H. Morphology of cuta- neous receptors. Annu. Rev. Neurosci. 5: l-3 1, 1982. JOHANSSON, R. S. AND VALLBO, A. B. Tactile sen- sibility in the human hand: relative and absolute den- sities of four types of mechanoreceptive units in gla- borous skin. J. Physiol. London 286: 283-300, 1979. JONES, E. G. Lamination and differential distribution of thalamic afferents within the sensory-motor cortex of the squirrel monkey. J. Comp. NeuroZ, 160: 167- 204, 1975. JONES, E. G. AND BURTON, H. Area1 differences in the laminar distribution of thalamo-cortical fibers in cortical fields of the insular, parietal and temporal regions of primates. J. Comp. NeuroZ. 168: 197-248, 1976. JONES, E. G., FRIEDMAN, D. P., AND HENDRY, S. H. C. Thalamic basis of place- and modality-specific columns in monkey somatosensory cortex: a correl- ative anatomical and physiological study. J. Neuro- ahvsiol. 48: 545-568. 1982.
21.
22.
23.
24.
25.
26.
27.
28,
29.
30.
31.
32.
33.
34.
35.
KAAS, J. H. The segregation of function in the nervous system: why do sensory systems have so many sub- divisions? In: Contributions to Sensory Physiology, edited by W, P. Neff. New York: Academic, 1982, p* 20 l-240. KAAS, J. H. What, if anything, is S-I? Organization of first somatosensory area of cortex, Physiol. Rev. 63:206-231, 1983. KAAS, J. H., NELSON, R. J., SUR, M,, AND MERZEN- ICH, M. M. Multiple representation of the body within the primary somatosensory cortex of primates. Science 204: 511-512, 1979. KAAS, J. H., NELSON, R. J., SUR, M., AND MEFUEN- ICH, M. M. Organization of somatosensory cortex in primates. In: The Organization of the Cerebral Cortex, edited by F. 0. Schmitt, F. G, Worden, G. Adelman, and S. G. Dennis, Boston, MA: MIT Press, 198 1, p. 237-261. LANDRY, P. AND DESCHENES, M. Intracortical ar- borizations and receptive fields of identified ventro- basal thalamocortical afferents to the primary somatic sensory cortex in the cat. J. Cump. Neural. 199: 345- 371, 1981. LANDRY, P., VILLEMURE, J., AND DESCHENES, M. Geometry and orientation of thalamocortical arbo- rizations in the cat somatosensory cortex as revealed by computer reconstruction. Brain Res. 237: 222- 226, 1982. MCKENNA, T. M., WHITSEL, B. L., AND DREYER, D. A. Anterior parietal cortical topographic organi- zation in macaque monkey: a reevaluation. J. Neu- rophysiol. 48: 289-317, 1982. MERZENICH, M. M., KAAS, J. H., SUR, M., ANDLIN, C.-S. Double representation of the body surface within cytoarchitectonic areas 3b and 1 in “SI” in the owl monkey (Aotus trivirgatus). J. Cump. Neural. 18 1: 41-74, 1978. MOUNTCASTLE, V. B. Modality and topographic properties of single neurons of cats’ somatic sensory cortex. J. Neurophysiol. 2: 408-434, 1957. MOUNTCASTLE, V. B, The problem of sensing and the neural coding of sensory events. In: The Neuro- sciences, edited by G. C. Quarton, T. Melnechuk, and F. 0. Schmitt, New York: Rockefeller University Press, 1967, p+ 393-408. MOUNTCASTLE, V.B. ANDPOWELL, T-P. S.Neural mechanisms subserving cutaneous sensibility, with special reference to the role of afferent inhibition in sensory perception and discrimination. Bull. Johns Hopkins Hosp. 105: 201-232, 1959. MOUNTCASTLE, V. B. AND POWELL, T. P. S. Central mechanisms subserving position sense and kinesthesis. Bull. Juhns Hopkins Hosp. 105: 173-200, 1959. MOUNTCASTLE, V.B., TALBOT, W. H.,SAKATA, H., AND HYVARINEN, J. Cortical neuronal mechanisms in flutter-vibration studies in unanesthetized monkeys. Neuronal periodicity and frequency discrimination. J. Neurophysiol. 32: 452-484, 1969. NELSON, R. J., SUR, M., F'ELLEMAN, D. J., ANDKAAS, J. H. Representation of the body surface in postcentral parietal cortex of Macaca fascicularis. J. Comp. Neu- rol. 192: 6 11-643, 1980. PAUL, xi. L., MERZENICH, M, M., AND GOODMAN, H. Representation of slowly adapting and rapidly adapting cutaneous mechano-receotors of the hand
744 SUR, WALL, AND KAAS
in Brodmann’s areas 3 and 1 of iI&zcaca mulatta. Brain Res. 36: 229-249, 1972.
36. POWELL, T. P. S. AND MOUNTCASTLE, V. B. Some aspects of the functional organization of the cortex of the postcentral gyrus of the monkey. A correlation of findings obtained in a single unit analysis with cytoarchitecture. Bull. Johns Hopkins Hosp. 105: 133- 162, 1959.
37. SRETAVAN, II. AND DYKES, R. W, The organization of two cutaneous submodalities in the forearm region of area 3b of cat somatosensory cortex. J. Comp. Neural. 213: 381-398, 1983.
38. SUR, M. Receptive fields of neurons in areas 3b and 1 of somatosensory cortex in monkeys. Brain Rex 198: 465-471, 1980.
39. SUR, M., MERZENICH, M.M., ANDKAAS, J. H. Mag- nification, receptive-field area, and “hypercolumn”
size in areas 3b and 1 of somatosensory cortex in owl monkeys. J. Neurophysiol. 44: 295-3 11, 1980.
40. SUR, M., NELSON, R. J., AND KAAS, J. H. The rep- resentation of the body surface in somatic koniocortex in the prosimian, Galago. J. Comp. Neural. 189: 38 l- 402, 1980,
41. SUR, M., NELSON, R. J., AND KAAS, J. H. Represen- tation of the body surface in cortical areas 3b and 1 of squirrel monkeys: comparisons with other primates, J. Camp. Neural. 211: 177-192, 1982.
42. SUR, M., WALL, J. T., AND KAAS, J. H. Modular segregation of functional cell classes within the post- central somato-sensory cortex of monkeys. Science 212: 1059-1061, 1981.
43. TANJI, J. AND WISE, S. P. Submodality distribution in sensorimotor cortex of the unanesthetized monkey. J. Neurophysiol. 45: 467-48 I, 198 I.