Modulation of Antigen Presenting Cell Function to Affect Innate and Adaptive Immune Responses: Implications for Organ Transplantation Dr Natasha Rogers MBBS (Hons), FRACP Transplantation Immunology Laboratory Basil Hetzel Institute for Medical Research, The Queen Elizabeth Hospital, and Hanson Institute Department of Medicine, Faculty of Health Sciences, University of Adelaide Submitted in fulfilment of the Degree of Doctor of Philosophy, University of Adelaide, December 2010
Transcript
Modulation of Antigen Presenting Cell Function to Affect Innate and Adaptive
Immune Responses: Implications for Organ Transplantation
Dr Natasha Rogers
MBBS (Hons), FRACP
Transplantation Immunology Laboratory Basil Hetzel Institute for Medical Research,
The Queen Elizabeth Hospital, and Hanson Institute
Department of Medicine,
Faculty of Health Sciences, University of Adelaide
Submitted in fulfilment of the Degree of Doctor of Philosophy,
University of Adelaide, December 2010
2
TABLE OF CONTENTS
Thesis Abstract 11
Declaration 13
Honours and Awards 14
Publications 15
Presentations 16
Acknowledgements 18
CHAPTER 1: INTRODUCTION 25
1.1 Transplantation and the quest for tolerance 25
1.2 Dendritic cell discovery, characterisation and biology 28
1.2.1 DC lineage 29
1.2.2 DC phenotype 32
1.2.2.1 Murine DC subsets 35
1.2.2.2 Human DC subsets 38
1.2.2.2.1 MDC markers – C-type lectins 38
1.2.2.2.2 PDC markers 40
1.3 The dual function of DC in transplantation 42
1.3.1 DC function 42
1.3.2 The passenger leukocyte theory – immunogenic DC 45
1.3.3 DC density as a marker of organ allogenicity 47
1.3.4 Renal ischaemia-reperfusion injury 48
1.3.5 Tolerogenic DC 51
1.3.6 Allograft tolerance as a function of DC phenotype 51
1.4 The generation of tolerogenic DC in vitro 55
1.4.1 Manipulation of in vitro culture conditions 55
1.4.1.1 Interleukin-10 55
1.4.1.2 Transforming growth factor-� 56
1.4.2 Pharmacologic manipulation 56
1.4.3 Manipulation with cell by-products 58
1.4.4 Genetic manipulation 59
3
1.4.5 Recipient pre-conditioning with tolerogenic DC 61
1.5 Mechanisms of DC-induced tolerance 62
1.5.1 Regulatory T-cells 62
1.5.1.1 Functional studies 63
1.5.2 T regulatory type 1 (TR1) cells 64
1.5.3 T-cell anergy 64
1.5.4 T-cell deletion 65
1.5.5 Induction of T helper (Th2) cells 65
1.6 DC immunotherapy 67
1.6.1 Genetic manipulation of DC 67
1.6.2 Liposomes 70
1.6.2.1 Liposome structure 70
1.6.2.2 Liposome synthesis 72
1.6.2.3 Systemic behaviour of liposomes in vivo 73
1.6.2.4 Liposome trafficking 77
1.6.2.5 Utility of liposomes in pathophysiological states 77
1.7 Non-human primates in transplantation research 79
1.8 Thesis aims and hypotheses 81
CHAPTER 2: MATERIALS AND METHODS
2.1 Cell culture 82
2.1.1 Human 82
2.1.1.1 In vitro propagation of human monocyte-derived DC 82
2.1.1.2 Generation of nylon wool T-cells 83
2.1.1.3 Dendritic cell (one-way) MLR 83
2.1.1.4 Isolation of T-cells from an MLR using Automacs® 84
2.1.1.5 Secondary MLR 86
2.1.2 Marmoset 88
2.1.2.1 Marmoset colony maintenance 88
2.1.2.2 Peripheral blood sampling 88
2.1.2.3 Cell isolation protocols 89
2.1.2.4 PBMC isolation 89
4
2.1.2.5 One-way MLR 89
2.1.3 Murine 90
2.1.3.1 Isolation and administration of allogeneic murine DC 90
2.2 Flow cytometry 92
2.2.1 Flow cytometric analysis of dendritic cell surface markers 92
2.2.2 Flow cytometric analysis T-cell surface and intracellular markers 92
2.2.3 Staining for apoptotic/necrotic T-cells following co-culture with DC 96
2.3 Enzyme-linked immunosorbent assay 96
2.4 Immunofluorescent staining and confocal miscroscopy 97
2.4.1 Immunofluorescence for NF-�B-p50 97
2.4.1.1 Hu-Mo-DC (in vitro) 97
2.4.1.2 Murine spenocytes and renal APC (in vivo) 97
2.4.2 Immunofluorescence for DiI-labelled liposomes 97
2.4.3 Measurement of superoxide dismutase using dihydroethiudium 98
6.3.3 Co-culture of hu-Mo-DC with empty DC-SIGN-targeted liposome does not
change DC phenotype of allostimulatory capacity 268
6.3.4 Cloning of marmoset DC-SIGN 272
9
6.3.4.1 Determination of the nucleotide and amino acid sequences for
marmoset DC-SIGN 272
6.3.4.1 Cloning of human or marmoset DC-SIGN into pGEM®-T Easy and
pCI vectors 274
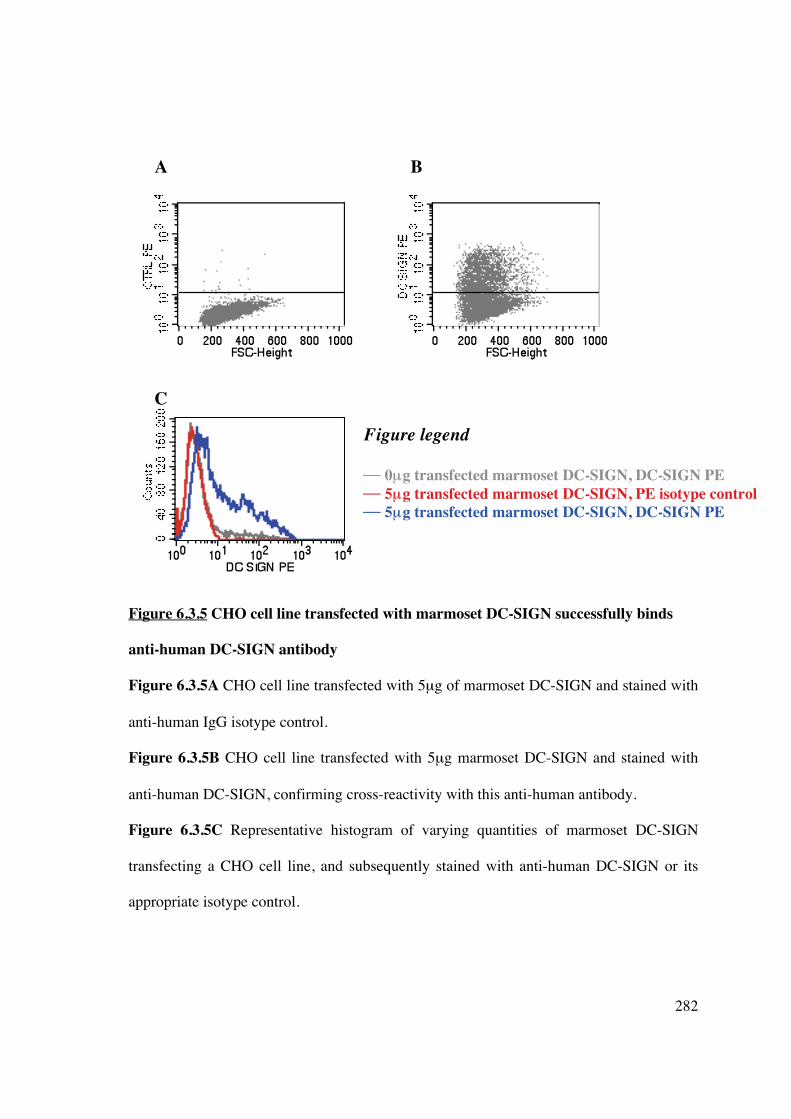
6.3.5 Binding of anti-human antibody to marmoset DC-SIGN 281
6.3.6 Binding of hu-DC-SIGN-targeted liposomes to marmoset DC-SIGN 283
6.3.7 Unmodified monoclonal antibody to human DC-SIGN fails to bind liposome
and target DC in vivo 288
6.3.8 Alterations in monoclonal antibody to facilitate liposomal attachment 290
6.4 Discussion 293
CHAPTER 7; CONCLUSIONS AND FUTURE DIRECTIONS
7.1 Summary and conclusions 299
7.2 Future directions 303
7.2.1 Planned studies for further evaluation of tolerogenic DC in vitro and in vivo
303
7.2.2 Planned studies of liposomal curcumin in ischaemia-reperfusion injury 304
7.2.3 Planned studies of liposomes in transplantation 305
REFERENCES 306
APPENDIX 340
10
Even now, I wrap what’s most fragile
in the long gauze of science.
The more elusive the truth,
the more carefully it must be carried.
- Anne Michaels
11
THESIS ABSTRACT
Transplantation is the best form of treatment for end-stage kidney disease, by improving quality
of life, reducing mortality and lowering healthcare costs. However, the immunosuppressive
medications required have non-selective mechanisms of action, affecting both patient and graft
longevity. Tolerance, the acceptance of an allograft in the absence of immunosuppression,
remains a major goal in clinical transplantation research. Dendritic cells (DC) are potent
antigen-presenting cells (APC) capable of promoting anti-donor immunity and antigen-specific
tolerance, and are a promising target for immunomodulation. Current tolerogenic techniques
involve ex vivo DC manipulation which limits immediate clinical applicability. The scope of
this thesis involves identification of a novel biologic agent, curcumin, to induce tolerogenic DC
and the use of this immunomodulatory agent within a liposomal construct to target and modify
DC function in vivo.
Chapter 1 discusses the context of this thesis and contains a comprehensive literature review.
Chapter 2 outlines methodology and materials utilised in this thesis.
Chapter 3 demonstrates the use of curcumin for in vitro generation of tolerogenic DC that
promote expansion of functional FoxP3+ regulatory T-cells (Tregs). In vivo infusion of
curcumin-treated DC was also able to induce subsequent immune hyporesponsiveness mediated
by FoxP3+ Tregs, and represents a potential avenue for transplant recipient conditioning using
donor (or recipient) -derived DC.
Chapter 4 demonstrates the use of liposomes to target APC in vivo. Liposomal incorporation of
immunomodulatory agents facilitates targeted cellular delivery to tissue-resident APC and
forms a basis for in vivo modulation of APC function. This work demonstrates that the in vitro
12
results demonstrated in Chapter 3 can be replicated in vivo, potentially eliminating the need for
ex vivo DC manipulation in a transplant setting.
Chapter 5 demonstrates the utility of liposomal curcumin in ameliorating aspects of ischaemia-
reperfusion injury (IRI), a consequence of transplant surgery that promotes graft
immunogenicity and limits graft longevity. For the first time renal tubular epithelial and
antigen-presenting cell endocytosis of liposomes is demonstrated, as is salvage of renal function
which is mediated by reduced pro-inflammatory cytokine and chemokine production, and
diminished oxidative stress. The results also identify thioredoxin-interacting protein (TXNIP) as
a potential novel marker of tissue injury in IRI, and curcumin effectively reduces this aspect of
cellular redox stress These data represent a novel and effective delivery method for this
immunmodulatory agent, preventing significant renal damage in a manner that has immediate
clinical applicability.
Chapter 6 describes a refinement in liposomal targeting of DC, using a DC-specific liposome
capable of binding to human monocyte-derived DC with high affinity via the receptor DC-
SIGN. The gene for marmoset DC-SIGN was cloned and the cross-reactivity of a human-DC-
targeted liposome to its marmoset counterpart was investigated in vitro. Additional attempts
were made to synthesize a marmoset DC-targeted liposome through basic, non-specific,
chemical modification of a monoclonal antibody to DC-SIGN known to be cross-reactive with
both humans and marmosets, with the aim of creating a cell-free DC-targeted negative vaccine
that could be tested in non-human primates.
Thus, the work presented in this thesis creates a platform for future studies from which DC-
based cellular and cell-free immune tolerance therapies can be developed in a transplant model.
13
DECLARATIONS
I declare that this thesis contains no material which has been accepted for the award of any
other degree or diploma in any university or tertiary institution to Natasha Mireille Rogers
and, to the best of my knowledge, contains no material previously published or written by
another person, except where due reference has been made in the text. I give consent to this
copy of my thesis when deposited in the University Library, being made available for loan
and photocopying, subject to the provisions of the Copyright Act 1968. I also give
permission for the digital version of my thesis to be made available on the web, via the
University’s digital research repository, the Australasian Digital Theses Program (ADTP)
and also through web search engines, unless permission has been granted by the University
to restrict access for a period of time. I acknowledge that the copyright of published works
contained within this thesis (as listed below) resides with the copyright holders of those
works.
14
HONOURS AND AWARDS 2010 Transplantation Society of Australia and New Zealand
Janssen-Cilag Travelling Fellowship 2010 AusBiotech-GlaxoSmithKline Student Excellence Award, South Australian and National Winner 2010 Australian and New Zealand Society of Nephrology
ANZSN Travelling Fellowship 2010 Australian and New Zealand Society of Nephrology
Novartis Overseas Travelling Fellowship 2010 Australian and New Zealand Society of Nephrology
Finalist, Young Investigator Award 2010 Australian and New Zealand Society of Nephrology
Travel grant to attend the Annual Scientific Meeting 2010 Transplantation Society of Australia and New Zealand Travel grant to attend XXII Congress of the Transplantation Society 2010 Transplantation Society of Australia and New Zealand
Young Investigators Award 2010 Transplantation Society of Australia and New Zealand
Winner, President’s Prize for best invited oral presentation 2010 Australian Society for Medical Research, Adelaide Winner, Ross Wishart Prize for best oral presentation 2007 National Health & Medical Research Council Medical Postgraduate Scholarship 2007 Kidney Health Australia
Postgraduate Scholarship 2007 The University of Adelaide
Australian Postgraduate Award
15
PUBLICATIONS
Peer reviewed papers
Rogers NM, Matthews, TJ, Kitching, AR, Coates, PT. Kidney dendritic cells: their role in homeostasis, inflammation and transplantation. Nephrology 2009 14(7):620-35. Rogers NM, Kireta S, Coates PTH. Curcumin generates maturation-resistant dendritic cells and T regulatory cells in vitro. Clin Exp Immunol, Accepted June 2010. Rogers NM, Stephenson M, Kitching AR, Horowitz JD, Coates PT. Amelioration of renal ischemia-reperfusion injury by liposomal delivery of an NF�B inhibitor to renal tubular epithelial and antigen presenting cells. Submitted to Br J Pharmacol, minor revision undertaken and resubmitted.
Manuscript to be submitted to Immunol Cell Biol March 2011.
Abstract publications
Rogers NM, Stephenson MD, Coates PT. Liposomal curcumin ameliorates renal
ischaemia-reperfusion injury via NFkappaB inhibition and antioxidant pathways. Immunol Cell Biol 2010; 88(6): A28
Rogers NM, Kireta S, Coates PT. Curcumin generates maturation-resistant dendritic cells and T regulatory cells in vitro. Immunol Cell Biol 2010; 88(6): A24 Rogers NM, Coates PT. Curcumin generates maturation-arrested “FAST” dendritic cells that expand regulatory T cells in vitro and in vivo. Nephrology 2010; 15(S4): 40
16
PRESENTATIONS
Invited presentations
“Modulation of innate and adaptive immunity to facilitate organ transplantation”
- Department of Ophthalmology, Flinders Medical Centre, South Australia,
November 2010
- Welcome Centre, Oxford, UK, November 2010
- Beth Israel Deaconess Medical Centre, Boston, USA October 2010
- Basil Hetzel Institute for Medical Research, South Australia, October 2010
- Thomas E. Starzl Institute, University of Pittsburgh, USA, September 2010
- Flinders Medical Centre Seminar Series, South Australia, August 2010
- Vascular Medicine Institute, University of Pittsburgh, USA, May 2010
Conference presentations
Oral presentations
Rogers NM, Stephenson MD, Coates PT. “Liposomal curcumin ameliorates renal
ischaemia-reperfusion injury via NFkappaB inhibition and antioxidant pathways”
- Australian Society for Medical Research Annual Scientific Meeting, Adelaide, June
2010
- Transplantation Society of Australia and New Zealand, Annual Scientific Meeting,
Canberra, June 2010
- XXIII International Congress of the Transplantation Society, Vancouver, August
2010
- Young Investigator Award, Australian and New Zealand Society of Nephrology,
Perth, September 2010
- The Queen Elizabeth Hospital Research Day, Adelaide, October 2010 Rogers NM, Kireta S, Coates PT. “Curcumin generates maturation-resistant dendritic cells and T regulatory cells in vitro and in vivo”
- President’s Prize, Transplantation Society of Australia and New Zealand Annual
Scientific Meeting, Canberra, June 2010
Rogers NM, Stephenson M, Kireta S, Coates PTH. “Amelioration of ischaemia-reperfusion injury using liposomal curcumin”
- The Queen Elizabeth Hospital Research Day, Adelaide, October 2009
Mini-oral presentations
Rogers NM, Coates PT. Curcumin generates maturation-arrested “FAST” dendritic cells
that expand regulatory T cells in vitro and in vivo”
- Australian and New Zealand Society of Nephrology Annual Scientific Meeting, Perth, September 2010
17
Poster presentations
Rogers NM, Coates PT. Curcumin generates maturation-arrested “FAST” dendritic cells
that expand regulatory T cells in vitro and in vivo”
- XXIII International Congress of the Transplantation Society, Vancouver, August
2010 Rogers NM, Stephenson M, Parish CR, Thomas R, Coates PTH. “Alteration of innate and adaptive immune responses using liposomal curcumin”
- Australasian Society of Immunology Conference, Gold Coast, December 2009 Rogers NM, Parish CR, Russ GR, Coates PTH. “Specific targeting of dendritic cells using tolerogenic liposomes”
- The Queen Elizabeth Hospital Research Day, Adelaide, October 2008
18
ACKNOWLEDGEMENTS
Firstly, I sincerely thank my supervisor, A/Prof Toby Coates for his mentorship. I have greatly respected and admired Toby’s enthusiasm and scientific thinking, and it has been a privilege to work with him. I would also like to thank Prof Graeme Russ (RAH, Adelaide), Prof Chris Parish (ANU, Canberra), Dr Shane Grey (Garvan Institute, Sydney) and Prof Ranjeny Thomas (Diamantine Institute, Brisbane) for their valuable intellectual input. I also sincerely thank Prof Clive Prestidge and Dr Timothy Barnes (Ian Wark Institute, UniSA) who allowed me to use the necessary equipment to make liposome preparations, without which I could not have performed so many experiments. I would like to acknowledge the support of the National Health and Medical Research Council for the provision of the scholarship (and extension) that has enabled me to undertake my PhD. I am indebted to the most important person in our laboratory, Svjetlana Kireta, who taught and helped me with everything. She was never too busy, and always ready to assist, teach, and listen. I am also grateful to all the staff and students of the TIL during my tenure, especially Julie Johnston, Matthew Stephenson, Clyde Milner, Chris Drogemuller, Darling Rojas, Claire Jessup, Michael Collins, Daisy Mohanasundaram, Amy Hughes, Boris Fedoric, and Austin Milton, for practical assistance, teaching, helpful discussions, insights and thoughtful feedback. Thank you for providing a friendly, accommodating and generous environment in which to develop skills and learn. The staff at the IMVS Animal Facility require mention, particularly Kelly Wicks for her assistance with all the mouse injections. I would like to thank Chris Drogemuller (RAH/Hanson Institute) for guidance with marmoset DC-SIGN cloning and sequence analysis, John Brealy (TQEH) for electron microscopy assistance, Katherine Pilkington (Detmold Facility, Hanson Institute) for flow sorting expertise and friendship, staff at the South Australian Red Cross Blood Service and the donors for providing blood samples. A special mention must go to Prof John Horowitz whose objective insight, judgement and humour was a great salve in moments of frustration. I have been blessed with magnificent parents who have been utterly reliable back-up baby sitters on innumerable occasions, and provided scientific advice, moral support and encouragement at every step. Thank you all for everything; this would not have been achieved without your continuous help. To my husband David, your support of me has made all this possible. . And finally, beautiful child, Orli, born before this madness began. You have provided me with laughter, frustration, sleepness nights and joy. I hope one day you might be interested enough to look at this thesis, disregard the fact it is not bound in pink, and understand what I was doing on those nights away from you.
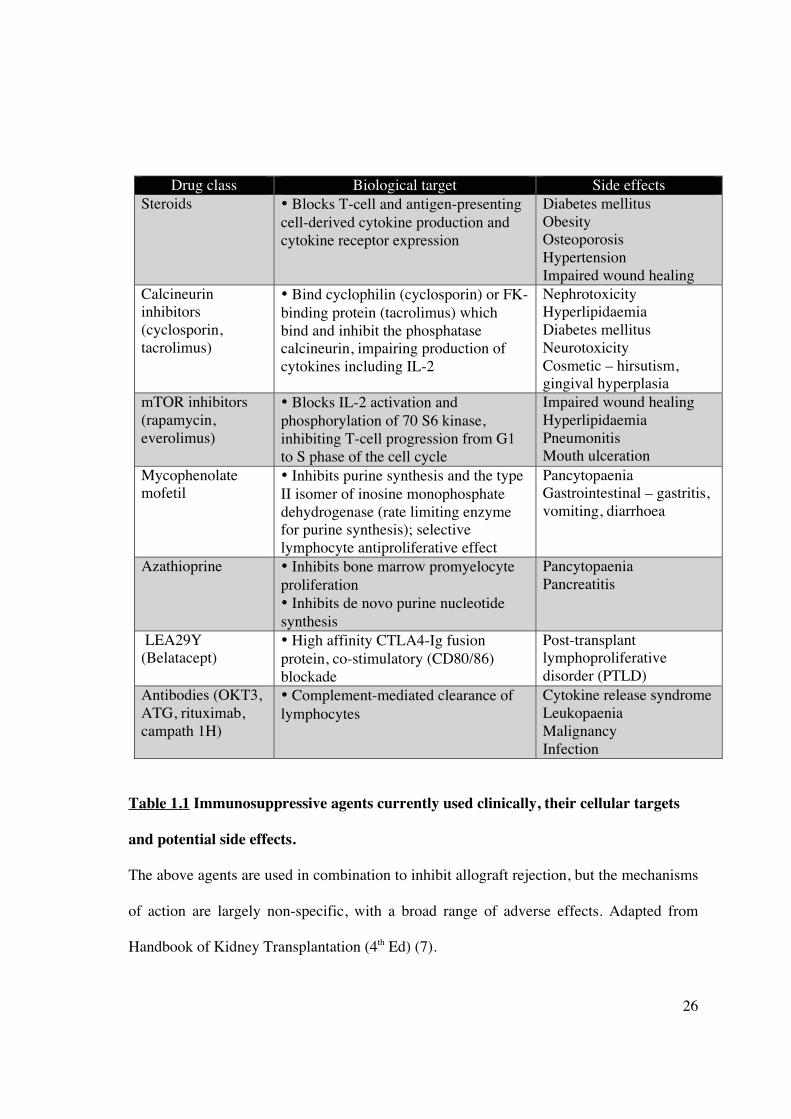
• Bind cyclophilin (cyclosporin) or FK-binding protein (tacrolimus) which bind and inhibit the phosphatase calcineurin, impairing production of cytokines including IL-2
• Inhibits purine synthesis and the type II isomer of inosine monophosphate dehydrogenase (rate limiting enzyme for purine synthesis); selective lymphocyte antiproliferative effect
• Low immunogenicity • Easily modified for cellular targeting and slow degradation • Low production costs • Good safety profile • Clinical experience
• Transient gene expression (modifiable)
Adenoviral • No insertional mutagenesis • High transfection efficiency • High titres may be generated • Infects dividing and non-dividing cells • Clinical experience
An additional finding was the decreased production of TH17 CD4+ helper T-cells. TH17
cells express the IL-23 receptor (419), transcription factors ROR�t (420, 421) and ROR�
(16), and produce IL-22 and IL-17 (422). They also share a developmental pathway with
FoxP3+ Tregs, requiring the addition of IL-6 in the presence of TGF-� (423). Thus, the
cytokine microenvironment and anti-inflammatory effects induced by curcumin in vitro, in
addition to the up-regulation of FoxP3+ Tregs, may have altered TH17 CD4+ T-cell
lineage commitment.
Murine bone-marrow-derived DC exposed to curcumin have been previously shown to
generate FoxP3+ Tregs in vitro (385). The stability and maturation-resistance of CurcDC
under inflammatory conditions is crucial to their successful application as tolerogenic
agents in vivo that down-regulate anti-donor T-cell responses. DC that are resistant to
179
maturation offer a considerable advantage over conventional “immature” DC, as
demonstrated by our in vivo results. The latter undergo maturation in vivo, sensitising the
recipient, and limiting their effectiveness in promoting immune hyporesponsiveness. We
have demonstrated that infusion of allogeneic DC induced FoxP3+ Treg generation in vivo
(Figure 3.4.2), although only CurcDC reduced subsequent alloproliferative responses
(Figure 3.4.3A) with significant expansion of the FoxP3+ compartment (Figure 3.4.3B).
In conclusion, exogenous curcumin deviates hu-Mo-DC towards tolerogenic DC, capable
of generating FoxP3+ regulatory T-cells. The advantage of curcumin is its low
cytotoxicity, and its potency as an NF-�B inhibitor, in addition to antioxidant and anti-
inflammatory properties. Thus, the present observations provide a new way of generating
tolerogenic DC ex vivo as a therapeutic tool, with potential applications in vivo that need to
be demonstrated in a transplant model.
180
CHAPTER 4: MODIFICATION OF DENDRITIC CELLS IN
VITRO AND IN VIVO USING LIPOSOMES
4.1 INTRODUCTION
Donor-specific immune tolerance is a highly desirable goal of transplantation research. DC,
as potent immune system regulators and biosensors, promote both anti-donor immunity and
immune tolerance (26, 424). Thus, DC remain an important target for potential tolerance-
inducing therapies. Numerous in vitro studies have established the generation of
tolerogenic DC using a wide variety of stimuli, modification of culture conditions or gene
expression (144, 148, 153, 198, 425, 426). Small animal transplant studies have utilised
recipient pre-conditioning to prolong vascularized allograft survival (427-431), although
translation of such results to non-human primate models has been limited. In addition, the
optimal DC subset, phenotype, and tolerizing agent remains to be identified, as does route
of administration, cell dose, and control of DC fate in vivo. Ex vivo manipulation of either
donor- or recipient-derived DC is time-consuming and expensive, and lacks clinical
applicability. Similarly, in vivo expansion of DC using growth factors (such as Flt3L) has
yielded divergent results following transplantation (432-435).
In vivo targeting of recipient tissue-resident DC can be achieved using monoclonal
antibodies targeting DC-specific markers attached to alloantigen peptides (436), apoptotic
donor cells (437, 438) or MHC-rich exosomes (213). However, limitations exist in these
particulate delivery systems in terms of size, stability and cell-specificity. Liposomal
encapsulation of immunomodulatory agents provides a mechanism for improving
181
therapeutic drug delivery to DC. Liposomes are formed spontaneously as phospholipids
coalesce into a closed vesicular structure in an aqueous environment. Liposomes can be
formulated to deliver a wide variety of drug molecules, proteins, nucleic acids and
plasmids regardless of lipid solubility and can be processed to differ in size, charge,
composition and lamellarity to facilitate cellular delivery (see Section 1.6.2). Similarly,
membranous vesicular structures, such as plasma membrane vesicles (PMV), derived from
donor or recipient cells and expressing antigen in the form of MHC can be incorporated
into liposomes as additional immunomodulatory agents (439). A cell-free system can
overcome the difficulties associated with cell-based vaccines, targeting DC (and other APC
as required) to deliver NF�B or co-stimulatory blockade.
The aims of this chapter are:
1] to investigate the potential for liposomes to incorporate immunomodulatory agents
whilst maintaining biologic activity,
2] to illustrate that liposomes may be delivered effectively in vivo and,
3] to demonstrate that liposomes may be used to target and generate tolerogenic DC in
vivo, thus eliminating the need for ex vivo modulation.
182
4.2 METHODS
4.2.1 Peripheral blood sampling
4.2.1.1 Human
Human PBMC were derived from healthy volunteers or buffy coats obtained from the
South Australian Red Cross Blood Service and processed as described in Chapter 2
(Section 2.1.1.1).
4.2.1.2 Marmoset
Marmoset PBMC were obtained by venepuncture as described in Chapter 2 (Section
2.1.2).
4.2.2 Cell culture
Protocols for reagents and media, propagation of hu-Mo-DC, cell separation and culture,
flow cytometry, and primary mixed lymphocyte reactions are described in Chapter 2.
4.2.3 Liposome synthesis
4.2.2.1 Non-targeted (conventional) liposomes
Liposomes (with/without curcumin and/or PMV) used in vivo in the following experiments
were synthesised by thin film evaporation and rehydration at the Ian Wark Institute,
University of South Australia, Adelaide as described in Chapter 2 (Section 2.7).
4.2.2.2 IL-10-containing liposomes
Liposomes were synthesised at the John Curtin School of Medical Research, Australian
National University, Canberra as described in Chapter 2 (Section 2.7). IL-10 (Peprotech)
183
was added to the preparation at the time of rehydration. Sonicated and non-sonicated
samples were made to compare incorporation of IL-10.
4.2.2.2.1 Assessment of liposomal IL-10 concentration
IL-10 containing liposomes were pelleted (centrifuged at 50,000rpm for 45 minutes at 4°C)
and separated from the supernatant containing excess, unincorporated IL-10. The liposome
pellet was dissolved in 1% Triton X-100 to release IL-10 and the concomitant
concentration in both dissolved pellet and supernatant was quantified by the ELISA Ready-
Set-GO! kit (eBioscience) according to manufacturer instructions (Chapter 2, Section 2.3).
Plates were read using Microplate Reader (Labequip) at 450nm wavelength; unknown
concentrations were calculated based on the standard curve.
4.2.2.2 PMV synthesis
PMV were synthesised at the John Curtin School of Medical Research, Australian National
University, Canberra and subsequently incorporated into liposomes as described in Chapter
2 (Section 2.7.2).
4.2.3 In vivo experiments
4.2.3.1 Mice
Experiments were performed on 8-12 week old male C57BL/6 mice with ethics committee
approval from both the Institute of Medical and Veterinary Science (IMVS) and University
of Adelaide (project number 40/09). The mice were housed in pathogen-free conditions at
the Animal Care Facility at the IMVS (Adelaide, Australia).
184
4.3 RESULTS
4.3.1 DC are targeted in vivo using conventional liposomes
The ability of unmodified liposomes to target DC in vivo was assessed using liposomes
synthesised with phosphatidylcholine and labelled with the fluorescent marker DiI. DiI was
chosen because of its strong fluorescence, high lipophilic stability and lack of transfer
between cell membranes once incorporated. To assess the cellular fate of liposomes,
spleens were examined 24 hours after intravenous administration of DiI-labelled EPC
liposomes to mice. Whole cell suspensions from digested spleen were analysed by flow
cytometry (Figure 4.3.1.1), or complete organs were embedded, sectioned and examined
by immunofluorescence microscopy (Figure 4.3.1.2). DiI-liposomes were endocytosed
almost exclusively by MHC class II+ cells within the spleen (Figure 4.3.1.1). Flow
cytometric analysis and immunofluorescence microscopy indicated that liposomes were
taken up by CD11b+F480+CD11c- macrophages and CD11c+ myeloid and plasmacytoid
DC, including B220hiCD11clo and B220loCD11chi subsets, PDCA1+ and PDCA-CD11c+
DC, and CD8+ and CD8- DC subsets. There was also substantial uptake by CD3+ T cells
within the spleen.
185
Figure 4.3.1.1 Liposomes home to antigen presenting cells in lymphoid tissue
PBS (CTRL) or fluorescent (DiI-labelled) liposomes were injected intravenously into
C57BL/6 mice and the spleen harvested after 24 hours. Spleens were digested and the
subsequent cell suspension was stained for antigen-presenting cells, including anti-CD3
FITC, anti-CD11b FITC, anti-CD11c FITC or PE-CY7, anti-F480 PE-CY5, anti-CD8�
APC, anti-B220 PE-CY5, anti-PDCA-1 FITC or anti-MHC FITC, and analysed by flow
cytometry. Red fluorescent (DiI+) cells were gated as shown (P5) in the upper panels and
appear black in each plot. Results are representative of 3 independent experiments.
CTRL DiI-liposome
Gated to CD11c negative fraction
P5
186
Figure 4.3.1.1 Liposomes home to antigen presenting cells in lymphoid tissue
CTRL DiI-liposome
187
Figure 4.3.1.1 Liposomes home to MHC class II-expressing cells and CD3+ T-cells in
lymphoid tissue
CTRL DiI-liposome
188
Figure 4.3.1.2A-D Liposomes home to antigen presenting cells in lymphoid tissue
Fluorescent (DiI-labelled) liposomes were injected into C57BL/6 mice. The spleen
harvested after 24 hours, snap frozen in OCT, sectioned, and stained. Analysis by confocal
microscopy demonstrates endocytosis by antigen-presenting cells, predominantly
macrophages and multiple DC subsets.
Figure 4.3.1.2A CTRL spleen: mouse injected with PBS, CTRL isotypes added prior to confocal microscopy
Figure 4.3.1.2B Mouse injected with DiI-labelled liposome (red), CTRL isotypes added prior to confocal microscopy
Figure 4.3.1.2C Mouse injected with DiI-labelled liposome (red), subsequently stained for CD11c FITC (green) and B220 PE-CY5 (orange)
Figure 4.3.1.2D Mouse injected with DiI-labelled liposome (red), subsequently stained for CD11c FITC (green) and CD8� (cyan)
189
Figure 4.3.1.2E-G Liposomes home to antigen presenting cells in lymphoid tissue
Figure 4.3.1.2E Mouse injected with DiI-labelled liposome (red), subsequently stained for CD11c FITC (green) and F480 PE-CY5 (yellow)
Figure 4.3.1.2F Mouse injected with DiI-labelled liposome (red), subsequently stained for MHC FITC (green)
Figure 4.3.1.2G Mouse injected with DiI-labelled liposome (red), subsequently stained for PDCA-1 FITC (green)
190
4.3.2 Liposomal incorporation of immunomodulatory agents
4.3.2.1 IL-10 incorporates into liposomes and inhibits DC allostimulatory capacity
IL-10 is an anti-inflammatory cytokine implicated in the tolerizing process, produced by
Th2 clones (440), B-cells (441), macrophages and mast cells (442). It inhibits the
allostimulatory capacity of APC, such as monocytes, macrophages and DC, by down-
regulating co-stimulatory and intercellular adhesion molecules (443-445). Immature DC
co-cultured with IL-10 induce tolerogenic DC and alloantigen-specific anergy (164). Thus,
delivery of IL-10 to tissue-resident immature DC in vivo may be useful in down-regulating
the adaptive immune response following transplantation. Therefore, the ability of IL-10 to
incorporate into a liposome preparation and the preservation of biologic activity was
investigated.
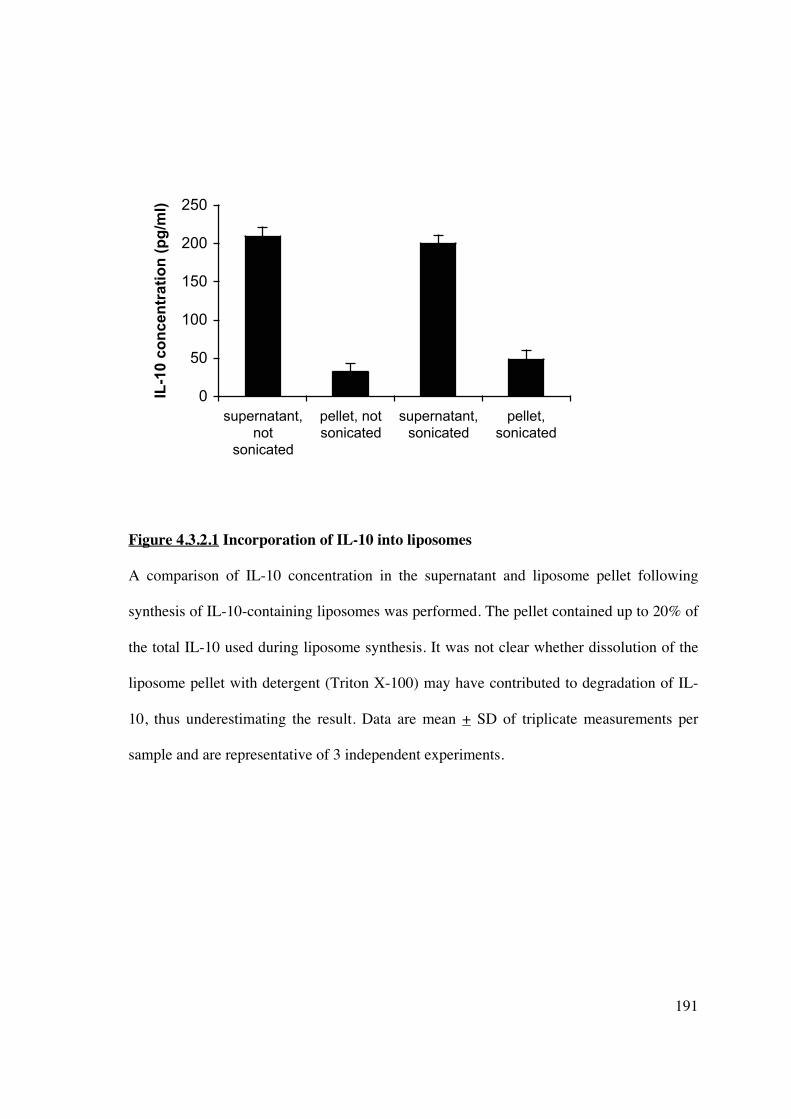
To assess the capacity of IL-10 to incorporate into liposomes, IL-10 (250pg/ml) was added
during liposome synthesis with or without sonication of samples. The liposomes were
centrifuged to separate supernatant and pellet and an ELISA determined concurrent IL-10
concentrations. IL-10 was found predominantly in the supernatant; only 32.3pg/ml (13% of
total IL-10) was incorporated into the liposome (Figure 4.3.2.1). This increased to 20%
following sonication. The process of sonication, or freeze-thawing for liposomes made
using a dehydration-aqueous buffer rehydration method, is commonly used for
encapsulation of protein (305, 348, 446). It ruptures small (20-100nm) single unilamellar
vesicles during which the solute equilibrates throughout the liposome emulsion, and
liposomes themselves fuse to produce larger unilamellar vesicles. The heterogenously sized
population can be further modified by extrusion to produce liposomes of defined size.
191
0
50
100
150
200
250
supernatant,
not
sonicated
pellet, not
sonicated
supernatant,
sonicated
pellet,
sonicated
IL-1
0 c
on
ce
ntr
ati
on
(p
g/m
l)
Figure 4.3.2.1 Incorporation of IL-10 into liposomes
A comparison of IL-10 concentration in the supernatant and liposome pellet following
synthesis of IL-10-containing liposomes was performed. The pellet contained up to 20% of
the total IL-10 used during liposome synthesis. It was not clear whether dissolution of the
liposome pellet with detergent (Triton X-100) may have contributed to degradation of IL-
10, thus underestimating the result. Data are mean + SD of triplicate measurements per
sample and are representative of 3 independent experiments.
192
4.3.2.2 IL-10 liposomes maintain biologic activity in vitro
Liposomes containing IL-10 were added at various doses to immature DC at day 5 for 48
hours. DC were harvested, washed 3 times in PBS, irradiated and co-cultured with
allogeneic T-cells (NWT) to assess allostimulatory capacity. IL-10 liposomes at various
doses led to a dose-dependent inhibition T-cell proliferation (Figure 4.3.2.2). A significant
inhibitory effect was detected at 5ng/ml, with an increase in inhibition up to 20ng/ml.
Previous studies have shown increasing inhibition to concentrations of 80ng/ml (164).
However, the liposomal incorporation of IL-10 is inefficient, such that achieving such
concentrations rapidly exhausts liposome and IL-10 stocks.
193
Figure 4.3.2.2 Liposomal IL-10 maintains biologic activity and inhibits DC
allostimulatory capacity in vitro
IL-10 liposomes inhibited DC allostimulatory capacity in a one-way MLR in a dose-
dependent manner. DC were cultured for 5 days in medium containing GM-CSF and IL-4
as described, resuspended and exposed to complete medium or increasing concentrations of
liposomal IL-10 for 2 days. After extensive washing, DC (1x10⁴) were co-cultured with
NWT (1x10⁵) for 5 days. T cell proliferation was quantified by [3H]TdR incorporation
during the last 18 hours of culture. Data are mean cpm + SD of quintuplicate wells. Results
are representative of 3 independent experiments. *p<0.05 compared to no IL-10.
* *
*
194
4.3.2.3 Curcumin liposomes in vitro demonstrate immunosuppressive activity in an MLR
Curcumin is a polyphenolic extract of turmeric with a broad range of biologic activities
(447) and has been shown to inhibit DC maturation (388). Its lipophilic nature lends itself
to liposomal formulation as it is incorporated within the phospholipid bilayer, and thus
would be likely to achieve higher concentrations compared less lipophilic agents, such as
IL-10.
Curcumin liposomes were synthesised as described in Chapter 2 (Section 2.7). To
demonstrate that curcumin contained within a liposomal formulation retains biologic
activity, we added serial dilutions of curcumin liposome to a human PBMC one-way MLR
and assessed proliferative response (Figure 4.3.2.3.1). We compared this to curcumin
added directly to the MLR culture medium (Figure 4.3.2.3.2). Once an inhibitory effect in
humans was demonstrated, we investigated the ability of curcumin liposomes to inhibit
alloproliferation of marmoset PBMC (Figure 4.3.2.3.3), in order to assess potential
applicability in a pre-clinical transplant model. The effect of liposomal curcumin on the
alloproliferative response of marmoset PBMC was less than that demonstrated in human
assays at the same dilution. This may be due to a difference in the ability of curcumin to
inhibit NHP NF�B activity.
195
0
10000
20000
30000
Single cells
Em
pty liposo
me
Curc
um
in liposo
me 1
:4
Curc
um
in liposo
me 1
:8
Curc
um
in liposo
me 1
:16
Curc
um
in liposo
me 1
:32
Curc
um
in liposo
me 1
:64
Curc
um
in liposo
me 1
:128
Curc
um
in liposo
me 1
:256
Curcumin liposome dilution added to culture medium
[3H
] th
ym
idin
e i
nc
orp
ora
tio
n (
CP
M)
Figure 4.3.2.3.1 Curcumin liposome inhibits human PBMC alloproliferative responses
in a dose-dependent manner
PBMC were isolated from 2 allogeneic human peripheral blood donors, resuspended
(1x10⁵/50μl) and exposed to complete medium or increasing concentrations of liposomal
curcumin in a 5-day MLR. Proliferation was quantified by [3H]TdR incorporation during
the last 18 hours of culture. Data are mean cpm + SD of quintuplicate wells. *p<0.05
compared to empty liposome. Results are representative of 3 independent experiments.
[3H
] th
ym
idin
e i
nc
orp
ora
tio
n
(CP
M)
*
* *
* *
196
0
10000
20000
30000
Single
cells
Culture
medium
alone
40uM 20uM 10uM 5uM 2.5uM
Curcumin dilution
[3H
] th
ym
idin
e i
nc
op
ora
tio
n (
CP
M)
Figure 4.3.2.3.2 Curcumin added in vitro to CM inhibits human PBMC
alloproliferation
PBMC were isolated from 2 allogeneic human peripheral blood donors, resuspended (at
1x10⁵/50μl) and exposed to complete medium or increasing concentrations of neat
curcumin in a 5-day MLR. Proliferation was quantified by [3H]TdR incorporation during
the last 18 hours of culture. Data are mean cpm + SD of quintuplicate wells. *p<0.05
compared to empty liposome. Results are representative of 3 independent experiments.
[3H
] th
ym
idin
e in
co
rpo
rati
on
(C
PM
)
*
*
*
197
Figure 4.3.2.3.3 The effect of curcumin liposomes on marmoset PBMC alloproliferative
response in an MLR
PBMC were isolated from 2 DRB-mismatched marmosets (as described in Chapter 2),
resuspended and exposed to complete medium or increasing concentrations of liposomal
curcumin in a 5-day MLR. Proliferation was quantified by [3H]TdR incoporation during the
last 18 hours of culture. Data are mean cpm + SD of triplicate wells. *p<0.05 compared to
untreated cells. Results are representative of 3 independent experiments.
0
5000
10000
15000
20000
Untreated Curcumin
liposome 1:8
Curcumin
liposome 1:4
Curcumin liposome dilution added to culture medium
[3H
] th
ym
idin
e in
co
rpo
rati
on
(C
PM
)
[3H
] th
ym
idin
e i
nc
orp
ora
tio
n
(CP
M) *
*
198
4.3.2.4 Curcumin liposomes delivered to splenic DC in vivo inhibit DC maturation via
NF-��B
Curcumin is a known inhibitor of NF-�B. To determine whether curcumin maintained
biologic activity following liposomal formulation and uptake in vivo, mice were injected
intravenously with either empty or curcumin liposome. After 24 hours, splenocytes were
isolated and incubated with or without LPS, a TLR agonist known to induce NF-�B
signalling. Confocal microscopy demonstrated that in the absence of LPS, p50 expression
was low in all cells (Figures 4.3.2.4.1A&C). Stimulation with LPS caused up-regulation
and nuclear translocation of NF-�B-p50 subunit only in splenocytes isolated from mice
injected with empty liposomes (Figure 4.3.2.4.1B). In contrast, LPS did not stimulate p50
expression in cells of mice injected with liposomes entrapping curcumin (Figure
4.3.2.4.1D).
Cells were also analysed by flow cytometry and gated to DiI+CD11c+, representing DC
that have endocytosed liposome. Cell surface expression of positive co-stimulatory
molecules were assessed to establish whether tissue-resident DC exposed to curcumin
liposome in vivo would fail to up-regulate cell-surface markers indicative of DC activation
in response to a maturation stimulus, identical to the response demonstrated in vitro in
Chapter 3. The results in Figure 4.3.2.4.2 demonstrate that splenic DC exposed to
curcumin in vivo developed a tolerogenic phenotype, inhibiting up-regulation of co-
stimulatory markers in response to LPS ex vivo.
199
Figure 4.3.2.4.1A-D Splenocytes exposed to liposomal curcumin in vivo demonstrate
NF-��B inhibition
C57BL/6 mice were injected with DiI-labelled liposomes (red) and the spleen harvested
after 24 hours. Splenocytes were incubated for 24 hours with or without LPS (1μg/μl) and
stained for NF-�B-p50 subunit (green). LPS induced NF-�B nuclear translocation in cells
from mice injected with empty liposome. Splenocytes from mice injected with curcumin
liposome subsequently exposed to LPS failed to demonstrate similar changes, consistent
with inhibition of NF-�B activity. Nuclear DAPI stain is blue.
Figure 4.3.2.4.1A Splenocytes from mice injected with DiI+ve empty liposome (red) subsequently stained for NF-�B-p50 subunit (green) and DAPI (blue).
Figure 4.3.2.4.1B Splenocytes from mice injected with DiI+ve empty liposome, stimulated with LPS, and subsequently stained for NF-�B-p50 subunit and DAPI.
Figure 4.3.2.4.1C Splenocytes from mouse injected with DiI+ve curcumin liposome, stained for NF-�B-p50 subunit and DAPI.
Figure 4.3.2.4.1D Splenocytes from mouse injected with DiI+ve curcumin liposome, stimulated with LPS, stained for NF-�B-p50 subunit and DAPI.
200
Figure 4.3.2.4.2A Empty liposome alone
Figure 4.3.2.4.2B Empty liposome + LPS ex vivo
Figure 4.3.2.4.2A-B DC exposed to empty liposomes in vivo mature in response to ex
vivo exposure to LPS
C57BL/6 mice were injected with DiI-labelled liposomes and the spleen harvested after 24
hours. Splenocytes were isolated and incubated overnight with or without LPS (1μg/μl).
Cells were washed extensively, stained for CD11c and positive co-stimulatory molecules,
and analysed by flow cytometry. Cells were gated to DiI and CD11c following collection
of 1x10⁶ events. DC from mice injected with empty liposome appropriately up-regulated
cell surface co-stimulatory molecule expression in response to a maturation stimulus
(Figure 4.3.2.4.2B). The percentages represent the proportion of CD11c+DiI+marker+
cells (gated to P3 or P4) compared to isotype control.
40% 19% 11% 85% 20%
57% 43% 16% 85% 28%
201
Figure 4.3.2.4.2C Curcumin liposome alone
Figure 4.3.2.4.2D Curcumin liposome + LPS ex vivo
Figure 4.3.2.4.2C-D DC exposed to liposomal curcumin in vivo demonstrate inhibition
of maturation
Cell surface expression of CD83, MHC class II and CD40, prior to treatment with LPS,
was slightly lower in CD11c+ splenic DC from mice injected with curcumin liposome
(Figure 4.3.2.4.2C) compared to cells from control mice (injected with empty liposome).
However, these DC failed to up-regulate co-stimulatory molecule expression to the same
degree (Figure 4.3.24.4.2D). Results demonstrated in Figures 4.3.2.4.2A-D are
representative of 3 independent experiments.
6%
33% 3% 77%
12%
16%
45% 28%
5%
78%
202
4.3.2.5 Splenocytes exposed to curcumin liposome in vivo demonstrate reduced
allostimulatory and alloproliferative capacity, and generate FoxP3+ Tregs in an ex vivo
MLR
Empty or curcumin liposome was injected into mice and the spleen was harvested after 24
hours. MNC were isolated, washed extensively, irradiated and co-cultured with MNC from
a MHC mismatched mouse in a 3-day MLR. MNC from mice receiving curcumin liposome
demonstrated significantly less allostimulatory capacity (Figure 4.3.2.5.1A) or less
alloproliferative capacity (Figure 4.3.2.5.1B), compared to controls. Cells from C3H or
BALB/c mice were used as responders as there was a consistently poor proliferative
response from cells isolated from C57BL/6 mice, despite MHC mismatching.
Analysis of the responding T-cell population from the primary MLR in which MNC from
injected mice were stimulators, demonstrated an increase in CD4+CD25+FoxP3+ Tregs
(Figure 4.3.2.5.2). This response was similar to the T-cell proliferative response
demonstrated in vitro in Chapter 3 using curcumin to induce tolerogenic hu-Mo-DC.
203
0
1000
2000
3000
4000
5000
C3H alone C3H : B6
empty
liposome
C3H : B6
curcumin
liposome
[3H
] th
ym
idin
e in
co
rpo
rati
on
(C
PM
)
Figure 4.3.2.5.1A Splenic MNC isolated from mice injected with curcumin liposome
demonstrate reduced allostimulatory capacity in a MLR
MNC were isolated from the spleen of mice injected with curcumin liposome or vehicle
control. After washing 3 times with PBS, MNC (1x10⁵/well) were irradiated and co-
cultured with MHC-mismatched MNC (1x10⁵/well) for 3 days. Responder cells alone
(2x10⁵ cells/well) were cultured in CM. Proliferation was quantified by [3H]TdR
incorporation during the last 18 hours of culture. Data are mean cpm + SD of quintuplicate
wells (*p<0.01 curcumin liposome versus empty liposome stimulator cells). Results are
representative of 3 independent experiments.
*
204
0
15000
30000
45000
BALB/c alone BALB/c empty
liposome : C3H
BALB/c
curcumin
liposome : C3H
[3H
] th
ym
idin
e in
co
rpo
rati
on
(C
PM
)
Figure 4.3.2.5.1B Splenic MNC isolated from mice injected with curcumin liposome
demonstrate reduced alloproliferative capacity in a primary MLR
MNC were isolated from the spleen of mice injected with curcumin liposome or vehicle
control. After washing 3 times with PBS, MNC (1x10⁵/well) were co-cultured for 3 days
with irradiated MNC (1x10⁵/well) from MHC-mismatched mice. Proliferation was
quantified by [3H]TdR incorporation during the last 18 hours of culture. Data are mean cpm
+ SD of quintuplicate wells (*p<0.01 curcumin liposome versus empty liposome
responders). Results are representative of 3 independent experiments.
*
205
Figure 4.3.2.5.2 Reduced allostimulatory capacity of MNC from curcumin liposome-
treated mice is associated with expansion of CD4+CD25+FoxP3+ Tregs
After 3-day co-culture, MNC from the primary MLR in Figure 4.3.2.5.1A were stained for
CD4 FITC, CD25 APC and FoxP3 PE, and analysed using flow cytometry. MNC co-
cultured with cells from mice receiving liposomal curcumin demonstrated expansion of
FoxP3+ Tregs compared to controls. Results are representative of 3 independent
experiments.
1.7%
1.1%
5.4%
4.5%
MNC from mice injected with empty liposome
MNC from mice injected with curcumin liposome
206
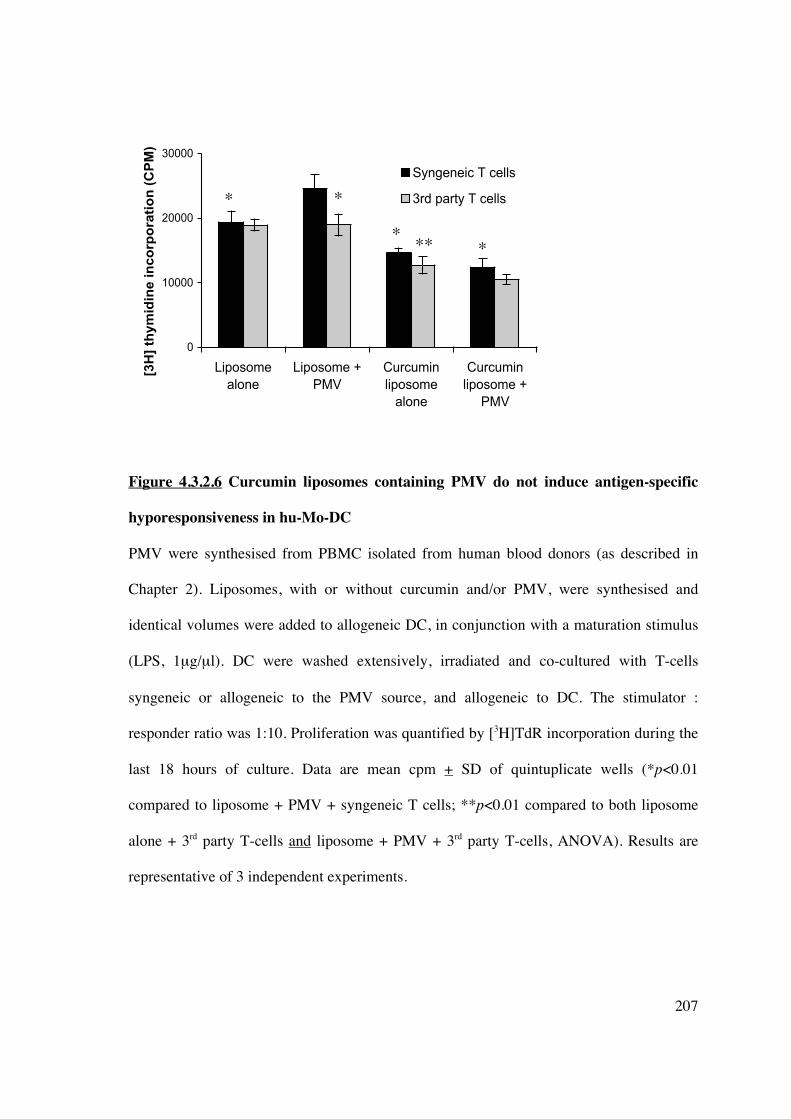
4.3.2.6 The addition of PMV to curcumin liposomes does not induce antigen-specific
hyporesponsiveness
Isolation and ex vivo modification of DC for cellular immunotherapy in transplantation
may be impractical under some circumstances. As shown in this chapter, manipulation of
DC in vivo can be achieved by using liposomes loaded with immunomodulatory agents.
Further liposomal modification may be achieved by the addition of plasma membrane
vesicles (PMV). PMV prepared from cell lines, or freshly isolated cells, retain the antigenic
signature (MHC) from which they are derived (448). Thus, liposomes used for cell-targeted
delivery of encapsulated immunomodulators could be used to transfer an antigen-specific
immunosuppressive signal by concurrent engraftment of PMV, creating a novel cell-based
vaccine.
PMV were synthesised from human PBMC (1x10⁸/ml) and stored in PBS at -80°C. T-cells
(NWT, syngeneic to the PMV) were simultaneously isolated and stored for future use.
Liposomes were synthesised with/without curcumin and/or PMV. Allogeneic hu-Mo-DC
were generated and on day 5 incubated overnight with different liposomes [(i) empty
6.3.3 Co-culture of immature or mature hu-Mo-DC with empty DC-SIGN-targeted
liposomes does not change DC phenotype or allostimulatory capacity
To establish that the liposome construct with a DC-SIGN targeting moiety but without an
incorporated immunomodulatory agent failed to change DC phenotype and function,
immature and mature DC were co-cultured in vitro with empty hu-DC-SIGN-targeted
liposomes at days 5 and 6. DC were collected on day 7, washed extensively, and stained for
cell surface markers (CD80, CD86, CD83 and MHC class II), or irradiated and added to a
MLR with allogeneic T-cells (NWT). Prior exposure of DC to liposomes in vitro did not
change expression of positive co-stimulatory molecules (Figures 6.3.3A-D) or
allostimulatory capacity (Figure 6.3.3E). The finding that empty liposomes bearing only
molecules (antibodies) engrafted by the metal-chelating linkage NTA3-DTDA cannot alter
functional DC responses suggest that their modification, by the addition of
immunomodulatory agents, can be used to modulate DC-specific immune responses in
vivo.
269
Figure 6.3.3 Hu-DC-SIGN-targeted liposomes fail to change DC phenotype
B
Figure legend
�� immature DC alone �� immature DC + liposomes �� mature DC alone �� mature DC + liposomes
Figure legend
�� immature DC alone �� immature DC + liposomes �� mature DC alone �� mature DC + liposomes
C
Figure legend
�� immature DC alone �� immature DC + liposomes �� mature DC alone �� mature DC + liposomes
Cou
nts
C
ount
s
Cou
nts
A
270
Figures 6.3.3A-C Incubation of immature and mature DC with hu-DC-SIGN-targeted
liposomes does not alter expression of positive costimulatory surface molecules, including
(A) CD80, (B) CD86, and (C) CD83.
Figure 6.3.3 Hu-DC-SIGN-targeted liposomes fail to change DC phenotype
Figure 6.3.3D Incubation of immature and mature DC with hu-DC-SIGN-targeted
liposomes does not alter expression of positive costimulatory surface molecules, including
MHC class II.
Results of Figure 6.3.3 are representative of 8 independent experiments.
Figure legend
�� immature DC alone �� immature DC + liposomes �� mature DC alone �� mature DC + liposomes
D
Cou
nts
271
Figure 6.3.3 Hu-DC-SIGN-targeted liposomes fail to alter DC allostimulatory capacity Co-culture of DC with liposomes in vitro failed to alter DC allostimulatory capacity in a
one-way MLR. Results are representative of 8 individual experiments. Data are expressed
as mean + SEM, *p<0.01 matDC vs immDC.
*
*
*
272
6.3.4 Cloning of marmoset DC-SIGN
6.3.4.1 Determination of the nucleotide and amino acid sequence for marmoset DC-
SIGN
In order to determine if hu-DC-SIGN-targeted liposomes were capable of binding to
marmoset DC-SIGN marmoset DC-SIGN was cloned. The lack of significant homology
between human and marmoset DC-SIGN meant that marmoset DC-SIGN could not be
propagated using primers for the full-length gene based on human and rhesus macaque
sequences available at www.ncbi.nih.gov/pubmed. The gene was divided roughly in half
and cloning was achieved by designing multiple sets of primers, as tabulated in Materials
and Methods (Chapter 2, Section 2.6). Sequencing was performed by the Sequencing
Facility in the Department of Haematology at Flinders Medical Centre (Bedford Park,
South Australia) and the final sequence was confirmed in 2 distinct tissues (liver, thymus
or spleen) from 3 individual marmoset monkeys. Marmoset and human DC-SIGN display
80% homology for both nucleotide and amino acid sequences. The marmoset nucleotide
sequence is truncated at 1113 base pairs (compared to 1215 base pairs for human DC-
SIGN) due to areas of deletion (Figures 6.3.4). The sequence has been confirmed by
additional groups (524).
273
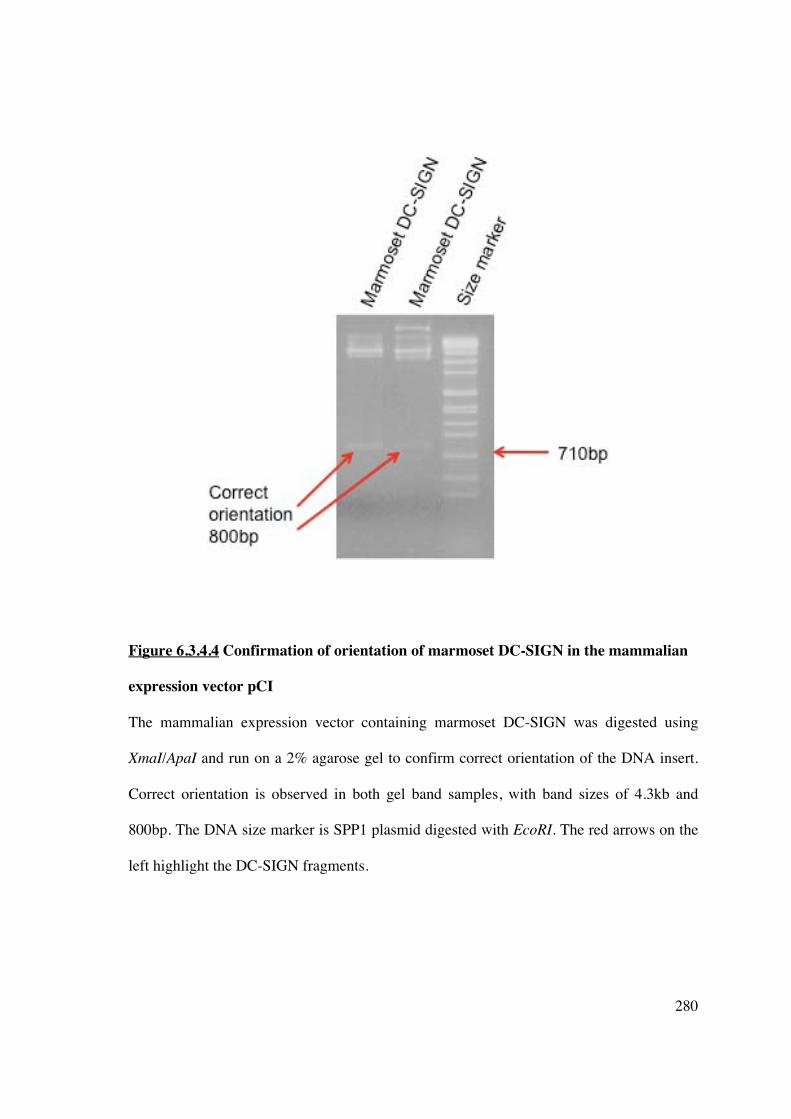
Fig
ure
6.3.
4 C
loni
ng o
f m
arm
oset
DC
-SIG
N
Fig
ure
6.3.
4.1
A c
ompa
riso
n of
the
nucl
eoti
de s
eque
nce
of m
arm
oset
and
hum
an D
C-S
IGN
.
222222222222222222222222222
274
Figure 6.3.4 Cloning of marmoset DC-SIGN
Figure 6.3.4.2 A comparison of the amino acid sequence of marmoset, rhesus macaque,
and human DC-SIGN. Differences between amino acids are highlighted in red. There is
approximately 80% homology between the marmoset and human sequences.
275
6.3.4.2 Cloning of human or marmoset DC-SIGN in pGEM��-T Easy and pCI vectors
Human or marmoset DC-SIGN DNA (PCR amplified products) were ligated into pGEM�-
T Easy at a 1 (50ng) to 3 (150ng) ratio of plasmid to insert (Figure 6.3.4.2.1), and
subsequently transformed into competent DH5� E. coli cells. Bacterial growth on LB-
ampicillin-Agar plates was due to successful uptake of pGEM�-T Easy vector conferring
resistance to ampicillin. Colonies were selected by blue/white discrimination (on LB-Xgal-
IPTG-Agar plates) as the T7 and SP6 promoters flank the �-peptide coding region of �-
galactosidase and successful insertion interrupts the coding sequence of this enzyme.
Colonies containing inserts were subjected to a maxi-prep plasmid procedure (Section
2.6.1.3) and screened by NotI digestion and agarose gel electrophoresis. Both human and
marmoset DC-SIGN were of the correct size, as determined from the DNA size marker
(Figure 6.3.4.2). NotI digested DC-SIGN were gel purified and ligated into the mammalian
expression vector pCI, which was also subjected to NotI digestion (Figure 6.3.4.2.2),
designed to promote constitutive expression of cloned DNA inserts in mammalian cells.
276
Figure 6.3.4.2.1 Pictorial representation of cloning marmoset DC-SIGN
Marmoset DC-SIGN was cloned as described above, and both human and marmoset DC-
SIGN were propagated using specific primers. PCR products, contained 3’adenine
overhangs were cloned into pGEM-T Easy vector containing 5’ thymidine overhangs to
improve ligation efficiency.
277
Figure 6.3.4.2.2 Comparison of human and marmoset DC-SIGN
Full-length human DC-SIGN was generated from primers based on the sequence from
GenBank. Marmoset DC-SIGN was cloned as above and the full sequence generated from
appropriate primers. The individual proteins were successfully ligated into the pGEM-T
Easy vector. The restriction enzyme NotI was used to release the DNA inserts and the
products run on a 2% agarose gel to confirm correct size and successful insertion. The
DNA size marker is SPP1 plasmid digested with EcoRI.
Figure 6.3.4.2.2A represents human DC-SIGN, expected size 1215bp
induced substantial allogeneic T-cell hyporesponsiveness in vitro, mediated by
CD4+CD25hiFoxP3+ Tregs, but not T-cell apoptosis. To demonstrate potential clinical
applicability, murine CD11c+ CurcDC were infused in vivo and induced subsequent T-cell
hyporesponsiveness ex vivo that was also FoxP3+Treg mediated.
The ability of conventional liposomes to target DC in vivo was investigated in Chapter 4.
The lack of modification of the phospholipid structure resulted in significant, systemic
reticuloendothelial cell uptake. Curcumin, due to its chemical structure endowing lipid
solubility, efficiently incorporated into liposomes and maintained biologic activity in vivo,
inhibiting NF-�B in LPS-stimulated splenic APC. Isolated MNC displayed reduced
allostimulatory capacity that was facilitated by expansion of Foxp3+ Tregs. DC that had
endocytosed liposomal curcumin failed to upregulate co-stimulatory molecules in response
to a maturation stimulus, in a manner similar to that demonstrated in vitro in Chapter 3.
The potential for using cell-derived membranes (plasma membrane vesicles) containing
301
relevant antigens (eg MHC) in a liposomal preparation was also explored. The presence of
PMV was able to provide a sufficient antigenic stimulus and induce an antigen-specific
immune response in vitro following co-culture with hu-Mo-DC. However, antigen-specific
hyporesponsiveness to curcumin was not demonstrated, in keeping with the lack of
antigen-specific hyporesponsiveness revealed in Chapter 3.
In the absence of a readily available small animal transplant model, the use of liposomal
curcumin in IRI was investigated in Chapter 5. Curcumin demonstrates anti-oxidant and
anti-inflammatory properties (447), and remains an excellent candidate to ameliorate
multiple aspects of IR-induced pathophysiology. Pre-treatment of mice undergoing
bilateral renal IRI with liposomal curcumin improved renal function, reduced renal
histologic injury and apoptosis, and decreased markers of renal injury (such as toll-like
receptor 4 and heat shock protein 70). Salvage of renal function was mediated by reduced
pro-inflammatory cytokine and chemokine expression, and diminished production of
reactive oxygen species due to concurrent upregulation of superoxide dismutase and
downregulation of inducible nitric oxide synthase. Thioredoxin-interacting protein was
identified as a potential novel marker of renal IRI, and overexpression was mitigated by
liposomal curcumin. The ability of liposomal curcumin to provide renal parenchymal
protection was facilitated by its endocytosis by both renal tubular epithelial cells and APC.
The former cell compartment is the main site of oxidative stress, and APC contribute to
inflammatory damage and antigen presentation, enhancing organ immunogenicity.
The use of conventional, unmodified liposomes in vivo is disadvantaged by rapid clearance,
primarily by macrophages, and this limits their potential for targeted delivery. Alterations
302
of liposome structure by the addition of targeting moieties, such as antibodies, can facilitate
selective cell binding. DC-SIGN is a pathognomonic marker of both human and non-
human primate DC, involved in pathogen phagocytosis (91, 512). In the setting of clinical
transplantation, the ability of DC in vitro and in vivo in small animal studies to promote a
tolerogenic phenotype must be extrapolated to large animal models, particularly non-
human primates, as a more accurate index of potential translational success. Chapter 6
demonstrated the results of cloning marmoset DC-SIGN, with significant nucleotide and
amino acid homology to its human counterpart. This has enabled demonstration of cross-
reactivity with anti-human DC-SIGN antibody and identification of resident DC within
marmoset tissue sections (Prasad et al., unpublished).
Creation of an immunoliposome specific for DC-SIGN exploits the functional aspects of
this cell-surface marker and theoretically improves the specificity of in vivo DC targeting.
Use of a human DC-SIGN-targeted liposome demonstrated high affinity for hu-Mo-DC,
but not a cell-line expressing marmoset DC-SIGN. Subsequent manipulation of a cross-
reactive antibody was unsuccessful in appropriately altering anti-human DC-SIGN for
liposomal attachment.
In conclusion, the ability to target both antigen and immunomodulatory agents directly to
DC has enormous potential for the development of effective immunotherapy in the form of
negative vaccines.
303
7.2 FUTURE DIRECTIONS
The work presented in this thesis provides the basis for a number of ongoing studies that
will firstly consolidate the potential of tolerogenic curcumin-treated DC to induce allograft
hyporesponsiveness. Secondly, evaluation of strategies for in vivo DC-based liposomal
targeting as alternative cell-free immunotherapy may facilitate beneficial transplant
outcomes, including tolerance.
7.2.1 Planned studies for further evaluation of tolerogenic DC (CurcDC) in vitro
and in vivo
• Assessment of indoleamine 2,3-dioxygenase (IDO) production by CurcDC
• Evaluating the ability of CurcDC to migrate to T-cell areas in secondary lymphoid
tissue by measuring CCR7 mRNA and surface protein levels (the cognate receptor of
CCL19 and CCL21).
• Further assessing the mechanism of Treg induction, particularly the conversion of naïve
CD4+CD25- T-cells into Treg by inducing FoxP3 expression.
• Optimising DC type (myeloid versus plasmacytoid) and source (splenic versus hepatic
versus renal; donor versus recipient) for transplant studies in vivo, in addition to
establishing the optimal route (subcutaneous versus intravenous administration),
timing, dose and frequency.
• Assessing the capacity of CurcDC to induce long-term allograft survival in a transplant
model, the effect on manifestations of both acute and chronic rejection particularly
transplant vasculopathy, the presence of allograft-infiltrating FoxP3+ Tregs, and
adoptive transfer studies.
304
• Identifying optimal combinatorial strategies with other immunosuppressive or
tolerizing agents.
• Application of curcumin-mediated modification of DC function in larger pre-clinical
transplant models, such as the common marmoset. The surgical team at The Queen
Elizabeth Hospital is currently developing the skills required for a marmoset renal
transplantation procedure, scheduled to commence next year.
7.2.2 Planned studies of liposomal curcumin in ischaemia-reperfusion injury
• In the murine model of ischaemia-reperfusion injury, establishing whether the effect of
liposomal curcumin on renal TEC or APC is more important in protecting against
development of renal injury. I will be employing a RIPmOVA mouse model
reconstituted with OT-1 T-cells, and assessing differences in antigen presentation and
T-cell proliferation in the draining renal lymph node that may be mediated by
liposomal curcumin.
• Assessing the effect of curcumin liposomes on infiltrating cell populations important in
IRI, such as CD4+ regulatory T-cells.
• Assessing longer-term outcomes (>7 days) following administration of liposomal
curcumin prior to renal IRI to ensure that NF�B blockade does not interfere with
tubular epithelial cell repair mechanisms.
• Optimising lipid composition to reduce hepatic reticuloendothelial cell uptake and
timing of administration to improve potential clinical applicability.
305
7.2.3 Planned studies of liposomes in transplantation
• Assessment of the ability of liposomal curcumin to prolong allograft survival, and
directly comparing outcomes with ex vivo manipulated tolerogenic DC (CurcDC),
given the additional ability of liposomal curcumin to target the indirect alloimmune
response.
• Assessment of the capacity of other immunomodulatory agents (eg sirolimus, CTLA-4)
to incorporate into liposomes, particularly DC-targeted liposomes, and alter both
function and phenotype of DC in vivo.
• Further investigation of PMV incorporation into liposome preparations and the ability
to induce antigen-specific hyporesponsiveness (not with curcumin which has failed to
generate antigen-specific responses in this study, but potentially with rapamycin).
• Synthesis of a marmoset DC-targeted liposome, assessment of liposome stability in
vitro and in vivo, and testing of the ability to target and modify tissue-resident DC in
vivo. On the basis of the cloned marmoset DC-SIGN gene, 3 antigenic peptide
sequences were identified, followed by mouse immunisations, generation of
hybridomas, production and purification of IgG monoclonal antibody. Ten clones are
now available for testing on marmoset and human monocyte-derived DC or transfected
cell lines to establish cross-reactivity. On the basis of these experiments, cross-reactive
clones could be modified for subsequent liposomal attachment.
In conclusion, there is wide scope for further developing both non-targeted and DC-
specific liposomes as cytoprotective and/or immunomodulatory options in a transplant
model, with a broad number of therapeutic avenues to be explored in the future.
306
REFERENCES
1. McDonald S, Chang S, Excell L. Chapter 4: Method and Location of dialysis. ANZDATA report 2008. 2008. 2. McDonald S, Excell L. ANZDATA Registry Report, Adelaide, South Australia. 2008. 3. Laupacis A, Kweown P, Pus N, Krueger H, Ferguson B, Wong C et al. A study of the quality of life and cost-utility of renal transplantation. Kidney Int 1996;50(1):235-242. 4. Wolfe R, Ashby V, Milford E, Ojo A, Ettenger R, Agodoa L et al. Comparison of mortality in all patients on dialysis, patients on dialysis awaiting transplantation, and recipients of a first cadaveric transplant. N Engl J Med 1999;341(23):1725-1730. 5. Howard K, Salkeld G, White F, McDonald S, Chadban S, Craig J et al. The cost effectiveness of increasing kidney transplantation and home-based dialysis. Nephrology 2009;14(1):123-132. 6. Campbell S, McDonald S, Excell L, Livingston B. Chapter 8: Transplantation. ANZDATA report 2008. 2008. 7. Danovitch GE. Handbook of kidney transplantation. Oxford University Press, UK 2004. 8. Billingham R, Brent L, Medawar P. Activity acquired tolerance of foreign cells. Nature 1953;172(4379):603-606. 9. Di Cocco P, Bonanni L, D'Angelo M, Clemente K, Greco S, Rizza V et al. Clinical operational tolerance after solid organ transplantation. Transplant Proc 2009;41:1278-1282. 10. Kawai T, Cosimi A, Spitzer T, Tolkoff-Rubin J, Suthanthiran M, Saidman S et al. HLA-mismatched renal transplantation without maintenance immunosuppression. N Engl J Med 2008;358:353-360. 11. Spitzer T, Delmonico F, Tolkoff-Rubin N, McAfee S, Sackstein R, Saidman S et al. Combined histocompatibility leukocyte antigen-matched donor bone marrow and renal transplantation for multiple myeloma with end stage renal disease: the induction of allograft tolerance through mixed lymphohematopoietic chimerism. Transplantation 1999;68:480-486. 12. Brouard S, Dupont A, Giral M, Louis S, Lair D, Bradeau C et al. Operationally tolerant and minimally immunosuppressed kidney recipients display strongly altered blood T-cell clonal regulation. Am J Transplant 2005;5:330-340. 13. Li Y, Koshiba T, Yoshizawa A, Yonekawa Y, Masuda K, Ito A et al. Analyses of peripheral blood mononuclear cells in operational tolerance after pediatric living donor liver transplantation. Am J Transplant 2004;4:2118-2125. 14. Brouard S, Mansfield E, Braud C, Li L, Giral M, Hsieh S et al. Identification of a peripheral blood transcriptional biomarker associated with operational renal allograft tolerance. Proc Natl Acad Sci 2006;104:15448-15453. 15. Ballet C, Roussey-Kesler G, Aubin J-T, Brouard S, Giral M, Miqueu P et al. Humoral and cellular responses to influenza vaccination in human recipients naturally tolerant to a kidney allograft. Am J Transplant 2006;6:2796-2801. 16. Shapiro R, Jordan M, Basu A, Scantlebury V, Potdar S, Tan H et al. Kidnye transplantation under a tolerogenic regimen of recipient pretreatment and low-dose postoperative immunosuppression with subsequent weaning. Ann Surg 2003;238:520-525.
307
17. Starzl T, Murase N, Abu-Elmagd K, Gray E, Shapiro R, Eghtesad B et al. Tolerogenic immunosuppression for organ transplantation. Lancet 2003;361:1502-1510. 18. Scandling J, Busque S, Dejbakhsh-Jones S, Benike C, Millan M, Shizuru J et al. Tolerance and chimerism after renal and hematopoietic-cell transplantation. N Engl J Med 2008;358(4):362-368. 19. Steinman R, Cohn Z. Identification of a novel cell type in peripheral lymphoid organs of mice. I. Morphology, quantitation, tissue distribution. J Exp Med 1973;137:1142-1162. 20. Steinman R, Adams J, Cohn Z. Identification of a novel cell type in peripheral lymphoid organs of mice. IV. Identification and distribution in mouse spleen. J Exp Med 1975;141(4):804-820. 21. Steinman R, Cohn Z. Identification of a novel cell type in peripheral lymphoid organs of mice. II Functional properties in vitro. J Exp Med 1974;139(2):380-397. 22. Steinman R, Kaplan. G, Witmer M, Cohn Z. Identification of a novel cell type in peripheral lymphoid organs of mice. V Purification of spleen dendritic cells, new surface markers, and maintenance in vitro. J Exp Med 1979;149(1):1-16. 23. Steinman R, Lustig D, Cohn Z. Identification of a novel cell type in peripheral lymphoid organs of mice. III. Functional properties in vivo. J Exp Med 1974;139(6):1431-1445. 24. Steinman R, Witmer M. Lymphoid dendritic cells are potent stimulators of the primary mixed leucocyte response in mice. Proc Natl Acad Sci USA 1978;75:5132. 25. Hart DNJ, Fabre JW. Demonstration and characterization of Ia-positive dendritic cells in the interstitial connective tissue of rat heart and other tissues, but not brain. J Exp Med 1981;153:347. 26. Banchereau J, Steinman R. Dendritic cells and the control of immunity. Nature 1998;392:245-251. 27. Figdor C, van Kyook Y, Adema G. C-type lectin receptors on dendritic cells and langerhans cells. Nat Rev Immunol 2002;2:77-84. 28. Matzinger P, Guerder S. Does T cell tolerance require a dedicated antigen-presenting cell? Nature 1989;338:74-76. 29. Steinman R, Turley S, Mellman I, Inaba K. The induction of tolerance by dendritic cells that have captured apoptotic cells. J Exp Med 2000;191(3):411-416. 30. Ardavin C, Wu L, Li C-L, Shortman K. Thymic dendritic cells and T cells develop simultaneously in the thymus from a common precursor population. Nature 1993;362:761-763. 31. Kelly K, Lucas K, Hochrein H, Metcalf D, Wu L, Shortman K. Development of dendritic cells in culture from human and murine thymic precursor cells. Cell Mol Biol 2001;47:43-54. 32. Naik S, Sathe P, Park H, Metcalf D, Proietto A, Dakic A et al. Development of plasmacytoid and conventional dendritic cell subtypes from single precursor cells derived in vitro and in vivo. Nat Immunol 2007;8:1217-1226. 33. Onai N, Obata-Onai A, Schmid M, Ohteki T, Jarossay D, Manz M. Identification of clonogenic common Flt3+M-CSFR+ plasmacytoid and conventional dendritic cell progenitors in mouse bone marrow. Nat Immunol 2007;8:1207-1216. 34. Inaba K, Inaba M, Deguchi M, Hagi K, Yasumizu R, Ikehara S et al. Granulocytes, macrophages, and dendritic cells arise from a common major histocompatibility complex
308
class II-negative progenitor in mouse bone marrow. Proc Natl Acad Sci USA 1993;90(7):3038-3042. 35. Izon D, Rudd K, DeMuth W, Pear W, Clendenin C, Lindsley R et al. A common pathway for dendritic cell and early B cell development. J Immunol 2001;167(3):1387-1392. 36. Manz M, Traver D, Miyamoto T, Weissman I, Akashi K. Dendritic cell potentials of early lymphoid and myeloid progenitors. Blood 2001;97(11):3333-3341. 37. Wu L, D'Amico A, Hochrein H, O'Keeffe M, Shortman K, Lucas K. Development of thymic and splenic dendritic cell populations from different hemopoietic precursors. Blood 2001;98(12):3376-3382. 38. Liu Y. Dendritic cell subsets and lineages, and their functions in innate and adaptive immunity. 2001;Cell(106):259-262. 39. Brasel K, de Smedt T, Smith J, Maliszewski C. Generation of murine dendritic cells from flt3-ligand-suuplemented bone-marrow cultures. Blood 2000;96:3029-3039. 40. Traver D, Akashi K, Manz M, Merad M, Miyamoto T, Engleman E et al. Development of CD8alpha-positive dendritic cells from a common myeloid prgogenitor. Science 2000;290(5499):2152-2154. 41. Zhang Y, Zhang Y, Ogata M, Chen P, Harada A, Hashimoto S et al. Transforming growth factor �1 polarizes murine hematopoietic progenitor cells to generate Langerhans-cell-like dendritic cells through a monocyte/macrophage differentiation pathway. Blood 1999;93:1208-1220. 42. Anjuere F, del Hoyo G, Martin P, Ardavin C. Langerhans cells develop from a lymphoid-committed precursor. Blood 2000;96:1633-1637. 43. Rissoan M. Subtractive hybridization reveals the expression of immunoglobulin-like transcript 7, Eph-B1, granzyme B, and 3 novel transcripts in human plasmacytoid dendritic cells. Blood 2002;100:3295-3303. 44. Olweus J BA, Warnke R, Thompson PA, Carballido J, Picker LJ, Lund-Johansen F. Dendritic cell ontogeny: a human dendritic cell lineage of myeloid origin. Proc Natl Acad Sci U S A 1997;94(23):12551-12556. 45. Vremec D, Lieschke G, Dunn A, Robb L, Metcalf D, Shortman K. The influence of granulocyte-macrophage colony-stimulating factor on dendritic-cell levels in mouse lymphoid organs. Eur J Immunol 1997;27:40-44. 46. Zhang Y, Mukaida N, Wang J, Harada A, Akiyama M, Matsushima G. Induction of dendritic-cell differentiation by granulocyte-macrophage colony-stimulating factor, stem cell factor and tumor necrosis factor � in vitro from lineage-phenotypes-negative c-kit+ murine hematopoietic progenitor cells. Blood 1997;90:4842-4853. 47. Georgopoulos K, Bigby M, Wang J, Molnar A, Wu P, Winandy S et al. The Ikaros gene is required for the development of all lymphoid lineages. Cell 1994;79:143-156. 48. Guerriero A, Langmuir P, Spain L, Scott E. PU.1 is required for myeloid-derived but not lymphoid-derived dendritic cells. Blood 2000;95:879-885. 49. Wu L, D'Amico A, Winkel K, Suter M, Lo D, Shortman K. RelB is essential for the development of myeloid-related CD8�- dendritic cells but not of lymphoid-related CD8�+ dendritic cells. Immunity 1998;9:839-847. 50. Galy A, Travis M, Cen D, Chen B. Human T, B, natural killer and dendritic cells arise from a common bone marrow progenitor cell subset. Immunity 1995;3(4):459-473.
309
51. Kelly K, Lucas K, Hochrein H, Metcalf D, Wu L, Shortman K. Development of dendritic cells in culture from human and murine thymic precursors. Cell Mol Biol 2001;47(1):43-54. 52. Shortman K, Liu Y-J. Mouse and human dendritic cell subtypes. Nat Rev Immunol 2002;2(3):151-161. 53. Vremec D, Pooley J, Hochrein H, Wu L, Shortman K. CD4 and CD8 expression by dendritic cell subtypes in mouse thymus and spleen. J Immunol 2000;164:2978-2986. 54. Reis e Sousa C, Hieny S, Scharton-Kersten T, Jankovic D, Charest H, Germain R et al. In vivo microbial stimulation induces rapid CD40 ligand-independent production of interleukin 12 by dendritic cells and their redistribution to T cell areas. J Exp Med 1997;186(11):1819-1829. 55. Johansson C, Kelsall B. Phenotype and function of intestinal dendritic cells. Semin Immunol 2005;17:284-294. 56. Matta B, Castellaneta A, Thomson A. Tolerogenic plasmacytoid DC. Eur J Immunol 2010;40:1-10. 57. Pulendran B, Maraskovsky E, Banchereau J, Maliszewski C. Modulating the immune response with dendritic cells and their growth factors. Trends Immunol 2001;22:41-47. 58. Nelson P, John R. Dendritic cells in the kidney. J Am Soc Nephrol 2007;18:2628-2635. 59. Soos T, Sims T, Barisoni L, Lin K, Littman D, Dustin M et al. CX3CR1+ interstitial dendritic cells form a contiguous network throughout the entire kidney,. Kidney Int 2006;70:591-596. 60. Dong X, Swaminathan S, Bachman L, Croatt A, Nath K, Griffin M. Resident dendritic cells are the predominant TNF-secreting cell in early renal ischemia-reperfusion injury. Kidney Int 2007;71:619-628. 61. Rescigno M, Di Sabatino A. Dendritic cells in intestinal homeostasis and disease. J Clin Invest 2009;119:2441-2450. 62. Merad M, Manz M, Karsunky H, Wagers A, Peters W, Charo I et al. Langerhans cells renew in the skin throughout life under steady-state conditions. Nat Immunol 2002;3:1135-1141. 63. Geissmann F. The origin of dendritic cells. Nat Immunol 2007;8:558-560. 64. Liu K, Waskow C, Liu X, Yao K, Hoh J, Nussenweig M. Origin of dendritic cells inperipheral lymphoid organs of mice. Nat Immunol 2007;8:578-583. 65. Naik S, Metcalf D, van Nieuwenhuijze A, Wicks I, Wu L, O'Keeffe M et al. Intrasplenic steady-state dendritic cell precursors that are distinct from monocytes. Nat Immunol 2006;7:663-671. 66. Donskoy E, Goldschneider I. Two developmentally distinct populations of dendritic cells inhabit that adult mouse thymus: demonstration by differential importation of hematogenous precursors under steady state conditions. J Immunol 2003;170:3514-3521. 67. Asselin-Pasturel C, Trincheri G. Production of type I interferons: plasmacytoid dendritic cells and beyond. J Exp Med 2005;202(4):461-465. 68. Björck P. Isolation and characterisation of plasmacytoid dendritic cells from Flt3 ligand and granulocyte-macrophage colony stimulating factor-treated mice. Blood 2001;98(13):3520-3526.
310
69. Cisse B, Caton M, Lehner M, Maeda T, Scheu S, Locksley R et al. Transcription factor E2-2 is an essential and specific regulator of plasmacytoid dendritic cell development. Cell 2008;135:37-48. 70. Zuniga E, McGavern D, Pruneda-Paz J, Teng C, Oldstone M. Bone marrow plasmacytoid dendritic cells can differentiate into myeloid dendritic cells upon virus infection. Nat Immunol 2004;5:1227-1234. 71. Colonna M, Trinchieri G, Liu Y. Plasmacytoid dendritic cells in immunity. Nat Immunol 2004;5:1219--1226. 72. Iwasaki A, Medzhitov R. Toll-like receptor control of the adaptive immune responses. Nat Immunol 2004;5:987-995. 73. Takeda K, Kaisho T, Akira S. Toll-like receptors. Ann Rev Immunol 2003;21:335-376. 74. Diebold S, Kaisho T, Hemmi H, Akira S, Reis E. Innate antiviral responses by means of TLR7-mediated recognition of single-stranded RNA. Science 2004;303:1529-1531. 75. Chan C, Crafton E, Fan H, Flook J, Yoshimura K, Skarica M et al. Interferon-producing killer dendritic cells provide a link between innate and adaptive immunity. Nat Med 2006;12:207-213. 76. Taieb J, Cahput N, Menard C, Apetoh L, Ullrich E, Bonmort M et al. A novel dendritic cell subset involved in tumor immunosurveillance. Nat Med 2006;12:214-219. 77. Ginhoux F, Tacke F, Angeli V, Bogunovic M, Loubeau M, Dai X et al. Langerhans cells arise from monocytes in vivo. Nat Immunol 2006;7:265-273. 78. Leon B, Lopez-Bravo M, Ardavin C. Monocyte-derived dendritic cells formed at the infection site control the induction of protective T helper 1 responses against Leishmania. Immunity 2007;26:519-531. 79. Tacke F, Randolph G. Migratory fate and differentiation of blood monocyte subsets. Immunobiology 2006;211:609-618. 80. Yrlid U, Jenkins C, MacPherson G. Relationships between distinct blood monocyte subsets and migrating intestinal lymph dendritic cells in vivo under steady-state conditions. J Immunol 2006;176:4155-4162. 81. Grouard G, Durand I, Filgueira L, Banchereau J, Liu Y-J. Dendritic cells capable of stimulating T cells within germinal centres. Nature 1996;384:364-367. 82. Shortman K, Liu Y. Mouse and human dendritic cell subtypes. Nat Rev Immunol 2002;2:151-161. 83. Kogelberg H, Feizi T. New structural insights into lectin-type proteins of the immune system. Curr Opin Struct Biol 2001;11(5):635-643. 84. Wintergerst E, Manz-Keinke H, Plattner H, Schlepper-Schäfer J. The interaction of a lung surfactant protein (SP-A) with macrophages is mannose dependent. Eur J Cell Biol 1989;50(2):291-298. 85. Sallusto F, Cella M, Danieli C, Lanzavecchia A. Dendritic cells use macropinocytosis and the mannose receptor to concentrate macromolecules in the major histocompatibility complex class II compartment: down regulation by cytokines and bacterial products. J Exp Med 1995;182:389-400. 86. Stahl P, Ezekowitz R. The mannose receptor is a pattern recognition receptor involved in host defense. Curr Opin Immunol 1998;10(1):50-55.
311
87. Jiang W, Swiggard W, Heufler C, Peng M, Mirza A, Steinman R et al. The receptor DEC-205 expressed by dendritic cells and thymic epithelial cells is involved in antigen processing. Science 1995;375:151-154. 88. Engering A, Geijtenbeek T, van vliet S, Wijers M, van Liempt E, Demaurex N et al. The dendritic cells-specific adnesion receptor DC-SIGN internalises antigen for presentation to T cells. J Immunol 2002;168:2118-2126. 89. Geijtenbeek T, Krooshoop D, Bleijs D, van vliet S, van duijnhoven G, Grabovsky V et al. DC-SIGN-ICAM-2 interaction mediates dendritic cells trafficking. Nat Immunol 2000;1:353-357. 90. Osugi Y, Vuckovic S, Hart D. Myeloid blood CD11c+ dendritic cells and monocyte-derived dendritic cells differ in their ability to stimulate T lymphocytes. Blood 2002;100:2858-2866. 91. Geijtenbeek T, van Vliet S, van Duijnhoven G, Adema G, van Kyook Y, Figdor C. Identification of DC-SIGN, a novel dendritic cell-specific ICAM-3 receptor that supports primary immune responses. Cell 2000;100:575-585. 92. van kyook Y, Geijtenbeek T. DC-SIGN: escape mechanism for pathogens. Nat Rev Immunol 2003;3(9):697-709. 93. Dzionek A, Fuchs A, Schmidt P, Cremer S, Zysk M, Miltenyi S et al. BDCA-2, BDCA-3, and BDCA-4: Three markers for distinct subsets of dendritic cells in human peripheral blood. J Immunol 2000;165:6037-6046. 94. Rossi M, Young J. Human dendritic cells: potent antigen-presenting cells at the crossroads of innate and adaptive immunity. J Immunol 2005;175:1373-1381. 95. MacDonald K, Munster D, Clark G, Dzionek A, Schmitz J, Hart D. Characterization of human blood dendritic cell subsets. Blood 2002;100:4512-4520. 96. de Saint-Vis B, Vincent J, Vandenabeele S, Vanbervliet B, Pin J-J, Aït-Yahia S et al. A novel lysosome-associated membrane glycoprotein, DC-LAMP, induced upon DC maturation, is trasiently expressed in MHC class II compartment. Immunity 1998;9:325-336. 97. Mosialos G, Birkenbach M, Ayehunie S, Matsumura F, Pinkus G, Kieff E et al. Circulating human dendritic cells differentially express high levels of a 55-kd actin-bundling protein. . Am J Pathol 1996;148(593-600). 98. Banchereau J, Briere F, Caux C, Davost J, Lebecque S, Lui Y-J et al. Immunobiology of dendritic cells. Ann Rev Immunol 2000;18(767-811). 99. Bunnell S, Hong D, Kardon J, Yamazaki T, McGlade C, Barr V et al. T cell receptor ligation induces the formation of dynamically regulated signaling assemblies. J Cell Biol 2002;158:1263-1275. 100. Huppa J, Davis M. T-cell-antigen recognition and the immunological synapse. Nat Rev Immunol 2003;3(12):973-983. 101. Monks C, Freiberg B, Kupfer H, Sciaky N, Kupfer A. Three-dimensional segregation of supramolecular activation clusters in T cells. Nature 1998;395:82-86. 102. Salomon B, Lenschow D, Rhee L, Ashourian N, Singh B, Sharpe A et al. B7/CD28 costimulation is essential for the homeostasis of the CD4+CD25+ regulatory T cells that control autoimmune diabetes. Immunity 2000;12:431-440. 103. Grohmann U, Orabona C, Fallarino F, Vacca C, Calcinaro F, Falorni A et al. CTLA4-Ig regulates tryptophan catabolism in vivo. Nat Immunol 2002;3:1097-1101.
312
104. Hart DN, Fabre JW. Localisation of MHC antigens in long surviving rat renal allografts: probable implication of passenger leukocytes in graft adaptation. Transplant Proc 1981;9(1):95-99. 105. Larsen C, Morris P, Austyn J. Migration of dendritic leukocytes from cardiac allografts into host spleens. A novel pathway for initiation of rejection. J Exp Med 1990;171:307-314. 106. Sonderbye L, Meehan S, Palsson R, Ahsan N, Ladefoged J, Langhoff E. Immunohistochemical study of actin binding protein (p55) in the human kidney. Transplantation 1998;65:1004-1008. 107. Benichou G, Valujskikh A, Heeger PS. Contributions of direct and indirect T cell alloreactivity during allograft rejection in mice. J Immunol 1999;162:352-358. 108. Jiang S, Herrera O, Lechler R. New spectrum of allorecognition pathways: implications for graft rejection and transplantation tolerance. Curr Opin Immunol 2004;16:550-557. 109. Baker R, Hernandez-Fuentes M, Brookes P, Chaudhry A, Cook H, Lechler R. Loss of direct and maintenance of indirect alloresponses in renal allograft recipients: implications for the pathogenesis of chronic allograft nephropathy. J Immunol 2001;167:7199-7206. 110. Auchincloss H, Jr., Lee R, Shea S, Markowitz J, Grusby M, Glimcher L. The role of "indirect" recognition in initiating rejection of skin grafts from major histocompatibility complex class II-deficient mice. Proc Natl Acad Sci U S A 1993;90:3373-3377. 111. Smyth L, Afzali B, Tsang J, Lombardi G, Lechler R. Intercellular transfer of MHC and immunological molecules: molecular mechanisms and biological significance. Am J Transplant 2007;7:1442-1449. 112. Rogers N, Matthew T, Kausman J, Kitching A, Coates P. Kidney dendritic cells: their role in homeostasis, inflammation and transplantation. Nephrology 2009;14:625-635. 113. McKenzie J, Beard M, Hart D. The effect of donor pretreatment on interstitial dendritic cell content and rat cardiac allograft survival. Transplantation 1984;38(4):371-376. 114. Faustman D, Steinman R, Gebel H, Hauptfeld V, Davie J, Lacy P. Prevention of rejection of murine islet allografts by pretreatment with anti-dendritic cells antibody. Proc Natl Acad Sci 1984;81(12):3864-3868. 115. Gores P, Sutherland D, Platt J, Bach F. Depletion of donor Ia+ cells before transplantation does not prolong islet allograft survival. J Immunol 1986;137(5):1482-1485. 116. Lechler RI, Batchelor JR. Restoration of immunogenicity to passenger cell depleted kidney allografts by the addition of donor strain dendritic cells. JExpMed 1982;155:31-41. 117. Athanassopoulos P, Vaessen L, Maat A, Balk A, Weimar W, Bogers A. Peripheral blood dendritic cells in human end-stage heart failure and the early post-transplant period: evidence for systemic Th1 immune responses. Eur J Cardiothorac Surg 2004;25(4):619-626. 118. Hackstein H, Renner F, Bohnert A, Nockher A, Frommer T, Bein G et al. Dendritic cell deficiency in the blood of kidney transplant patients on long-term immunosuppression: results of a prospective matched-cohort study. Am J Transplant 2005;5:2945-2953. 119. Athanassopoulos P, Vaessen L, Maat A, Zondervan P, Balk A, Bogers A et al. Preferential depletion of blood myeloid dendritic cells during acute cardiac allograft rejection under controlled immunosuppression. Am J Transplant 2005;5:810-820.
313
120. Rondelli D, Abbasian J, Arpinati M, Panaro F, Porubsky M, Manzelli A et al. Different reconstitution of peripheral blood pymphocytes and dendritic cells in liver and kidney transplant patients. Transplant Proc 2005;37:49-50. 121. Steptoe R, Patel R, Subbotin V, Thomson A. Comparative analysis of dendritic cell density and total number in commonly transplanted organs: morphometric estimation in normal mice. Transpl Immunol 2000;8(1):49-56. 122. Qian S, Lu L, Fu F, Li W, Fan P, Steptoe RJ et al. Donor pretreatment with Flt-3 ligand augments antidonor cytotoxic T lymphocyte, natural killer cell, and lymphokine-activated killer cell activities within liver allografts and alters the pattern of intragraft apoptotic activity. Transplantation 1998;65:1590-1598. 123. Steptoe R, Fu F, Li W, Drakes M, Lu L, Demetris A et al. Augmentation of dendritic cells in murine organ donors by Flt3 ligand alters the balance between transplant tolerance and immunity. J Immunol 1997;159:5483-5491. 124. Woltman A, de Fijter JW, Zuidwijk K, Vlug A, Bajema I, van der Kooij S et al. Quantification of dendritic cell subsets in human renal tissue under normal and pathological conditions. Kid Int 2007;71:1001-1008. 125. Ysebaert D, De Greef K, Vercauteren S, Ghielli M, Verpooten G, Eyskens E et al. Idenitification and kinetics of leukocytes after severe ischaemia/reperfusion injury. Nephrol Dial Transplant 2000;15(10):1562-1574. 126. Penfield J, Wang Y, Li S, Kielar M, Sicher S, Jeyarajah D et al. Transplant surgery injury recruits recipient MHC class II-positive leukocytes into the kidney. Kid Int 1999;56:1759-1769. 127. Schlichting C, Schareck W, Weis M. Renal Ischaemia-Reperfusion Injury: new implications of dendritic cell-endothelial cell interactions. Transplant Proc 2006;38:670-673. 128. Dong X, Swaminathan S, Bachman L, Croatt A, Nath K, Griffin M. Resident dendritic cells are the predominant TNF-secreting cell in early renal ischaemia-reperfusion injury. Kid Int 2007;71:619-628. 129. van Kooten C, Daha M, Van Es L. Tubular epithelial cells: a critical cell type in the regulation of renal inflammatory processes. Exp Nephrol 1999;7:429-437. 130. Shimizu Y, Murata H, Kashii Y, Hirano K, Kunitani H, Higuchi K et al. CC-chemokine receptor 6 and its ligand macrophage inflammatory protein 3alpha might be involved in the amplification of local necroinflammatory response in the liver. Hepatology 2001;34(311-19). 131. Woltman A, de Fijter J, van der Kooij S, Jie K, Massacrier C, Caux C et al. MIP-3�/CCL20 in renal transplantation and its possibel involvement as dendritic cell chemoattractant in allograft rejection. Am J Transplant 2005;5:2114-2125. 132. Huang F, Platt N, Wykes M, Major J, Powell T, Jenkins C et al. A discrete subpopulation of dendritic cells transports apoptotic intestinal epithelial cells to T cell areas of mesenteric lymph nodes. J Exp Med 2000;191(3):435-444. 133. Harshyne L, Watkins S, Gambotto A, Barratt-Boyes S. Dendritice cells acquire antigens from live cells for cross-presentation to CTL. J Immunol 2003;166:3717-3723. 134. Hawiger D, Inaba K, Dorsett Y, Guo M, Mahnke K, Rivera M et al. Dendritic cells induce peripheral T cell unresponsiveness under steady state conditions in vivo. J Exp Med 2001;194(6):769-779. 135. Sauter B, Albert M, Franciso L, Larrson M, Somersan S, Bhardwaj N. Consequences of cell death: exposure to necrotic tumor cells, but not primary tissue cells or
314
apoptotic cells, induces the maturation of immunostimulatory dendritic cells. J Exp Med 2000;191:423-433. 136. Coates PT, Thomson AW. Dendritic cells, tolerance induction and transplant outcome. Am J Transplant 2002;2(4):299-307. 137. Peugh W, Austyn J, Carter N, Wood K, Morris P. Inability of dendritic cells to prevent the blood transfusion effect in a mouse cardiac allograft model. Transplantation 1987;44(5):706-711. 138. Demetris A, Murase N, Starzl T. Donor dendritic cells after liver and heart allotransplantation under short-term immunosuppression. Lancet 1992;339(8809):1610. 139. Lu L, Rudert W, Qian S, McCaslin D, Fu F, Rao A et al. Gowth of donor-derived dendritic cells from the bone marrow of murine liver allograft recipients in response to granulocyte/macrophage colony-stimulating factor. J Exp Med 1995;182(2):379-387. 140. Josien R, Heslan M, Brouard S, Soulillou J, Cuturi M. Critical requirement for graft passenger leukocytes in allograft tolerance induced by donor blood transfusion. Blood 1998;92(12):4539-4544. 141. Gillet M, Liu Y. Generation of human CD8 T regulatory cells by CD40 ligand-activated plasmacytoid dendritic cells. J Exp Med 2002;195:695-704. 142. Moseman E, Liang X, Dawson A, Panoskaltsis-Mortari A, Krieg A, Liu Y et al. Human plasmacytoid dendritic cells activated by CpG oligonucletodies induce the generation of CD4+CD25+ regulatory T cells. J Immunol 2004;173:4433-4442. 143. Sharma M, Baban B, Chandler P, Hou D, Singh N, Yagita H et al. Plasmacytoid dendritic cells from mouse tumor-draining lymph nodes activate mature Tregs via indoleamine 2,3-dioxygenase. J Clin Invest 2007;117:2570-2582. 144. Abe M, Wang Z, de Creus A, Thomson A. Plasmacytoid dendritic cell precursors induce allogeneic T-cell hyporesponsiveness and prolong heart graft survival. Am J Transplant 2005;5:1808-1819. 145. Bjorck P, Coates P, Wang Z, Duncan F, Thomson A. Promotion of long-term heart allograft survival by combination of mobilized donor plasmacytoid dendritic cells and anti-CD154 monoclonal antibody. J Heart Lung Transplant 2005;24:1118-1120. 146. Fu F, Li Y, Qian S, Lu L, Chambers F, Starzl T et al. Costimulatory molecule-deficient dendritic cell progenitors (MHC class II+, CD80dim, CD86-) prolong cardiac allograft survival in nonimmunosuppressed recipients. Transplantation 1996;62(5):659-665. 147. Pêche H, Trinité B, Martinet B, Cuturi M. Prolongation of heart allograft survival by immature dendritic cells generated from recipient type bone marrow progenitors. Am J Transplant 2005;5(2):255-267. 148. Lutz M, Suri R, Niimi M, Ogilvie A, Kukutsch N, Rößner S et al. Immature dendritic cells generated with low doses of GM-CSF in the absence of IL-4 are maturation resistant and prolong allograft survival in vivo. Eur J Immunol 2000;30(7):1813-1822. 149. Beriou G, Peche H, Guillonneau C, Merieau E, Cuturi M. Donor-specific allograft tolerance by administration of recipient-derived immature dendritic cells and suboptimal immunosuppression. Transplantation 2005;79(8):969-972. 150. Albert M, Jegasthesan M, Darnell R. Dendritic cell maturation is required for cross-tolerization of CD8+T cells. Nat Immunol 2001;2:1010-1017. 151. Verhasselt V, Vosters O, Beuneu C, Nicaise C, Stordeur P, Goldman M. Induction of FOXP3-expressing regulatory CD4pos T cells by human mature autologous dendritic cells. Eur J Immunol 2004;34(3):762-772.
315
152. Morelli A, Thomson A. Tolerogenic dendritic cells and the quest for transplant tolerance. Nat Rev Immunol 2007;7:610-621. 153. Lu L, McCaslin D, Starzl T, Thomson A. Bone marrow-derived dendritic cell progenitors (NLDC 145+, MHC class II+, B7-1dim, B7-2-) induce alloantigen-specific hyporesponsiveness in murine T lymphocytes. Transplantation 1995;60:1539-1545. 154. Yamazaki S, Iyoda T, Tarbell K, Olson K, Velinzon K, Inaba K et al. Direct expansion of functional CD25+CD4+ regulatory T cells by antigen-processing dendritic cells. J Exp Med 2003;198(2):235-247. 155. Fu F, Li Y, Qian S, Lu L, Chambers F, Starzl T et al. Costimulatory molecule-deficient dendritic cell progenitors (MHC class II+,CD80dim, CD86-) prolong cardiac allograft survival in nonimmunosuppressed recipients. Transplantation 1996;62:659-665. 156. Peche H, Trinite B, Martinet B, Cuturi M. Prolongation of heart allograft survival by immature dendritic cells generated from recipient type bone marrow progenitors. Am J Transplant 2003;5:255-267. 157. Mennechet F, Uze G. Interferon lambda-treated dendritic cells specifically induce proliferation of FOXP3-expressing suppressor T cells. Blood 2006;107:4417-4423. 158. Chorny A, Gonzalez-Rey E, Fernandez-Martin A, Pozo D, Ganea D, Delgardo M. Vasoactive intestinal peptide induces regulatory dendritic cells with therapeutic effects on autoimmune disorders. Proc Natl Acad Sci 2005;102:13562-13567. 159. Rutella S, Bonanno G, Procoli A, Mariotti A, de Ritis D, Curti A et al. Hepatocyte growth factor favors monocyte differentiation into regulatory interleukin (IL)-10++IL-12low/neg accessory cells with dendritic-cell features. Blood 2006;108:218-227. 160. Brandt K, Bulfone-Paus S, Foster D, Ruckert R. Interleukin-21 inhibits dendritic cell activation and maturation. Blood 2003;102:4090-4098. 161. Lutz M, Girolomoni G, Ricciardi-Castagnoli P. The role of cytokines in functional regulation and differentiation of dendritic cells. Immunobiology 1996;195:431-455. 162. Caux C, Maasacrier C, Vanbervliet B, Barthelemy C, Liu Y, Banchereau J. Interleukin 10 inhibits the primary allogeneic T cell response to human epidermal Langerhans cells. Int Immunol 1994;6:1177-1185. 163. Bonham C, Lu L, Banas R, Fontes P, Rao A, Starzl T et al. TGF-beta 1 pre-treatment impairs the allostimulatory function of human bone marrow-derived antigen-presenting cells for both naive and primed T cells. Transpl Immunol 1996;4:186-191. 164. Steinbrink K, Wölfl M, Jonuleit H, Knop J, Enk A. Induction of tolerance by IL-10-treated dendritic cells. J Immunol 1997;159:4772-4780. 165. Ludewig B, Odermatt B, Landmann S, Hengartner H, Zinkernagel R. Dendritic cells induce autoimmune diabetes and maintain disease via de novo formation of local lymphoid tissue. J Exp Med 1998;188(8):1493-1501. 166. De Smedt T, Van Mechelen M, De Becker G, Urbain J, Leo O, Moser M. Effect of interleukin-10 on dendritic cell maturation and function. Eur J Immunol 1997;27(5):1229-1235. 167. Iwasaki A, Kelsall B. Freshly isolated Peyer's patch, but not spleen, dendritic cells produce interleukin 10 and induce the differentiation of T helper type 2 cells. J Exp Med 1999;190:229-239. 168. Khanna A, Morelli A, Zhong C, Takayama T, Lu L, Thomson A. Effectls of liver-derived dendritic cell progenitors on Th1- and Th2-like cytokine responses in vitro and in vivo. J Immunol 2000;160:1346-1354.
316
169. Macatonia S, Doherty T, Knight S, O'Garra A. Differential effect of IL-10 on Dendritic cell-induced T cell proliferation and IFN-y production. J Immunol 1993;150(9):3755-3765. 170. De Smedt T, van Mechelen M, De Becker G, Urbain J, Leo O, Moser M. Effect of interleukin-10 on dendritic cell maturation and function. Eur J Immunol 1997;27(5):1229-1235. 171. Steinbrink K, Wolfl M, Jonuleit H, Knop J, Enk A. Induction of tolerance by IL-10-treated dencritic cells. J Immunol 1997;159:4772-4780. 172. Asseman C, Mauze S, Leach M, Coffman R, Powrie F. An essential role for interleukin 10 in the function of regulatory T cells that inhibit intestinal inflammation. J Exp Med 1999;190:995-1004. 173. Moore K, de Waal Malefyt R, Coffman R, O'Garra A. Interluekin-10 and the interleukin-10 receptor. Ann Rev Immunol 2001;19:683-765. 174. de Waal Malefyt R, Yssel H, Roncarolo M, Spits H, de Vries J. Interleukin-10. Curr Opin Immunol 1992;4:314-320. 175. Holler E, Roncarolo M, Hintermeier-Knabe R, Eissner G, Ertl B, Schultz U et al. Prognostic significance of increased IL-10 production in patients prior to allogeneic bone marrow transplantation. Bone Marrow Transplant 2000;25:237-241. 176. Hempel L, Korholz D, Nussbaum P, Bonig H, Burdach S, Zintl F. High interleukin-10 serum levels are associated with fatal outcome in patients after bone marrow transplantation. Bone Marrow Transplant 1997;20:365-368. 177. Qian S, Li W, Li Y, Fu F, Lu L, Fung J et al. Systemic administration of cellular interleukin-10 can exacerbate cardiac allograft rejection in mice. Transplantation 1996;62(12):1709-1714. 178. Li W, Fu F, Lu L, Narula S, Fung J, Thomson A et al. Recipient pre-treatment with mammalian IL-10 prolongs mouse cardiac allograft survival by inhibition of anti-donor T cell responses. Transplant Proc 1999;31:115. 179. Yamaguchi Y, Tsumura H, Miwa M, Inaba K. Contrasting effects of TGF-beta 1 and TNF-alpha on the development of dendritic cells from progenitors in mouse bone marrow. Stem Cells 1997;15:144-153. 180. Wallet M, Sen P, Tisch R. Immunoregulation of dendritic cells. CM&R 2005;3:166-175. 181. Fainaru O, Woolf E, Lotem J, Yarnus M, Brenner O, Goldenberg D et al. RunX3 regulates mouse TGF-beta-mediated dendritic cell function and its absence results in airway inflammation. EMBO J 2004;23:969-979. 182. Sun W, Wang Q, Zhang L, Pan J, Zhang M, Lu G et al. TGF-beta(1) gene modified immature dendritic cells exhibit enhanced tolerogenicity but induce allograft fibrosis in vivo. J Mol Med 2002;80:514-523. 183. Matasic R, Dietz A, Vuk-Pavlovic S. Dexamethasone inhibits dendritic cell maturation by redirecting differentiation of a subset of cells. J Leukoc Biol 1999;66:909-914. 184. Piemonti L, Monti P, Allavena P, Sironi M, Soldini L, Leone B et al. Glucocorticoids affect human dendritic cell differentiation and maturation. J Immunol 1999;162:6473-6481. 185. Matyszak M, Citterio S, Rescigno M, Ricciardi-Castagnoli P. Differential effects of corticosteroids during different stages of dendritic cell maturation. Eur J Immunol 2000;30:1233-1242.
317
186. Rea D, van Kooten C, van Mejgaarden K, Ottenhoff T, Melief C, Offringa R. Glucocorticoids transform CD40-triggering of dendritic cells into an alternative activation pathway resulting in antigen-presenting cells that secrete IL-10. Blood 2000;95(10):3162-3167. 187. Hewison M, Freeman L, Hughes S, Evans K, Bland R, Eliopoulos A et al. Differential regulation of vitamin D receptor and its ligand in human monocyte-derived dendritic cells. J Immunol 2003;170(11):5382-5390. 188. Griffin M, Lutz W, Phan V, Bachman L, McKean D, Kumar R. Dendritic cell modulation by 1a, 25 dihydroxyvitamin D3 and its analogues: a Vitamin D receptor-dependent pathway that promotes a persistent state of immaturity in vitro and in vivo. Proc Natl Acad Sci U S A 2001;98:6800-6805. 189. Gregori S, Casorati M, Amuchastegui S, Smiroldo S, Davalli A, Adorini L. Regulatory T cells induced by 1�, 25-dihydroxyvitamin D3 and mycophenolate mofetil treatment mediate transplant tolerance. J Immunol 2001;167:1945-1953. 190. Hackstein H, Thomson A. Dendritic cells: emerging pharmacological targets of immunosuppressive drugs. Nature Rev Immunol 2004;4:24-34. 191. Kiani A, Rao A, Aramburu J. Manipulating immune responses with immunosuppressive agents that target NFAT. Immunity 2000;12:359-372. 192. Groettrup M, Soza A, Eggers M, Kuehn L, Dick T, Schild H et al. A role for the proteosome regulator PA28� in antigen presentation. Nature 1996;381:166-168. 193. Hackstein H, Taner T, Logar A, Thomson A. Rapamycin inhibits macropinocytosis and mannose receptor-mediated endocytosis by bone marrow-derived dendritic cells. Blood 2002;100:1084-1087. 194. Tajima K, Amakawa R, Ito T, Miyaji M, Takebayashi M, Furuhara S. Immunomodulatory effects of cyclosporin A on human peripheral blood dendritic cell subsets. Immunology 2003;108:321-328. 195. Duperrier K, Farre A, Bienvenu J, Bleyzac N, Bernard J, Gebuhrer L et al. Cyclosporin A inhibits dendritic cell maturation promoted by TNF� or LPS but not by double-stranded RNA or CD40L. J Leukoc Biol 2002;72:953-961. 196. Szabo G, Gavala C, Mandrekar P. Tacrolimus and cyclosporine A inhibit allostimulatory capacity and cytokine production of human myeloid dendritic cells. J Investig Med 2001;49:442-449. 197. Hackstein H, Taner T, Zahorchak A, Morelli A, Logar A, Gessner A et al. Rapamycin inhibits IL-4-induced dendritic cell maturation in vitro and dendritic cell mobilization and function in vitro. Blood 2003;101:4457-4463. 198. Turnquist H, Raimondi G, Zahorchak A, Fischer R, Wang Z, Thomson A. Rapapmycin-conditioned dendritic cells are poor stimulators of allogeneic CD4+ T cells, but enrich for antigen-specific FoxP3+ T regulatory cells and promote organ transplant tolerance. J Immunol 2007;178:7018-7031. 199. Li Y, Li X, Zheng X, Wells A, Turka L, Strom T. Blocking both signal 1 and signal 2 of T-cell activation prevents apoptosis of alloreactive T cells and induction of peripheral allograft tolerance. Nat Med 1999;5:1298-1302. 200. Shirasugi N, Aramaki O, Hatano M, Suda H, Tanaka K, Inoue F et al. Synergistic effect of 15-deoxyspergualin associates with donor-specific indirect pathway unresponsiveness. Transplant Proc 2004;36:2446-2447.
318
201. Yang J, Bernier S, Ichim T, Li M, Xia X, Zhou D et al. LF15-0195 generates tolerogenic DC by suppression of NF-�B signaling through inhibition of IKK activity. J Leukoc Biol 2003;74:438-447. 202. Min W, Zhou D, Ichim T, Strejan G, Xia X, Yang J et al. Inhibitory feedback loop between tolerogenic dendritic cells and regulatory T cells in transplant tolerance. J Immunol 2003;170:1304-1312. 203. Martin E, O'Sullivan B, Low P, Thomas R. Antigen-specific suppression of a primed immune response by dendritic cells mediated by regualtory T cells secreting interluekin-10. Immunity 2003;18:155-167. 204. Matasic R, Dietz A, Vuk-Pavlovic S. Cyclooxygenase-independent inhibition of dendritic cell maturation by aspirin. Immunology 2000;101:53-60. 205. Verhasselt V, Vanden Berghe W, Vanderheyde N, Willems F, Haegeman G, Goldman M. N-acetyl-L-cysteine inhibits primary human T-cell responses at the dendritic cell level: association with NF-�B inhibition. J Immunol 1999;162:2569-2574. 206. Steinschulte C, Taner T, Thomson A, Bein G, Hackstein H. Cutting edge: sanglifherin A, a novel cyclophilin-binding immunsuppressant blocks bioactive IL-12 production by human dendritic cells. J Immunol 2003;171:542-546. 207. Mehling A, Garabbe S, Voskort M, Schwarz T, Luger T, Belssert S. Mycophenolate mofetil impairs the maturation and function of murine dendritic cells. J Immunol 2000;165:2374-2381. 208. Thery C, Zitvogel L, Amigorena S. Exosomes: composition, biogenesis and function. Nat Rev Immunol 2002;2:569-579. 209. Thery C, Regnault A, Garin J, Wolfers J, Zitvogel L, Ricciardi-Castagnoli P et al. Molecular characterization of dendritic-cell-derived exosomes. Selective accumulation of the heat-shock protein hsc73. J Cell Biol 1999;147:599-610. 210. Thery C, Boussac M, Veron P, Ricciardi-Castagnoli P, Raposo G, Garin J et al. Proteomic analysis of dendritic-cell-derived exosomes: a secreted subcellular compartment distinct from apoptotic vesicles. J Immunol 2001;166:7309-7318. 211. Morelli A, Larregina A, Shufesky W, Sullivan M, Stolz D, Papworth G et al. Endocytosis, intracellular sorting, and processing of exosomes by dendritic cells. Blood 2004;104:3257-3266. 212. Karlsson M, Lundin S, Dahlgren U, Kahu H, Petersson I, Telemo E. "Tolerosomes" are produced by intestinal epithelial cells. Eur J Immunol 2001;31:2892-2900. 213. Peche H, Renausin K, Beriou G, Merieau E, Amigorena S, Cuturi M. Induction of tolerance by exosomes and short-term immunosuppression in a fully MHC-mismatched rat cardiac allograft model. Am J Transplant 2006;6:1541-1550. 214. Huang F, Platt N, Wykes M, Major J, Powell T, Jenkins C et al. A discrete subpopulation of dendritic cells transports apoptotic intestinal epithelial cells to T cell areas of mesenteric lymph nodes. J Exp Med 2000;191:435-443. 215. Steinman R, Turley S, Mellman I, Inaba K. The induction of tolerance by dendritic cells that have captured apoptotic cells. J Exp Med 2000;191:411-416. 216. Sauter B, Albert M, Francisco L, Larsson M, Somersan S, Bhardwaj N. Consequences of cell death: exposure to necrotic tumor cells, but not primary tissue cells or apoptotic cells, induces the maturation of immunostimulatory dendritic cells. J Exp Med 2000;191:423-433.
319
217. Sen P, Wallet M, Yi Z, Huang Y, Henderson M, Mathews C et al. Apoptotic cells induce Mer tyrosine kinase-dependent blockade of NF-�B activation in dendritic cells. Blood 2007;108:653-660. 218. Morelli A, Larregina A, Shufesky W, Zahorchak A, Logar A, Papworth G et al. Internalization of circluating apoptotic cells by splenic marginal zone dendritic cells: dependence on complement receptors and effect on cytokine production. Blood 2003;101:611-620. 219. De Carvalho Bittencourt M, Perruche S, Contassot E, ******. Intravenous injection of apoptotic leukocytes enhances bone marrow engraftment across major histocompatibility barriers. Blood 2001;98:224-230. 220. Ferguson T, Herndon J, Elzey B, Griffith T, Schoenberger S, Green D. Uptake of apoptotic antigen-coupled cells by lymphoid dendritic cells and cross-priming of CD8�+ T cells produce active immune unresponsiveness. J Immunol 2002;168:5589-5595. 221. Wang Z, Larregina A, Shufesky W, Perone M, Montecalvo A, Zahorchak A et al. Use of the inhibitory effect of apoptotic cells on dendritic cells for graft survival via T-cell deletion and regulatory T cells. Am J Transplant 2006;6:1297-1311. 222. Fu C, Chuang Y, Huang Y, Chiang B. Induction of IL-10 producign CD4+ T cells with regulatory activities by stimulation with IL-10 gene-modified bone marrow derived dendritic cells. Clin Exp Immunol 2008;153:258-268. 223. Coates P, Krishnan R, Kireta S, Johnston J, Russ G. Human myeloid dendritic cells transduced with adenoviral interleukin-10 gene construct inhibit human skin graft rejection in humanized NOD-scid chimeric mice. Gene Ther 2001;8(16):1224-1233. 224. Jago C, Yates J, Camara N, Lechler R, Lombardi G. Differential expression of CTLA-4 among T cell subsets. Clin Exp Immunol 2004;136:463-471. 225. Mellor AL, Baban B, Chandler P, Marshall B, Jhaver K, Hansen A et al. Cutting edge: induced indoleamine 2,3 dioxygenase expression in dendritic cell subsets suppresses T cell clonal expansion. J Immunol 2003;171(4):1652-1655. 226. Tan PH, Yates JB, Xue SA, Chan C, Jordan WJ, Harper JE et al. Creation of tolerogenic human dendritic cells via intracellular CTLA4: a novel strategy with potential in clinical immunosuppression. Blood 2005;106(9):2936-2943. 227. Yang DF, Qiu WH, Zhu HF, Lei P, Wen X, Dai H et al. CTLA4-Ig-modified dendritic cells inhibit lymphocyte-mediated alloimmune responses and prolong the islet graft survival in mice. Transpl Immunol 2008;19(3-4):197-201. 228. Larsen C, Pearson T, Adams A, Tso P, Shirasugi N, Strobert E et al. Rational development of LEA29Y (belatacept), a high-affinity variant of CTLA4-Ig with potent immunosuppressive properties. Am J Transplant 2005;5:443-453. 229. Pfefferkorn E. Interferon-gamma blocks the growth of Toxoplasma gondii in human fibroblasts by inducing the host cell to induce tryptophan. Proc Natl Acad Sci 1984;81:908-912. 230. Yoshida R, Park S, Yasui H, Takikawa O. Tryptophan degradation in transplanted tumor cells undergoing rejection. J Immunol 1988;141:2819-2823. 231. Takikawa O, Habara-Ohkubo A, Yoshida R. IFN-� is the inducer of indoleamine 2,3-dioygenase in allografted tumor cell sundergoing rejection. J Immunol 1990;145:1246-1250. 232. Munn D, Zhou M, Attwood J, Bondarev I, Conway S, Marshall B et al. Prevention of allogeneic fetal rejection by tryptophan catabolism. Science 1998;281:1191-1193.
320
233. Babcock T, Carlin J. Synergistic transcriptional activation of indoleamine 2,3-dioxygenase in interleukin 1 and tumor necrosis factor � in interferon-treated epithelial cells. . Cytokine 2000;12:588-594. 234. Fujigaki S, Saito K, Sekikawa K, Tone S, Takikawa O, Fujii H et al. Lipopolysaccharide induction of indoleamine 2,3-dioxygenase is mediated dominantly by an IFN-� independent mechanism. Eur J Immunol 2001;31:2313-2318. 235. Fallarino F, Vacca C, Orabona C, Belladonna M, Bianchi R, Marshall B et al. Functional expression of indoleamine 2,3-dioxygenase by murine CD8�+ dendritic cells. Int Immunol 2002;14(1):65-68. 236. Grohmann U, Bianchi R, Orabona C, Fallarino F, Vacca C, Micheletti A et al. Functional plasticity of dendritic cell subsets as mediated by CD40 versus B7 activation. J Immunol 2003;171:2581-2587. 237. Yu G, Fang M, Gong M, Liu L, Zhong J, Feng W et al. Steady state dendritic cell with forced IDO expression induce skin allograft tolerance by upregulation of regulatory T cells. Transpl Immunol 2008;13:208-219. 238. Hwu P, Du M, Lapointe R, Do M, Taylor M, Young H. Indoleamine 2,3-dioxygenase production by human dendritic cells results in the inhibition of T cell proliferation. J Immunol 2000;164:3596-3599. 239. Terness P, Chuang J, Bauer T, Jiga L, Opetz G. Regulation of human auto- and alloreactive T cells by indoleamine 2,3-dioxygenase (IDO)-producing dendritic cells: too much ado about IDO. Blood 2005;105(6):2480-2486. 240. Munn D, Sharma M, Lee J, Jhaver K, Johnson T, Keskin D et al. Potential regulatory funtion of human dendritic cells expressing indoleamine 2,3-dioxygenase. Science 2002;297:1867-1870. 241. Andreakos E, Smith C, Monaco C, Brennan F, Foxwell B. Ikappa B kinase 2 but not NF-kappa B-inducing kinase is essential for effective DC antigen presentation in the allogeneic mixed lymphocyte reaction. Blood 2003;101(3):983-991. 242. Bonham C, Peng L, Liang X, Chen W, Wang L, Hackstein H et al. Marked prolongation of cardiac allograft survival by dendritic cells geneticall engineered with NF-kappa B oligodeoxyribonucleotide decoys and adenoviral vectors encoding CTLA4-Ig. J Immunol 2002;169(6):3382-3391. 243. Zahorchak A, Kean L, Tokita D, Turnquist H, Abe M, Finke J et al. Infusion of stably immature monocyte-derived dendritic cell plus CTLA4Ig modulates alloimmune reactivity in rhesus macaques. Transplantation 2007;84(2):196-206. 244. Dhodapkar MV, Steinman RM, Krasovsky J, Munz C, Bhardwaj N. Antigen-specific inhibition of effector T cell function in humans after injection of immature dendritic cells. J Exp Med 2001;193:233-238. 245. Gershon R, Kondo K. Cell interactions in the induction of tolerance - the role of thymic lymphocytes. Immunology 1970;21:723-735. 246. Shevach E. Certified professionals: CD4+CD25+ suppressor T cells. J Exp Med 2001;193:F41-45. 247. Modigliani Y, Coutinho A, Pereira P, Le Douarin N, Thomas-Vaslin V, Burlen-Defranoux O et al. Establishment of tissue-specific tolerance is driven by regulatory T cells selected by thymic epithelium. Eur J Immunol 1996;26:1807-1815. 248. Papiernik M, de Moraes M, Pontoux C, Vassuer F, Penit C. Regulatory CD4 T cells: expression of IL-2R� chain, resistance to clonal deletion and IL-2 dependency. . Int Immunol 1998;10:371-378.
321
249. Wood K, Sakaguchi S. Regulatory T cells in transplantation tolerance. Nat Rev Immunol 2003;3:199-210. 250. Sakaguchi S, Sakaguchi N, Asano M, Itoh M, Toda M. Immunologic self-tolerance maintained by activated T cells expressing IL-2 receptor �-chains (CD25). Breakdown of a single mechanism of self-tolerance causes various autoimmune diseases. J Immunol 1995;155:1151-1164. 251. Stephens L, Mottet C, Mason D, Powrie F. Human CD4+CD25+ thymocytes and peripheral T cells have immune suppression activity. Eur J Immunol 2001;31:1247-1254. 252. Itoh M, Takahashi T, Sakaguchi N. Thymus and autoimmunity: production of CD25+CD4+ naturally anergic and suppressive T cells as a key function of the thymus in maintaining immunologic self-tolerance. J Immunol 1999;162:5317-5326. 253. Thornton A, Shevach E. CD4+CD25+ immunoregulatory T cells suppress polyclonal T cell activation in vitro by inhibiting interleukin 2 production. J Exp Med 1998;188:287-296. 254. Baecher-Allan C, Brown J, Freeman G, Hafler D. CD25+CD4+ high regulatory cells in human peripheral blood. J Immunol 2001;167:1245-1253. 255. Sakaguchi S, Fukuma K, Kuribayashi K. Organ-specific autoimmune disseases induced in mice by elimination of T cell subset. I. Evidence for the active participation of T cells in natural self-tolerance; deficit of a T cell subset as a possible cause of autoimmune disease. J Exp Med 1985;161:72-87. 256. Shimizu J, Yamazaki S, Takahashi T, Ishida Y, Sakaguchi S. Stimulation of CD25+CD4+ regulatory T cells through GITR breaks immunological self-tolerance. Nature Immunol 2002;3:135-142. 257. Lehmann J, Huehn J, de la Rosa M, Maszyna F, Kretschmer U, Krenn V et al. Expression of the integrin �E�7 identifies unique subsets of CD25+ as well as CD25- regulatory T cells. . Proc Natl Acad Sci 2002;99:13031-13036. 258. Davies J, O'Connor E, Hall D, Krahl T, Trotter J, Sarvetnick N. CD4+CD45RBlow density cells from untreated mice prevent acute allograft rejection. J Immunol 1999;163:5353-5357. 259. Takahashi T, Tagami T, Yamazaki S, Uede T, Shimizu J, Sakaguchi N et al. Immunologic self-tolerance maintained by CD25+CD4+ regulatory T cells constitutively express cytotoxic T lymphocyte-associated antigen 4. J Exp Med 2000;192:303-309. 260. Hori S, Nomura T, Sakaguchi S. Control of regulatory T cell development by the transcription factor Foxp3. Science 2003;299(5609):1057-1061. 261. van Maurik A, Wood K, Jones N. Cutting edge: CD4+CD25+ alloantigen-specific immunoregulatory cells that prevent CD8+ T-cell-mediated graft rejection: implications for anti-CD154 immunotherapy. J Immunol 2002;169:5401-5404. 262. Thornton A, Shevach E. Suppressor effector function of CD4+CD25+ immunoregulatory T cells is antigen non-specific. J Immunol 2000;164:183-190. 263. Suri-Payer E, Amar A, Thornton A, Shevach E. CD4+CD25+ T cells inhibit both the induction and effector function of autoreactive T cells and represent a unique lineage of immunoregulatory cells. J Immunol 1998;160:1212-1218. 264. Hall B, Pearce N, Gurley K, Dorsch S. Specific unresponsiveness in rats with prolonged cardiac allograft survival after treatment with cyclosporine. III Further characterisation of the CD4+ suppressor cell and its mechanism of action. J Exp Med 1990;171:141-157.
322
265. Hoffman P, Ermann J, Edinger M, Fathman C, Strober S. Donor-type CD4+CD25+ regulatory T cells suppress lethal acute graft-versus-host disease aftera llogeneic bone marrow transplantation. J Exp Med 2002;196:389-399. 266. Cederbom L, Hall H, Ivers F. CD4+CD25+ regulatory T cells down-regulate co-stimulatory molecules on antigen presenting cells. Eur J Immunol 2000;30:1538-1543. 267. Jonuleit H, Schmitt E, Kakirman H, Stassen M, Knop J, Enk A. Infectious tolerance: human CD25+ regulatory T cells convey suppressor activity to conventional CD4+ T helper cells. J Exp Med 2002;196:255-260. 268. Qin S, Cobbold S, Pope H, Elliott J, Kiossis D, Davies J et al. "Infectious" transplant tolerance. Science 1993;259:974-977. 269. Madsen J, Superina R, Wood K, Morris P. Immunological unresponsiveness induced by recipient cells transfected with donor MHC genes. Nature 1988;332:161-164. 270. Jonuleit H, Schmitt E, Schuler G, Knop J, Enk A. Induction of interleukin-10 producing, nonproliferating CD4+ T cells with regulatory properties by repetitive stimulation with allogeneic immature human dendritic cells. J Exp Med 2000;192(9):1213-1222. 271. Bacchetta R, Bigler M, Touraine J, Parkman R, Tovo P, Abrams J et al. High levels of interleukin 10 production in vivo are associated with tolerance in SCID patients transplanted with HLA mismatched hematopoietic stem cells. J Exp Med 1994;179:493-502. 272. VanBuskirk A, Burlingham W, Jankowska-Gan E, Chin T, Kusaka S, Geissler F et al. Human allograft acceptance is associated with immune regulation. J Clin Invest 2000;106:145-155. 273. Kumanogoh A, Wang X, Lee I, Watanabe C, Kamanaka M, Shi W et al. Increased T cell autoreactivity in the absence of CD40-CD40 ligand interactions: a role of CD40 in regulatory T cell development. J Immunol 2001;166(1):353-360. 274. Salomon B, Lenschow D, Rhee L, Ashourian N, Singh B, Sharpe A et al. B7/CD28 costimulation is essential for the homeostasis of the CD4+CD25+ immunoregulatory T cells that control autoimmune diabetes. Immunity 2000;12(4):431-440. 275. Becker J, Brabletz T, Kirchner T, Conrad C, Bröcker E, Reisfeld R. Negative transcriptional regulation in anergic T cells. Proc Natl Acad Sci 1995;92(6):2375-2378. 276. Beverly B, Kang S, Lenardo M, Schwartz R. Reversal of in vitro T cell clonal anergy by IL-2 stimulation. Int Immunol 1992;4(6):661-671. 277. Groux H, Bigler M, de Vries J, Roncarolo M. Interleukin-10 induces a long-term antigen-specific anergic state in human CD4+ T cells. J Exp Med 1996;184:19-29. 278. Kuwana M, Kaburaki J, Wright T, Kawakami Y, Ikeda Y. Induction of antigen-specific human cd4(+) T cell anergy by peripheral blood DC2 precursors. Eur J Immunol 2001;31(9):2547-2557. 279. Steinbrink K, Jonuleit H, Müller G, Schuler G, Knop J, Enk A. Interleukin-10-treated human dendritic cells induce a melanoma-antigen-specific anergy in CD8(+) T cells resulting in a failure to lyse tumor cells. Blood 1999;93(5):1634-1642. 280. Qian S, Lu L, Fu F, Li Y, Li W, Starzl TE et al. Apoptosis within spontaneously accepted mouse liver allografts:evidence for deletion of cytotoxic T cells and implications for tolerance induction. J Immunol 1997;158:4654-4661. 281. Lu L, Li W, Zhong C, Qian S, Fung JJ, Thomson AW et al. Increased apoptosis of immunoreactive host cells and augmented donor leukocyte chimerism, not sustained inhibition of B7 molecule expression are associated with prolonged cardiac allograft
323
survival in mice preconditioned with immature donor dendritic cells plus anti-CD40L mAb. Transplantation 1999;68:747-757. 282. Takeuchi T, Lowry R, Konieczny B. Heart allografts in urine ayatems. The differential activation of Th2-like effector cells in peripheral tolerance. Transplantation 1992;53:1281-1294. 283. Arpinati M, Green C, Heimfeld S, Heuser J, Anasetti C. Granulocyte-colony stimulating factor mobilizes T helper 2-inducing dendritic cells. Blood 2000;69:221-226. 284. Coates P, Thomson A. Dendritic cells, tolerance induction and transplant outcome. Am J Transplant 2002;2(4):299-307. 285. Yu G, Xu X, Vu M, Kilpatrick E, Li X. NK promote transplant tolerance by killing donor antigen-presenting cells. J Exp Med 2006;203:1851-1858. 286. Jenne L, Schuler G, Steinkasserer A. Viral vectors for dendritic cell-based immunotherapy. Trends Immunol 2001;22(2):102-107. 287. Morelli A, Larregina A, Ganster A, Zahorchak A, Plowey J, Takayama T et al. Recombinant adenovirus induces maturation of dendritic cells via an NF-kappa-beta dependent pathway. J Virol 2000;74:9617-9628. 288. Zhong L, Granelli-Piperno A, Choi Y, Steinman R. Recombinant adenovirus is an efficient and non-perturbing genetic vector for human dendritic cells. Eur J Immunol 1999;29:964-972. 289. Bergleson J, Cunningham J, Droguett G, Kurt-Jones E, Krithivas A, Hong J et al. Isolation of a common receptor for Coxsackie B viruses and adenoviruses 2 and 5. Science 1997;275:1320-1323. 290. Shayakhmetov D, Carlson C, Stecher H, Li Q, Stamatoyannopoulos G, Lieber A. A high-capacity, capsid-modified hybrid adenovirus/adeno-associated virus vector for stabel transduction of human hematopoietic cells. J Virol 2002;76:1135-1143. 291. Coates P, Colvin B, Kaneko K, Taner T, Thomson A. Pharmacologic, biologic and genetic engineering approaches to potentiation of donor-derived dendritic cell tolerogenicity. Transplantation 2003;75(9):S32-36. 292. Bangham A, Standish M, Watkins J. Diffusion of univalent ions across the lamellae of swollen phospholipids. J Mol Biol 1965;13:238-252. 293. Gregoriadis G. The carrier potential of liposomes in biology and medicine (first of two parts). N Engl J Med 1976;295:704-710. 294. Gregoriadis G. The carrier potential of liposomes in biology and medicine (second of two parts). N Engl J Med 1976;295:765-770. 295. Dietz A, Vik-Pavlovic S. High-efficiency adenovirus-mediated gene transfer to human dendritic cells. Blood 1998;91(2):392-398. 296. Tan P, Beutelspacher S, Wang Y, McClure M, Ritter M, Lombardi G et al. Immunolipoplexes: an efficient, noviral alterantive for transfection of human dendritic cells with potential for clinical vaccination. Mol Ther 2005;11(5):790-800. 297. Ulrich A. Biophysical aspects of using liposomes as delivery vehicles. Bioscience Rep 2002;22(2):129-150. 298. Gennis R. BIiomembranes: molecular structure and function. (C Cantor ed) 1989;Springer Verlag. 299. Mouritsen O, Jorgensen K. A new look at lipid-membrane structure in relation to drug research. Pharm Res 1998;15:1507-1519.
324
300. Tielman D, Marrink S, Berendsen H. A computer's perspective of membranes: molecular dynamics studies of lipid bilayer systems. Biochim Biophys Acta 1997;1331:235-270. 301. Konigsberg P, Godtel R, Kissel T, Richer L. The development of IL-2 conjugated liposomes for therapeutic purposes. Biochim Biophys Acta 1998;1370(2):243-251. 302. Goni F, Alonso A. Spectroscopic techniques in the study of membrane solubilization, reconstitution and permeabilisation by detergents. Mol Membr Biol 2000;16:103-109. 303. Jin A, Huster D, Gawrisch K, Nossal R. Light scattering characterization of extruded lipid vesicles. Eur Biophys J 1999;28:187-199. 304. Papahadjopoulos D, Vali W, Jacobson K, Poste G. Cochleate lipid cylinders: formation by fusion of unilamellar lipid vesicles. Biochim Biophys Acta 1975;394:483-491. 305. Mayer L, Hope M, Cullis P, Janoff A. Solute and trapping efficiencies observed in freeze-thawed multilamellar vesicles. Biochim Biophys Acta 1985;817:193-196. 306. Liu D, Hu Q, Song Y. Liposome clearance from blood: different animal species have different mechanisms. Biochim Biophys Acta 1995;1240:277-284. 307. Senior J. Fate and behaviour of liposomes in vivo: a review of controlling factor. Crit Rev Ther Drug Carrier Syst 1987;3:123-193. 308. Papahadjopoulos D, Allen T, Gabzion A, Mayhew E, Matthay K, Huang S et al. Sterically stabilised liposomes: Improvements in pharmacokinetics and antitumor therapeutic efficacy. Proc Natl Acad Sci 1991;88:11460-11464. 309. Moghimi S, Szebeni J. Stealth liposomes and long circulating nanoparticles: critical issues in pharmacokinetics, opsonization and protein-binding properties. Prog Lipid Res 2003;42:463-478. 310. Gabizon A, Papahadjopoulos D. The role of surface charge and hydrophilic group son liposome clearance in vivo. Biochim Biophys Acta 1992;1103:94-100. 311. Needham D, McIntosh T, Lasic D. Repulsive interactions and mechanical stability of polymer-grafted lipid membranes. Biochim Biophys Acta 1992;1108:40-48. 312. Lasic D, Martin F, Gabizon A, Huang S, Papahadjopoulos D. Sterically stabilized liposomes: a hypothesis on the molecular origin of the extended circulation times. Biochim Biophys Acta 1991;1070:187-192. 313. Maruyama K. PEG-Immunoliposome. Bioscience Rep 2002;22(2):251-266. 314. Cheng W, Allen T. The use of single chain Fv as targeting agents for immunoliposomes: an update on immunliposomal drugs for cancer treatment. Expert Opin Drug Deliv 2010;7:461-478. 315. Altin J, Parish C. Liposomal vaccines - targeting the delivery of antigen. Methods 2006;40(1):39-52. 316. Bendas G, Rothe U, Scherphof G, Kamps J. The influence of repeated injections on pharmacokinetics and biodistribution of different types of sterically stabilized immunoliposomes. Biochim Biophys Acta 2003;1609:63-70. 317. Harding J, Engbers C, Newman M, Goldstein N, Zalipsky S. Immunogenicity and pharmacokinetic attributes of poly(ethylene glycol)-grafted immunoliposomes. Biochim Biophys Acta 1997;1327:181-192. 318. Phillips N, Dahman J. Immunogenicity of immunoliposomes: reactivity against species-specific IgG and liposomal phospholipids. Immunol Lett 1995;45:149-152.
325
319. Torchilin V. Antibody-modified liposomes for cancer chemotherapy. Expert Opin Drug Deliv 2008;5:1003-1025. 320. Altin J, Parish C. Liposomal vaccines - targeting the delivery of antigen. Methods 2006;40:39-52. 321. Rejman J, Oberle V, Zuhorn I, Hoekstra D. Size-dependent internalization of particles via the pathways of clarithrin- and caveolin-mediated endocytosis. Biochem J 2004;377:159-169. 322. Johannes L, Lamaze C. Clarithrin-dependent or not: is it still the question? Traffic 2002;3:443-451. 323. Ditto A, Shah P, Yun Y. Non-viral gene delivery using nanoparticles. Expert Opin Drug Deliv 2009;6:1149-1160. 324. Colin M, Maurice M, Trugnan G, Kornprobst M, Harbottle R, Knight A et al. Cell delivery, intracellular trafficking and expression of an integrin-mediated gene transfer vector in trachela epithelial cells. Gene Ther 2000;7:139-152. 325. Kamiya H, Tsuchiya H, Yamazaki J, Harashima H. Intracellular trafficking and transgene expression of viral and non-viral gene vectors. Adv Drug Deliv Rev 2001;52:153-164. 326. Maeda H, Sawa T, Konno T. Mechanism of tumor-targeted delivery of macromolecular drugs, including the EPR effect in solid tumor and clinical overview of the prototype polymeric drug SMANCS. J Control Release 2001;74:47-61. 327. Yuan F, Dellian M, Fukumura D, Leunig M, Berk D, Torchilin V et al. Vascular permeability in a human tumor xenograft: molecular size dependence and cutoof size. Cancer Res 1995;55:3752-3756. 328. Maeda H, Wu J, Sawa T, Martsumura Y, Hori K. Tumor vascular permeability and the EPR effect in macromolecular therapeutics: a review. J Control Release 2000;65:271-284. 329. Torchilin V. Recent advances with liposomes as pharmaceutical carriers. Nat Rev Drug Discov 2005;4:145-160. 330. Gilchrist R, Wicherek M, Heistermann M, Nayudu P, Hodges J. Changes in follicle-stimulating hormone and follicle populations during the ovarian cycle of the common marmoset. Biol Reproduct 2001;64:127-135. 331. 't Hart B, van Meurs M, Brok H, Massacesi L, Bauer J, Boon L et al. A new primate model for multiple sclerosis in the common marmoset. Immunol Today 2000;21:290-297. 332. Genain C, Hauser S. Experimental allergic encephalomyelitis in the New World monkey Callithrix jacchus. Immunol Rev 2001;183:159-172. 333. Wood J, Gulati N, Michel J, Hofbauer K. Two-kidney, one clip renal hypertension in the marmoset. J Hypertens 1986;4:251-254. 334. Soars M, Riley R, Burchell B. Evaluation of the marmoset as a model species for drug glucuronidation. Xenobiotica 2001;31:849-860. 335. Siddal R. The use of marmosets (Callithrix jacchus) in teratological and toxicological research. Prim Med 1978;10:215-224. 336. Bontrop R, dDe Groot N, Doxiadis G. Major histocompatibility complex class II polymorphisms in primates. (Genomic organisation of the MHC: Structure, Origin and Function). Immunol Rev 1999;167:339-350. 337. Kohu K, Yamabe E, Matsuzawa A, Onda D, Suemizu H, Sasaki E et al. Comparison of 30 immunity-related genes from the common marmoset with orthologues from human and mouse. Tohoku J Exp Med 2008;215:167-180.
326
338. Villinger F, Bostik P, Mayne A, King C, Genain C, Weiss W et al. Cloning, sequencing and homology analysis of nonhuman primate Fas/Fas-ligand and co-stimulatory molecules. Immunogenetics 2001;53:315-328. 339. Neubert R, Foerster M, Nogueira A, Helge H. Cross-reactivity of antihuman monoclonal antibodies with cell surface receptors in the common marmoset. Life Sci 1996;58:317-324. 340. Kireta S, Zola H, Gilchrist RB, Coates PTH. Cross-reactivity of anti-human chemokine receptor and anti-TNF family antibodies with Common Marmoset (Callithrix jacchus) leukocytes. Cell Immunol 2005;236:115-122. 341. Brok H, Hornby R, Griffiths G, Scott L, 't Hart B. An extensive monoclonal antibody panel for the phenotyping of leukocyte subsets in the common marmoset and the cotton-top tamarin. Cytometry 2001;45:294-303. 342. Prasad S, Humphreys I, Kireta S, Gilchrist R, Bardy P, Russ G et al. MHC class II DRB genotyping is highly predictive of in-vitro alloreactivity in the common marmoset. J Immunol Methods 2006;314:153-163. 343. Prasad S, Humphreys I, Kireta S, Gilchrist R, Bardy P, Russ G et al. The common marmoset as a novel preclinical transplant model: identification of new MHC class II DRB alleles and prediction of in vitro alloreactivity. Tissue Antigens 2007;69:72-76. 344. Prasad S, Kireta S, Leedham E, Russ G, Coates P. Propagation and characterisation of dendritic cells from G-CSF mobilised peripheral blood monocytes and stem cells in common marmoset monkeys. J Immunol Methods 2010;352:59-70. 345. Lim W, Kireta S, Russ G, Coates P. Human plasmacytoid dendritic cells regulate immune responses to Epstein-Barr virus (EBV) infection via toll-like receptor-9 signalling and delay EBV-related mortality in humanized NOD-SCID mice. Blood 2007;109:1043-1050. 346. Baumgarth N, Roederer M. A practical apporach to multicolor flow cytometry for immunophenotyping. J Immunol Methods 2000;243:77-97. 347. Roederer M. Spectral compensation for flow cytometry: visualization artifacts, limitations, and caveats. Cytometry 2001;45:194-205. 348. Capini C, Jaturanpinyo M, Chang H-I, Mutalik S, McNally A, Street S et al. Antigen-specific suppression of inflammatory arthritis using liposomes. J Immunol 2009;182:3556-3565. 349. Zhang X, Shi L, Shu S, Wang Y, Zhao K, Xu N et al. An improved method of sample preparation on AnchorChip targets for MALDI-MS and MS/MS and its application in the liver proteosome project. Proteomics 2007;7:2340-2349. 350. Chen L. Coinhibitory molecules of the B7-CD28 family in the control of T-cell immunity. Nat Rev Immunol 2004;4:336-347. 351. Greenwald R, Freeman G, Sharpe A. The B7 family revisited. Annu Rev Immunol 2005;23:515-548. 352. Quezada S, Jarvinen L, Lind E, Noelle R. CD40/CD154 interactions at the interface of tolerance and immunity. Annu Rev Immunol 2004;22:307-328. 353. Ohshima Y, Tanaka Y, Tozawa Y, Takahashi Y, Maliszewski C, Delespesse G. Expression and function of OX40 ligand on human dendritic cells. J Immunol 1997;159:3838-3848. 354. Moser M, Murphy K. Dendritic cell regulation of TH1-TH2 development. Nat Immunol 2000;1:199-205.
327
355. Takeda K, Kaisho K, Akira S. Toll-like receptors. Annu Rev Immunol 2003;21:335-376. 356. Barratt-Boyes S, Thomson A. Dendritic cells: tools and targets for transplant tolerance. Am J Transplant 2005;5:2807-2813. 357. Lutz M, Schuler G. Immature, semi-mature and fully mature dendritic cells: which signals induce tolerance or immunity? Trends Immunol 2002;23(9):445-449. 358. Gilliet M, Liu Y. Generation of human CD8 T regulatory cells by CD40 ligand-activated plasmacytoid dendritic cells. J Exp Med 2002;195:695-704. 359. Moseman E, Liang X, Dawson A, Panoskaltsis-Mortari A, Krieg A, Liu Y et al. Human plasmacytoid dendritic cells activated by CpG oligodeoxynucleotides induce the generation of CD4+CD25+ regulatory T cells. J Immunol 2004;173:4433-4442. 360. Garza K, Chan S, Suri R, Nguyen L, Odermatt B, Schoenberger S et al. Role of antigen-presenting cells in mediating tolerance and autoimmunity. J Exp Med 2000;191:2021-2028. 361. Jonuleit H, Schmitt E, Steinbrink K, Enk A. Dendritic cells as a tool to induce anergic and regulatory T cells. Trends Immunol 2001;22:394-400. 362. Coates P, Thomson A. Dendritic cells, tolerance induction and transplant outcome. Am J Transplant 2002;2:299-307. 363. Arpinati M, Green C, Heimfeld S, Heuser J, Anasetti C. Granulocyte-colony stimulating factor mobilises T helper 2-inducing dendritic cells. Blood 2000;95(8):2484-2490. 364. Hackstein H, Thomson A. Dendritic cells: emerging pharmacological targets of immunosuppressive drugs. Nat Immunol 2004;4:4-34. 365. Fontenot J, Gavin M, Rudensky A. Foxp3 programs the development and function of CD4+CD25+ regulatory T cells. Nat Immunol 2003;4:330. 366. Kang S, Tang Q, Bluestone J. CD4+CD25+ regulatory T cells in transplantation: progress, challenges and prospects. Am J Transplant 2007;7(6):1457-1463. 367. Liu W, Putman A, Xu-Yu A. CD127 expression inversely correlates with FoxP3 and suppressive function of human CD4+ T reg cells. . J Exp Med 2006;203:1701. 368. Takahashi T, Kuniyasu Y, Toda M, Sakaguchi N, Itoh M, Iwata M et al. Immunologic self-tolerance maintained by CD25+CD4+ naturally anergic and suppressive T cells: induction of autoimmune disease by breaking their anergic/suppressive state. Int Immunol 1998;10:1969-1980. 369. Takahashi T, Tagami T, Yamazaki S, Uede T, Shimizu J, Sakaguchi N et al. Immunologic self-tolerance maintained by CD25+CD4+ regulatory T cells constitutively expressing cytotoxic T lymphocyte-associated antigen 4. J Exp Med 2000;192:303-310. 370. Piemonti L, Monti P, Allavena P, Sironi A, Soldini L, Leone B et al. Glucocorticoids affect human dendritic cell differentiation and maturation. J Immunol 1999;162:6473-6481. 371. Lee J, Ganster R, Geller D, Burckart G, Thomson A, Lu L. Cyclosporine A inhibits the expression of costimulation molecules on in vitro-generated dendritic cells: association with reduced nuclear translocation of nuclear factor kappa B. Transplantation 1999;68(9):1255-1263. 372. Lagaraine C, Hoarau C, Chabot V, Velge-Roussel F, Labranchu Y. Mycophenolic acid-treated human dendritic cells have a mature migratory phenotype and inhibit allogeneic responses via direct and indirect pathways. Int Immunol 2005;17(4):351-363.
328
373. Hackstein H, Taner T, Zahorchak AF, Morelli AE, Logar AJ, Gessner A et al. Rapamycin inhibits IL-4--induced dendritic cell maturation in vitro and dendritic cell mobilization and function in vivo. Blood 2003;101(11):4457-4463. 374. Yang J, Bernier S, Ichim T, Li M, Xia X, Zhou D et al. LF15-0195 generates tolerogenic dendritic cells by suppression of NF-kappaB signalling through inhibition of IKK activity. J Leuk Biol 2003;74(3):438-447. 375. Penna G, Adorini L. 1-alpha,25-dihydroxyvitamin D3 inhibits differentiation, maturation, activation, and survival of dendritic cells leading to impaired alloreactive T cell activation. J Immunol 2000;164(5):2405-2411. 376. Balasubramanyam M, Koteswari A, Kumar R, Monickaraj S, Maheswari J, Mohan V. Curcumin-induced inhibition of cellular reactive oxygen species generation: novel therapeutic implications. J Biosci 2003;28:715-721. 377. Ruby A, Kuttan G, Babu K, Rajasekharan K, Kuttan R. Anti-tumor and antioxidant activity of natural curcuminoids. Cancer Lett 2003;94:79-83. 378. Yadav V, Mishra K, Singh D, Mehrotra S, Singh V. Immunomodulatory effects of curcumin. Immunopharmacol Immunotoxicol 2005;27:485-497. 379. Apisariyakul A, Vanittanakom N, Buddhasukh D. Antifungal activity of turmeric oil extracted from Curcuma longa (Zingiberaceae). J Ethnopharmacol 1995;49:163-169. 380. Mazumder A, Raghavan K, Weinstein J, Kohn K, Pommier Y. Inhibition of human immunodeficiency virus type-1 integrase by curcumin. Biochem Pharmacol 1995;49:1165-1170. 381. Negi P, Jayaprakasha G, Jagan Mohan Rao L, Sakariah K. Antibacterial activity of turmeric oil: a byproduct from curcumin manufacture. J Agric Food Chem 1999;47:4297-4300. 382. Garg A, Buchholz T, Aggarwal B. Chemosensitization and radiosensitization of tumours by plant polyphenols. Antioxid Redox Signal 2005;7:1630-1647. 383. Singh S, Aggarwal B. Activation of transcription factor NF-kB is suppressed by curcumin (diferuloylmethane). J Biol Chem 1995;270:24995-25000. 384. Kim G, Kim K, Lee S, Yoon M, Lee H, Moon D et al. Curcumin inhibits immunostimulatory function of dendritic cells: MAPKs and translocation of NF-kB as potential targets. . J Immunol 2005;174:8116-8124. 385. Cong Y, Wang L, Konrad A, Schoeb T, Elson C. Curcumin induces the tolerogenic dendritic cell that promotes differentiation of intestine-protective regulatory T cells. Eur J Immunol 2009;39:3134-3146. 386. Grumont R, Hochrein H, O'Keeffe M, Gugasyan R, White C, Caminschi I et al. C-Rel regulates interleukin 12 P70 expression in CD8+ dendritic cells by specifically Inducing p35 gene transcription. J Exp Med 2001;194(8):1021-1032. 387. O'Garra A, Murphy K. From IL-10 to IL-12: how pathogens and their products stimulate APCs to induce T(H)1 development. Nat Immunol 2009;10(9):929-932. 388. Shirley S, Monpetit A, Lockey R, Mohapatra S. Curcumin prevents human dendritic cell response to immune stimulants. Biochem Biophys Res Commun 2008;374:431-436. 389. Jakubzick C, Tacke F, Ginhoux F, Wagers A, van Rooijen N, Mack M et al. Blood monocyte subsets differentially give rise to CD103+ and CD103- pulmonary dendritic cell populations. J Immunol 2008;180:3019-3027. 390. Randolph G, Inaba K, Robbiani D, Steinman R, Muller W. Differentiation of phagocytic monocytes into lymph node dendritic cells in vivo. Immunity 1999;11:753-761.
329
391. Caux C, Massacrier C, Vanbervliet B, Dubois B, Van Kooten C, Durand I et al. Activation of dendritic cells through CD40 cross-linking. J Exp Med 1994;180:1263-1272. 392. Morelli A, Zahorchak A, Larregina A, Colvin B, Logar A, Takayama T et al. Cytokine production by mouse myeloid dendritic cells in relation to differentiation and terminal maturation induced by lipopolysaccharide or CD40 ligation. Blood 2001;98:1512-1523. 393. Grohnmann U, Fallarino F, Silla S, Bianchi R, Belladonna M, Vacca C et al. CD40 ligation ablates the tolerogenic potential of lymphoid dendritic cells. J Immunol 2001;166:277-283. 394. Shiroishi M, Tsumoto K, Amano K, Shirakihara Y, Colonna M, Braud V et al. Human inhibitory receptors Ig-like transcript 2 (ILT2) and ILT4 compete with CD8 for MHC class I binding and bind preferentially to HLA-G. Proc Natl Acad Sci 2003;100:8856-8861. 395. Dietrich J, Cella M, Colonna M. Ig-like transcript 2 (ILT2)/leukocyte Ig-like receptor 1 (LIR1) inhibits TCR signaling and actin cytoskeleton reorganization. J Immunol 2001;166:2514-2521. 396. Liang S, Zhang W, Horuzsko A. Human ILT2 receptor associates with murine class I molecules in vivo and impairs T cell function. Eur J Immunol 2006;36:2457-2471. 397. Ranjan D, Siquijor A, Johnston T, Wu G, Nagabhushan M. The effect of curcumin on human B-cell immortalisation by Epstein Barr virus. Am Surg 1998;64:47-51. 398. Ranjan D, Chen C, Johnston T, Jeon H, Nagabhushan M. Curcumin inhibits mitogen stimulated lyphocyte proliferation, NF-kB activation, and IL-2 signalling. J Surg Res 2004;121:171-177. 399. Joe B, Lokesh B. Role of capsaicin, curcumin and dietary �-3 fatty acids in lowering the generation of reactive oxygen species in rat peritoneal macrophages. Biochem Biophys Acta 2000;1224:255-263. 400. O'Sullivan B, MacDonald K, Pettit A, Thomas R. RelB nuclear translocation regulates B cell MHC molecule, CD40 expression and antigen-presenting cell function. Proc Natl Acad Sci 2000;97:11421. 401. Clark G, Gunningham S, Troy A, Vukovic S, Hart D. Expression of the RelB transcription factor correlates with the activation of human dendritic cells. Immunology 1999;98:189-196. 402. Koski G, Lyakh L, Cohen P, Rice N. CD14+ monocytes as dendritic cell precursors: diverse maturation-inducing pathways lead to common activation of NF-kappaB/RelB. Crit Rev Immunol 2001;21:179-189. 403. Giannoukakis N, Bonham C, Qian S, Chen Z, Peng L, Harnaha J et al. Prolongation of cardiac allograft survival using dendritic cells treated with NF-kB decoy oligonucleotides. Mol Ther 2000;1:430-437. 404. Min W, Zhou D, Ichim T, Xia X, Zhang X, Yang J et al. Synergistic tolerance induced by LF15-0195 and anti-CD45RB monoclonal antibody through suppressive dendritic cells. Transplantation 2003;75:1160-1165. 405. Feng G, Gao W, Strom T, Oukka M, Francis R, Wood K et al. Exogenous IFN-gamma ex vivo shapes the alloreactive T-cell repertoire by inhibition of TH17 responses and generation of Foxp3(+) regulatory T cells. Eur J Immunol 2008;38:2521-2527. 406. Feng G, Wood K, Bushell A. Interferon-gamma conditioning ex vivo generates CD25+CD62L+FoxP3+ regulatory T cells that prevent allograft rejection: potential avenues for cellular therapy. Transplantation 2008;86:578-589.
330
407. Wang Z. Role of IFN-gamma in induction of Foxp3 and conversion of CD4+CD25- T cells to CD4+ Tregs. J Clin Invest 2006;116:2434-2441. 408. Kang J, Huddleston S, Fraser J, Khoruts A. De novo induction of antigen-specific CD4+CD25+FoxP3 regaultory T cells in vivo following systemic antigen administration accompanied by blockade of mTOR. J Leuk Biol 2008;83:1230-1239. 409. Munn D, Sharma M, Mellor A. Ligation of B7-1/B7-2 by human CD4+ T cells triggers indoleamine 2,3-dioxygenase activity in dendritic cells. J Immunol 2004;172:4100-4110. 410. Eljaafari A, Li Y-P, Miossec P. IFN�, as secreted during an alloresponse, induces differentiation of monocytes into tolerogenic dendritic cells, resulting in FoxP3+ regulatory T cell promotion. J Immunol 2009;183:2932-2945. 411. Thornton A, Shevach E. Suppressor effector function of CD4+CD25+ immunoregulatory T cells is antigen nonspecific. J Immunol 2000;164:183-190. 412. Roncarolo M, Bacchetta R, Boridgnon C, Narula S, Levings M. Type 1 regulatory T cells. Immunol Rev 2001;182:68-79. 413. Roncarolo M, Gregori S, Battaglia M, Bacchetta R, Fleischauer K, Levings M. Interleukin-10-secreting type 1 regulatory T cells in rodents and humans. Immunol Rev 2006;212:28-50. 414. Weiner H. Induction and mechanism of action of transforming growth factor-�-secreting Th3 regulatory cells. Immunol Rev 2001;182:207-214. 415. Zhou J, Carr R, Liwski R, Stadnyk A, Lee G. Oral exposure to alloantigens generates intragraft CD8+ regulatory T cells. J Immunol 2001;167:107-113. 416. Zhang Z, Yang L, Young K, DuTemple B, Zhang L. Identification of a previously unknown antigen-specific regulatory T cell and its mechanism of suppression. Nature Med 2000;6:782-789. 417. Hayday A, Tigelaar R. Immunoregulation in the tissues by gammadelta T cells. Nat Rev Immunol 2003;3:233-242. 418. Seino K-I. Requirements for natural killer T (NKT) cells in the induction of allograft tolerance. Proc Natl Acad Sci 2001;98:2577-2581. 419. Aggarwal S, Ghilardi N, Xie M, de Sauvage F, Gurney A. Interleukin-23 promotes a distinct CD4 T cell activation state characterised by the production of interluekin-17. J Biol Chem 2003;278:1910-1914. 420. Ivanov I, McKenzie B, Zhou L, Tadokoro C, Lepelley A, Lafaille J et al. The orphan nuclear receptor RORgammat directs the differentiation program of proinflammatory IL-17+ T helper cells. Cell 2006;126:1121-1133. 421. Yang X, Nurieva R, Martinez G, Kang H, Chung Y, Pappu B et al. T helper 17 lineage differentiation is programmed by orphan nuclear receptors ROR� and ROR�. Immunity 2008;28:647-659. 422. Langrish C, Chen Y, Blumenschein W, Mattson J, Basham B, Sedgwick J et al. IL-23 drives a pathogenic T cell population that induces autoimmune inflammation. J Exp Med 2005;201:233-240. 423. Bettelli E, Carrier Y, Gao W, Korn T, Strom T, Oukka M et al. Reciprocal developmental pathways for the generation of pathogenic effector TH17 and regulatory T cells. Nature 2006;441:235-238. 424. Steinman R. The dendritic cell system and its role in immunogenicity. Ann Rev Immunol 1991;9:271-296.
331
425. Tan P, Yates J, Xue S, Chan C, Jordan W, Harper J et al. Creation of tolerogenic human dendritic cells via intracellular CTLA4: a novel strategy with potential in clinical immunosuppression. Blood 2005;106:2936-2943. 426. Kusuhara M, Matsue K, Edelbaum D, Loftus J, Takashima A, Matsue H. Killing of naive T cells by CD95L-transfected dendritic cells (DC): in vivo study using killer DC-DC hybrids and CD4(+) T cells from DO11.10 mice. Eur J Immunol 2002;32:1035-1043. 427. Horibe E, Sacks J, Unadkat J, Solari M, Raimondi G, Wang Z et al. Rapamycin-conditioned, alloantigen-pulsed dendritic cells promote indefinite survival of vascularized skin allografts in association with regulatory T cell expansion. Transpl Immunol 2008;18:307-318. 428. Niimi M, Shirasugi N, Ikeda Y, Kan S, Takami H, Hamano K. Operational tolerance induced by pretreatment with donor dendritic cells under blockade of CD40 pathway. Transplantation 2001;72:1556-1562. 429. O'Connell P, Li W, Wang Z, Specht S, Logar A, Thomson A. Immature and mature CD8alpha+ dendritic cells prolong the survival of vascularized heart allografts. J Immunol 2002;168:143-154. 430. Garrod K, Chang C, Liu F, Brennan T, Foster R, Kang S. Targeted lymphoid homing of dendritic cells is required for prolongation of allograft survival. J Immunol 2006;177:863-868. 431. Garrovillo M, Ali A, Oluwole S. Indirect allorecognition in acquired thymic tolerance: induction of donor-specific tolerance to rat cardiac allografts by allopeptide-pulsed host dendritic cells. Transplantation 1999;68:1827-1834. 432. Coates PT, Duncan FJ, Colvin BL, Wang Z, Zahorchak AF, Shufesky WJ et al. In vivo-mobilized kidney dendritic cells are functionally immature, subvert alloreactive T-cell responses, and prolong organ allograft survival. Transplantation 2004;77(7):1080-1089. 433. Steptoe RJ, Fu F, Li W, Drakes ML, Lu L, Demetris AJ et al. Augmentation of dendritic cells in murine organ donors by Flt3 ligand alters the balance between transplant tolerance and immunity. J Immunol 1997;159(11):5483-5491. 434. Khanna A, Antonysamy M, Subbotin V, Steptoe R, Rudert W, Thomson A. Impact of Flt-3 ligand on donor-derived antigen presenting cells and alloimmune reactivity in heart graft recipients given adjuvant donor bone marrow. Transpl Immunol 1998;6:225-234. 435. Eto M, Hackstein H, Kaneko K, Nomoto K, Thomson A. Promotion of skin graft tolerance across MHC barriers by mobilization of dendritic cells in donor hemopoietic cell infusions. J Immunol 2002;169:2390-2396. 436. Hawiger D, Inaba K, Dorsett Y, Guo M, Mahnke K, Rivera M et al. Dendritic cells induce peripheral T cell unresponsiveness under steady state conditions in vivo. J Exp Med 2001;194:769-779. 437. Sen P, Wallet M, Yi Z, Huang Y, Henderson M, Mathews C et al. Apoptotic cells induce Mer tyrosine kinase-dependent blockade of NF-kappaB activation in dendritic cells. Blood 2007;109:653-660. 438. Wang Z, Larregina A, Shufesky W, Perone M, Montecalvo A, Zahorchak A et al. Use of the inhibitory effect of apoptotic cells on dendritic cells for graft survival via T-cell depletion and regulatory T cells. Am J Transplant 2006;6:1297-1311. 439. van Broekhoven C, Parish C, Demangel C, Britton W, Altin J. Targeting dendritic cells with antigen-containing liposomes: a highly effective procedure for induction of antitumor immunity and for tumor immunotherapy. Cancer Res 2004;64:4357-4365.
332
440. Fiorentino D, Bond M, Mosmann T. Two types of mouse T helper cells. IV. Th2 clones secret a factor that inhibits cytokine production by Th1 clones. J Exp Med 1989;170:2081. 441. Baenjamin D, Knobloch T, Dayton M. Human B-cell interleukin-10: B cell lines dervied from patients with acquired immunodeficiency syndrome and Burkitt's lymphoma constitutively secrete large quantities of interleukin-10. Blood 1992;80:1289. 442. Moore K, O'Garra A, de Malefyt R, Vieira P, Mosmann T. Interleukin-10. Ann Rev Immunol 1993;11:165. 443. Fiorentino D, Zlotnik A, Vieira P, Mosmann T. IL-10 acts on the antigen-presenting cell to inhibit cytokine production by Th1 cells. J Immunol 1991;146:3444. 444. Willems F, Marchant A, Delville D-A, Gerard C, Delvaux A, Velu T et al. Interleukin-10 inhibits B7 and intercellular molecule-1 expression on human monocytes. Eur J Immunol 1994;24:1007. 445. de Malefyt R, Haanen J, Spits H, Roncarolo G, te Velde A, Figdor C et al. Interluekin-10 (IL-10) and viral IL-10 strongly reduce antigen-specific human T cell proliferation by diminishing the antigen-capacity of monocytes via downregulation of class II major histocompatibility complex expression. J Exp Med 1991;174:915. 446. Samad A, Sultana Y, Aqil M. Liposomal drug delivery systems: an update review. Curr Drug Deliv 2007;4:297-305. 447. Jagetia G, Aggarwal B. Spicing up the immune system by curcumin. J Clin Immunol 2007;27:19-35. 448. Madea T, Balakrishnan K, Mehdi S. A simple and rapid method for the preparation of plasma membranes. Biochim Biophys Acta 1983;731:115-120. 449. Immordino M, Dosio F, Cattel L. Stealth liposomes: review of the basic science, rationale, and clinical applications, existing and potential. Int J Nanomedicine 2006;1:297-315. 450. Ranjan D, Johnston T, Wu G, Elliott L, Bondada S, Nagabhushan M. Curcumin blocks cyclosporine A-resistant CD28 costimulatory pathway of human T-cell proliferation. J Surg Res 1998;77:174-178. 451. Wang Y, Pan M, Cheng A, Lin L, Ho Y, Hsieh C et al. Stability of curcumin in buffer solutions and characterization of its degradation products. J Pharm Biomed Anal 1997;15:1867-1876. 452. Ireson C, Jones D, Orr S, Coughtrie M, Boocock D, Williams M et al. Metabolism of the cancer chemopreventive agent curcumin in human and rat intestine. Cancer Epidemiol Biomarkers Prev 2002;11:105-111. 453. Sharma R, Hill K, McLelland H, Ireson C, Euden S, Manson M et al. Pharmacodynamic and pharmacokinetic study of oral curcuma extract in patients with colorectal cancer. Clin Cancer Res 2001;7:1834-1900. 454. Cheng A, Hsu C, Lin J, Hsu M, Ho J, Shen T et al. Phase I clinical trial of curcumin, a chemopreventive agent, in patients with high-risk or pre-malignant lesions. Anticancer Res 2001;21:2895-2900. 455. Scherphof G. Uptake and intracellular processing of targeted and nontargeted liposomes by rat Kupffer cells in vivo and in vitro. Ann N Y Acad Sci 1985;446:368-384. 456. Patel H. Serum opsonins and liposomes: their interaction and opsonophagocytosis. Crit Rev Ther Drug Carrier Syst 1992;9:39-90.
333
457. Falcone D. Fluorescent opsonization assay: binding of plasma fibronectin to fibrinderivatized fluorescent particles does not change their uptake by macrophages. J Leuk Biol 1986;39:1-12. 458. Volanakis J, Narkates A. Interaction of C-reactive protein with artificial phsophatidycholine bilayers and complement. J Immunol 1981;126:1820-1825. 459. Harashima H, Sakata K, Funato K, Kiwada H. Enhanced hepatic uptake of liposomes through complement activation depending on the size of liposomes. Pharm Res 1994;11:402-406. 460. Maruyama K, Kennel S, Huang L. Lipid composition is important for highyl efficient target binding and retention of immunoliposomes. Proc Natl Acad Sci 1990;87:5744-5748. 461. Paphadjopoulos D, Allen T, Gabzion A, Mayhew E, Matthay K, Huang S et al. Sterically stabilised liposomes: improvements in pharmacokinetics and antitumor therapeutic efficacy. Proc Natl Acad Sci 1991;88:11460-11464. 462. Senior J. Is half-life of circulating liposomes determined by changes in their permaebility? FEBS Lett 1982;145:109-114. 463. Chonn A, Cullis P, Devine D. The role of surface charge in the activation of the classical and alterantive pathways of complement by liposomes. J Immunol 1991;146:4234-4241. 464. Preston R, Epstein M. Ischemic renal disease: an emerging cause of chronic renal failure and end-stage renal failure. J Hypertens 1997;15:1365-1377. 465. Halloran P, Homik J, Goes N, Lui S, Urmson J, Ramassar V et al. The "injury response": a concept linking nonspecific injury, acute rejection, and long-term transplant outcomes. Transplant Proc 1997;29:79-81. 466. Shoskes D, Halloran P. Delayed graft function in renal transplantation: etiology, management and long-term significance. J Urol 1996;75:82-87. 467. Hetzel G, Klein B, Brause M, Westhoff A, Willers R, Sandmann W et al. Risk factors for delayed graft function on the long-term outcome of renal transplantation. Transpl Int 2002;15:10-16. 468. Feldman H, Gayner R, Berlin J, Roth D, Silibovsky R, Krushner S et al. Delayed graft function reduces renal allograft survival independent of acute rejection. Nephrol Dial Transplant 1996;11:1306-1313. 469. Donnahoo K, Meldrum D, Shenkar R, Chung C, Abraham E, Harken A. Early renal ischemia, with or without reperfusion, activates NF kappa B and increases TNF-alpha bioactivity in the kidney. J Urol 2000;163:1328-1332. 470. Tsoulfas G, Geller D. NF-�B in transplantation: friend or foe? Transpl Infect Dis 2001;3:212-219. 471. Leemans J, Stokman G, Claessen N, Rouschop K, Teske G, Kirschning C et al. Renal-associated TLR2 mediates ischemia/reperfusion injury in the kidney. J Clin Invest 2005;115:2894-2903. 472. Mukhopadhyay A, Basu N, Ghatak N. Anti-inflammatory and irritant activities of curcumin analogues in rats. Agents Action 1982;12:508-515. 473. Rogers N, Kireta S, Coates P. Curcumin induces maturation-arrested dendritic cells and expands regulatory T-cells in vivo and in vitro. Clin Exp Immunol 2010. 474. Bayrak O, Uz E, Turgut F, Atmaca A, Sahin S, Yıldırım M et al. Curcumin protects against ischemia/reperfusion injury in rat kidneys. World J Urol 2008;26:285-291.
334
475. Shen S, Zhang Y, Xiang J, Xiong C. Protective effect of curcumin against liver warm ischemia/reperfusion injury in rat model is associated with regulation of heat shock protein and antioxidant enzyme. World J Gastroenterol 2007;13:1953-1961. 476. Takedo K, Kaisho T, Akira S. Toll-like receptors. Annu Rev Immunol 2003;21:335-376. 477. Agwarwal B, Kumar A, Bharti A. Anticancer potential of curcumin: preclinical and clinical studies. Anticancer Res 2003;23 (1A):363-398. 478. Choudhuri T, Pal S, Agwarwal M, Das T, Sa G. Curcumin induces apoptosis in human breast cancer cells through p53-dependent Bax induction. FEBS Lett 2002;512:334-340. 479. Wu H, Chen G, Wyburn K, Yin J, Bertolino P, Eris J et al. TLR4 activation mediates kidney ischemia/reperfusion injury. J Clin Invest 2007;117:2847-2859. 480. Srivastava R. Inhibition of neutrophil response by curcumin. Agents Action 1989;28:298-303. 481. Ramsewak R, DeWitt D, Nair M. Cytotoxicity, antioxidant and anti-inflammatory activities of curcumins I-III from Curcuma longa. Phytomedicine 2000;7:303-308. 482. Furuichi W, Wada T, Kaneko S, Murphy P. Roles of chemokines in renal ischemia/reperfusion injury. Front Biosci 2008;13:4021-4028. 483. Jaswal J, Gandhi M, Finegan B, Dyck J, Clanachan A. Inhibition of p38 MAPK and AMPK restores adenosine-induced cardioprotection in heart stressed by antecedent ischemia by altering glucose utilization. Am J Physiol Heart Circ Physiol 2007;293:H1107-1114. 484. Yamawaki H, Berk B. Thioredoxin: a multifunctional antioxidant enzyme in kidney, heart and vessels. Curr Opin Nephrol Hypertens 2005;14:149-153. 485. Junn E, Han S, Im J, Yang Y, Cho E, Um H et al. Vitamin D3 up-regulated protein 1 mediates oxidative stress via suppressing tioredoxin function. J Immunol 2000;164:6287-6295. 486. Advani A, Gilbert R, Thai K, Gow R, Langham R, Christensen P et al. Expression, localization, and function of the thioredoxin system in diabetic nephropathy. J Am Soc Nephrol 2009;20:730-741. 487. Qi W, Chen X, Gilbert R, Zhang Y, Waltham M, Schache M et al. High glucose-induced thioredoxin interacting protein in renal proximal tubule cells is independent of transforming growth factor-�1. Am J Pathol 2007;171(3):744-754. 488. Jamieson R, Friend P. Organ reperfusion and preservation. Front Biosci 2008;13:221-235. 489. Lutz J, Thürmel K, Heeman U. Anti-inflammatory treatment strategies for ischemia/repefusion injury in transplantation. J Inflamm (Lond) 2010;7:27-34. 490. Lutz J, TYao Y, Song E, Antus B, Hamar P, Liu S et al. Inhibition of matrix metalloproteinases during chronic allograft nephropathy in rats. Transplantation 2005;79:655-661. 491. Rusai K, Huang H, Sayed N, Strobl M, Roos M, Schmaderer C et al. Administration of interleukin-1 receptor antagonist ameliorates renal ischemia-reperfusion injury. Transpl Int 2008;21:572-580. 492. Zhou T, Sun G, Zhang M, Chen J, Zhang D, Hu Q et al. Role of adhesion molecules and dendritic cells in rat hepatic/renal ischemia-reperfusion injury and anti-adhesive intervention with anti-P-selectin lectin-EGF domain monoclonal antibody. Gastroenterol 2005;11:1005-1010.
335
493. Zheng X, Feng B, Chen G, Zhang X, Li M, Sun H et al. Preventing renal ischemia-reperfusion injury using small interfering RNA by targeting complement 3 gene. Am J Transplant 2006;6:2099-2108. 494. Zheng X, Zhang X, Feng B, Sun H, Suzuki M, Ichim T et al. Gene silencing of complement C5a receptor using siRNA for preventing ischemia/reperfusion injury. Am J Pathol 2008;173:973-980. 495. Lutz J, Luong IA, Strobl M, Deng M, Huang H, Anton M et al. The A20 gene protects kidneys from ischemia/reperfusion injury by suppressing pro-inflammatory activation. J Mol Med 2008(86). 496. Ulrich A. Biophysical aspects of using liposomes as delivery vehicles. Bioscience Reports 2002;22:129-150. 497. Allen C, Dos Santos N, Gallagher R, Chiu G, Shu Y, Li W et al. Controlling the physical behaviour and biological performance of liposome formulations through the use of surface grafted poly(ethylene glycol). Bioscience Reports 2002;22:225-250. 498. Dong X, Swaminathan S, Bachman L, Croatt A, Nath K, Griffin M. Antigen presentation by dendritic cells in renal lymph nodes is linked to systemic and local injury to the kidney. Kidney Int 2005;68(3):1096-1108. 499. Bradham C, Schemmer P, Stachlewitz R, Thurman R, Brenner D. Activation of nuclear factor-� during orthotopic liver transplantation in rats is protective and does not require Kupffer cells. Liver Transplant Surg 1999;5:282-293. 500. Taylor B, Shao L, Gambotto A, Ganster R, Geller D. Inhibition of cytokine-induced nitric oxide synthase expression by gene transfer of adenoviral I�B�. Surgery 1999;126:142-147. 501. Bach F, Ferran S, Soares M, Wrighton C, Anrather J, Winkler H et al. Modification of vascular responses in xenotransplantation: inflammation and apoptosis. Nat Med 1997;3:944-948. 502. Vos I, Govers R, Gröne H, Kleij L, Schurink M, De Weger R et al. NFkappaB decoy oligodeoxynucleotides reduce monocyte infiltration in renal allografts. FASEB J 2000;14:815-822. 503. Feeley B, Park A, Hoyt E, Robbins R. Sulfasalazine inhibits reperfusion injury and prolongs allograft survival in rat cardiac transplantation. J Heart Lung Transplant 1999;18:1088-1095. 504. Sandur S, Pandey M, Sung B, Ahn K, Murakami A, Sethi G et al. Curcumin, demethoxycurcumin, bisdemethoxycurcumin, tetrahydrocurcumin and tumerones differentially regulate anti-inflammatory and anti-proliferative responses through a ROS-inependent mechanism. Carcinogenesis 2007;28:1765-1773. 505. Jobin C, Bradham C, Russo M, Juma B, Narula A, Brenner D et al. Curcumin blocks cytokine-mediated NF-�B activation and proinflammatory gene expression by inhibiting inhibitory factor I-�B kinase activity. J Immunol 1999;163:3474-3483. 506. Sharma R, Euden S, Platton S, Cooke D, Shafayat A, Hewitt H et al. Phase I clinical trial of oral curcumin: biomarkers of systemic activity and compliance. Clin Cancer Res 2004;10:6847-6854. 507. Li L, Ahmed B, Mehta K, Kurzrock R. Liposomal curcumin with and without oxalipltin: effects on cell growth, apoptosis, and angiogenesis in colorectal cancer. Mol Cancer Ther 2007;6:1276-1282.
336
508. Bestman-Smtih J, Gourde P, Desormeaux A, Tremblay M, Bergeron M. Sterically stabilized liposomes bearing anti-HLA-DR antibodies for targeting the primary cellular reservoirs of HIV-1. Biochim Biophys Acta 2000;1468:161-174. 509. Machy P, Serre K, Leserman L. Class-I restricted presentation of exogenous antigen aacquired by Fcgamma receptor-mediated endocytosis is regulated in dendritic cells. Eur J Immunol 2000;30:848-857. 510. Serre K, Machy P, Grivel J, Jolly G, Brun N, Barbet J et al. Efficient presentation of multivalent antigens targeted to various cell surface molecules of dendriti cells and surface Ig of antigen-specific B cells. J Immunol 1998;161:6059-6067. 511. Soilleux EJ. DC-SIGN (dendritic cell-specific ICAM-grabbing non-integrin) and DC-SIGN-related (DC-SIGNR): friend or foe? Clin Sci (Lond) 2003;104(4):437-446. 512. Geijtenbeek T, Koopman G, van Duijnhoven G, van Vilet S, van Schijndel A, Engering A et al. Rhesus macaque and chimpanzee DC-SIGN act as HIV/SIV gp120 trans-receptors, similar to human DC-SIGN. Immunol Lett 2001;79:101-107. 513. Geijtenbeek T, Kwon D, Torensma R, van Vilet S, van duijnhoven G, Middel J et al. DC-SIGN, a dendritic cell-specific HIV-1-binding protein that enhances trans-infection of T cells. Cell 2000;100:587-597. 514. Kwon D, Gregorio G, Bitton N, Hendrickson W, Littman D. DC-SIGN-mediated internalization of HIV is required for trans-enhancement of T cell infection. Immunity 2002;16:135-144. 515. Wu L, Bashirova A, Martin T, Villamide L, Mehlhop E, Chertov A et al. Rhesus macaque dendritic cells efficiently transmit primate lentiviruses independent of DC-SIGN. Proc Natl Acad Sci 2002;99:1568-1573. 516. Mortara L, Ploquin M, Faye A, Scott-Algara D, Vaslin B, Butor C et al. Phenotype and function of myeloid dendritic cells derived from African green monkey blood monocytes. J Immunol Methods 2006;308:138-155. 517. Ploquin M, Diop O, Sol-Foulon N, Mortara L, Faye A, Soares M et al. DC-SIGN from African green monkeys is expressed in lymph nodes and mediates infection of trans of simian immunodeficiency virus SIVagm. J Virol 2004;78:798-810. 518. Pereira C, Torensma R, Hebeda K, Kretz-Rommel A, Faas S, Figdor C et al. In vivo targeting of DC-SIGN-positive antigen-presenting cells in a nonhuman primate model. J Immunother 2007;30:705-714. 519. Hansen C, Kao G, Moase E, Zalipsky S, Allen T. Attachment of antibodies to sterically stabilized liposomes: evaluation, comparison and optimization of coupling procedures. Biochim Biophys Acta 1995;1239:133-144. 520. van Broekhoven C, Altin J. A novel approach for modifying tumor cell-derived plasma membrane vesicles to contain encapsulated IL-2 and engrafted costimulatory molecules for use in tumor immunotherapy. Int J Cancer 2002;98:63-72. 521. Altin J, White F, Easton C. Synthesis of the chelator lipid nitriloacetic acid ditetradecylamine (NTA-DTDA) and its use with the IAsys biosensor to study receptor-ligand interactions on model membranes. Biochim Biophys Acta 2001;1513:131-148. 522. Hart D. Dendritic cells: unique leukocyte populations which control the primary immune response. Blood 1997;90:3245-3287. 523. Mosialos G, Birkenbach M, Ayehunie S, Matsumura F, Pinkus G, Kieff E et al. Circulating human dendritic cells differentially express high levels of a 55-kd actin-bundling protein. Am J Pathol 1996;148(593-600).
337
524. Ortiz M, Kaesmann H, Zhang K, Bashirova A, Carrington M, Quintana-Murci L et al. The evolutionary history of the CD209 (DC-SIGN) family in humans and non-human primates. Genes Immunity 2008;9:483-492. 525. Soilleux E. DC-SIGN (dendritic cell-specific ICAM-grabbing non-integrin) and DC-SIGN-related )DC-SIGNR): friend or foe? Clin Sci (Lond) 2003;104(4):437-446. 526. Baribaud F, Pohlmann S, Leslie G, Mortari F, Doms R. Quantitative expression and virus transmission analysis of DC-SIGN on monocyte-derived dendritic cells. J Virol 2002;76(18):9135-9142. 527. Schwartz AJ, Alvarez X, Lackner AA. Distribution and immunophenotype of DC-SIGN-expressing cells in SIV-infected and uninfected macaques. AIDS Res Hum Retroviruses 2002;18(14):1021-1029. 528. Jameson B, Baribaud F, Pohlmann S, Ghavimi D, Mortari F, Doms RW et al. Expression of DC-SIGN by dendritic cells of intestinal and genital mucosae in humans and rhesus macaques. J Virol 2002;76(4):1866-1875. 529. Wu L, Bashirova AA, Martin TD, Villamide L, Mehlhop E, Chertov AO et al. Rhesus macaque dendritic cells efficiently transmit primate lentiviruses independently of DC-SIGN. Proc Natl Acad Sci U S A 2002;99(3):1568-1573. 530. Mortara L, Ploquin MJ, Faye A, Scott-Algara D, Vaslin B, Butor C et al. Phenotype and function of myeloid dendritic cells derived from African green monkey blood monocytes. J Immunol Methods 2006;308(1-2):138-155. 531. Ploquin MJ, Diop OM, Sol-Foulon N, Mortara L, Faye A, Soares MA et al. DC-SIGN from African green monkeys is expressed in lymph nodes and mediates infection in trans of simian immunodeficiency virus SIVagm. J Virol 2004;78(2):798-810. 532. Pereira CF, Torensma R, Hebeda K, Kretz-Rommel A, Faas SJ, Figdor CG et al. In vivo targeting of DC-SIGN-positive antigen-presenting cells in a nonhuman primate model. J Immunother 2007;30(7):705-714. 533. Arnold F. Metal-affinity separations: a new dimension in protein processing. Biotechnology 1991;9:151-156. 534. Bashirova A, Wu L, Cheng J, Martin T, Martin M, Benveniste R et al. Novel member of the CD209 (DC-SIGN) gene family in primates. J Virol 2003;77:217-227. 535. Koppel E, van Gisbergen K, Geijtenbeek T, van Kooyk Y. Distinct functions of DC-SIGN and its homologues L-SIGN (DC-SIGNR) and mSIGNR1 in pathogen recognition and immune regulation. Cell Microbiol 2005;7:157-165. 536. Barreiro L, Quintana-Murci L. DC-SIGNR neck-region polymorphisms and HIV-1 susceptibility: from population stratification to a possible advantage of the 7/5 heterozygous genotype. J Infect Dis 2006;194:1184-1185. 537. Martin M, Lederman M, Hutcheson H, Goedert J, Nelson G, van kooyk Y et al. Association of DC-SIGN promoter polymorphismwith increased risk for parenteral, but not mucosal, acquisition of human immunodeficiency virus type 1 infection. J Virol 2004;78:14053-14056. 538. Liu H, Hwangbo Y, Holte S, Lee J, Wang C, Kaupp N et al. Analysis of genetic polymorphisms in CCR5, CCR2, stromal-cell-derived factor-1, RANTES, and dendritic cell-specific intercellular adhesion molecule-3-grabbing nonintegrin in seronegative individuals repeatedly exposed to HIV-1. J Infect Dis 2004;190:1055-1058. 539. van Broekhoven C, Parish C, Vassiliou G, Altin J. Engrafting costimulator molecules onto tumor cell surfaces with chelator lipids: a potentially convenient apporach in cancer vaccine development. J Immunol 2000;164:2433-2443.
338
540. van Broekhoven C, Altin J. A novel system for convenient detection of low-affinity receptor-ligand interactions: chelator-lipid liposomes engrafted with recombinant CD4 bind to cells expressing MHC class II. Immunol Cell Biol 2001;79:274-284. 541. Pullen S, Labadia M, Ingraham R, McWhirter S, Everdeen D, Alber T et al. High-affinity interactions of tumor necrosis factor-associated factors (TRAFs) and CD40 require TRAF trimerization and CD40 multimerization. Biochem 1999;38:10168-10177. 542. van Gool S, Vandenberghe P, de Boer M, Ceuppens J. CD80, CD86 and CD40 provide accessory signal in a multiple-step T-cell activation model. Immunol Rev 1996;153:47-83. 543. Greene J, Leytze G, Emswiler J, Peach R, Bajorath J, Cosand W et al. Covalent dimerisation of CD28/CTLA-4 and oligomerisation of CD80/86 regulate T cell costimulatory interactions. J Biol Chem 1996;271:26762-26771. 544. Ikemizu S, Gilbert R, Fennelly J, Collins A, Harlos K, Jones E et al. Structure and dimerisation of a soluble form of B7.1. Immunity 2000;12:51-60. 545. Lopes de Menezes D, Kirchmeier M, Gagne J-F, ******. Cellular trafficking and cytotoxicity of anti-CD19-targeted liposomal doxorubicin in B cell lymphomas. J Liposome Res 1999;9:199-228. 546. Lee T, Wu H, Tseng Y, Lin C. A novel peptide specifically binding to nasopharyngeal carcinoma for targeted drug delivery. Cancer Res 2004;64:8002-8008. 547. Stephenson S, Low P, Lee R. Folate receptor-mediated targeting of liposomal drugs to cancer cells. Methods Enzymol 2004;387:33-50. 548. Kondo M, Asai T, Katanasaka Y, Sadzuka Y, Tsukada H, Ogino K et al. Anti-neovascular therapy by liposomal drug targeted to membrane type-1 matrix metallproteinase. Int J Cancer 2004;108:301-306. 549. Ishida O, Maruyama K, Tanahashi H, Iwatsuru M, Sasaki K, Eriguchi M et al. Liposomes bearing polyethyleneglycol-coupled transferrin with intracellular targeting property to the solid tumors in vivo. Pharm Res 2001;18:1042-1048. 550. Sapra P, Allen T. Ligand-targeted liposomal anticancer drugs. Prog Lipid Res 2003;42:439-462. 551. Medina O, Zhu Y, Kairemo K. Targeted liposomal drug delivery in cancer. Curr Pharm Des 2004;10:2981-2989. 552. Senior J, Delgado C, Fisher D, Tilcock C, Gregoriadis G. Influence of surface hydrophilicity of liposomes on their interaction with plasma protein and clearance from the circulation: studies with poly(ethylene glycol)-coated vesicles. Biochim Biophys Acta 1991;1062:77-82. 553. Ternant D, Paintaud G. Pharmacokinetics and concentration-effect relationships of therapeutic monoclonal antibodies and fusion proteins. Expert Opin Biol Ther 2005;5:S37-47. 554. Adams G, Weiner L. Monoclonal antibody therapy of cancer. Nat Biotechnol 2005;39:1147-1157. 555. Cheng W, Allen T. Targeted delivery of anti-CD19 liposomal doxorubicin in B-cell lymphoma: a comparison of whole monclonal antibody, Fab' fragments and single chain Fv. J Control Release 2008;126:50-58. 556. Lindner P, Bauer K, Krebber A, Nieba L, Kremmer E, Krebber C et al. Specific detection of his-tagged proteins with recombinant anti-His-tag scFv-phosphatase or scFv-phage fusions. Biotechniques 1997;22:140-149.
339
557. Ruger R, Muller D, Fahr A, Kontermann R. In vitro characterization of binding and stability of single-chain Fv Ni-NTA-liposomes. J Drug Target 2005;14:576-582. 558. Park J, Hong K, Kirpotin D, Colbern G, Shalaby R, Baselga J et al. Anti-HER2 immunoliposomes: Enhanced efficacy attributable to targeted delivery. Clin Cancer Res 2002;8:1172-1181. 559. An F, Drummond D, Wilson S, Kirpotin D, Nishimura S, Braddus V et al. Targeted drug delivery to mesothelioma cells using functionally selected internalizing human single-chain antibodies. Mol Cancer Ther 2008;7:569-578. 560. Noble C, Guo Z, Hayes M, Marks J, Park J, Benz C et al. Characterization of highly stable liposomal and immunoliposomal formulations of vincristine and vinblastine. Cancer Chemother Pharmacol 2009;64:741-751. 561. Brocker T, Riedinger M, Karjalanein K. Targeted expression of major histocompatibility complex (MHC) class II molecules demonstrates that dendritic cells can induce negative but not positive selection of thymocytes in vivo. J Exp Med 1997;185:541-550. 562. Armitage R, Fanslow W, Strockbine L, Sato T, Clifford K, Macduff B et al. Molecular and biological characterization of a murine ligand for CD40. Nature 1992;357:80-82. 563. Ridge J, Di Rosa F, Matzinger P. A conditioned dendritic cell can be a temporal bridge betweena CD4+ T-helper and a T-killer cell. Nature 1998;393:474-478.
340
APPENDIX
Rogers, N.M., Matthews, T.J., Kausman, J.Y., Kitching, R.A. and Coates, P.T.H. (2009) Review article: Kidney dendritic cells: Their role in homeostasis, inflammation and transplantation. Nephrology, v.14 (7), pp. 625-635, October 2009
NOTE: This publication is included in the print copy of the thesis
held in the University of Adelaide Library.
It is also available online to authorised users at:
Rogers, N.M., Kireta, S. and Coates, P.T.H. (2010) Curcumin induces maturation-arrested dendritic cells that expand regulatory T cells in vitro and in vivo. Clinical and Experimental Immunology, v.162 (3), pp. 460-473, December 2010
NOTE: This publication is included in the print copy of the thesis
held in the University of Adelaide Library.
It is also available online to authorised users at: