45
Module 12 Statistical Process Control 1
| Date post: | 21-Dec-2015 |
| Category: |
Documents |
| Upload: | brett-terry |
| View: | 214 times |
| Download: | 1 times |
Module 12Module 12
Statistical Process Control
1
QuizQuizAccuracy: The degree of closeness of measurements of a quantity to that quantity's actual (true) value. Precision:The degree to which repeated measurements under unchanged conditions show the same results.
2
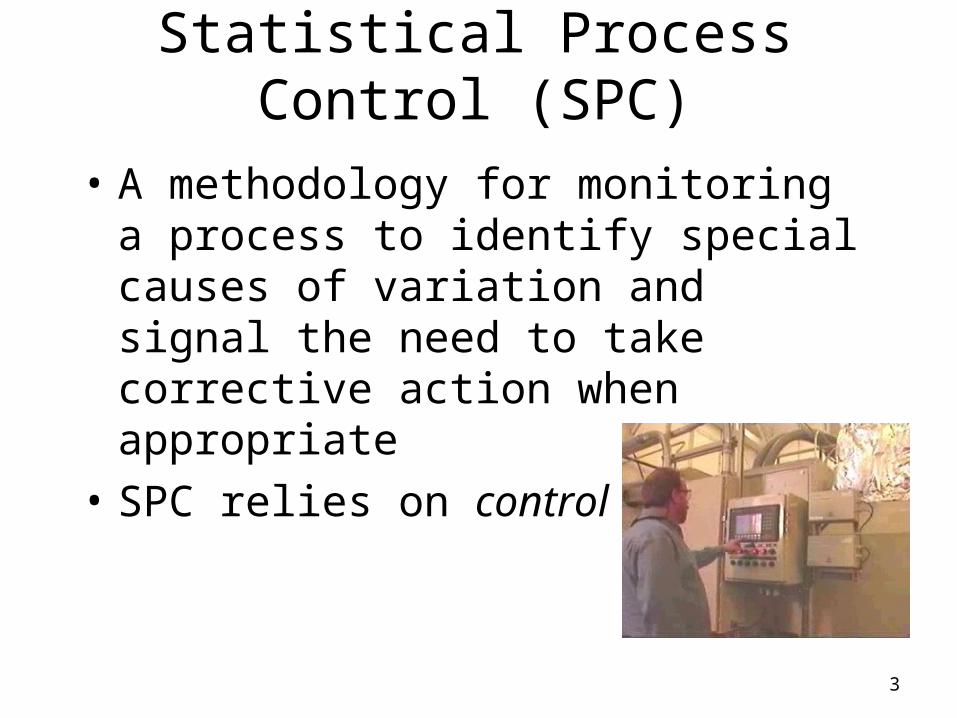
Statistical Process Control (SPC)• A methodology for monitoring a process to
identify special causes of variation and signal the need to take corrective action when appropriate
• SPC relies on control charts
3
4
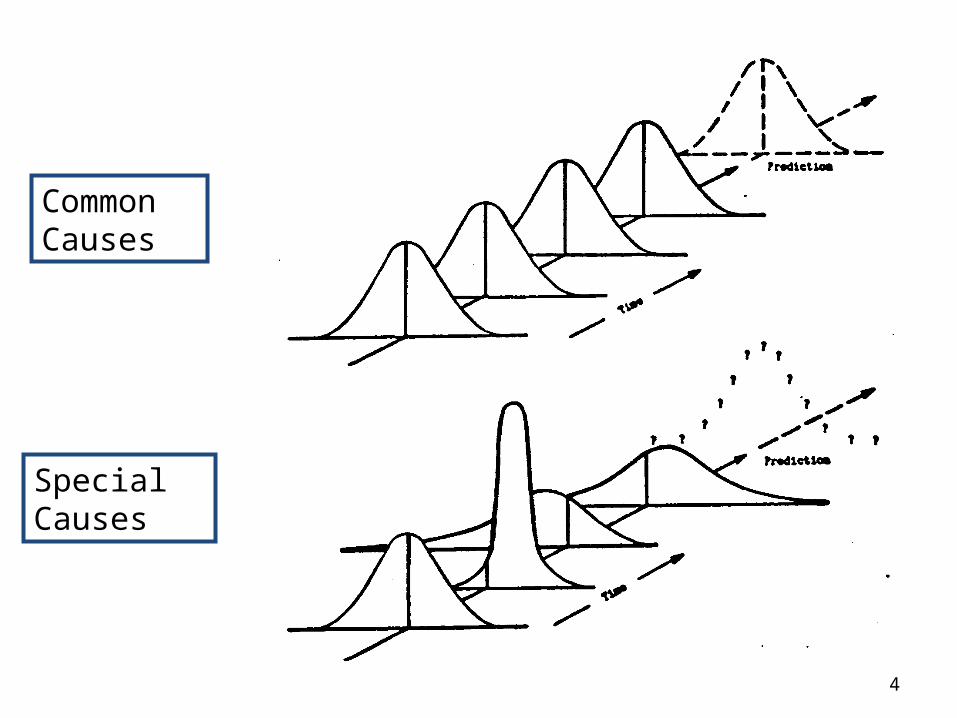
Common Causes
Special Causes
5
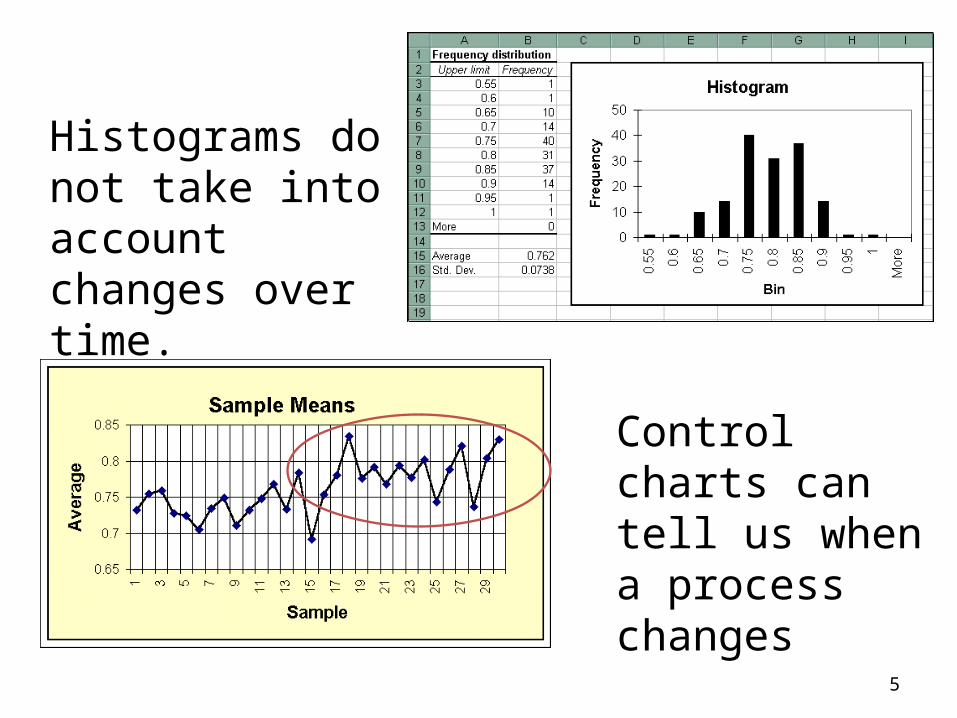
Histograms do not take into account changes over time.
Control charts can tell us when a process changes

Control Chart Applications
• Establish state of statistical control• Monitor a process and signal when it
goes out of control• Determine process capability
6
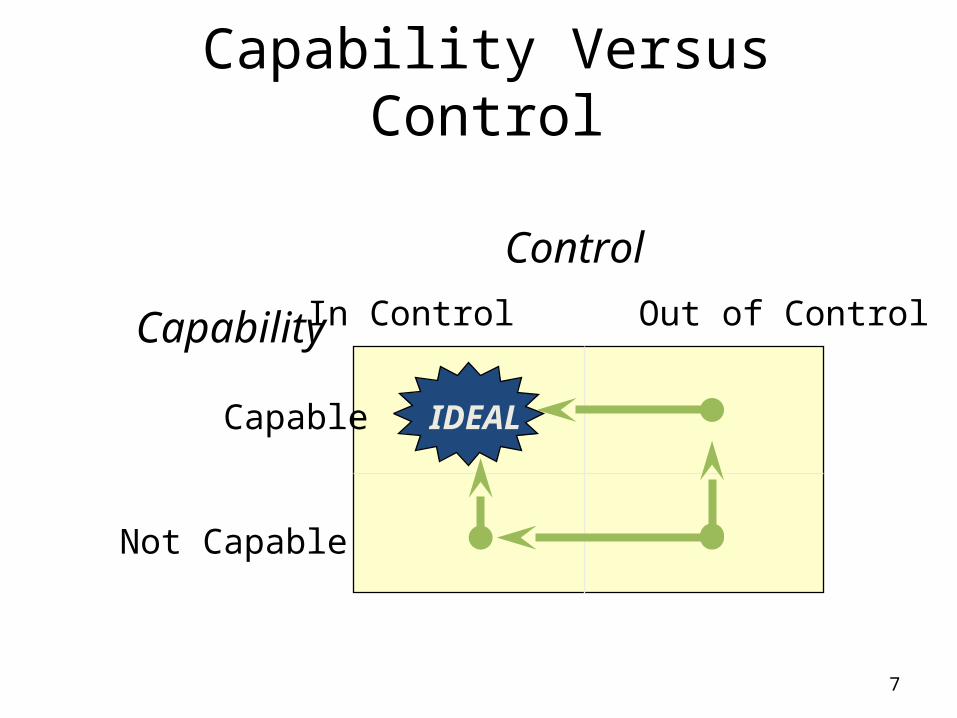
Capability Versus Control
7
Control
Capability
Capable
Not Capable
In Control Out of Control
IDEAL
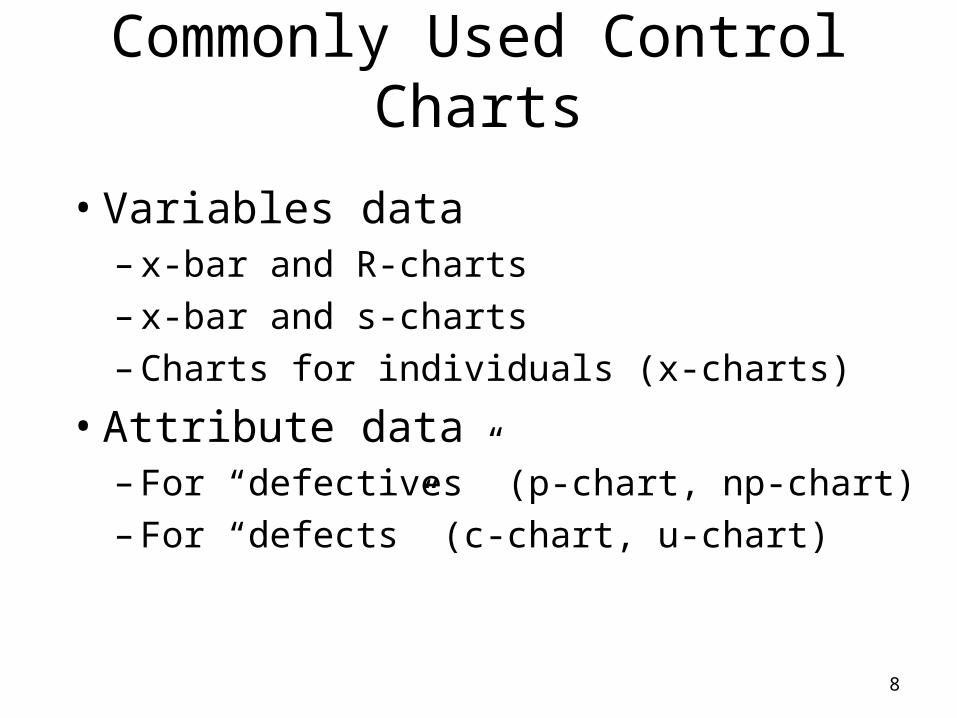
Commonly Used Control Charts
• Variables data– x-bar and R-charts– x-bar and s-charts– Charts for individuals (x-charts)
• Attribute data– For “defectives” (p-chart, np-chart)– For “defects” (c-chart, u-chart)
8
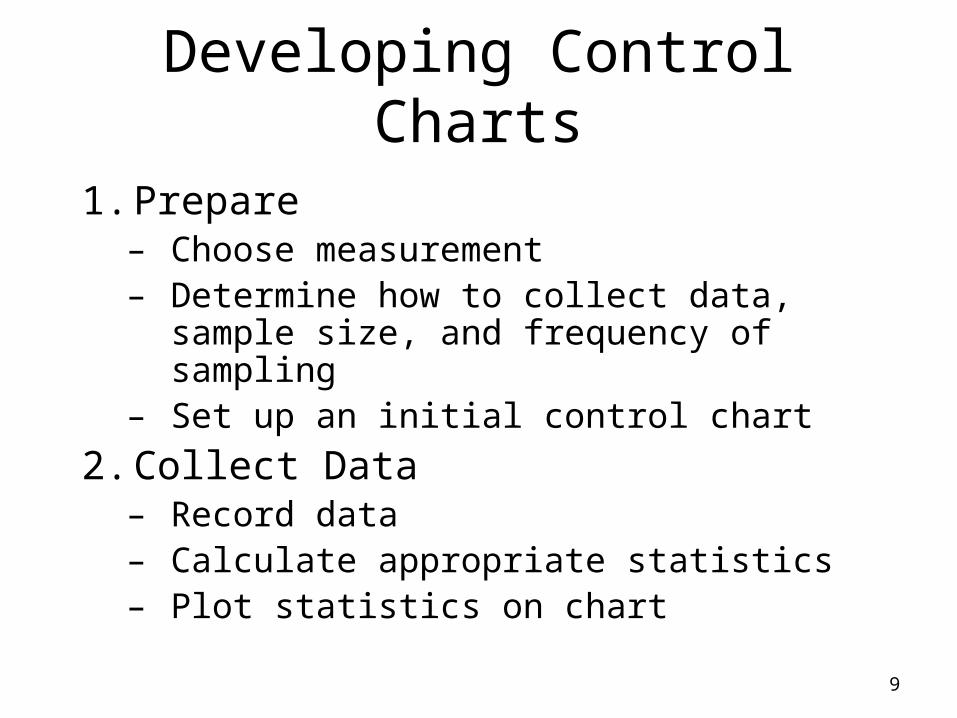
Developing Control Charts
1. Prepare– Choose measurement– Determine how to collect data, sample size,
and frequency of sampling– Set up an initial control chart
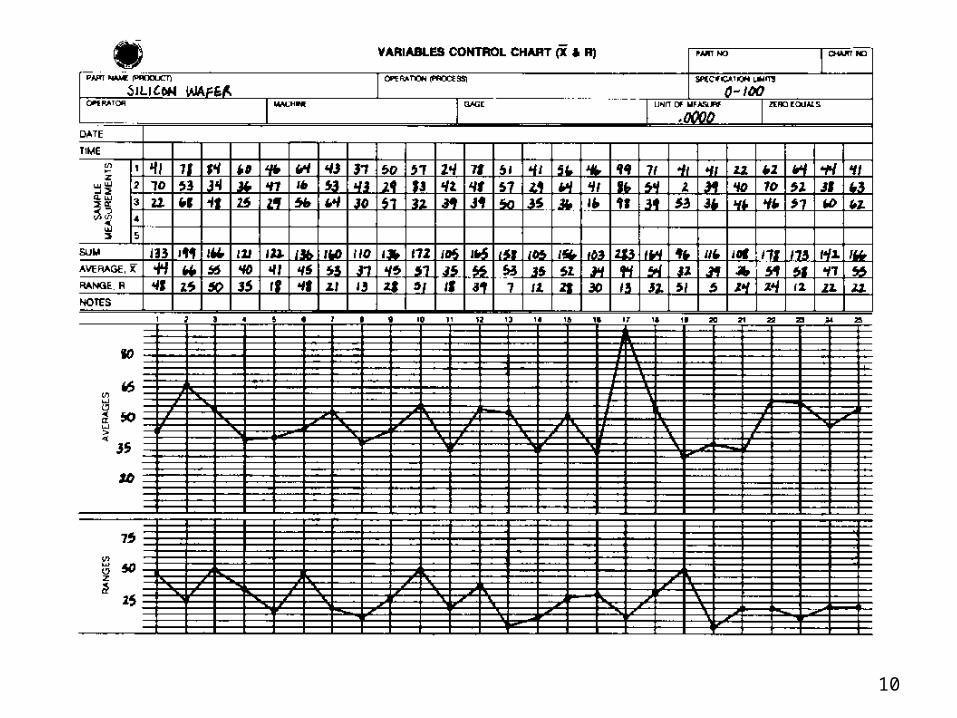
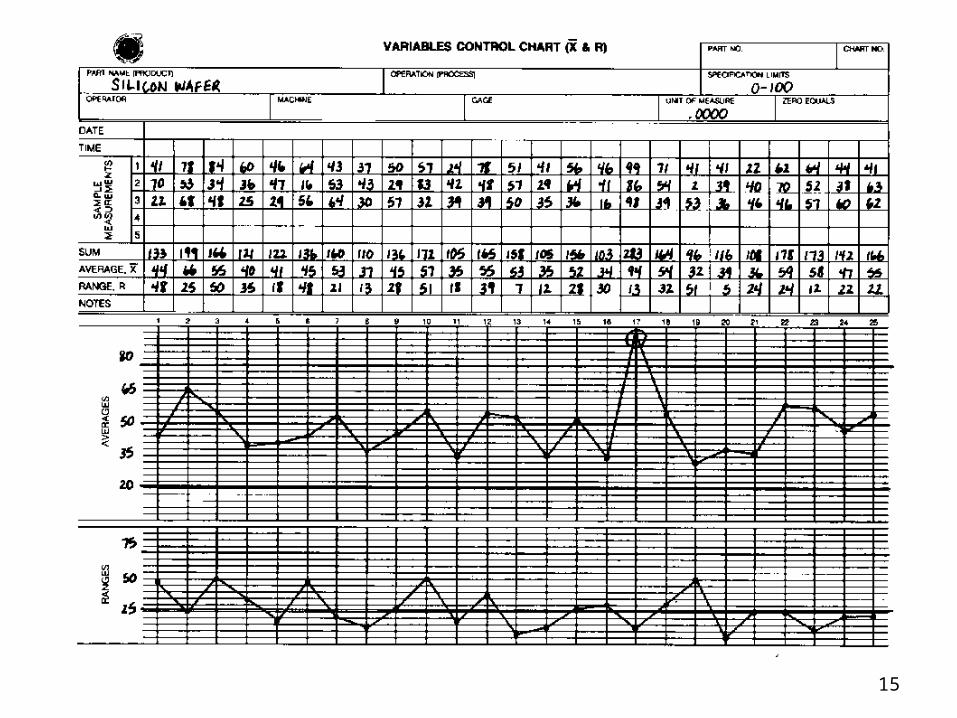
2. Collect Data– Record data– Calculate appropriate statistics– Plot statistics on chart
9
10
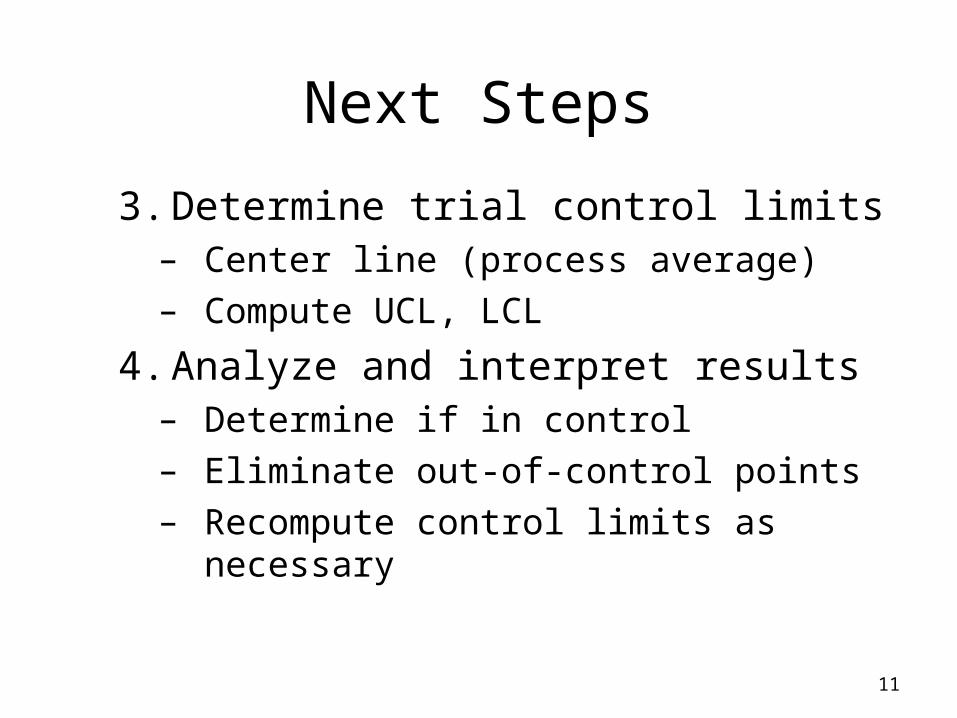
Next Steps
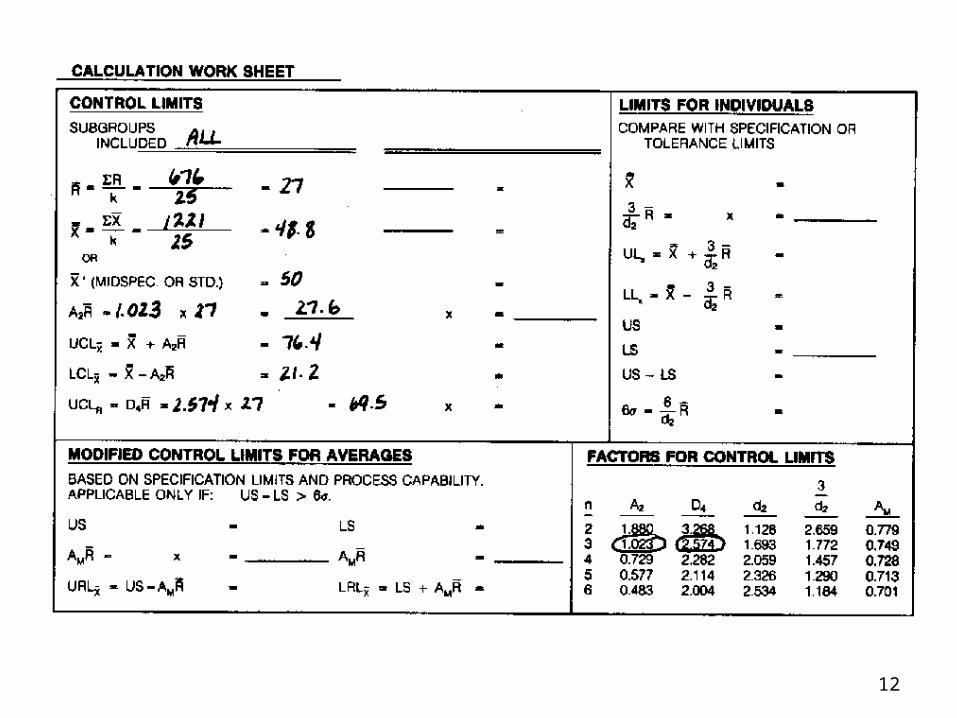
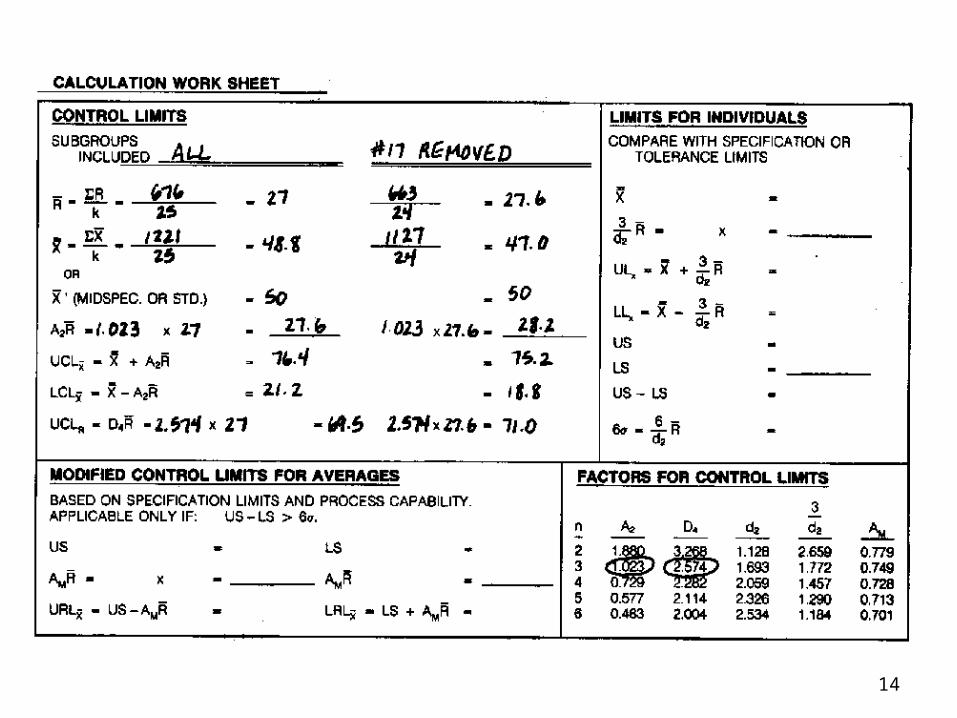
3. Determine trial control limits– Center line (process average)– Compute UCL, LCL
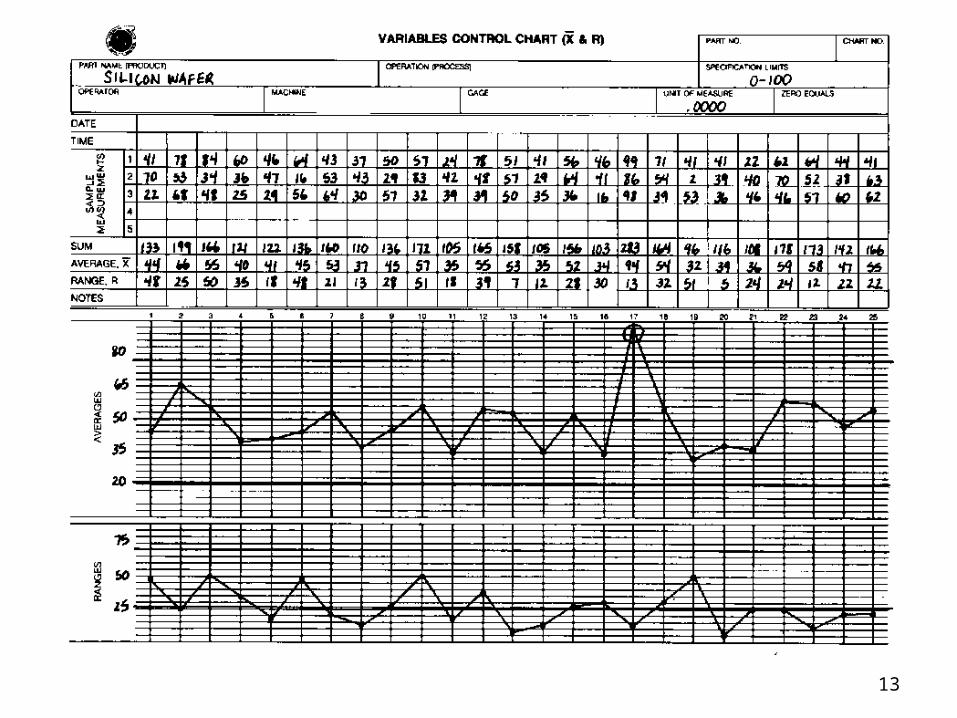
4. Analyze and interpret results– Determine if in control– Eliminate out-of-control points– Recompute control limits as necessary
11
12
13
14
15
Typical Out-of-Control Patterns• Point outside control limits• Sudden shift in process average• Cycles• Trends• Hugging the center line• Hugging the control limits• Instability
16
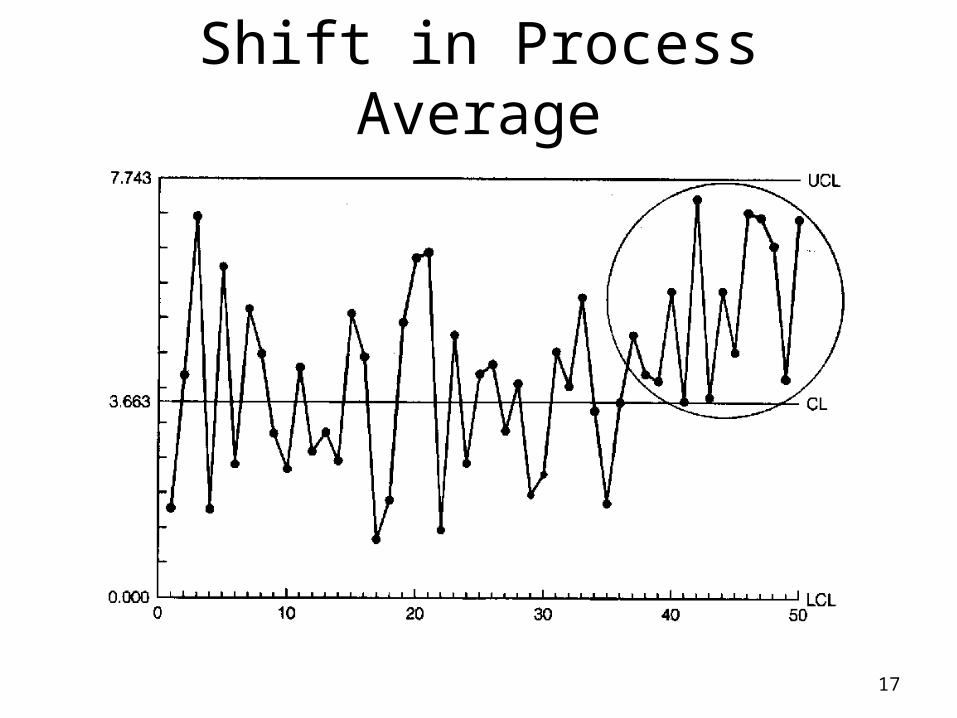
Shift in Process Average
17
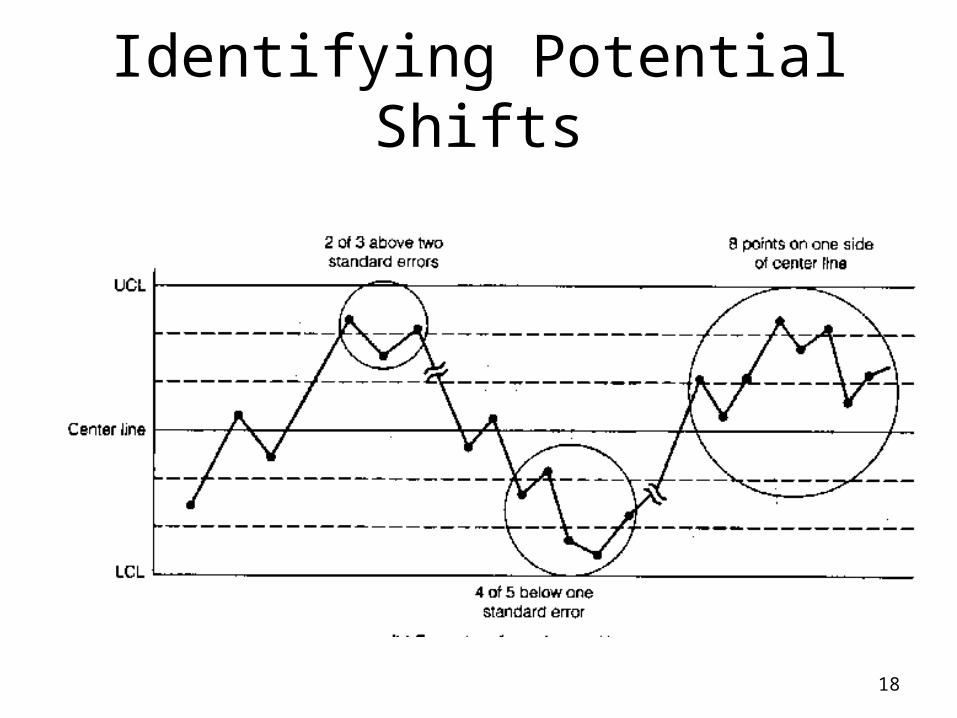
Identifying Potential Shifts
18
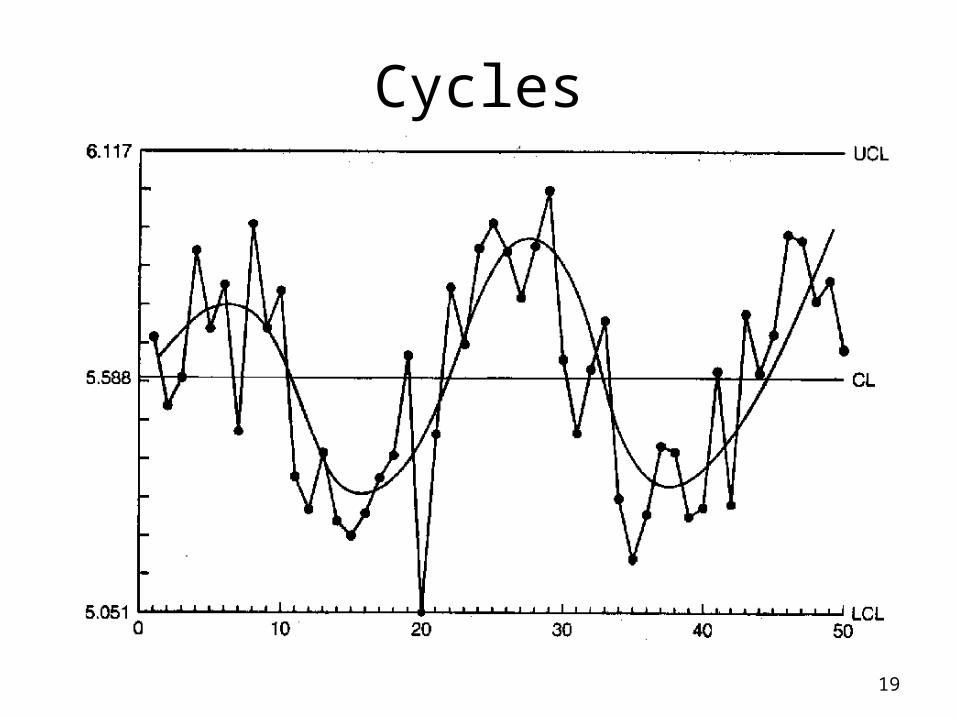
Cycles
19
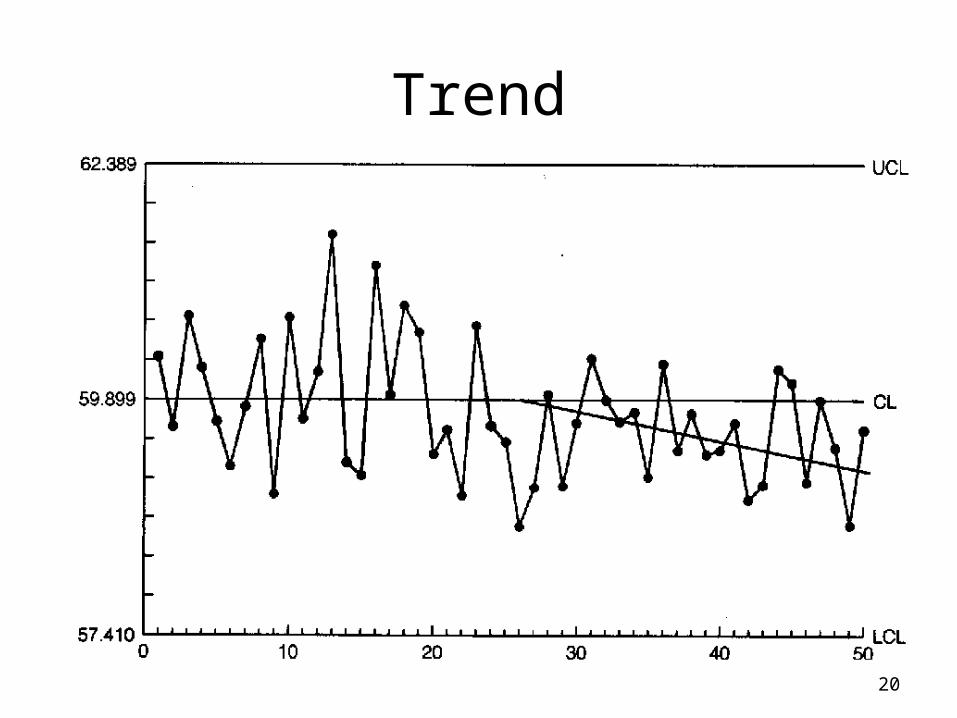
Trend
20
Final Steps
5. Use as a problem-solving tool– Continue to collect and plot data– Take corrective action when
necessary
6. Compute process capability
21
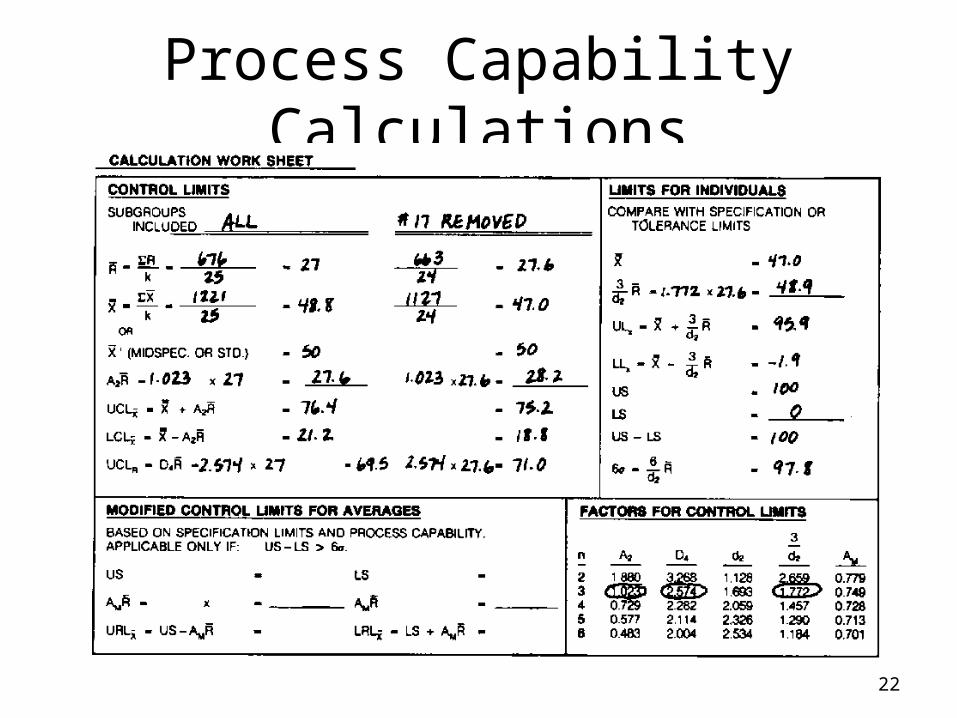
Process Capability Calculations
22
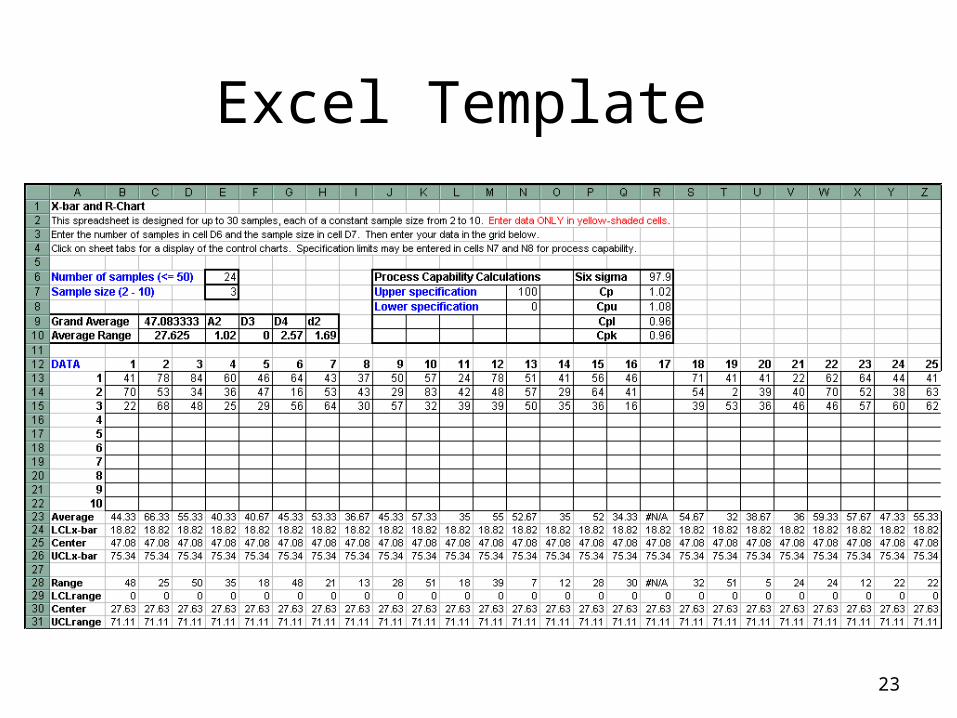
Excel Template
23
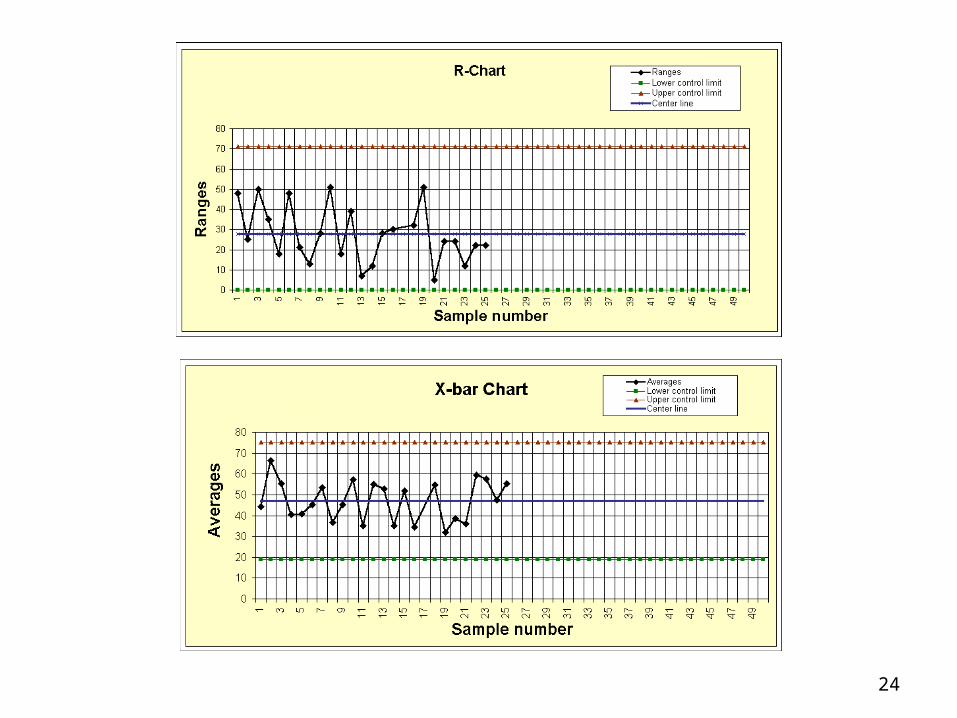
24
Special Variables Control Charts
• x-bar and s charts• x-chart for individuals
25
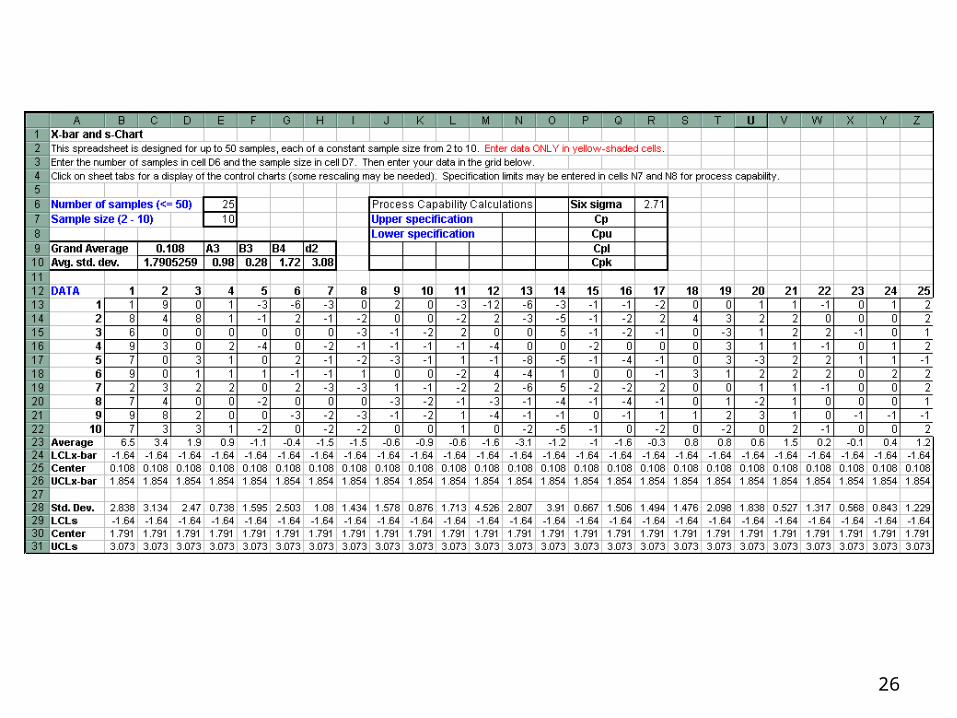
26
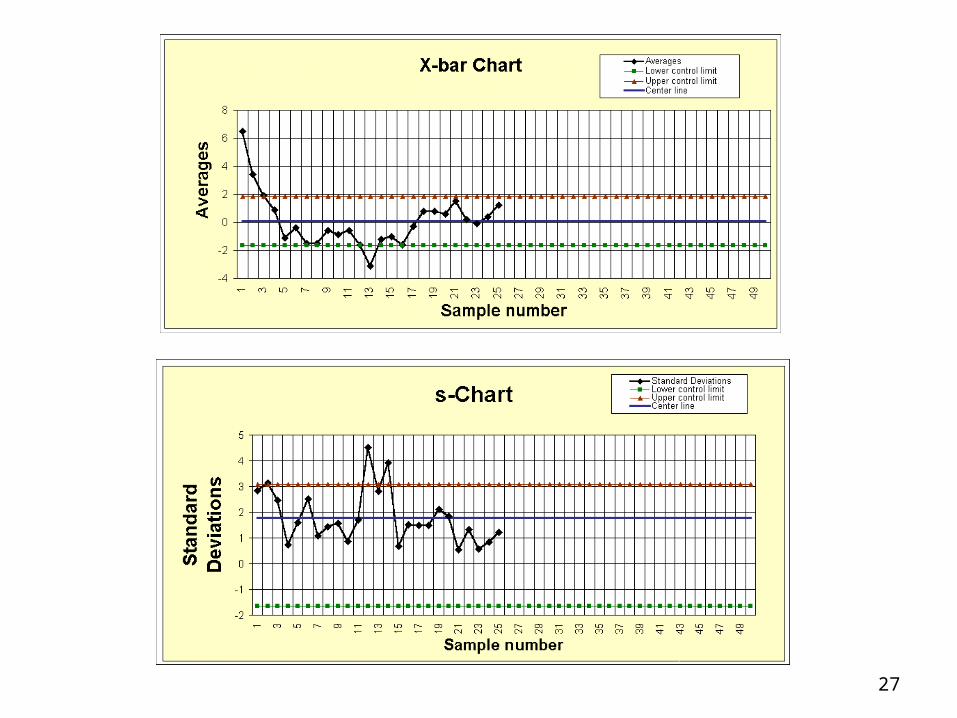
27
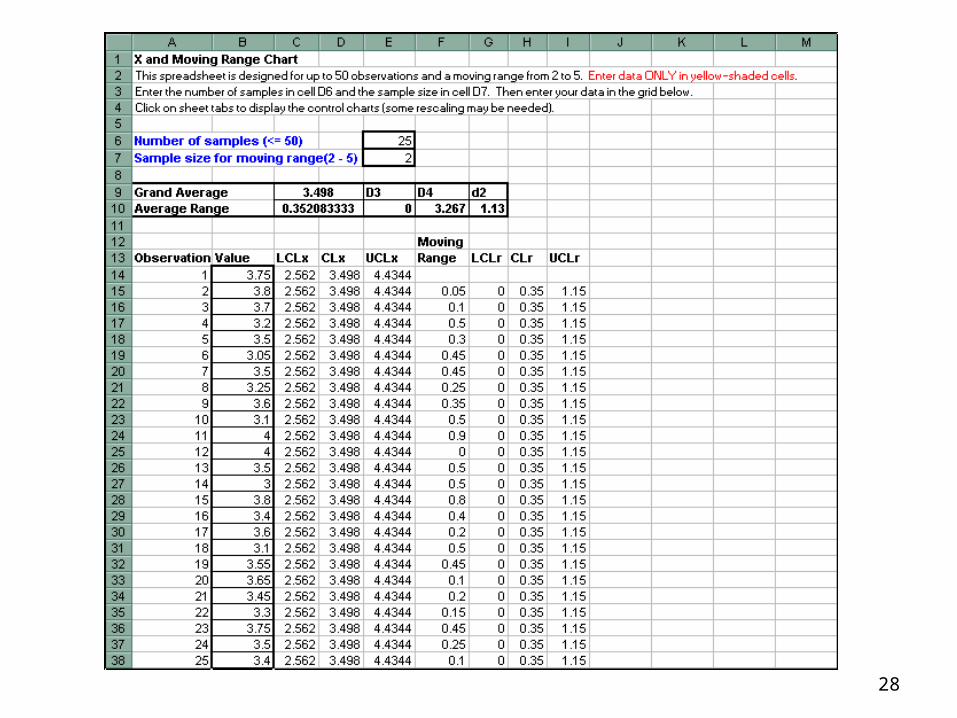
28
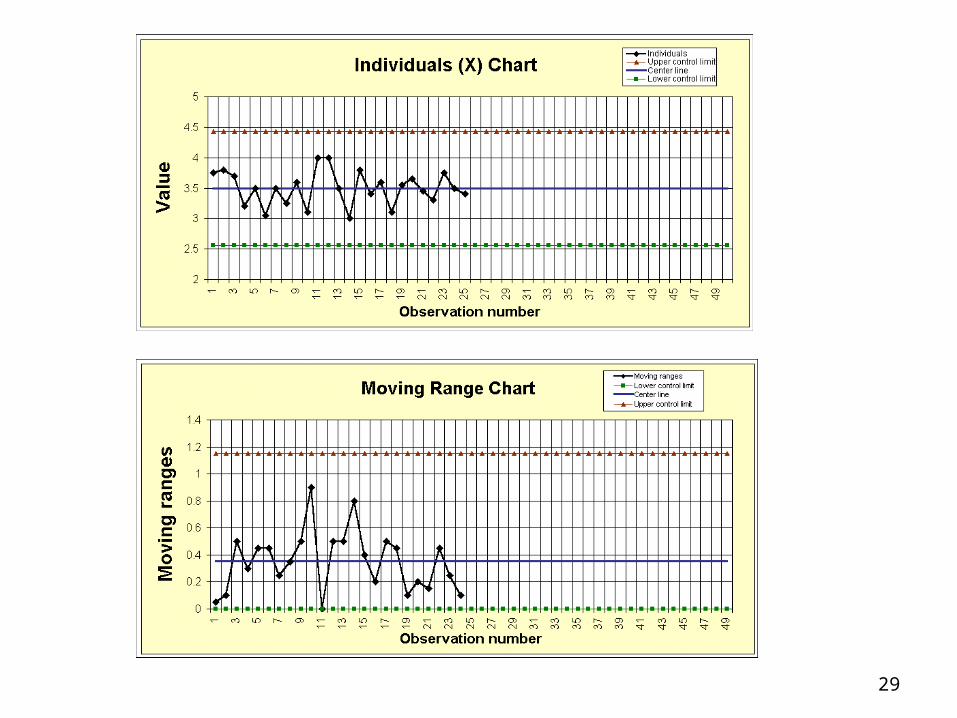
29
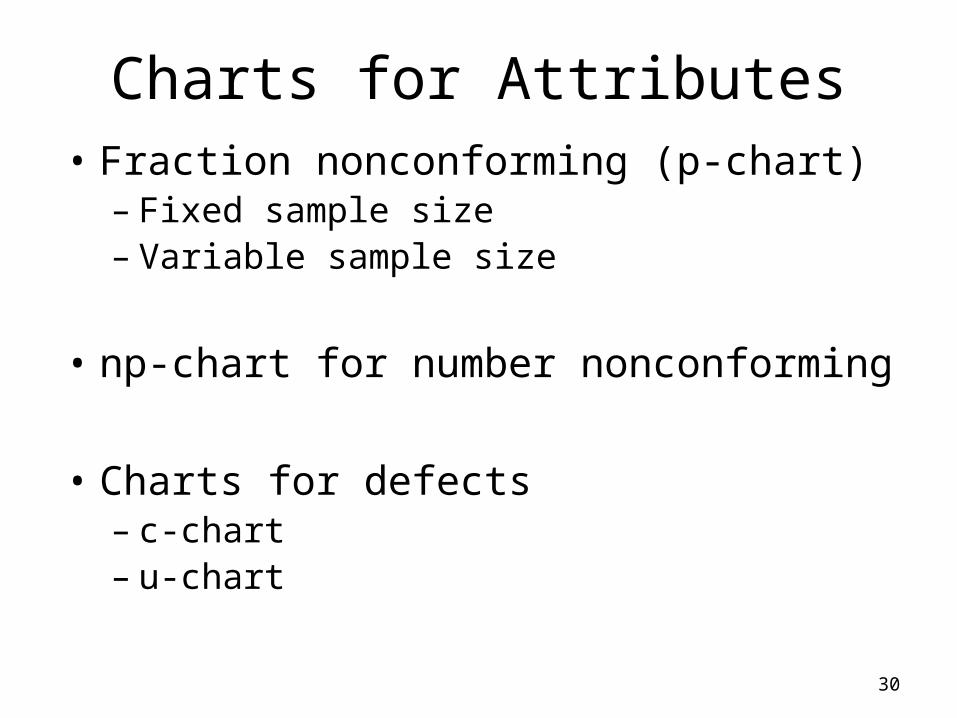
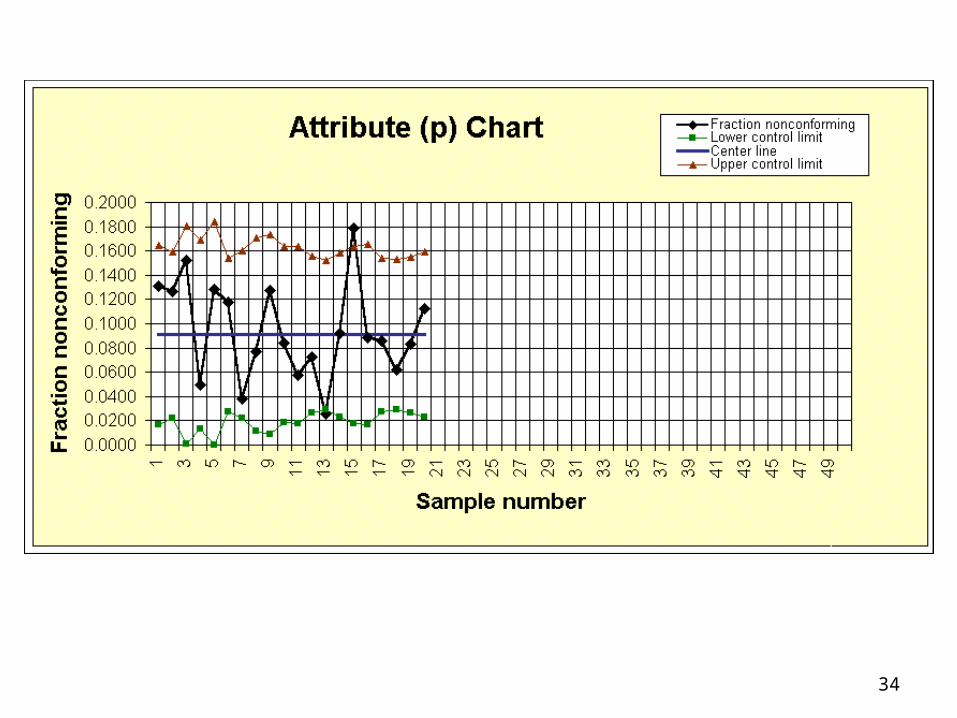
Charts for Attributes• Fraction nonconforming (p-chart)
– Fixed sample size– Variable sample size
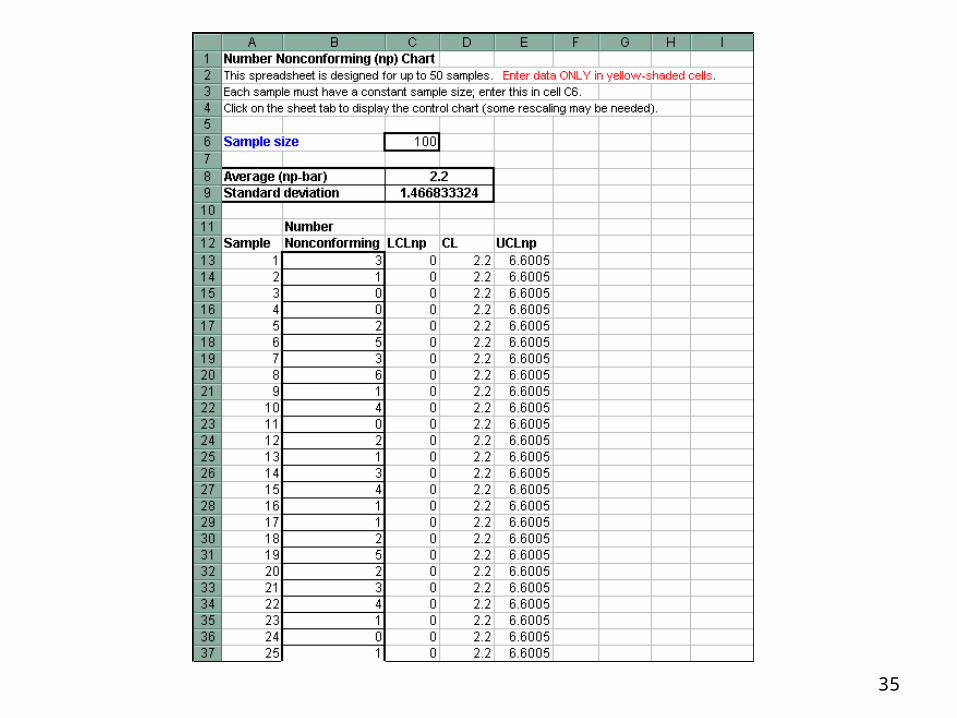
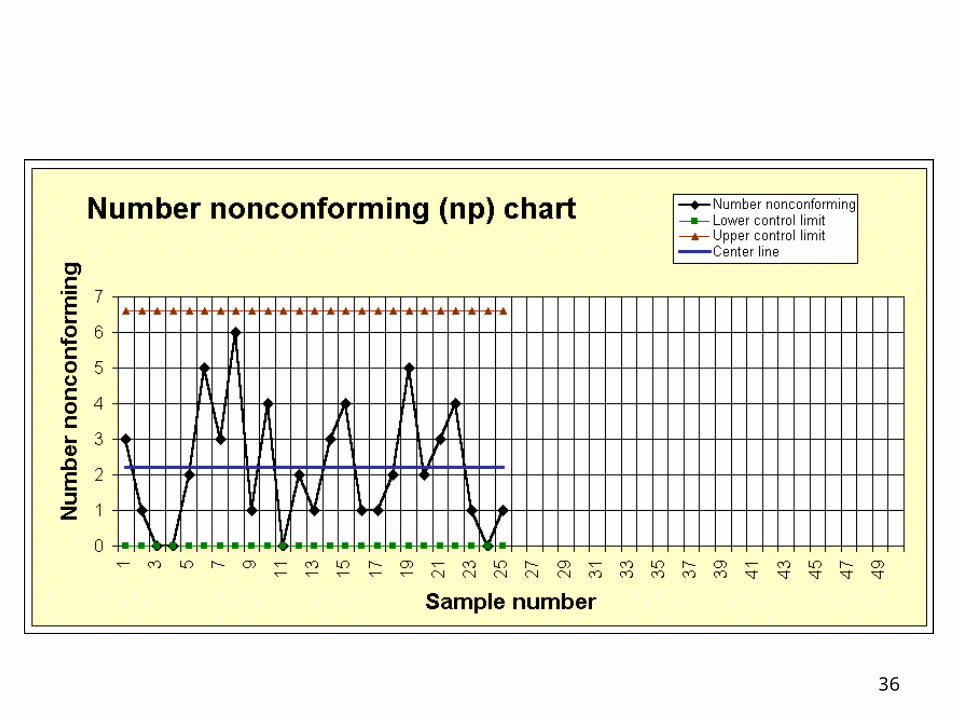
• np-chart for number nonconforming
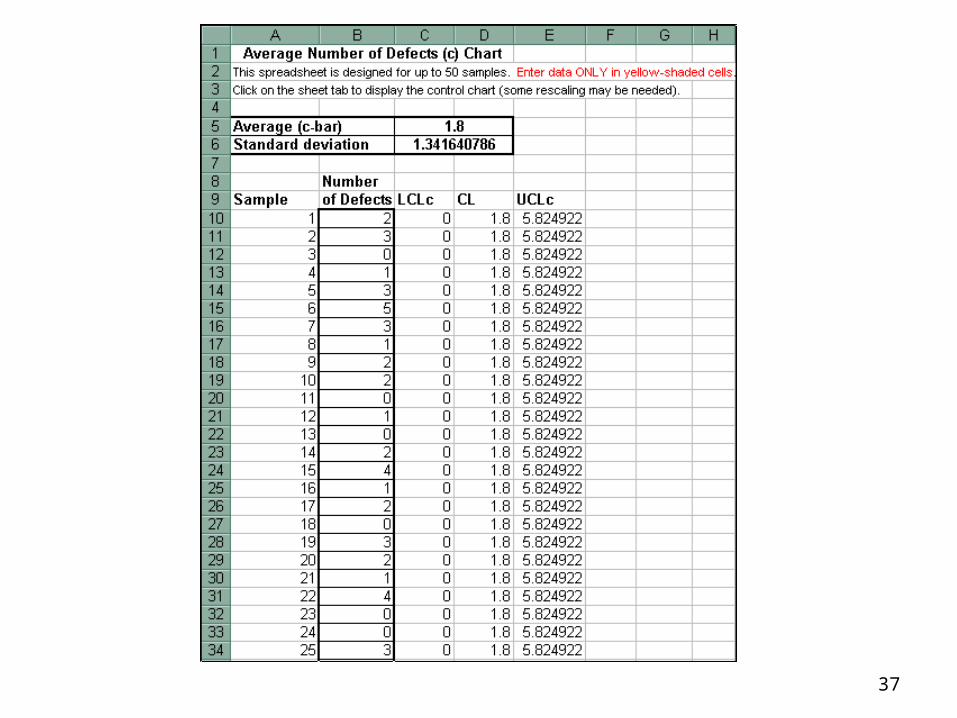
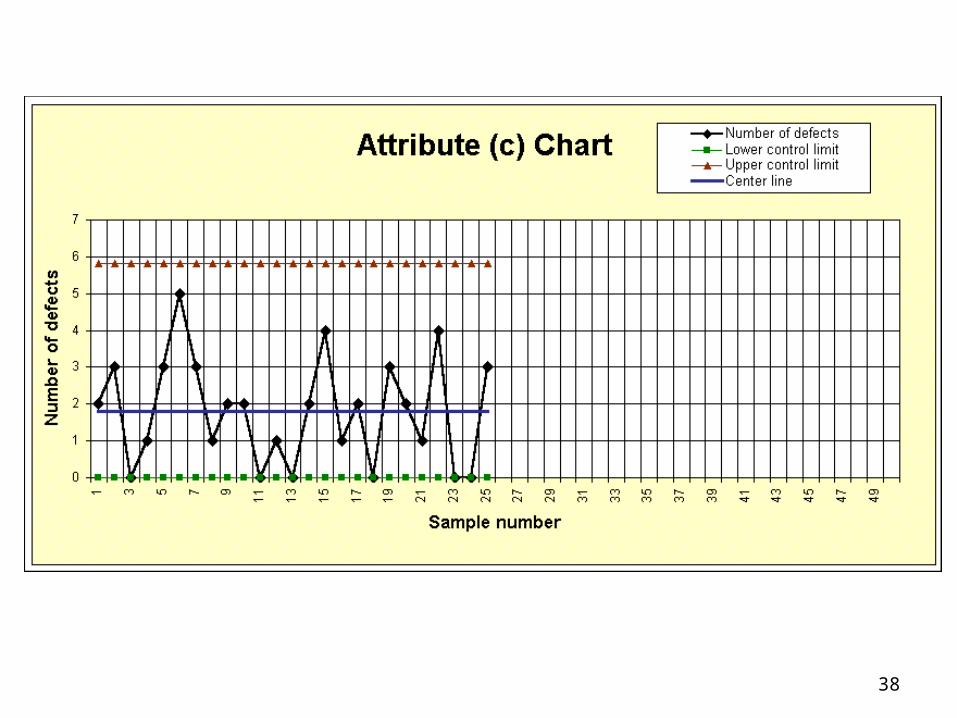
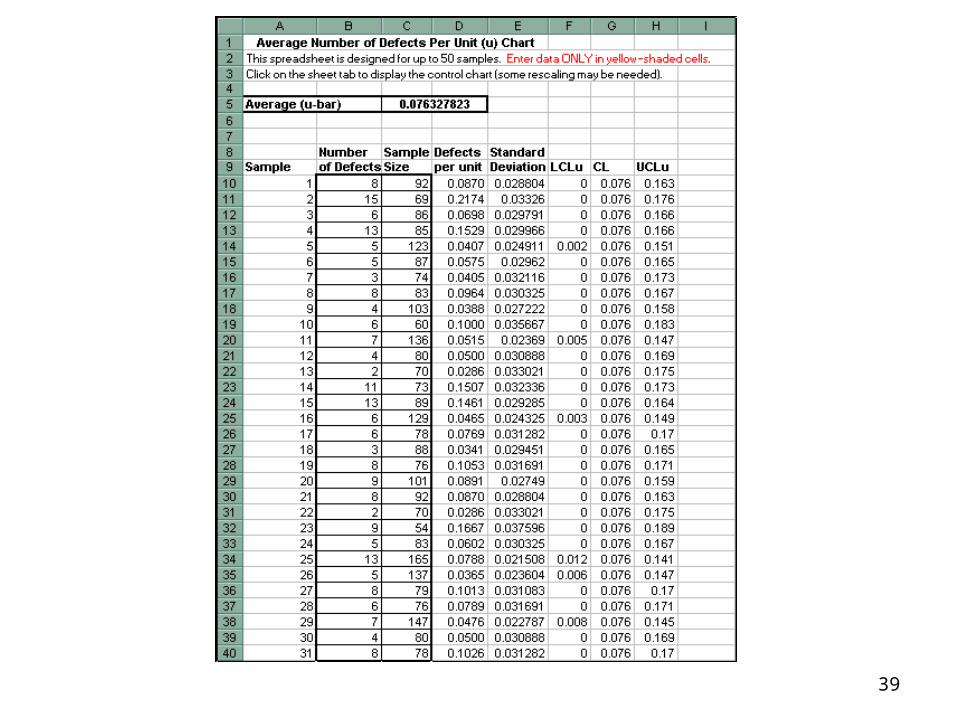
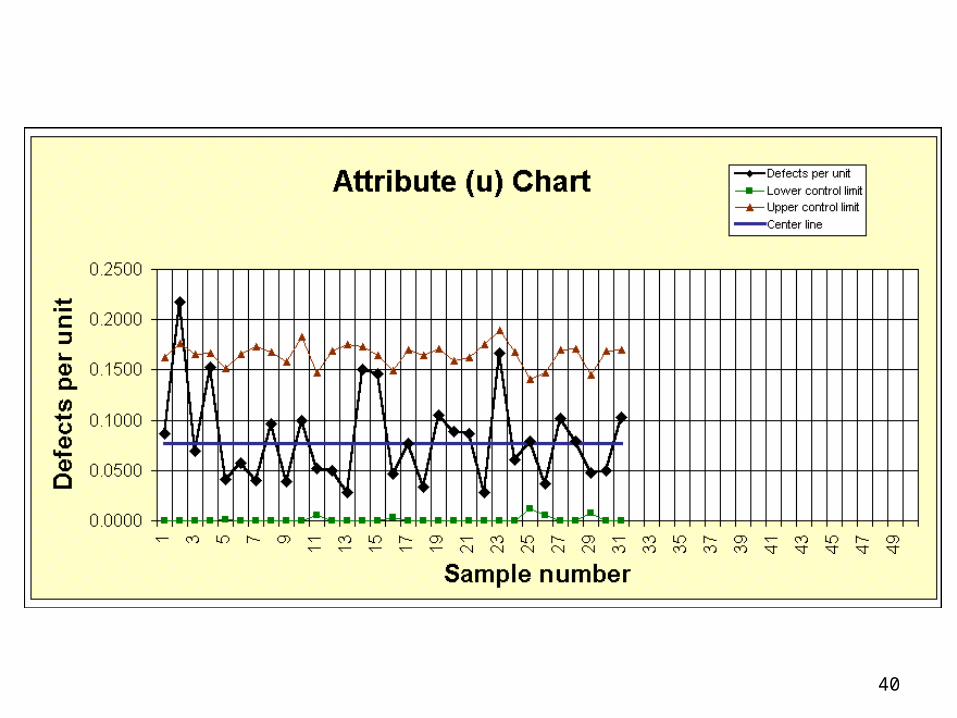
• Charts for defects– c-chart– u-chart
30
31
32
33
34
35
36
37
38
39
40
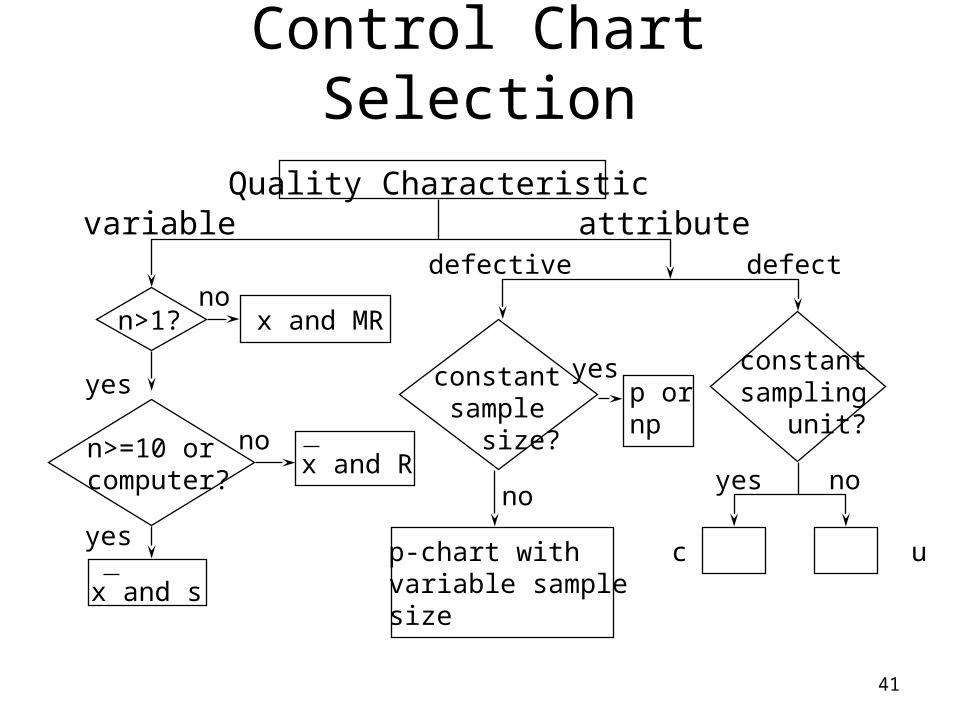
Control Chart Selection
41
Quality Characteristicvariable attribute
n>1?
n>=10 or computer?
x and MRno
yes
x and s
x and Rno
yes
defective defect
constant sample size?
p-chart withvariable samplesize
no
p ornp
yes constantsampling unit?
c u
yes no
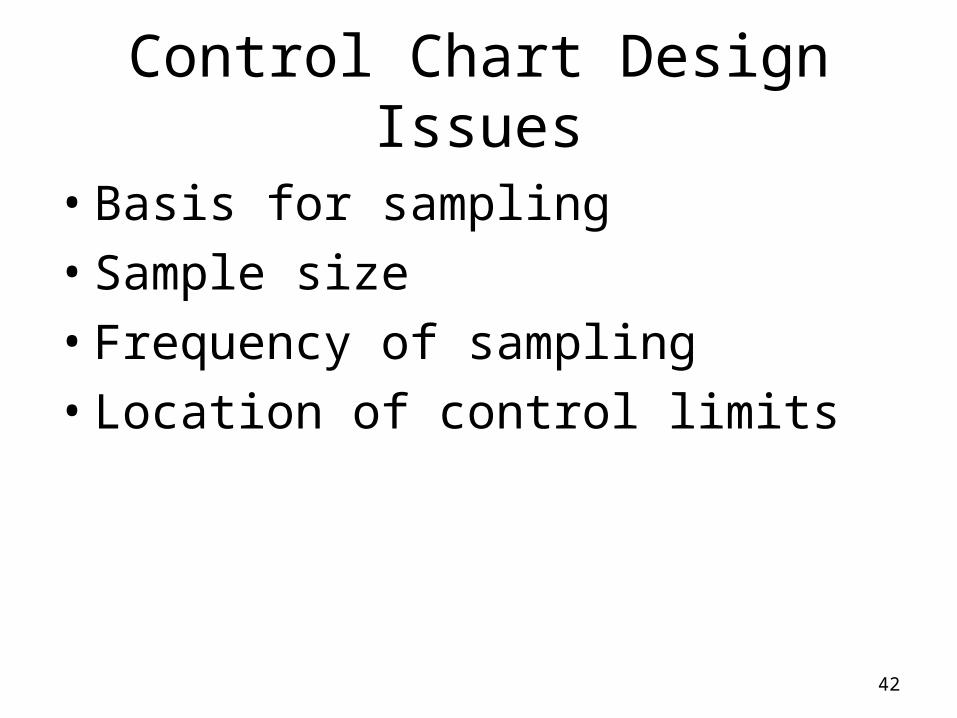
Control Chart Design Issues
• Basis for sampling• Sample size• Frequency of sampling• Location of control limits
42
43
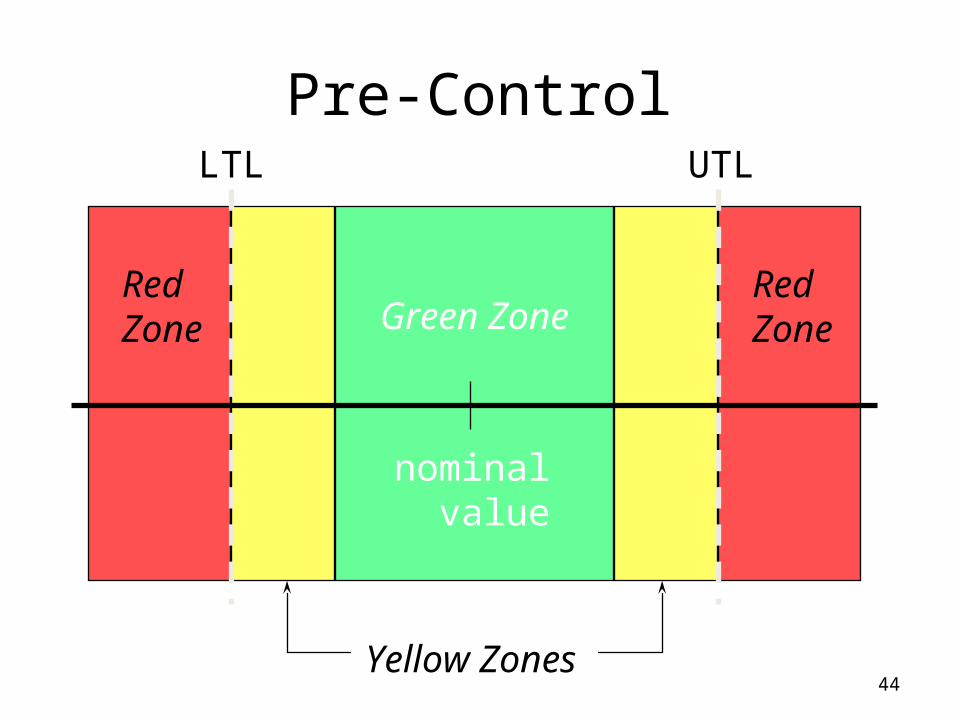
Pre-Control
44
nominal value
Green Zone
Yellow Zones
RedZone
RedZone
LTL UTL

SPC Implementation Requirements
• Top management commitment• Project champion• Initial workable project• Employee education and training• Accurate measurement system
45


