Page 1
Primary Care Practice Facilitation CurriculumModule 13: Measuring and Benchmarking
Clinical Performance
Agency for Healthcare Research and Quality
Advancing Excellence in Health Care www.ahrq.gov
Page 2
Primary Care Practice Facilitation Curriculum
Module 13. Measuring and Benchmarking Clinical Performance
Prepared for:
Agency for Healthcare Research and Quality
U.S. Department of Health and Human Services
540 Gaither Road
Rockville, MD 20850
www.ahrq.gov
Contract No. HHSA2902009000191-Task Order No.6
Prepared by:
Prepared by: Mathematica Policy ResearchPrinceton, NJProject Director: Deborah PeikesDeputy Project Director: Dana PetersenPrincipal Investigators: Deborah Peikes, Erin Fries Taylor, and Jesse Crosson
Primary Author
Lyndee Knox, Ph.D., LA Net Community Health Resource Network
Contributing Author
Cindy Brach, M.P.P., Agency for Healthcare Research & Quality
AHRQ Publication No. 15-0060-EF
September 2015
Page 3
Primary Care Practice Facilitation Curriculum MODULE 13 M13-ii
This document is in the public domain and may be used and reprinted without permission except
those copyrighted materials that are clearly noted in the document. Further reproduction of those
copyrighted materials is prohibited without the specific permission of copyright holders.
The findings and conclusions in this document are those of the authors, who are responsible for
its contents; the findings and conclusions do not necessarily represent the views of AHRQ.
Therefore, no statement in this report should be construed as an official position of AHRQ or of
the U.S. Department of Health and Human Services.
Suggested Citation
Knox L, Brach C. Primary Care Practice Facilitation Curriculum (Module 13). AHRQ
Publication No. 15-0060-EF, Rockville, MD: Agency for Healthcare Research and Quality;
September 2015.
Page 4
Primary Care Practice Facilitation Curriculum MODULE 13 M13-iii
Contents
Instructor’s Guide ............................................................................................................................1
Time ............................................................................................................................................1
Objectives ....................................................................................................................................1
Exercises and Activities To Complete Before and After the Session .........................................1
Module 13. ......................................................................................................................................3
Selecting Clinical Performance Measures ...................................................................................3
Refining Clinical Performance Measures: Defining the Numerator and Denominator................4
Benchmarking .............................................................................................................................5
Page 6
Primary Care Practice Facilitation Curriculum MODULE 13 M13-1
Module 13. Measuring and Benchmarking Clinical
Performance
Instructor’s Guide
Practice facilitator (PF) competencies addressed in this module:
Specialized skills in data collection, benchmarking, and analysis of clinical performance
Time
Pre-session preparation for learners: 55 minutes
Session: 75 minutes
Objectives
After completing this module, learners will be able to:
1. Identify sources for selecting performance measures for primary care.
2. Describe the importance of the numerator and denominator in defining performance measures.
3. Describe benchmarking and its use by facilitators to support improvement work.
Exercises and Activities To Complete Before and After the Session
Pre-session preparation. Ask the learners to review the following information (55 minutes)
1. The content of the module.
2. Bagley B. How does your practice measure up? Fam Pract Manag 2006 Jul-Aug;13(7):59-64.
Available at http://www.aafp.org/fpm/2006/0700/p59.html.
3. Damberg C, Sorber M, Lovejoy S, et al. An evaluation of the use of performance measures in
health care. RAND Health Q 2012;1(4):3 Available at
http://www.rand.org/pubs/periodicals/health-quarterly/issues/v1/n4/03.html.
4. Benchmarking. Available at https://en.wikipedia.org/wiki/Benchmarking.
During the session. Presentation (15 minutes)
1. Present key concepts from the module.
Discussion. Ask questions and explore answers with learners (15 minutes)
1. Discuss your experience developing and using performance metrics in clinical or other settings.
What did you learn? How will you use this in your work with practices?
Activity for learners (30 minutes)
1. Divide into pairs.
2. Use online resources identified in this module and previous modules to develop a list of
metrics for a practice to use to assess its clinical performance in primary care for diabetes
mellitus and chronic kidney disease.
3. Use online resources to identify national or local external benchmarks for performance on
these metrics.
Discussion. Ask questions and explore answers with learners (15 minutes)
1. What did you learn from the exercise?
2. How will you use this in your work with your practices?
Page 8
Primary Care Practice Facilitation Curriculum MODULE 13 M13-3
Module 13.
erformance measurement involves collecting and reporting data on practices’ clinical
processes and outcomes. Measuring clinical performance can create buy-in for improvement
work in the practice and enables the practice to track its improvements over time. This
information should also be used to identify and prioritize improvement goals and to track
progress toward those goals. In addition, these data should be used to monitor maintenance of
changes already made.
As a PF, it is important to understand that initially staff and clinicians in a practice may not like
the idea of gathering data and doing quality reporting. You will want to be sensitive to this and
prepared to support your practices in working through their concerns. The reasons for practice
concerns vary. Some practices may feel threatened by the idea, worried that it may present the
practice or its staff in a negative light. Others may challenge its usefulness based on the belief
(often true) that the data are too messy and flawed to provide an accurate picture of their
performance. Others may be concerned that metrics currently being used to evaluate quality in
practices are too simplistic and do not adequately capture the care for more complex patients
(also often true) or correlate with any real outcomes (also often true). Finally, others may feel
gathering these data duplicates work that they are already required to do for other reasons and so
is not a good use of human or data resources at the practice. Addressing these objections and
helping practice members understand the importance of this work for improving care is a key
part of your role.
Selecting Clinical Performance Measures
You will work with your practices to identify the areas of clinical performance they want to
assess. The areas of clinical performance should connect to the improvement goals the quality
improvement (QI) team has set as well as any mandates from the funder. Common sources for
performance measures are the Healthcare Effectiveness Data and Information Set (HEDIS),
quality indicators developed by the National Committee for Quality Assurance, and criteria
selected by health plans.
In addition to selecting a set of performance measures that the practice wants to track, the QI
team will need to decide how frequently to collect and analyze data. Data collection timelines
should allow sufficient time for change to occur. Data also should be generated frequently
enough to show progress over time through the use of run charts and other methods of comparing
data collected across multiple time periods.
P
Page 9
Primary Care Practice Facilitation Curriculum MODULE 13 M13-4
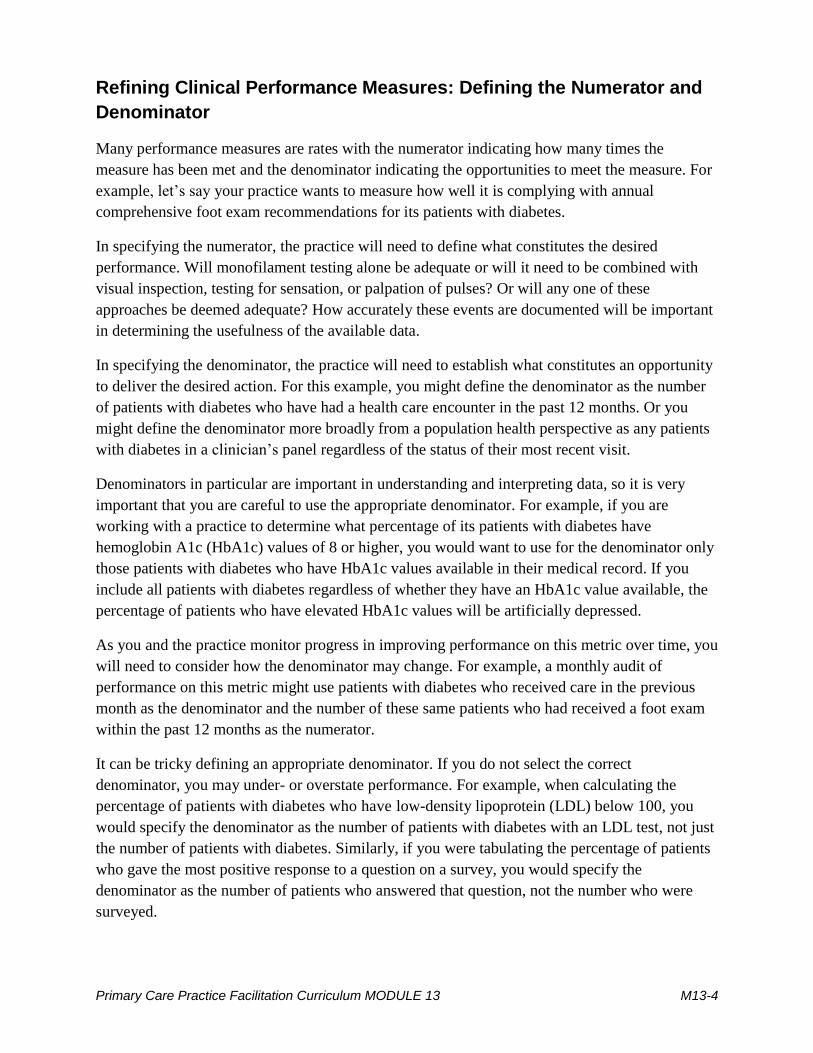
Refining Clinical Performance Measures: Defining the Numerator and
Denominator
Many performance measures are rates with the numerator indicating how many times the
measure has been met and the denominator indicating the opportunities to meet the measure. For
example, let’s say your practice wants to measure how well it is complying with annual
comprehensive foot exam recommendations for its patients with diabetes.
In specifying the numerator, the practice will need to define what constitutes the desired
performance. Will monofilament testing alone be adequate or will it need to be combined with
visual inspection, testing for sensation, or palpation of pulses? Or will any one of these
approaches be deemed adequate? How accurately these events are documented will be important
in determining the usefulness of the available data.
In specifying the denominator, the practice will need to establish what constitutes an opportunity
to deliver the desired action. For this example, you might define the denominator as the number
of patients with diabetes who have had a health care encounter in the past 12 months. Or you
might define the denominator more broadly from a population health perspective as any patients
with diabetes in a clinician’s panel regardless of the status of their most recent visit.
Denominators in particular are important in understanding and interpreting data, so it is very
important that you are careful to use the appropriate denominator. For example, if you are
working with a practice to determine what percentage of its patients with diabetes have
hemoglobin A1c (HbA1c) values of 8 or higher, you would want to use for the denominator only
those patients with diabetes who have HbA1c values available in their medical record. If you
include all patients with diabetes regardless of whether they have an HbA1c value available, the
percentage of patients who have elevated HbA1c values will be artificially depressed.
As you and the practice monitor progress in improving performance on this metric over time, you
will need to consider how the denominator may change. For example, a monthly audit of
performance on this metric might use patients with diabetes who received care in the previous
month as the denominator and the number of these same patients who had received a foot exam
within the past 12 months as the numerator.
It can be tricky defining an appropriate denominator. If you do not select the correct
denominator, you may under- or overstate performance. For example, when calculating the
percentage of patients with diabetes who have low-density lipoprotein (LDL) below 100, you
would specify the denominator as the number of patients with diabetes with an LDL test, not just
the number of patients with diabetes. Similarly, if you were tabulating the percentage of patients
who gave the most positive response to a question on a survey, you would specify the
denominator as the number of patients who answered that question, not the number who were
surveyed.
Page 10
Primary Care Practice Facilitation Curriculum MODULE 13 M13-5
You will also need to help the practice decide which, if any, subgroups they want to evaluate. For
example, you may want to measure performance for patients who have had a visit in the past
quarter or who have been in treatment for at least six months. You will also need to decide
whether you want to stratify performance measures for different populations. For example, you
might want to compare performance for patients based on age, gender, race or ethnicity, disease
severity, or treatment status.
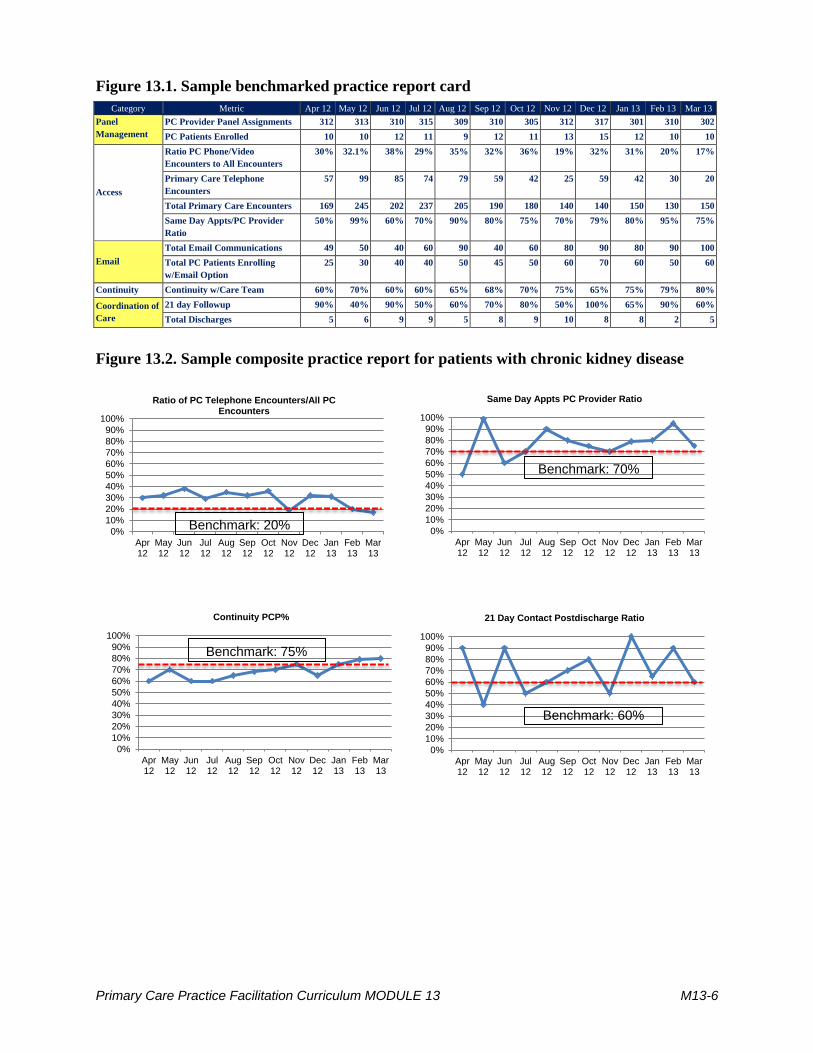
Benchmarking
Benchmarking is the process of comparing a practice’s performance with an external standard.
Benchmarking is an important tool that facilitators can use to motivate a practice to engage in
improvement work and help members of a practice understand where the practice’s performance
falls in comparison to others. Benchmarking can stimulate healthy competition, as well as help
members of a practice reflect more effectively on their own performance. See Figure 13.1 for an
example of a benchmarked practice report card.
You will need to work with your practices to identify appropriate benchmarks. Benchmarks can
be generated from similar practices in the same area or by comparing them to a larger group of
practices from across the country. They can also be drawn from standards set by an authoritative
body. Good sources for benchmarks include local quality collaboratives where several practices
collect similar performance data and compare among themselves. Community clinic associations
often host this type of local effort, typically through multi-organization QI projects on a
particular condition such as asthma, and may benchmark across the participating sites as part of
their work with their members.
Other sources for benchmarks include required data reports to Federal agencies and funders, such
as the Health Resources and Services Administration’s Uniform Data System reports required
from Federally Qualified Health Centers. National associations and the National Committee for
Quality Assurance are other potential resources for benchmarking, as well as State and local
health and public health agencies.
Health information technology vendors are emerging as a source
of benchmarks when they allow comparison across organizations
using their systems. Large data networks such as DARTNet and
SAFTINet funded by AHRQ may also become a resource for both
local and national benchmarking. Figures 13.1–13.3 are examples
of the types of reports produced by these organizations.
Pay attention to numerators
and denominators when
benchmarking. It is important
to ensure that you are making
“apples to apples”
comparisons.
Page 11
Primary Care Practice Facilitation Curriculum MODULE 13 M13-6
Figure 13.1. Sample benchmarked practice report card
Category Metric Apr 12 May 12 Jun 12 Jul 12 Aug 12 Sep 12 Oct 12 Nov 12 Dec 12 Jan 13 Feb 13 Mar 13
Panel
Management
PC Provider Panel Assignments 312 313 310 315 309 310 305 312 317 301 310 302
PC Patients Enrolled 10 10 12 11 9 12 11 13 15 12 10 10
Access
Ratio PC Phone/Video
Encounters to All Encounters
30% 32.1% 38% 29% 35% 32% 36% 19% 32% 31% 20% 17%
Primary Care Telephone
Encounters
57 99 85 74 79 59 42 25 59 42 30 20
Total Primary Care Encounters 169 245 202 237 205 190 180 140 140 150 130 150
Same Day Appts/PC Provider
Ratio
50% 99% 60% 70% 90% 80% 75% 70% 79% 80% 95% 75%
Email
Total Email Communications 49 50 40 60 90 40 60 80 90 80 90 100
Total PC Patients Enrolling
w/Email Option
25 30 40 40 50 45 50 60 70 60 50 60
Continuity Continuity w/Care Team 60% 70% 60% 60% 65% 68% 70% 75% 65% 75% 79% 80%
Coordination of
Care
21 day Followup 90% 40% 90% 50% 60% 70% 80% 50% 100% 65% 90% 60%
Total Discharges 5 6 9 9 5 8 9 10 8 8 2 5
0%
10%
20%
30%
40%
50%
60%
70%
80%
90%
100%
Apr12
May12
Jun12
Jul12
Aug12
Sep12
Oct12
Nov12
Dec12
Jan13
Feb13
Mar13
21 Day Contact Postdischarge Ratio
Benchmark: 60%
0%
10%
20%
30%
40%
50%
60%
70%
80%
90%
100%
Apr12
May12
Jun12
Jul12
Aug12
Sep12
Oct12
Nov12
Dec12
Jan13
Feb13
Mar13
Same Day Appts PC Provider Ratio
Benchmark: 70%
0%
10%
20%
30%
40%
50%
60%
70%
80%
90%
100%
Apr12
May12
Jun12
Jul12
Aug12
Sep12
Oct12
Nov12
Dec12
Jan13
Feb13
Mar13
Continuity PCP%
Benchmark: 75%
Figure 13.2. Sample composite practice report for patients with chronic kidney disease
0%
10%
20%
30%
40%
50%
60%
70%
80%
90%
100%
Apr12
May12
Jun12
Jul12
Aug12
Sep12
Oct12
Nov12
Dec12
Jan13
Feb13
Mar13
Ratio of PC Telephone Encounters/All PC Encounters
Benchmark: 20%
Page 12
Primary Care Practice Facilitation Curriculum MODULE 13 M13-7
Sample Clinic
Report Measure Name Cohort Target Cohort Definition Formula
1Control Blood
PressureAll patients who meet stringent CKD criteria 140/90
Percentage of patients with average of last 3 BP
<= 140/90
Mean of last three systolic and diastolic
BP; will be based on last one or two if
fewer than three available
2 Control LDL All patients who meet stringent CKD criteria <100Percentage of patients with average of last two
LDL measures < 100
Mean of last two LDL; last LDL if only one
is available
3 Use ACE/ARB All patients who meet stringent CKD criteria YesPercentage of patients with a current ACE/ARB
prescription
Documentation in EHR/pharmacy of
prescription; yes/no for each time period
4 Control HbA1CPatients who meet stringent CKD criteria and
have a Dx code of 250*<7.0 Percentage of diabetic patients with A1c < 7.0 Last HbA1c;
5Have Not
Eliminated
NSAID/Cox-2 use
All patients who meet stringent CKD criteria NoPercentage of patients with a current prescription
for NSAID/Cox 2Yes/no for each time period
6Refer to
NephrologistPatients with at least one GFR < 30 Yes
Percentage of patients with at least one eGFR <
30 who have been referred to nephrologyReferral documented, if applicable
7Eliminate
SmokingPatients with smoking status documented
Non / Former
smokers
Percentage of patients with a documented
smoking status who are non smokers or former
smokers
Yes/no for each time period
8Diagnosis of
CKDPts who meet stringent CKD criteria
Appropriate CKD
Dx
Percentage of patients who meet CKD criteria
who have CKD Diagnosis (ICD-9 Dx Codes (ICD-9 = 585.xx and 250.4.x)
9Annual ACR
MeasurePts who have ICD9 of 250.xx
Annual
measurement
Percentage of patients who have MicroCR in
prior yearLab done
10 Annual LDL Pts who meet stringent CKD criteriaAnnual
measurement
Percentage of patients who have LDL in prior
yearLab done
11 Annual A1c Patients with diabetesAnnual
measurement
Percentage of patients who have A1c in prior
yearLab done
12Follow up
creatinine
measure
Pts who have 1 eGFR < 60Appropriate Follow-
Up Measurement
Percentage of patients who have a follow up
creatinine measure > 90 and < 360 days after the
first eGFR < 60
Lab done
13Follow up ACR
measurePts who have 1 ACR > 30
Appropriate Follow-
Up Measurement
Percentage of patients who have a follow up
ACR measure > 90 days and < 360 days after
the first ACR > 30
Lab done
Key:
0%
10%
20%
30%
40%
50%
60%
70%
80%
90%
100%
Composite Timeseries Performance Report
Baseline Q1 Q2 Q3 Q4Report date ranges: 12 months to... Baseline = 1/15/13; Q1 = 4/15/13; Q2/Q3 (combined) = 11/15/13; Q4 = 2/15/14; Q5 = 5/15/14
Page 1 of 1
Source: Sample Composite Practice Performance Report. Leawood, KS: DARTNet Institute; 2015.
Page 13
Primary Care Practice Facilitation Curriculum MODULE 13 M13-8
Figure 13.3. Sample benchmarked practice report for patients with chronic kidney disease
Source: Sample Composite Practice Performance Report. Leawood, KS: DARTNet Institute; 2015
Note: this module is based on Module 7 of the Practice Facilitation Handbook. Available at
http://www.ahrq.gov/professionals/prevention-chronic-care/improve/system/pfhandbook/