21
The Responsible Trader Lessons The Responsible Trader Lessons The Responsible Trader’s - POV Module 7 – Oscillators and Sentiment Indicators
| Date post: | 18-Jul-2015 |
| Category: |
Education |
| Upload: | the-responsible-trader |
| View: | 311 times |
| Download: | 0 times |

The Responsible Trader Lessons
The Responsible Trader Lessons
The Responsible Trader’s - POVModule 7 – Oscillators and Sentiment Indicators

The Responsible Trader Lessons
The Responsible Trader Lessons
The Responsible Trader’s - POV• The Responsible Trader's POV (Point of View).
• These are my notes, my own additional research and studies on the Topic that I posted, and my personal observations and opinions that I am sharing to further enhance our knowledge and understanding.
• Some of these were previously posted on “The Responsible Trader” thread, Stock Market Pilipinas (www.stockmarketpilipinas.com). This is the latest version of previous posts I made.
• Some of these plus further explanations and discussions will be appearing in my forthcoming book “The Responsible Trader.”

The Responsible Trader Lessons
The Responsible Trader Lessons
Chart courtesy of Amibroker Charting Software
Quick Review: Which Simple Moving Average has a more smooth line. The 20 SMA or the 50 SMA?
The 50 SMA has a more smooth line. The longer the period, the more smooth the line becomes.
Blue
Gold
The longer period is more smooth.
The Responsible Trader Lessons
The Responsible Trader Lessons
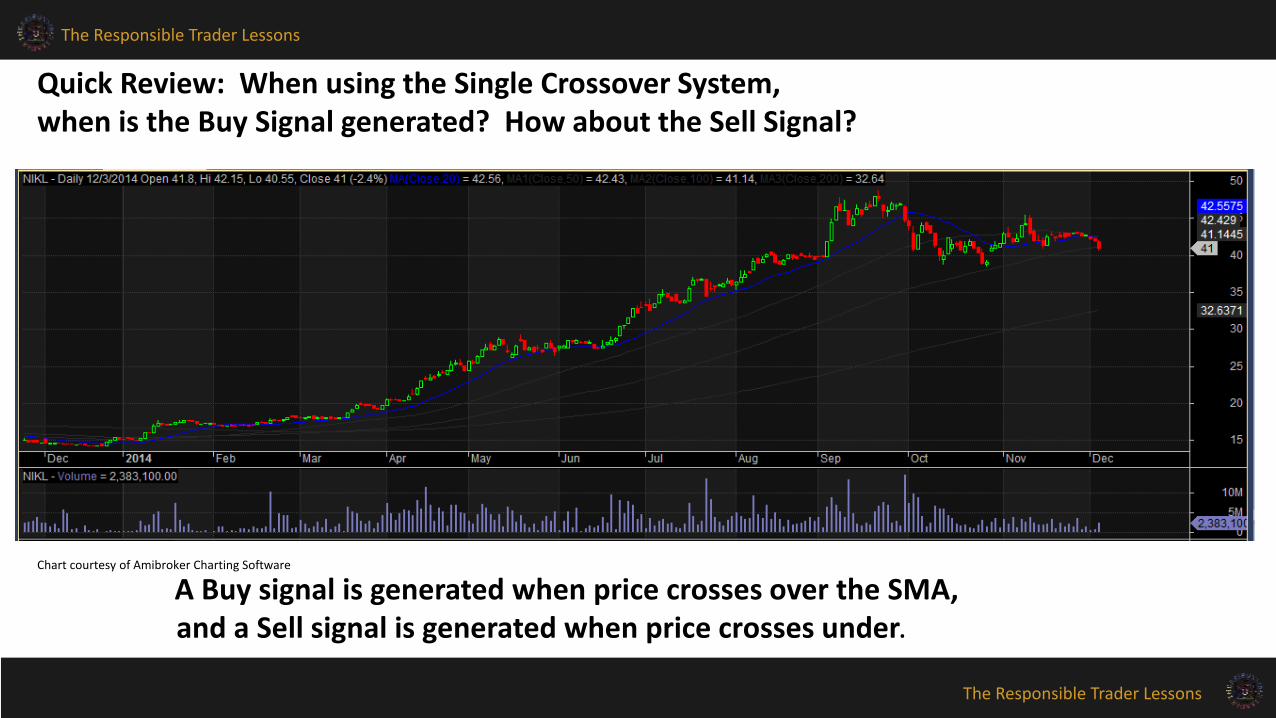
A Buy signal is generated when price crosses over the SMA,and a Sell signal is generated when price crosses under.
Chart courtesy of Amibroker Charting Software
Quick Review: When using the Single Crossover System, when is the Buy Signal generated? How about the Sell Signal?
The Responsible Trader Lessons
The Responsible Trader Lessons
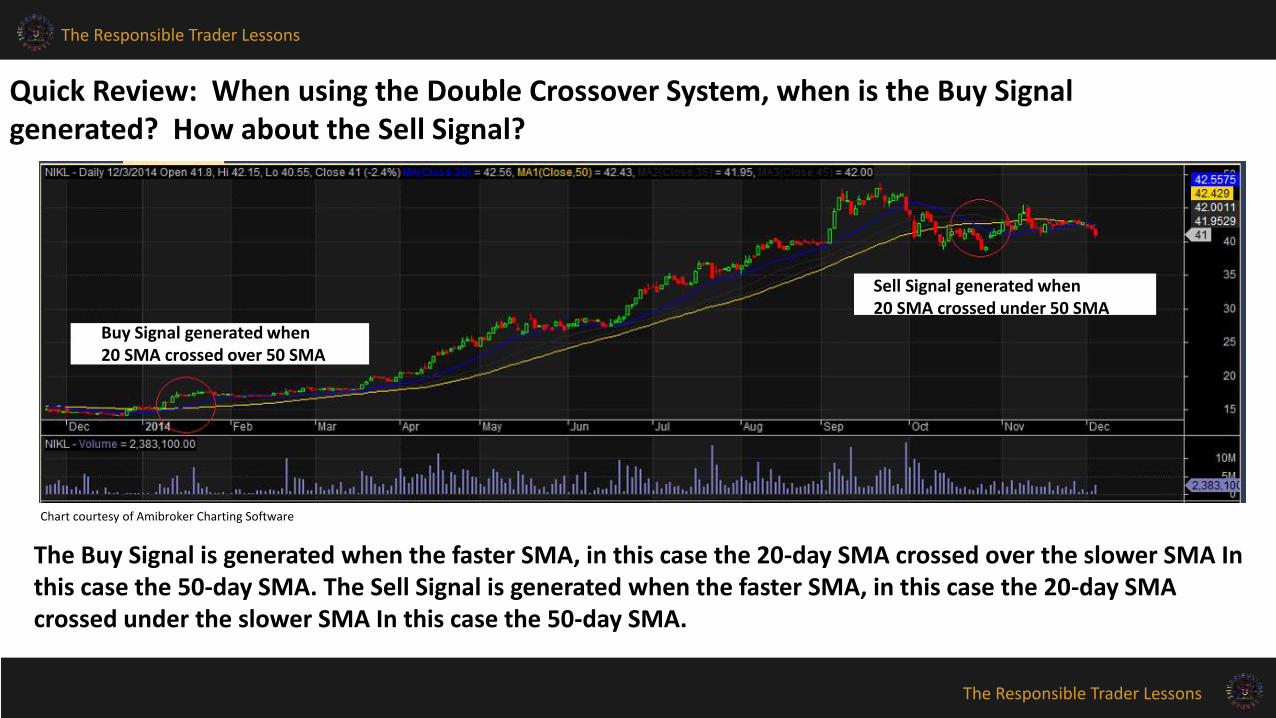
The Buy Signal is generated when the faster SMA, in this case the 20-day SMA crossed over the slower SMA In this case the 50-day SMA. The Sell Signal is generated when the faster SMA, in this case the 20-day SMA crossed under the slower SMA In this case the 50-day SMA.
Chart courtesy of Amibroker Charting Software
Quick Review: When using the Double Crossover System, when is the Buy Signal generated? How about the Sell Signal?
Buy Signal generated when20 SMA crossed over 50 SMA
Sell Signal generated when20 SMA crossed under 50 SMA

The Responsible Trader Lessons
The Responsible Trader Lessons
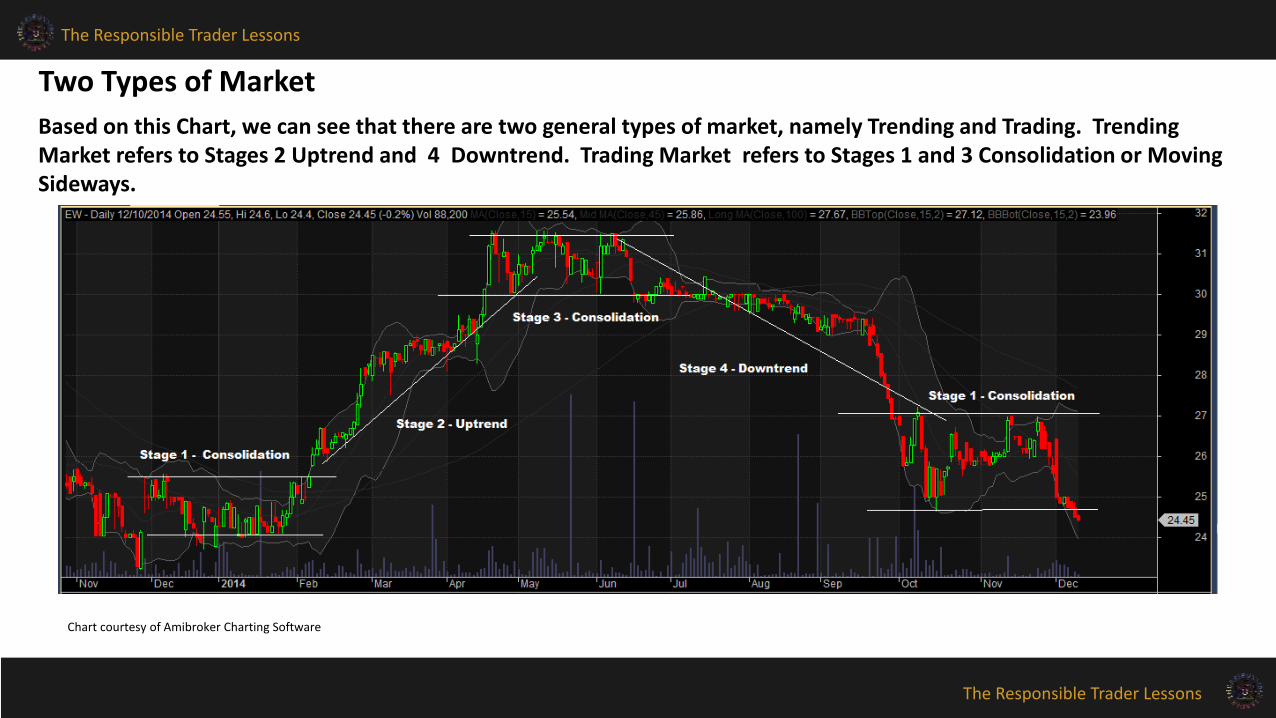
The three types of trends – The Uptrend, the Downtrend and the Sideways Trend are component parts of a Cycle and better understood as Stages in a Cycle.
Stage 1 is the Sideways Trend or Consolidation. Stage 2 is the Uptrend. Stage 3 is Consolidation before the Roll-over leading to the Downtrend. Stage 4 is the Downtrend. Below is the chart of EW showing these stages.
Trends as Stages of a Cycle
Chart courtesy of Amibroker Charting Software
The Responsible Trader Lessons
The Responsible Trader Lessons
Based on this Chart, we can see that there are two general types of market, namely Trending and Trading. Trending Market refers to Stages 2 Uptrend and 4 Downtrend. Trading Market refers to Stages 1 and 3 Consolidation or Moving Sideways.
Two Types of Market
Chart courtesy of Amibroker Charting Software
The Responsible Trader Lessons
The Responsible Trader Lessons
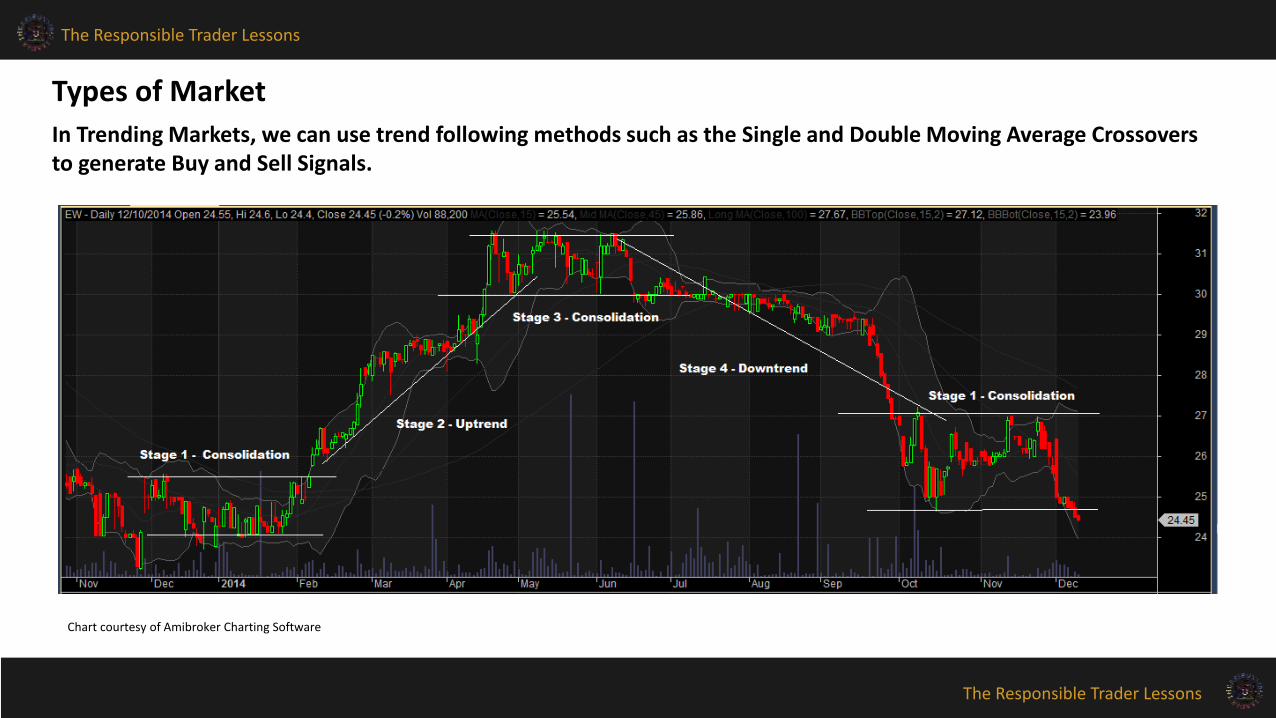
In Trending Markets, we can use trend following methods such as the Single and Double Moving Average Crossovers to generate Buy and Sell Signals.
Types of Market
Chart courtesy of Amibroker Charting Software
The Responsible Trader Lessons
The Responsible Trader Lessons
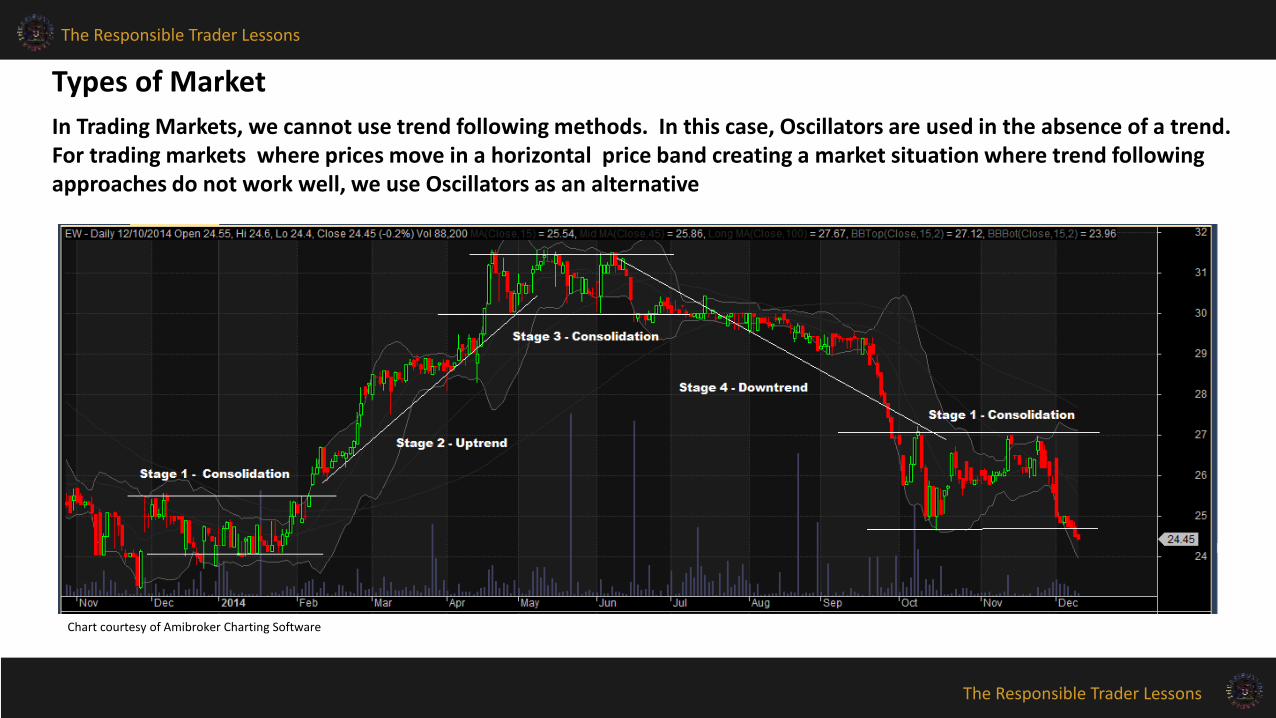
In Trading Markets, we cannot use trend following methods. In this case, Oscillators are used in the absence of a trend.For trading markets where prices move in a horizontal price band creating a market situation where trend following approaches do not work well, we use Oscillators as an alternative
Types of Market
Chart courtesy of Amibroker Charting Software
The Responsible Trader Lessons
The Responsible Trader Lessons
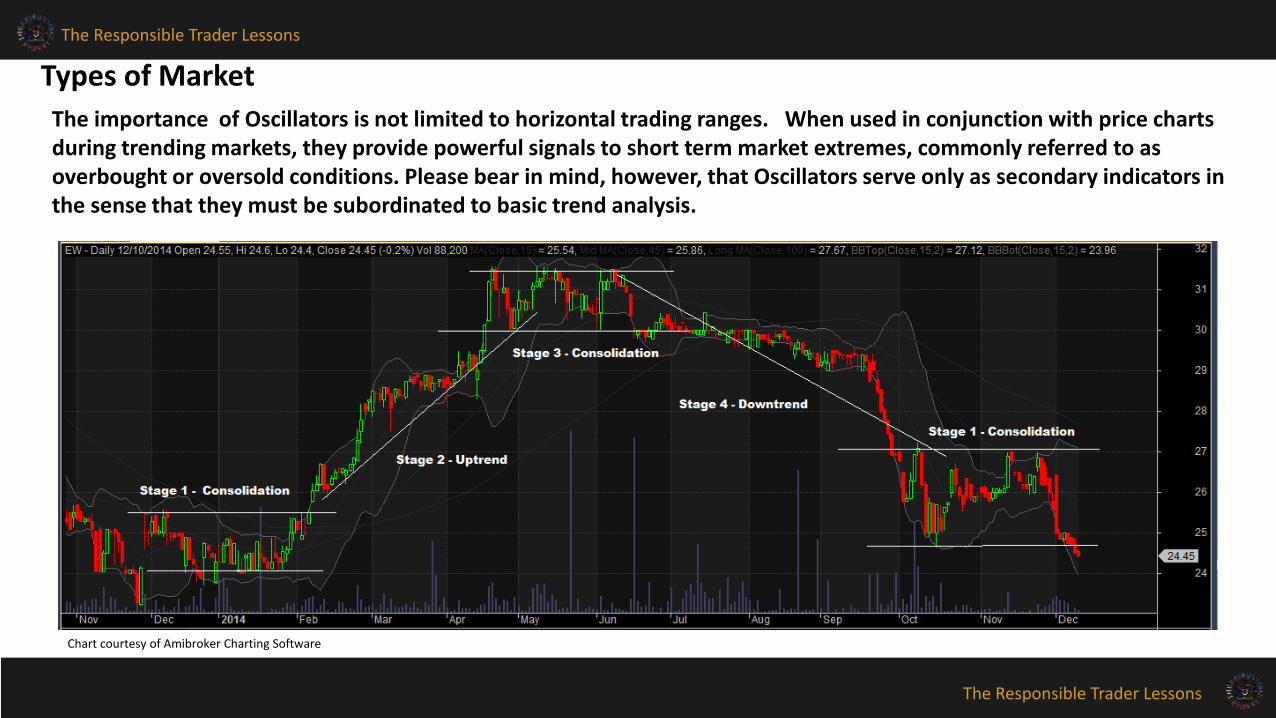
The importance of Oscillators is not limited to horizontal trading ranges. When used in conjunction with price charts during trending markets, they provide powerful signals to short term market extremes, commonly referred to as overbought or oversold conditions. Please bear in mind, however, that Oscillators serve only as secondary indicators in the sense that they must be subordinated to basic trend analysis.
Types of Market
Chart courtesy of Amibroker Charting Software

The Responsible Trader Lessons
The Responsible Trader Lessons
An oscillator is a technical analysis tool that is banded between two extreme values and built with the results from a trend indicator for discovering short-term overbought or oversold conditions. As the value of the oscillator approaches the upper extreme value the asset is deemed to be overbought, and as it approaches the lower extreme it is deemed to be oversold. The terms Oscillators and Technical Indicators are sometimes used interchangeably.
The words overbought and oversold are sometimes confusing especially to new traders. When thinking of overbought they sometimes think that this is synonymous with the stock being overpriced. Overbought is a technical condition that occurs when there has been a lot of buying and the price of the stock is considered too high and susceptible to a decline. On the other hand, Oversold is technical condition that occurs when there has been a lot of selling and the price of the stock is considered too low and a rally in prices is anticipated.
Essentially, Technical Indicators are used for two purposes, to generate buy and sell signals and to confirm price movements. Each Technical Indicator has its own unique purpose so we have to understand how they are derived and what they do before using them.
Oscillators
The Responsible Trader Lessons
The Responsible Trader Lessons
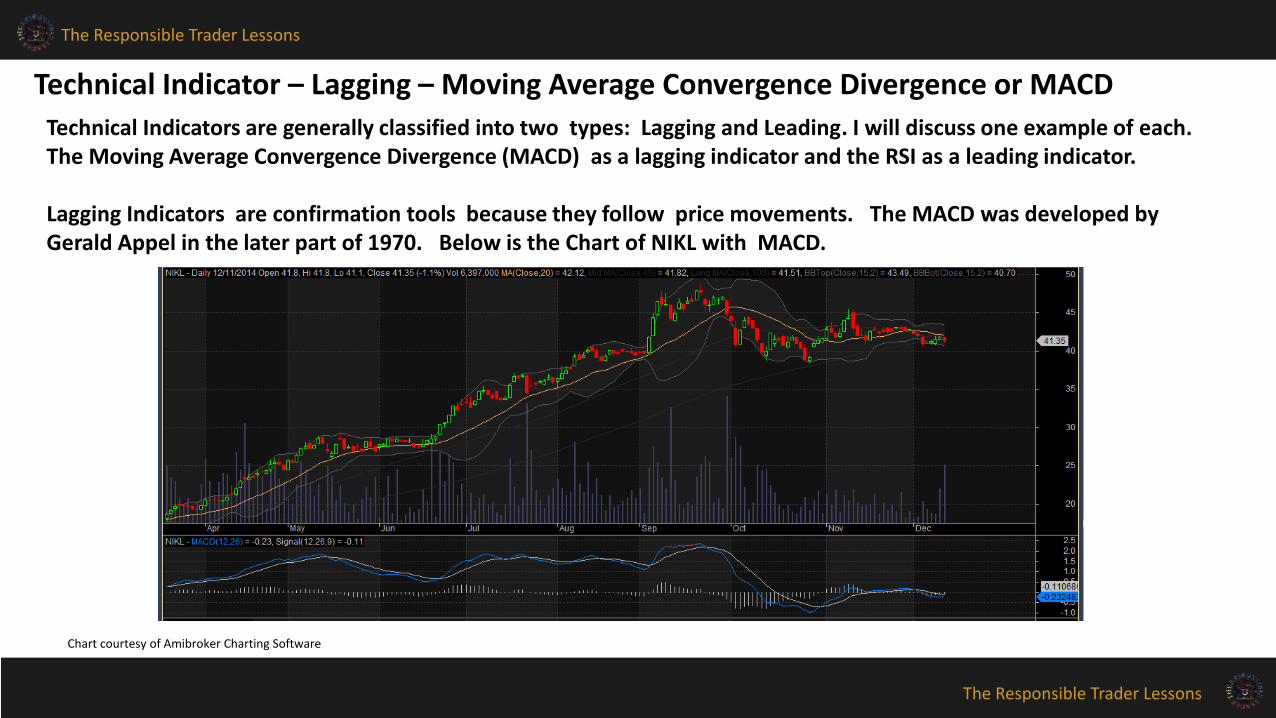
Technical Indicators are generally classified into two types: Lagging and Leading. I will discuss one example of each.The Moving Average Convergence Divergence (MACD) as a lagging indicator and the RSI as a leading indicator.
Lagging Indicators are confirmation tools because they follow price movements. The MACD was developed by Gerald Appel in the later part of 1970. Below is the Chart of NIKL with MACD.
Technical Indicator – Lagging – Moving Average Convergence Divergence or MACD
Chart courtesy of Amibroker Charting Software
The Responsible Trader Lessons
The Responsible Trader Lessons
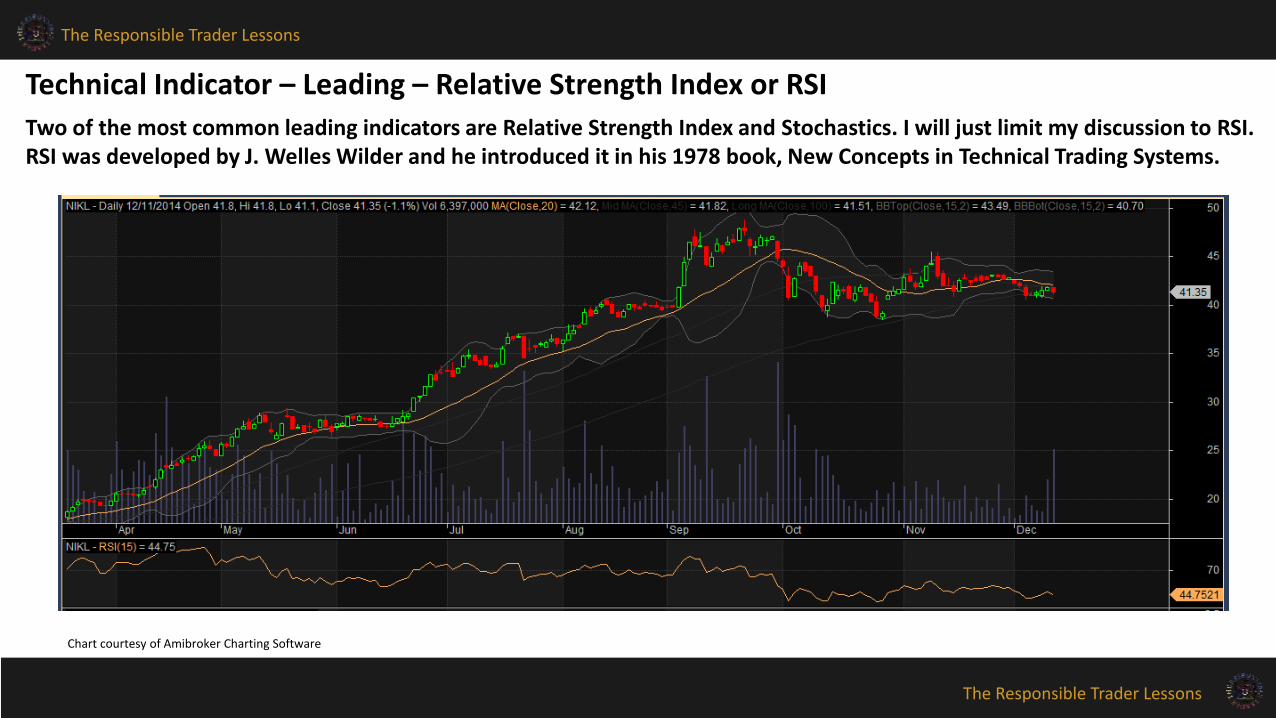
Two of the most common leading indicators are Relative Strength Index and Stochastics. I will just limit my discussion to RSI.RSI was developed by J. Welles Wilder and he introduced it in his 1978 book, New Concepts in Technical Trading Systems.
Technical Indicator – Leading – Relative Strength Index or RSI
Chart courtesy of Amibroker Charting Software

The Responsible Trader Lessons
The Responsible Trader Lessons
Divergence occurs when the oscillator or technical indicator is moving opposite the movement of the price.There are two types of Divergence. Regular and Hidden Divergence. Under both are Bullish and Bearish types.
1. Regular Divergencea. Bullish. A regular bullish divergence usually occurs when the price is making lower lows (LL), but theoscillator is making higher lows (HL). A regular bullish divergence is used as a possible sign for a trendreversal. This usually occurs at the end of a downtrend.
b. Bearish. A regular bearish divergence usually occurs when the price is making a higher high (HH),but the oscillator is making lower highs. (LH). A regular bearish divergence is used as a possible signfor a trend reversal. This usually occurs at the end of an uptrend.
Two types of Divergence
The Responsible Trader Lessons
The Responsible Trader Lessons
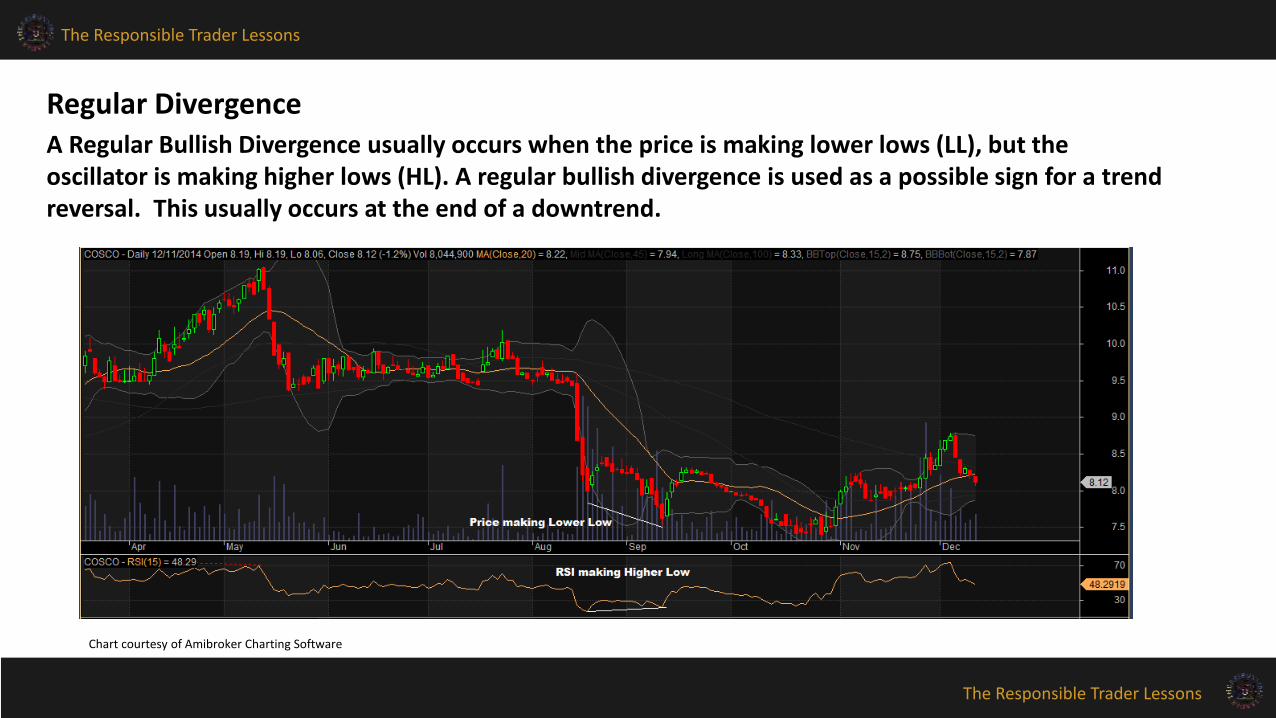
A Regular Bullish Divergence usually occurs when the price is making lower lows (LL), but theoscillator is making higher lows (HL). A regular bullish divergence is used as a possible sign for a trend reversal. This usually occurs at the end of a downtrend.
Regular Divergence
Chart courtesy of Amibroker Charting Software

The Responsible Trader Lessons
The Responsible Trader Lessons
A Regular Bearish Divergence usually occurs when the price is making a higher high (HH), butthe oscillator is making lower highs. (LH). A regular bearish divergence is used as a possible sign for a trend reversal. This usually occurs at the end of an uptrend.
Regular Divergence
Chart courtesy of Amibroker Charting Software
The Responsible Trader Lessons
The Responsible Trader Lessons
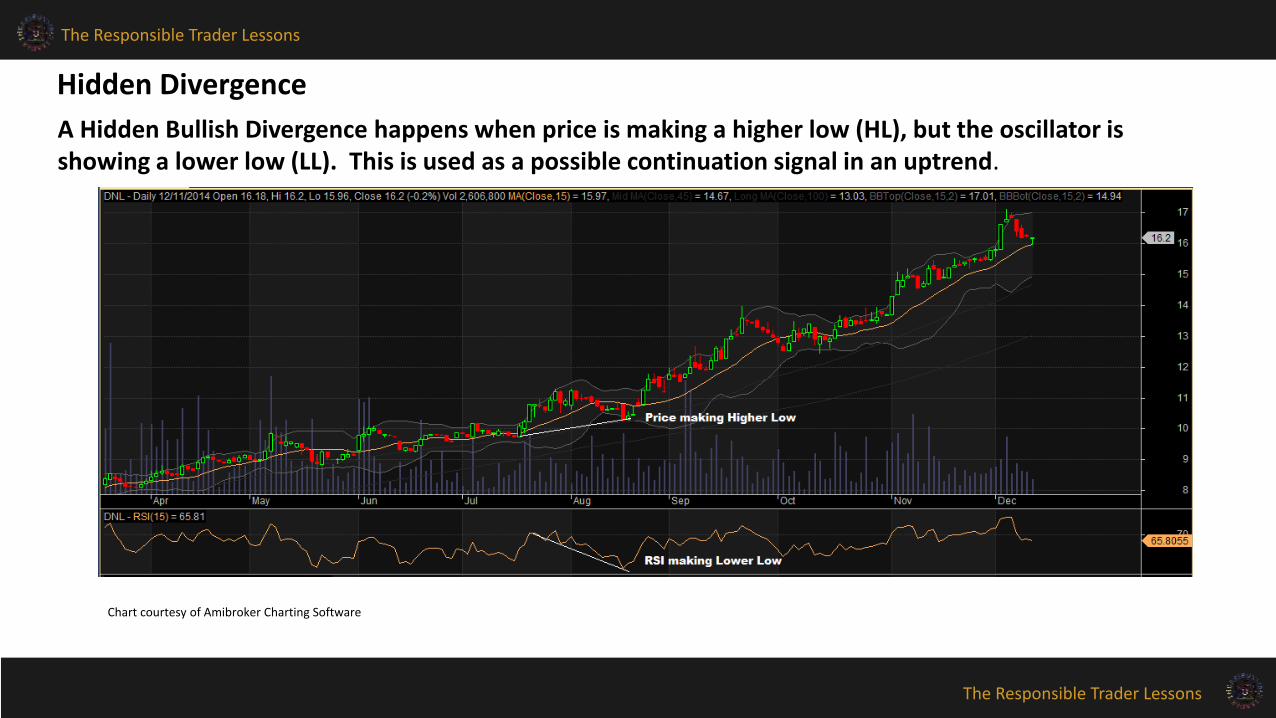
A Hidden Bullish Divergence happens when price is making a higher low (HL), but the oscillator is showing a lower low (LL). This is used as a possible continuation signal in an uptrend.
Hidden Divergence
Chart courtesy of Amibroker Charting Software

The Responsible Trader Lessons
The Responsible Trader Lessons
A Hidden Bearish Divergence happens price makes a lower high (LH), but the oscillator is making a higher high (HH). This is used as a possible continuation signal in a downtrend.
Hidden Divergence
Chart courtesy of Amibroker Charting Software
The Responsible Trader Lessons
The Responsible Trader Lessons
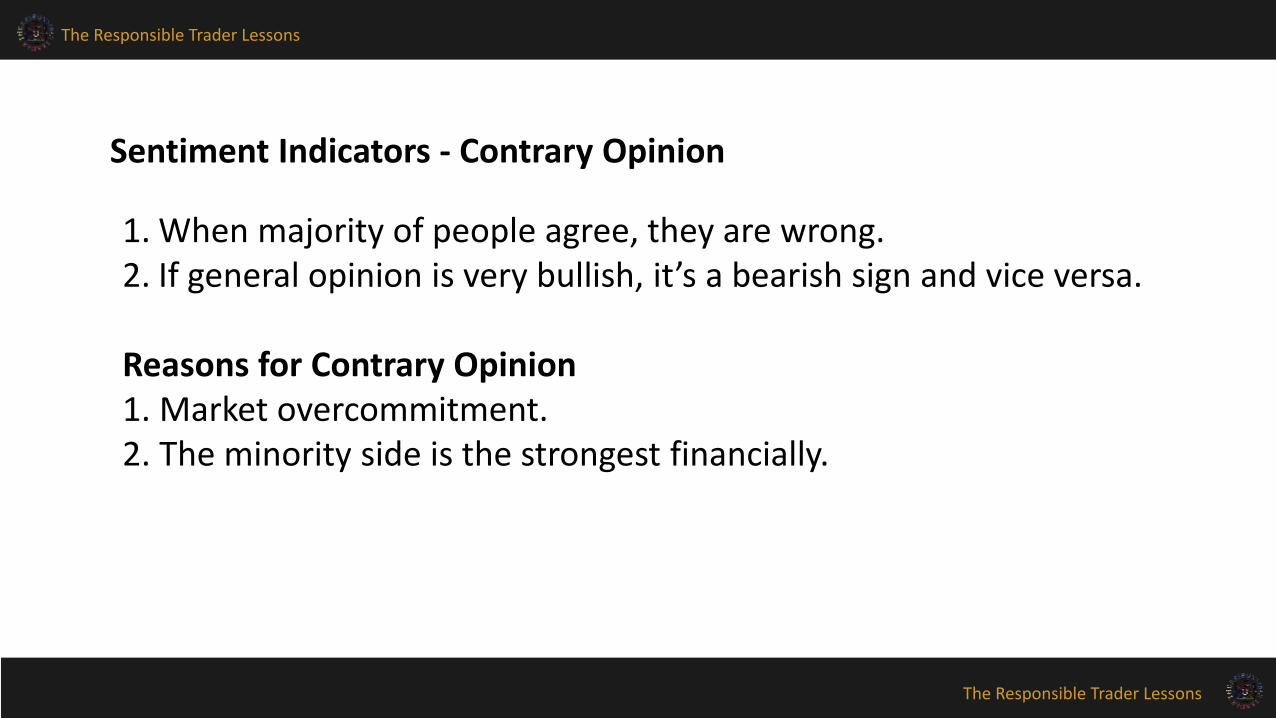
1. When majority of people agree, they are wrong.2. If general opinion is very bullish, it’s a bearish sign and vice versa.
Reasons for Contrary Opinion1. Market overcommitment.2. The minority side is the strongest financially.
Sentiment Indicators - Contrary Opinion

The Responsible Trader Lessons
The Responsible Trader Lessons
Summary
1. Trends are better understood as stages in a Cycle. Based on this markets can be classified into two trending and trading markets.
2. In trending markets, Basic Technical Analysis is sufficient. In trading markets, we need to use Oscillators or Technical Indicators to generate buy or sell signals.
3. Oscillators show extreme conditions in the market – the price has gone too far, too fast and also show when a trend is losing momentum.
4. The Moving Average Convergence Divergence (MACD) is a lagging indicator and is used as a momentum indicator.
5. The Relative Strength Index (RSI) is a leading indicator used to determine overbought and oversold conditions and can also be used for divergences.
6. Contrary opinion has a psychological basis, and should be considered at market extremes.
The Responsible Trader Lessons
The Responsible Trader Lessons
This will be my last sharing of the MCTA Lessons for the year. I will resume sharing the rest of the Lessons starting January next year.
Let us all take a Holiday break and spend quality time with our family. When you have the time, please go over the lessons again and start applying them in your present open positions. Pick one stock in particular and review how it would have improved your trading results if you applied everything we learned. If you want to give me a feedback, you may send an email to:
The Responsible Trader email: [email protected].
If I like your story, I might include it as part of the book I am writing under the Chapter – In a Trader’s Shoes. If your story gets included in my book, you will receive a surprise gift from me.
I wish you the best in your learning journey and good luck on all your trades.
Advanced Merry Christmas and a Happy New Year to you and your family too.


