INTER-COMPARISON OF TOTAL COLOMN OZONE OBTAINED BY IASI/MetOp OBSERVATION WITH GROUND BASED AND SATELLITE OBSERVATION IN THE SOUTHERN TROPIC AND SUBTROPIC Mohamed Toihir ABDOULWAHAB PhD student 2 nd year Laboratoire de l’Atmosphère et des Cyclones (LACy ) UMR 8105 , Université de la Réunion, La Reunion France School of Chemistry and Physics , Physique department , University of KwaZulu Natal , Durban South Africa Title of thesis : Variability and transport of stratospheric ozone over Southern Africa and Indian Ocean Supervisor : Prof H. Bencherif Co-supervisor : Prof V. Sivakumar
Transcript
INTER-COMPARISON OF TOTAL COLOMN OZONE OBTAINEDBY IASI/MetOp OBSERVATION WITH GROUND BASED ANDSATELLITE OBSERVATION IN THE SOUTHERN TROPIC AND
SUBTROPIC
Mohamed Toihir ABDOULWAHABPhD student 2nd year
Laboratoire de l’Atmosphère et des Cyclones (LACy ) UMR 8105 , Université de la Réunion, La Reunion FranceSchool of Chemistry and Physics , Physique department , University of KwaZulu Natal , Durban South Africa
Title of thesis : Variability and transport of stratospheric ozone over Southern Africa and Indian Ocean
Supervisor : Prof H. Bencherif Co-supervisor : Prof V. Sivakumar
Variation of Ozone concentration depends:- Ozone Depleting Substance ( CxFyClz , CxFyBr, CxHxClz, …)- Green house gases ( CH4 , CO2 , CO … )- natural variability and anthropogenic activities
Ozone formation:sunlight reaction especially in the tropic
- Ozone hole discovery 1985 by Farmanozone is under high surveillance- Montreal protocol on substances thatdeplete the ozone layer 1987, we arewaiting for an increase of Ozone this lasttime !INTRODUCTION
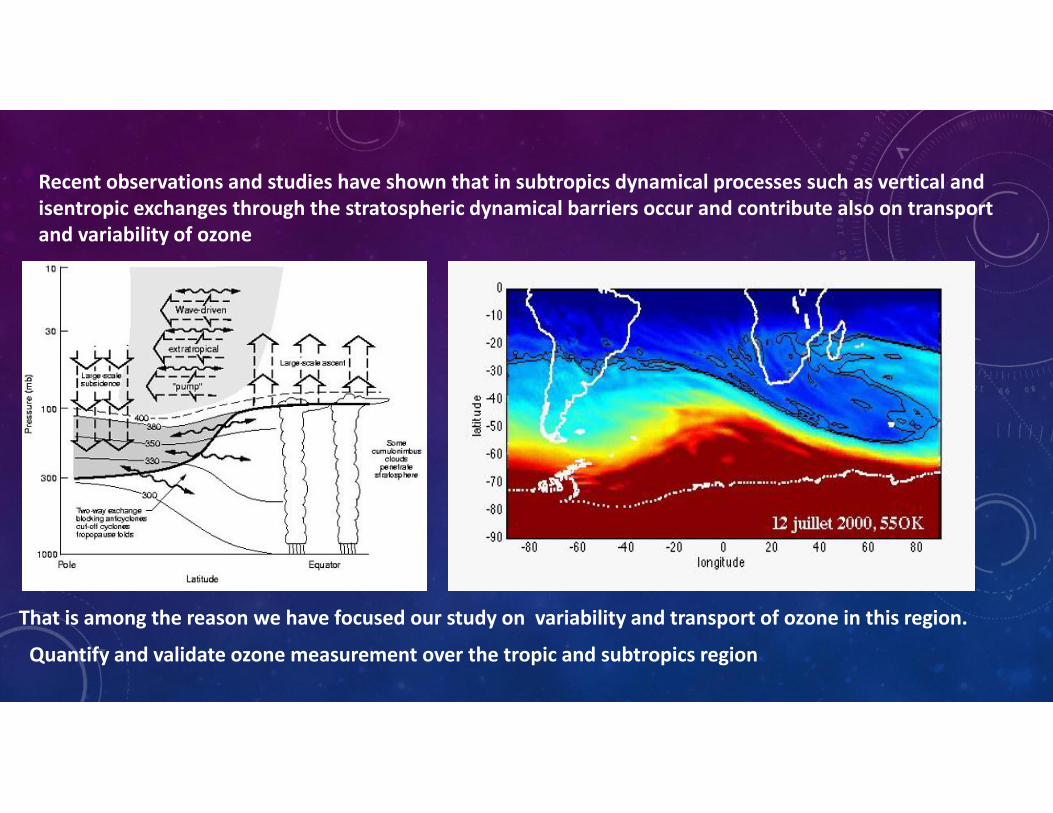
Recent observations and studies have shown that in subtropics dynamical processes such as vertical andisentropic exchanges through the stratospheric dynamical barriers occur and contribute also on transportand variability of ozone
That is among the reason we have focused our study on variability and transport of ozone in this region.
Quantify and validate ozone measurement over the tropic and subtropics region
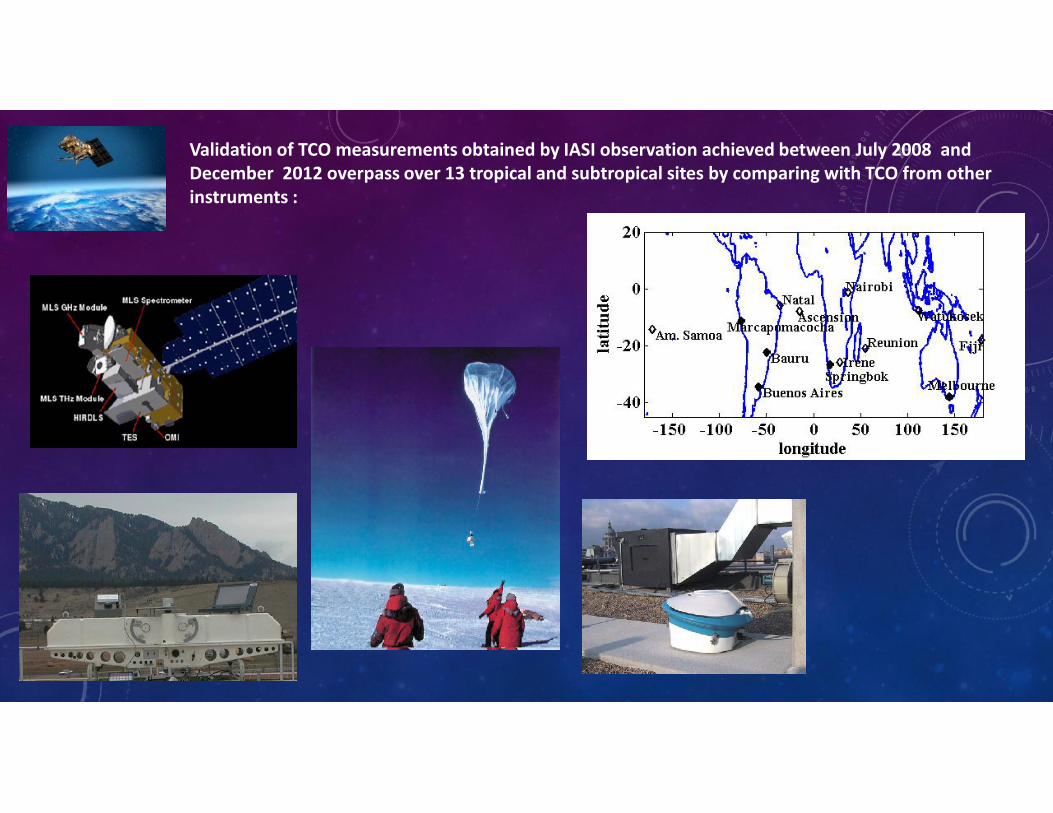
Validation of TCO measurements obtained by IASI observation achieved between July 2008 andDecember 2012 overpass over 13 tropical and subtropical sites by comparing with TCO from otherinstruments :
INSTRUMENTS
What is the Infrared Atmospheric Sounding interferometerIASI instrument ?
IASI is a nadir Fourier Transform spectrometer onboardMetOP launched in October 2006 designed to measurethe spectrum emitted by the Earth Atmosphere systemwith a spectral resolution between 0.3 and 0.5cm-1 inthe spectral range from 645 to 2760 cm-1
Characteristics :
- Angle of view : nadir viewing with an angle of 48.3°- swath-width around 2200 km- field-of view : (50 km×50 km ) composed by a matrix of
2 ×2 circular pixels, with 12 km diameter- observation: twice per day .
Ozone information is retrieved from the 9.6µmabsorption band; here the instrumental radiometricnoise is evaluate to be better than 0.2K at 280K
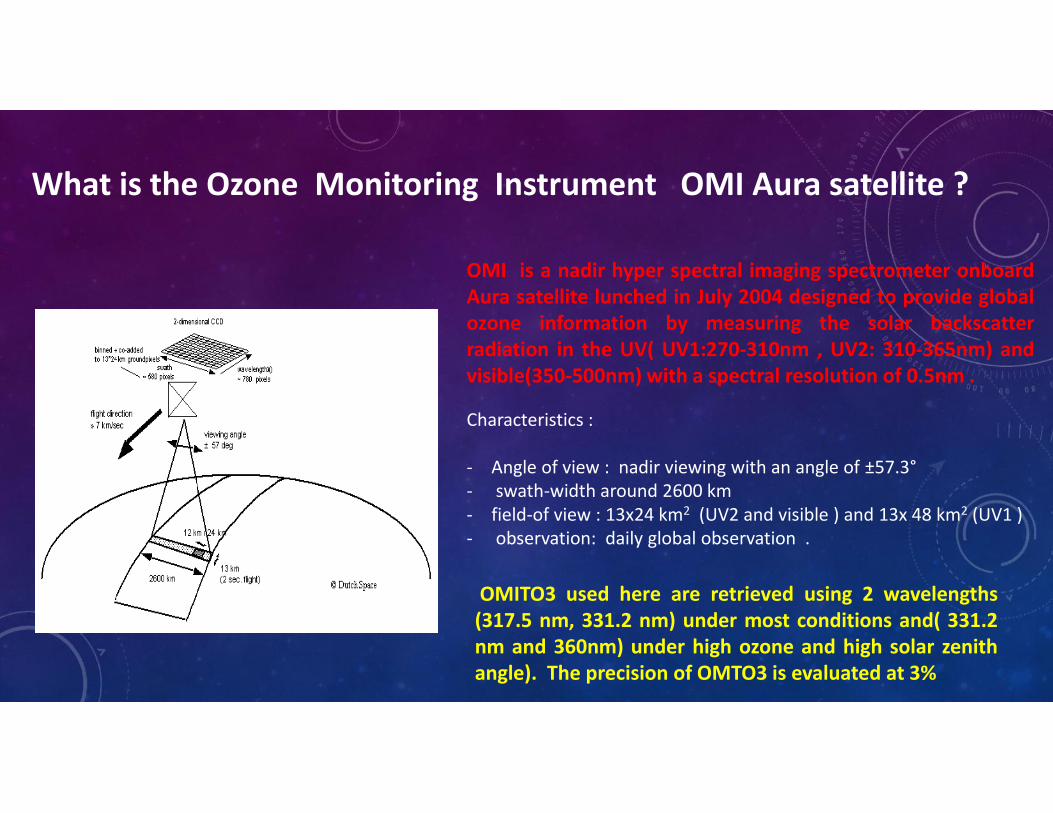
What is the Ozone Monitoring Instrument OMI Aura satellite ?
OMI is a nadir hyper spectral imaging spectrometer onboardAura satellite lunched in July 2004 designed to provide globalozone information by measuring the solar backscatterradiation in the UV( UV1:270-310nm , UV2: 310-365nm) andvisible(350-500nm) with a spectral resolution of 0.5nm .
Characteristics :
- Angle of view : nadir viewing with an angle of ±57.3°- swath-width around 2600 km- field-of view : 13x24 km2 (UV2 and visible ) and 13x 48 km2 (UV1 )- observation: daily global observation .
OMITO3 used here are retrieved using 2 wavelengths(317.5 nm, 331.2 nm) under most conditions and( 331.2nm and 360nm) under high ozone and high solar zenithangle). The precision of OMTO3 is evaluated at 3%
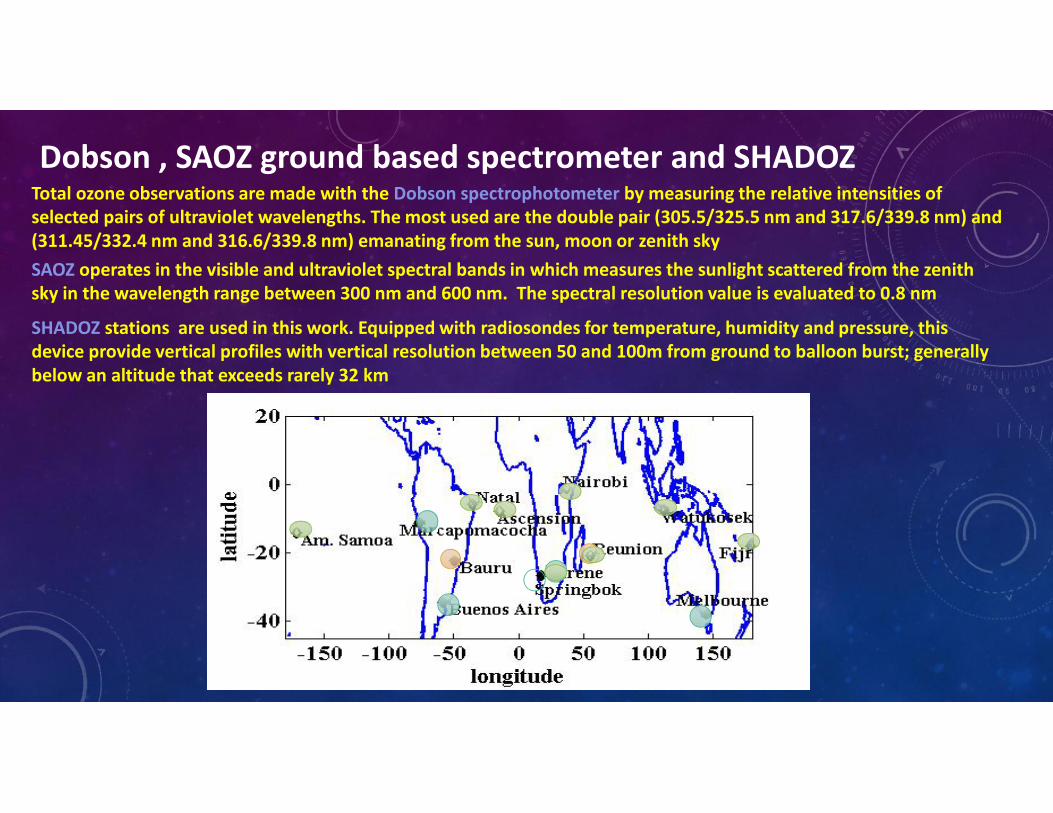
Dobson , SAOZ ground based spectrometer and SHADOZTotal ozone observations are made with the Dobson spectrophotometer by measuring the relative intensities ofselected pairs of ultraviolet wavelengths. The most used are the double pair (305.5/325.5 nm and 317.6/339.8 nm) and(311.45/332.4 nm and 316.6/339.8 nm) emanating from the sun, moon or zenith skySAOZ operates in the visible and ultraviolet spectral bands in which measures the sunlight scattered from the zenithsky in the wavelength range between 300 nm and 600 nm. The spectral resolution value is evaluated to 0.8 nm
SHADOZ stations are used in this work. Equipped with radiosondes for temperature, humidity and pressure, thisdevice provide vertical profiles with vertical resolution between 50 and 100m from ground to balloon burst; generallybelow an altitude that exceeds rarely 32 km
Only data from January 2008 to December 2012 have used for this inter-comparison study
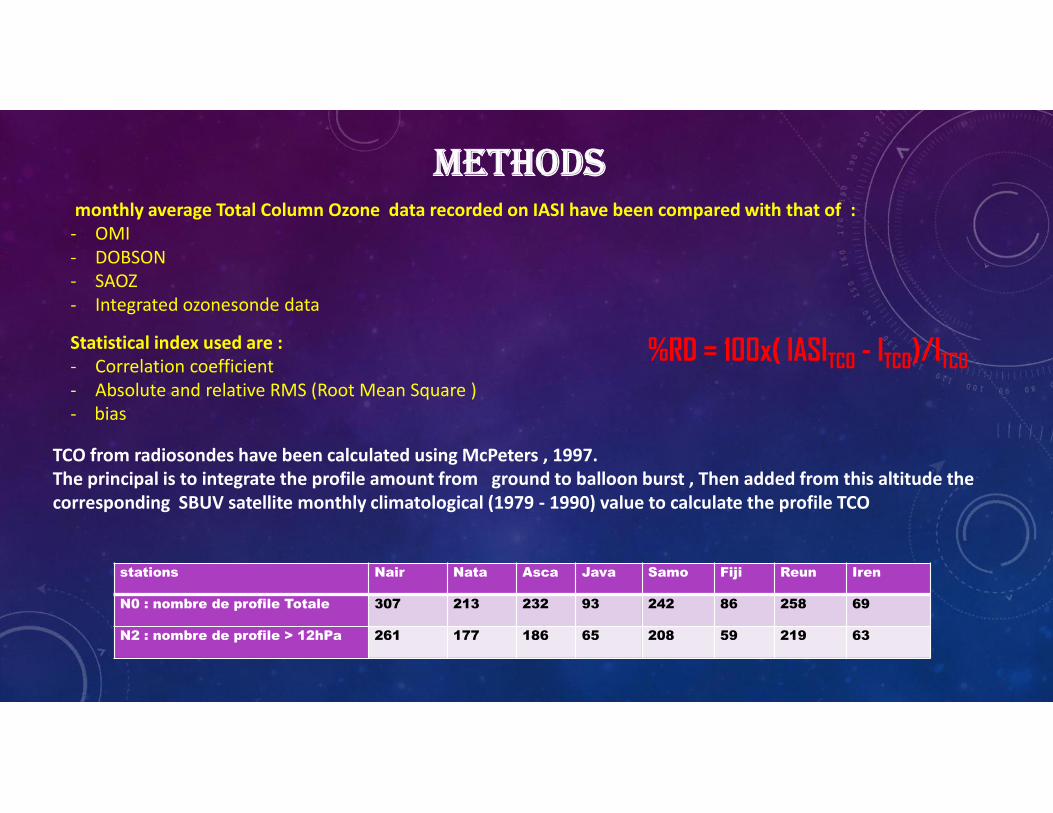
METHODSmonthly average Total Column Ozone data recorded on IASI have been compared with that of :- OMI- DOBSON- SAOZ- Integrated ozonesonde data
Statistical index used are :- Correlation coefficient- Absolute and relative RMS (Root Mean Square )- bias
%RD = 100x( IASITCO - ITCO)/ITCO
TCO from radiosondes have been calculated using McPeters , 1997.The principal is to integrate the profile amount from ground to balloon burst , Then added from this altitude thecorresponding SBUV satellite monthly climatological (1979 - 1990) value to calculate the profile TCO
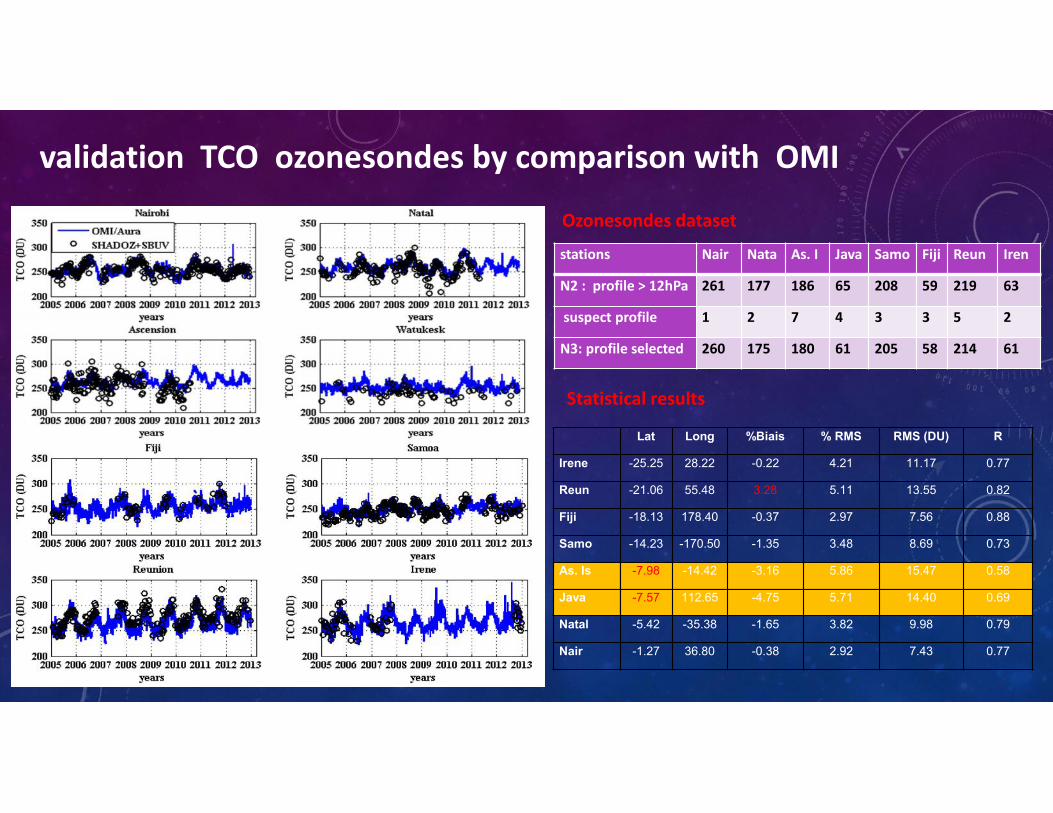
stations Nair Nata Asca Java Samo Fiji Reun Iren
N0 : nombre de profile Totale 307 213 232 93 242 86 258 69
N2 : nombre de profile > 12hPa 261 177 186 65 208 59 219 63
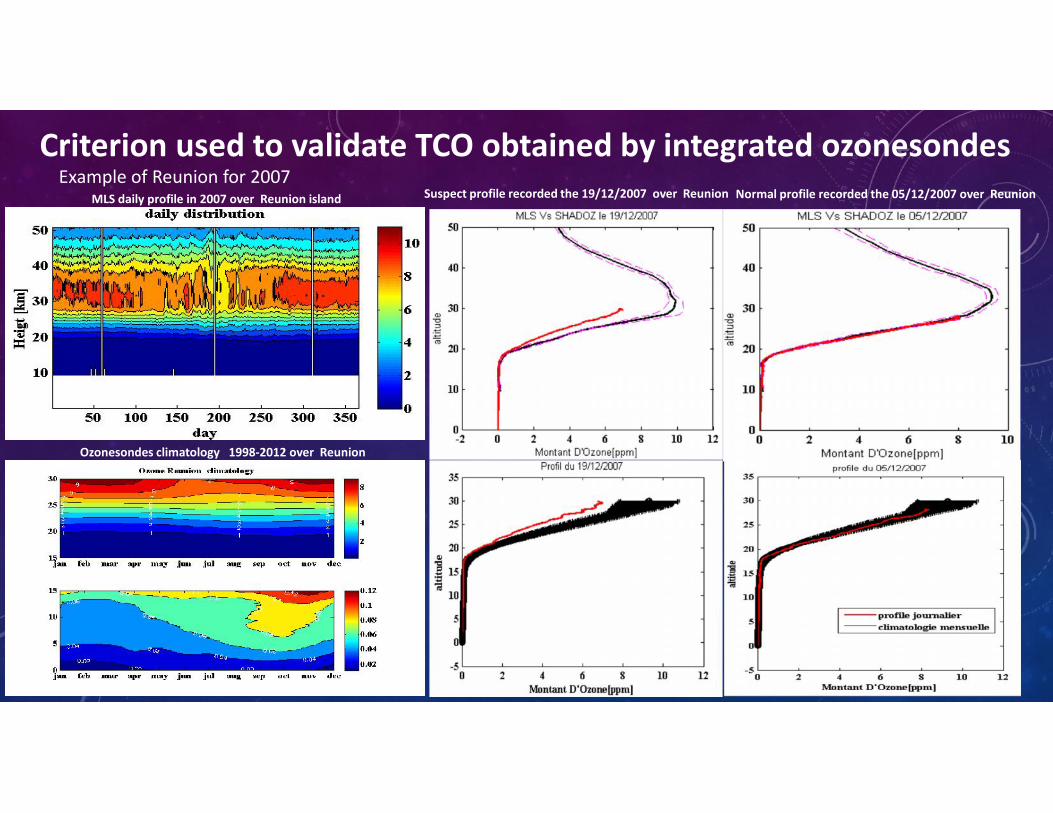
Criterion used to validate TCO obtained by integrated ozonesondes
• upward trend in autumn and a downward trend in thespring period especially between June 2008 and July 2010
• significant upward which can reach occasionally 9% and14% in the tropical and subtropical sites respectively
• low downward spring which reach rarely 4%• oscillation reducing within ±5% and ±4% with Dobson and
OMI respectively after July 201O
Seasonal cycle of bias
SUMMARY
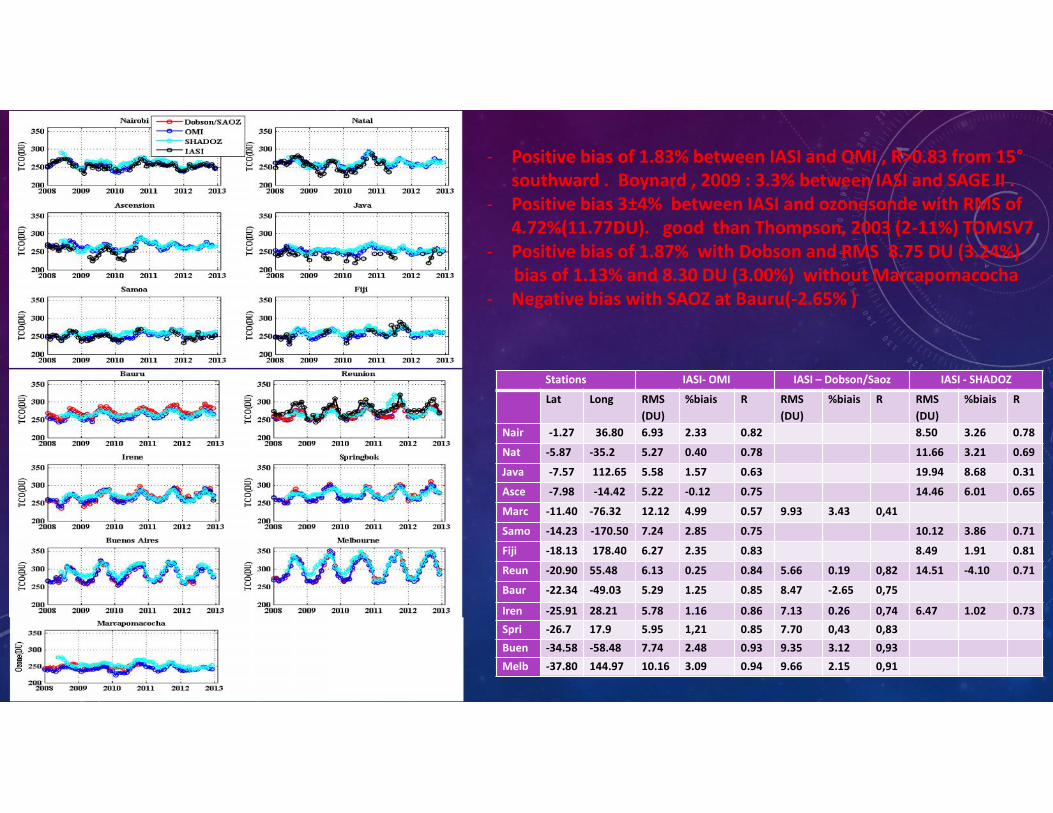
1- Good agreement is found between IASI and the other instruments
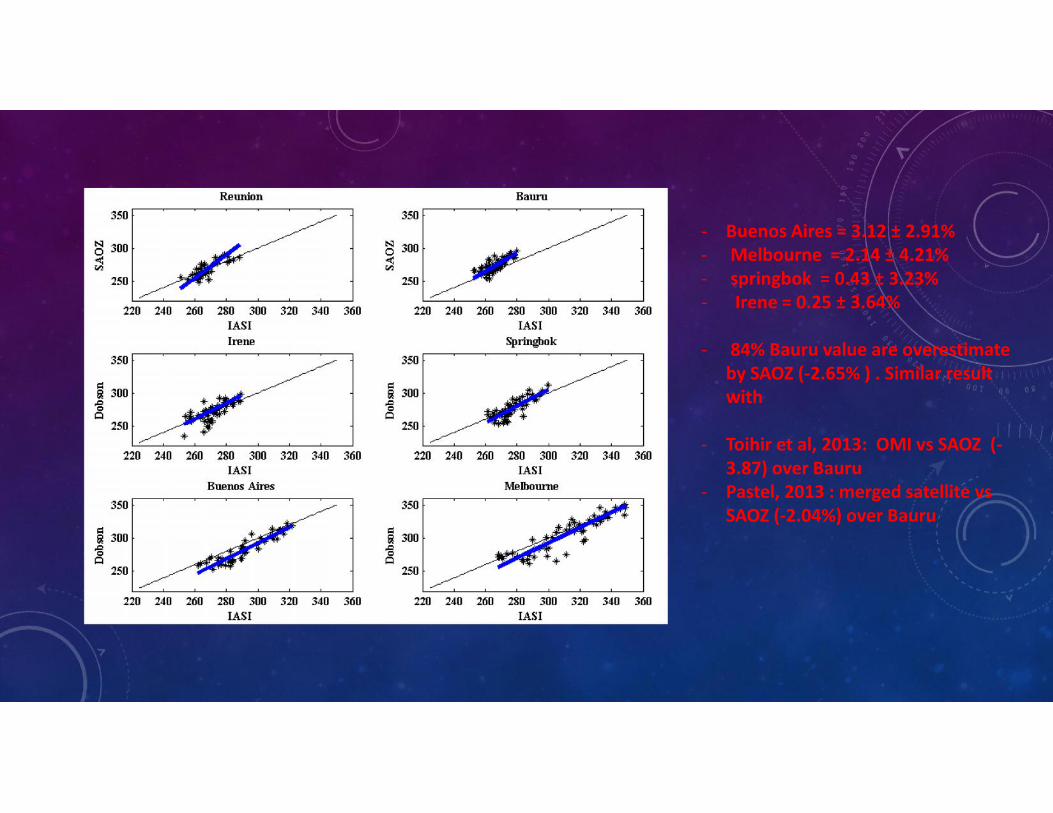
2- IASI slightly overestimate ozone except over Bauru and Reunion where SAOZ and SHADOZ TCO are high than IASI
3- IASI bias is lower than 2% with OMI , Dobson and SAOZ but less than 5% with ozonesondes
4- The best agreement is found over the subtropical region especially from 15° southward5- High TCO variability is observed over the subtropics but anyway low on IASI than the other instruments6- Correlation high than 0.96 is observed between IASI and the other instrument on latitudinal distribution
7- Seasonal dependence on IASI is observed with downward and upward trend in the spring and autumn respectively
8- From July 2010, the obtained RD reveal IASI low oscillation within ±4% and ±5% with respect to OMI andDobson respectively