This article was downloaded by: [Texas A&M University Libraries] On: 09 January 2014, At: 14:23 Publisher: Taylor & Francis Informa Ltd Registered in England and Wales Registered Number: 1072954 Registered office: Mortimer House, 37-41 Mortimer Street, London W1T 3JH, UK Critical Reviews in Food Science and Nutrition Publication details, including instructions for authors and subscription information: http://www.tandfonline.com/loi/bfsn20 Moisture and Shelf Life in Sugar Confections R. Ergun a , R. Lietha a & R. W. Hartel a a Department of Food Science , University of Wisconsin , Madison, WI, USA Published online: 28 Jan 2010. To cite this article: R. Ergun , R. Lietha & R. W. Hartel (2010) Moisture and Shelf Life in Sugar Confections, Critical Reviews in Food Science and Nutrition, 50:2, 162-192, DOI: 10.1080/10408390802248833 To link to this article: http://dx.doi.org/10.1080/10408390802248833 PLEASE SCROLL DOWN FOR ARTICLE Taylor & Francis makes every effort to ensure the accuracy of all the information (the “Content”) contained in the publications on our platform. However, Taylor & Francis, our agents, and our licensors make no representations or warranties whatsoever as to the accuracy, completeness, or suitability for any purpose of the Content. Any opinions and views expressed in this publication are the opinions and views of the authors, and are not the views of or endorsed by Taylor & Francis. The accuracy of the Content should not be relied upon and should be independently verified with primary sources of information. Taylor and Francis shall not be liable for any losses, actions, claims, proceedings, demands, costs, expenses, damages, and other liabilities whatsoever or howsoever caused arising directly or indirectly in connection with, in relation to or arising out of the use of the Content. This article may be used for research, teaching, and private study purposes. Any substantial or systematic reproduction, redistribution, reselling, loan, sub-licensing, systematic supply, or distribution in any form to anyone is expressly forbidden. Terms & Conditions of access and use can be found at http:// www.tandfonline.com/page/terms-and-conditions
Transcript
This article was downloaded by: [Texas A&M University Libraries]On: 09 January 2014, At: 14:23Publisher: Taylor & FrancisInforma Ltd Registered in England and Wales Registered Number: 1072954 Registered office: Mortimer House,37-41 Mortimer Street, London W1T 3JH, UK
Critical Reviews in Food Science and NutritionPublication details, including instructions for authors and subscription information:http://www.tandfonline.com/loi/bfsn20
Moisture and Shelf Life in Sugar ConfectionsR. Ergun a , R. Lietha a & R. W. Hartel aa Department of Food Science , University of Wisconsin , Madison, WI, USAPublished online: 28 Jan 2010.
To cite this article: R. Ergun , R. Lietha & R. W. Hartel (2010) Moisture and Shelf Life in Sugar Confections, Critical Reviews inFood Science and Nutrition, 50:2, 162-192, DOI: 10.1080/10408390802248833
To link to this article: http://dx.doi.org/10.1080/10408390802248833
PLEASE SCROLL DOWN FOR ARTICLE
Taylor & Francis makes every effort to ensure the accuracy of all the information (the “Content”) containedin the publications on our platform. However, Taylor & Francis, our agents, and our licensors make norepresentations or warranties whatsoever as to the accuracy, completeness, or suitability for any purpose of theContent. Any opinions and views expressed in this publication are the opinions and views of the authors, andare not the views of or endorsed by Taylor & Francis. The accuracy of the Content should not be relied upon andshould be independently verified with primary sources of information. Taylor and Francis shall not be liable forany losses, actions, claims, proceedings, demands, costs, expenses, damages, and other liabilities whatsoeveror howsoever caused arising directly or indirectly in connection with, in relation to or arising out of the use ofthe Content.
This article may be used for research, teaching, and private study purposes. Any substantial or systematicreproduction, redistribution, reselling, loan, sub-licensing, systematic supply, or distribution in anyform to anyone is expressly forbidden. Terms & Conditions of access and use can be found at http://www.tandfonline.com/page/terms-and-conditions
R. ERGUN, R. LIETHA, and R. W. HARTELDepartment of Food Science, University of Wisconsin, Madison, WI, USA
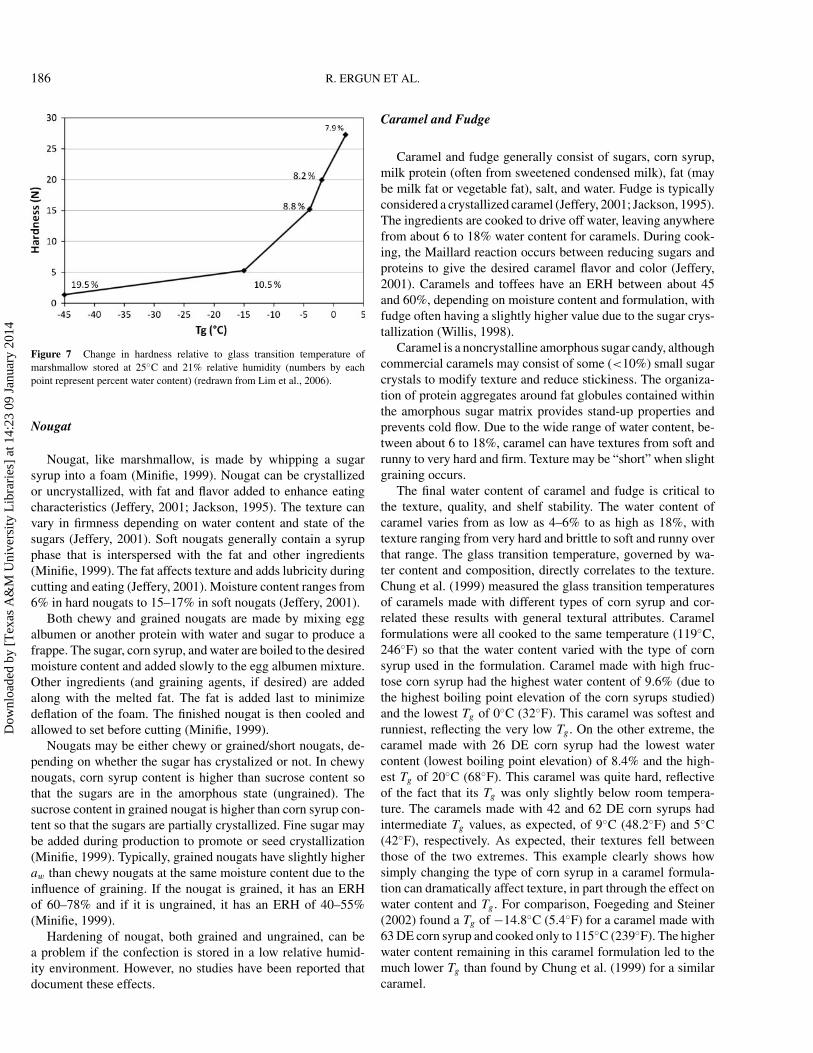
From hardening of marshmallow to graining of hard candies, moisture plays a critical role in determining the quality andshelf life of sugar-based confections. Water is important during the manufacturing of confections, is an important factor ingoverning texture, and is often the limiting parameter during storage that controls shelf life. Thus, an understanding of waterrelations in confections is critical to controlling quality.
Water content, which is controlled during candy manufacturing through an understanding of boiling point elevation, isone of the most important parameters that governs the texture of candies. For example, the texture of caramel progressesfrom soft and runny to hard and brittle as the moisture content decreases. However, knowledge of water content by itself isinsufficient to controlling stability and shelf life. Understanding water activity, or the ratio of vapor pressures, is necessaryto control shelf life.
A difference in water activity, either between candy and air or between two domains within the candy, is the driving forcefor moisture migration in confections. When the difference in water activity is large, moisture migration is rapid, althoughthe rate of moisture migration depends on the nature of resistances to water diffusion. Barrier packaging films protect thecandy from air whereas edible films inhibit moisture migration between different moisture domains within a confection.
More recently, the concept of glass transition, or the polymer science approach, has supplemented water activity asa critical parameter related to candy stability. Confections with low moisture content, such as hard candy, cotton candy,and some caramels and toffees, may contain sugars in the amorphous or glassy state. As long as these products remainbelow their glass transition temperature, they remain stable for very long times. However, certain glassy sugars tend to behygroscopic, rapidly picking up moisture from the air, which causes significant changes that lead to the end of shelf life.These products need to be protected from moisture uptake during storage.
This review summarizes the concepts of water content, water activity, and glass transition and documents their importanceto quality and shelf life of confections.
Keywords Moisture, confections, migration, water activity, packaging, water barriers
INTRODUCTION
“Water is life.”
Felix Franks, 2000
Water is the only inorganic liquid that occurs naturally onearth. It is also the only chemical compound commonly foundin solid, liquid, and vapor forms. Water has a higher meltingpoint, boiling point, and heat of vaporization than most othercommon solvents with similar molecular weight and atomiccomposition. It also has relatively large values for surface ten-sion, permittivity, heat capacity, phase transition latent heat, andthermal conductivity (Table 1).
Address correspondence to: Richard Hartel, 1605 Linden Drive, De-partment of Food Science, UW-Madison, Madison, WI 53705. E-mail:[email protected]
This unusual macroscopic behavior can be explained by wa-ter’s molecular structure (Franks, 2000). The composition ofwater (two parts hydrogen to one part oxygen) was discoveredby Henry Cavendish (1731–1810) in about 1781. He reportedhis findings in terms of phlogiston (later the gas he made wasproven to be hydrogen) and dephlogisticated air (later this wasproven to be oxygen). Since then, countless studies have beendone to clarify the structure of water and interactions betweenwater molecules. For a review of the development of the struc-ture of water, see Wallqvist and Mountain (1999).
Each hydrogen atom of a water molecule shares an electronpair with the oxygen atom. The outer electron orbitals of theoxygen atom have a hydrogen atom at each of two cornersbound with covalent bonds and unshared electron pairs at theother two corners. The O–H bond length is 0.0958 nm andthe H–O–H bond angle is 104.27 (Franks, 2000), very close to
162
Dow
nloa
ded
by [
Tex
as A
&M
Uni
vers
ity L
ibra
ries
] at
14:
23 0
9 Ja
nuar
y 20
14
MOISTURE AND SHELF LIFE IN SUGAR CONFECTIONS 163
Table 1 Comparison of properties of low molecular weight compounds
Compound Molecular weight Boiling point (◦C) @760 mm. Hg Surface tension (Dynes/cm) @ 20◦C
the 109.5 of a perfect tetrahedron (Hasted, 1972). Sharing theelectron between H and O is unequal because the oxygen nucleusattracts electrons more strongly than does the hydrogen nucleusand becomes more electronegative. This unequal sharing causestwo electric dipoles in the water molecule; the oxygen atombears a partial negative charge (2δ–) and each hydrogen a partialpositive charge (δ+) (Martin and Zipse, 2005). As a result, thereis an electrostatic attraction between the oxygen atom of onewater molecule and the hydrogen of another, called a hydrogenbond.
The nearly tetrahedral arrangement of the orbitals about theoxygen atom allows each water molecule to form hydrogenbonds with as many as four neighboring water molecules. How-ever, water molecules are disorganized and in continuous mo-tion, so that each water molecule forms hydrogen bonds with anaverage of only 3.4 other water molecules (Fennema, 1996). Theclustering ability of water molecules is apparently quite temper-ature sensitive (Starzak and Mathlouthi, 2003), with tetramersand pentamers suggested to dominate at room temperature, andmonomers and dimers increasing as temperature increased.
Hydrogen bonds are stronger than van der Waals interac-tions, although they are weaker than covalent bonds. The hy-drogen bonds in liquid water have a bond dissociation energy(the energy required to break a bond) of about 5 kcal/mole,compared with 0.3 kcal/mole for van der Waals interactions and100 kcal/mole for the covalent C–C bond (Stillinger, 1980).However, in addition to water’s large dipole moment, its abilityto engage in multiple hydrogen bondings on a three-dimensionalbasis can explain its large intermolecular attractive forces(Nelson and Cox, 2000).
Understanding Water in Confections and Foods
Water is one of the most important components of confec-tions, and of most foods. The nature of water bonding with foodcomponents and its interaction with the surrounding atmosphereaffects the physical or textural characteristics of the food prod-uct as well as the food’s shelf stability. Our understanding of thebehavior of water in confections (and all foods) has grown overthe years, progressing from the use of water content to wateractivity and more recently, to the principles of water mobility(and glass transitions).
In sugar-based confections, the water content is generallygoverned by the boiling point relationship of the sugars present
in the formulation. The final water content has a significantimpact on texture and shelf life, with lower moisture contentleading to harder confections that typically have longer shelflife. However, water content by itself is not sufficient to com-pletely characterize candy quality and shelf life. Water activity,or the relative vapor pressure, of the confection is an importantparameter often used to describe microbial stability, texture, andwater migration during storage.
The relative vapor pressure was first defined and used as anindicator of stability of foods by Grover (1947). Relative vaporpressure, h, was defined as the ratio of the vapor pressure of thematerial (P) to the vapor pressure of pure water (Pt ).
h[%] =(
P
Pt
)100 (1)
Grover (1947) claimed that one can determine whether a foodeither gains or loses moisture based on this relative vapor pres-sure.
In the 1950s, Scott (1957) introduced the term “water ac-tivity” as a measure of water “availability.” He claimed that“water availability,” not moisture content alone, determines thestability of foods. Water activity, aw, which in foods is oftengiven as the ratio of the vapor pressure of water above the food,pw, to the vapor pressure of pure water at the same tempera-ture, po
w, indicates the degree to which water is associated withfood components (not available to escape from the surface) andconsequently, its availability to act as a solvent and contributein physical, chemical, and microbiological processes. Severalphysical principles play a role in understanding the “states” ofwater in foods, including the colligative effect, capillary forces,and surface interactions (Lilley, 1994).
Water availability in foods depends on the type of solutesand their concentrations, and affects physical properties such asfreezing point, boiling point, vapor pressure (water activity), anddensity (Kuprianoff, 1958; Gur Arieh et al., 1967). These prop-erties represent the colligative effect, where solute moleculesreduce the chemical potential and escaping tendency (fugacity)of water molecules (Levine and Slade, 1988; Bell and Labuza1984).
Furthermore, foods may contain pores or capillaries in whichwater can exist (Blustein and Labuza, 1972). The change in hy-drogen bonding between water molecules as a result of surfacecurvature affects the escaping tendency and chemical poten-tial of water (Bell and Labuza, 1984). The direct interaction
Dow
nloa
ded
by [
Tex
as A
&M
Uni
vers
ity L
ibra
ries
] at
14:
23 0
9 Ja
nuar
y 20
14
164 R. ERGUN ET AL.
with other chemical groups on molecules through dipole-dipoleforces, ionic bonds, dipolar-ionic interactions, van der Waalsforces, and hydrogen bonding also reduce the escaping tendencyand chemical potential of water (Bell and Labuza, 1984).
In the past, these properties led to characterizing water aseither “free” or “bound” (Shanbhag et al., 1970). Kuprianoff(1958) suggested that measuring the amount of unfreezable wa-ter at sub-freezing temperature was the most accurate way ofmeasuring “bound” water in foods, as did Meryman (1966) ina subsequent study. Sorption behavior (Labuza and Rutman,1969; Berlin et al., 1968), drying rate studies, and NMR studieson the state of water (Shanbhag et al., 1970; Mousseri et al.,1974) correlated very well with the idea that water in foodswas either free or bound (Leung and Steinberg, 1979), lendinggreater credence to this interpretation.
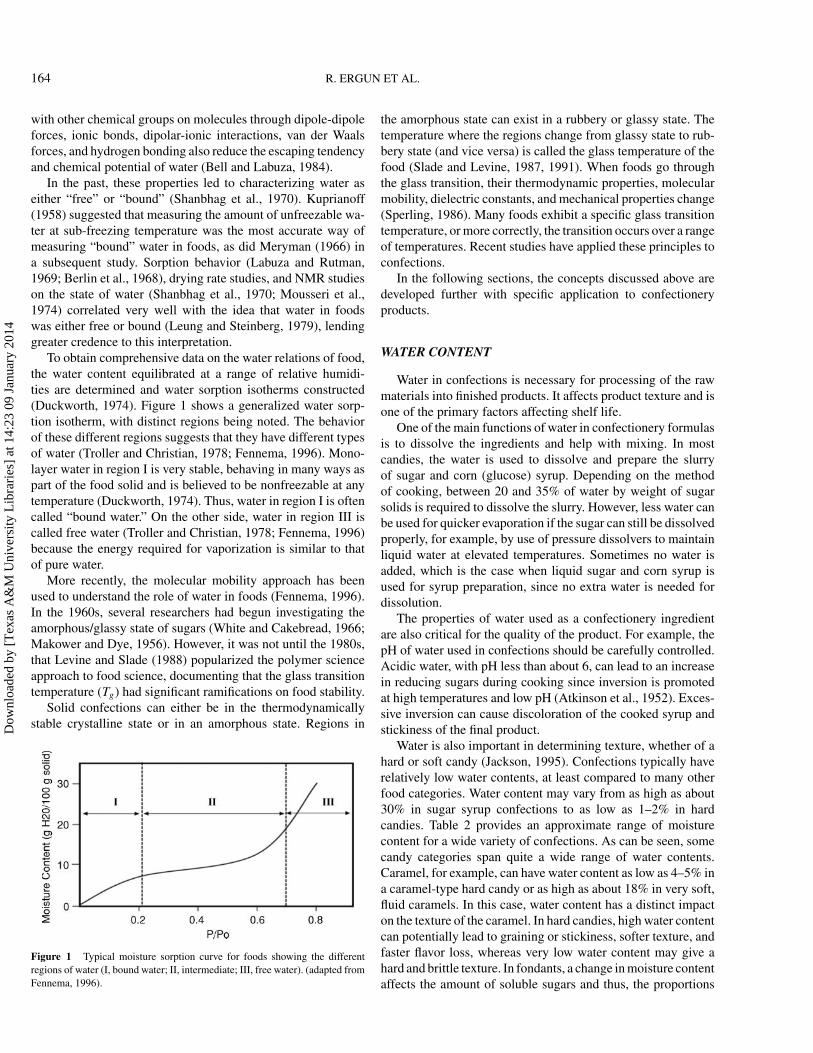
To obtain comprehensive data on the water relations of food,the water content equilibrated at a range of relative humidi-ties are determined and water sorption isotherms constructed(Duckworth, 1974). Figure 1 shows a generalized water sorp-tion isotherm, with distinct regions being noted. The behaviorof these different regions suggests that they have different typesof water (Troller and Christian, 1978; Fennema, 1996). Mono-layer water in region I is very stable, behaving in many ways aspart of the food solid and is believed to be nonfreezable at anytemperature (Duckworth, 1974). Thus, water in region I is oftencalled “bound water.” On the other side, water in region III iscalled free water (Troller and Christian, 1978; Fennema, 1996)because the energy required for vaporization is similar to thatof pure water.
More recently, the molecular mobility approach has beenused to understand the role of water in foods (Fennema, 1996).In the 1960s, several researchers had begun investigating theamorphous/glassy state of sugars (White and Cakebread, 1966;Makower and Dye, 1956). However, it was not until the 1980s,that Levine and Slade (1988) popularized the polymer scienceapproach to food science, documenting that the glass transitiontemperature (Tg) had significant ramifications on food stability.
Solid confections can either be in the thermodynamicallystable crystalline state or in an amorphous state. Regions in
Figure 1 Typical moisture sorption curve for foods showing the differentregions of water (I, bound water; II, intermediate; III, free water). (adapted fromFennema, 1996).
the amorphous state can exist in a rubbery or glassy state. Thetemperature where the regions change from glassy state to rub-bery state (and vice versa) is called the glass temperature of thefood (Slade and Levine, 1987, 1991). When foods go throughthe glass transition, their thermodynamic properties, molecularmobility, dielectric constants, and mechanical properties change(Sperling, 1986). Many foods exhibit a specific glass transitiontemperature, or more correctly, the transition occurs over a rangeof temperatures. Recent studies have applied these principles toconfections.
In the following sections, the concepts discussed above aredeveloped further with specific application to confectioneryproducts.
WATER CONTENT
Water in confections is necessary for processing of the rawmaterials into finished products. It affects product texture and isone of the primary factors affecting shelf life.
One of the main functions of water in confectionery formulasis to dissolve the ingredients and help with mixing. In mostcandies, the water is used to dissolve and prepare the slurryof sugar and corn (glucose) syrup. Depending on the methodof cooking, between 20 and 35% of water by weight of sugarsolids is required to dissolve the slurry. However, less water canbe used for quicker evaporation if the sugar can still be dissolvedproperly, for example, by use of pressure dissolvers to maintainliquid water at elevated temperatures. Sometimes no water isadded, which is the case when liquid sugar and corn syrup isused for syrup preparation, since no extra water is needed fordissolution.
The properties of water used as a confectionery ingredientare also critical for the quality of the product. For example, thepH of water used in confections should be carefully controlled.Acidic water, with pH less than about 6, can lead to an increasein reducing sugars during cooking since inversion is promotedat high temperatures and low pH (Atkinson et al., 1952). Exces-sive inversion can cause discoloration of the cooked syrup andstickiness of the final product.
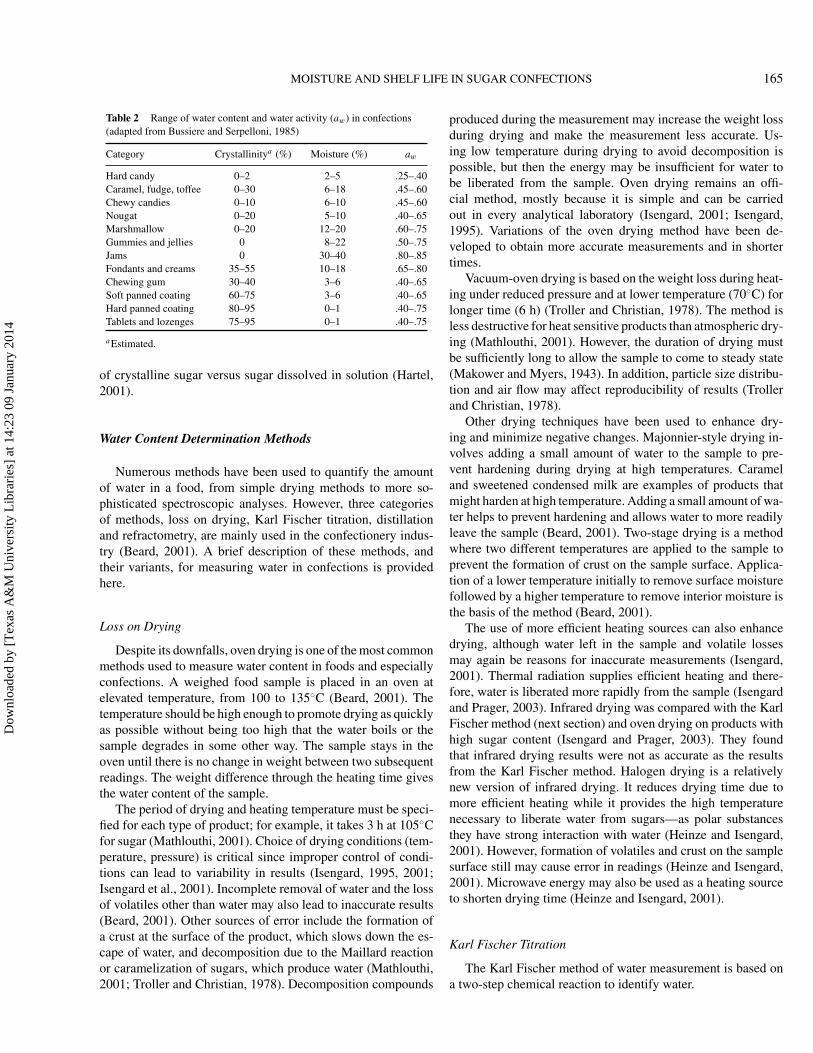
Water is also important in determining texture, whether of ahard or soft candy (Jackson, 1995). Confections typically haverelatively low water contents, at least compared to many otherfood categories. Water content may vary from as high as about30% in sugar syrup confections to as low as 1–2% in hardcandies. Table 2 provides an approximate range of moisturecontent for a wide variety of confections. As can be seen, somecandy categories span quite a wide range of water contents.Caramel, for example, can have water content as low as 4–5% ina caramel-type hard candy or as high as about 18% in very soft,fluid caramels. In this case, water content has a distinct impacton the texture of the caramel. In hard candies, high water contentcan potentially lead to graining or stickiness, softer texture, andfaster flavor loss, whereas very low water content may give ahard and brittle texture. In fondants, a change in moisture contentaffects the amount of soluble sugars and thus, the proportions
Dow
nloa
ded
by [
Tex
as A
&M
Uni
vers
ity L
ibra
ries
] at
14:
23 0
9 Ja
nuar
y 20
14
MOISTURE AND SHELF LIFE IN SUGAR CONFECTIONS 165
Table 2 Range of water content and water activity (aw) in confections(adapted from Bussiere and Serpelloni, 1985)
of crystalline sugar versus sugar dissolved in solution (Hartel,2001).
Water Content Determination Methods
Numerous methods have been used to quantify the amountof water in a food, from simple drying methods to more so-phisticated spectroscopic analyses. However, three categoriesof methods, loss on drying, Karl Fischer titration, distillationand refractometry, are mainly used in the confectionery indus-try (Beard, 2001). A brief description of these methods, andtheir variants, for measuring water in confections is providedhere.
Loss on Drying
Despite its downfalls, oven drying is one of the most commonmethods used to measure water content in foods and especiallyconfections. A weighed food sample is placed in an oven atelevated temperature, from 100 to 135◦C (Beard, 2001). Thetemperature should be high enough to promote drying as quicklyas possible without being too high that the water boils or thesample degrades in some other way. The sample stays in theoven until there is no change in weight between two subsequentreadings. The weight difference through the heating time givesthe water content of the sample.
The period of drying and heating temperature must be speci-fied for each type of product; for example, it takes 3 h at 105◦Cfor sugar (Mathlouthi, 2001). Choice of drying conditions (tem-perature, pressure) is critical since improper control of condi-tions can lead to variability in results (Isengard, 1995, 2001;Isengard et al., 2001). Incomplete removal of water and the lossof volatiles other than water may also lead to inaccurate results(Beard, 2001). Other sources of error include the formation ofa crust at the surface of the product, which slows down the es-cape of water, and decomposition due to the Maillard reactionor caramelization of sugars, which produce water (Mathlouthi,2001; Troller and Christian, 1978). Decomposition compounds
produced during the measurement may increase the weight lossduring drying and make the measurement less accurate. Us-ing low temperature during drying to avoid decomposition ispossible, but then the energy may be insufficient for water tobe liberated from the sample. Oven drying remains an offi-cial method, mostly because it is simple and can be carriedout in every analytical laboratory (Isengard, 2001; Isengard,1995). Variations of the oven drying method have been de-veloped to obtain more accurate measurements and in shortertimes.
Vacuum-oven drying is based on the weight loss during heat-ing under reduced pressure and at lower temperature (70◦C) forlonger time (6 h) (Troller and Christian, 1978). The method isless destructive for heat sensitive products than atmospheric dry-ing (Mathlouthi, 2001). However, the duration of drying mustbe sufficiently long to allow the sample to come to steady state(Makower and Myers, 1943). In addition, particle size distribu-tion and air flow may affect reproducibility of results (Trollerand Christian, 1978).
Other drying techniques have been used to enhance dry-ing and minimize negative changes. Majonnier-style drying in-volves adding a small amount of water to the sample to pre-vent hardening during drying at high temperatures. Carameland sweetened condensed milk are examples of products thatmight harden at high temperature. Adding a small amount of wa-ter helps to prevent hardening and allows water to more readilyleave the sample (Beard, 2001). Two-stage drying is a methodwhere two different temperatures are applied to the sample toprevent the formation of crust on the sample surface. Applica-tion of a lower temperature initially to remove surface moisturefollowed by a higher temperature to remove interior moisture isthe basis of the method (Beard, 2001).
The use of more efficient heating sources can also enhancedrying, although water left in the sample and volatile lossesmay again be reasons for inaccurate measurements (Isengard,2001). Thermal radiation supplies efficient heating and there-fore, water is liberated more rapidly from the sample (Isengardand Prager, 2003). Infrared drying was compared with the KarlFischer method (next section) and oven drying on products withhigh sugar content (Isengard and Prager, 2003). They foundthat infrared drying results were not as accurate as the resultsfrom the Karl Fischer method. Halogen drying is a relativelynew version of infrared drying. It reduces drying time due tomore efficient heating while it provides the high temperaturenecessary to liberate water from sugars—as polar substancesthey have strong interaction with water (Heinze and Isengard,2001). However, formation of volatiles and crust on the samplesurface still may cause error in readings (Heinze and Isengard,2001). Microwave energy may also be used as a heating sourceto shorten drying time (Heinze and Isengard, 2001).
Karl Fischer Titration
The Karl Fischer method of water measurement is based ona two-step chemical reaction to identify water.
Dow
nloa
ded
by [
Tex
as A
&M
Uni
vers
ity L
ibra
ries
] at
14:
23 0
9 Ja
nuar
y 20
14
166 R. ERGUN ET AL.
ROH + SO2 + Z =⇒ ZH+ + ROSO2 (2)
ZH+ + ROSO−2 + I2 + H2O
+ 2Z =⇒ 3ZH+ + ROSO3 + 2I− (3)
In the first step (Eq. 2), sulfur dioxide is esterified with alco-hol reagent (methanol/formamide), and the ester is neutralizedby base (Z) to yield alkyl sulphide. In the second step, iodineoxidizes alkyl sulphide in the presence of water. I2 is used asa titrating reagent for the determination of “end-point.” Whenall the water is consumed, iodine cannot react and is present inthe solution with iodide. The existence of the redox couple io-dine/iodide corresponds to the redox reaction at the electrodes,which are submerged in the working medium and cause thevoltage to drop sharply. The dramatic drop indicates “the end-point” (Mathlouthi, 2001; Isengard, 2001; Isengard and Heinze,2003).
The Karl Fischer method is useful for the analyses of driedfruits and vegetables, candies, roasted coffee, and fats (Pomer-anz and Meloan, 1994). Although Karl Fischer titration is not asrapid as some other methods (e.g., NMR or NIR spectroscopy), itis still considered to be a fast method (20–25 minutes) and can beused in on-line processing (Isengard, 1995, 2001; Beard, 2001).The reagent reacts only with water, which eliminates the errorcoming from detection of the volatile constituents (KnetchelLaboratories, 1969; Beard, 2001). However, a shortcoming ofthe method is that results are affected by type of sample andparticle size (Troller and Christian, 1978). Another problem canarise if water does not contact directly with the KF reagent,which can occur if the sample is insoluble. Instead of the totalwater content, only the surface water may be measured. Theliberation of all water in the sample can be accomplished byaddition of an appropriate solvent (i.e., methanol, formamide,etc.), reducing the particle size or elevating the temperature(Schoffski, 1998; Wunsch and Grunke, 1998).
Karl Fisher titration has been found to be reliable and suffi-ciently rapid (Supartona and Isengard, 1998). It is widely usedfor confectionery applications.
Refractometer
For fluid systems, like sugar syrups, measurement of therefractive index of the sample allows determination of watercontent (inverse of solids content). As light changes velocity(direction and speed) when it goes through any substance, re-fractive index, or the ratio of the velocity of light in a vacuumto its velocity in the sample (Pancoast and Junk, 1980), can beused to determine the percentage of dry substance and there-fore, the moisture content of the sample (Beard, 2001; Minifie,1970). However, the calibration between the refractive indexand the concentration of dry substances depends on the type ofdissolved material (Pancoast and Junk, 1980). For pure sucrosesolutions, the refractive index is directly correlated to concentra-tion so that the refractometer scale reading can be given directly
in concentration (weight percent). The refractive indices for avariety of confectionery sugars are compiled in Pancoast andJunk (1980).
However, most confectionery syrups of interest contain mix-tures of sucrose and other sweeteners (e.g., corn syrup, invertsugar, etc.). In this case, the refractive index of the solutiondepends on the relative ratios of the component ingredients.Pancoast and Junk (1980) have prepared tables in which thecorrelation between the refractive index of different productsand the solid content is given.
Since most refractometers read in a scale of sucrose weightpercent, the readings off a refractometer used for confectionerysugar mixtures give slightly erroneous results. When refrac-tometer readings are used directly for measuring concentrationof confectionery mixtures, the scale reading is more correctlytermed ◦Brix to represent the equivalent sucrose concentrationof a syrup with that refractive index. ◦Brix values do not rep-resent the exact total solids (or water) content, with the errorsincreasing when less sucrose is present in the mixture. For manyconfectionery applications, no correction factors are used and◦Brix is assumed to be sufficiently close to the true total solidsconcentration (and water content by difference).
Although using a refractometer is a very rapid method (lessthan three minutes) (Beard, 2001), it requires samples to behomogenous and representative to give accurate results. Therefractive index is also very sensitive to temperature (Beard,2001), so to be most accurate, the refractometer should alwaysbe used at a consistent temperature.
Spectroscopy
Spectroscopic methods for measurement of water are basedon food properties when the sample is exposed to electromag-netic radiation. The common spectroscopic methods, NuclearMagnetic Resonance (NMR), Near Infrared (NIR), and Mi-crowave (MW), are explained briefly in the following sections.
Nuclear Magnetic Resonance (NMR) Spectroscopy. TheNMR spectroscopy was first used for water determination infoods by Bloch et al. (1946) and Purcell et al. (1946). With theappearance of commercial instruments, the use of NMR in thedetermination of water content in foods rapidly increased (Shawet al., 1953; Shaw and Elsken, 1953, 1956).
NMR spectroscopic measurement of water content is basedon the measurement of magnetic properties of hydrogen atomsin water. In an external magnetic field, the spin axes of thesehydrogen nuclei are oriented in a specific direction by theapplied field. When exposed to superimposed radio-frequencypulses of a specific frequency, the protons absorb energy andspin slightly off-axis. Between pulses, the protons releasethis absorbed energy, and the cycle of energy absorption andemission, known as resonance, characterizes the protons of themolecular species. The NMR resonance spectrum of a hydrogenatom in a water molecule is different from that in a carbohydrateor protein molecule. Characterization of the proton spectrumfor water in a food leads to quantification of the water content of
Dow
nloa
ded
by [
Tex
as A
&M
Uni
vers
ity L
ibra
ries
] at
14:
23 0
9 Ja
nuar
y 20
14
MOISTURE AND SHELF LIFE IN SUGAR CONFECTIONS 167
the sample (Troller and Christian, 1978; Ruan and Chen, 1998).Since “bound” water exhibits a broader signal than free water,this technique is more adapted to distinguish between free waterand bound water than for the accurate determination of watercontent (Troller and Christian, 1978; Mathlouthi, 2001). Precisecalibration of the water content of the analyzed product basedon a good reference method is needed (Mathlouthi, 2001).
Advantages of NMR techniques for measurement of wa-ter content include (Ruan and Chen, 1998) that it is a rapid,nondestructive, and noninvasive method, it requires less sam-ple preparation than other methods, it offers the possibility ofautomation because data acquisition can be real-time and dataare electronic signals, and provides simultaneous determinationof moisture and fat content. However, NMR is rarely used forwater determination due to its high price (Isengard, 1995).
Near Infrared (NIR) Spectroscopy. The NIR measurementof water content is based on the absorption of electromagneticenergy by water molecules at different wavelengths (1950 and1450 nm) (Vornhof and Thomas, 1970; Mathlouthi, 2001). Wa-ter gives signals at 1450 and 1940 nm, based on different vi-brational modes, which are used to quantify the water content(Isengard, 2001). However, a product-specific calibration is thekey to accurate moisture measurement (Isengard, 2001). Color,particle size, thickness, and texture of the product can influencethe results (Mathlouthi, 2001), so great care is needed in sam-ple preparation. One potential disadvantage is that only surfacewater may be measured, giving inaccurate results for the watercontent of the whole product (Mathlouthi, 2001).
Microwave Spectroscopy. The use of microwave spec-troscopy for measurement of water is based on the dipolar char-acter of the water molecule. The sample is placed between thereceiver and emitter parts of the microwave and the water con-tent of the sample can be correlated to the shift in wavelengthand decrease in intensity (Isengard, 1995).
Parameters that affect measurement of water content by mi-crowave spectroscopy include thickness and density of the sam-ple. Thus, the method is more suitable for measuring mobilewater then crystallization water or bound water (Mathlouthi,2001). The application of microwave spectroscopy for measur-ing water content in confections is not widespread.
Dielectric Techniques
Different foods have molecules with different polarities,which can be oriented by means of an external field. The di-electric constant of water (80) is quite different from most food
components (protein: 4–6; fats: 2–5) (Breen and Monaghan,1975) so that an empirical calibration for dielectric constant,based on a primary measurement method, can be used to mea-sure water content of a food.
Breen and Monaghan (1975) measured the water content oflicorice candy by using a dielectric technique calibrated by ovendrying. The accuracy of the technique was verified by a goodcorrelation between the two methods.
The advantage of dielectric measurement of water content isthat, after calibration, it is a very rapid method (Beard, 2001).However, there are several factors that potentially limit its usage.For example, the moisture range of the sample must be between0 and 50%, and the sample should not have any componentswith high dielectric constant (Breen and Monaghan, 1975).
COLLIGATIVE EFFECTS
The presence of a solute in a solvent can lead to changes inphysical properties of that solution. These physical properties,vapor pressure, boiling point, osmotic pressure, and freezingpoint, are known as the colligative properties. The word col-ligative, which comes from the Latin word colligatus meaning“bound together,” is used to show that these properties are allinterrelated. In ideal solutions, the degree of change in colliga-tive properties is only proportional to the mole fraction of thesolute (Walstra, 2003).
The two colligative properties of particular importance to theconfectioner are water activity, or relative vapor pressure, andboiling point elevation.
Water Activity
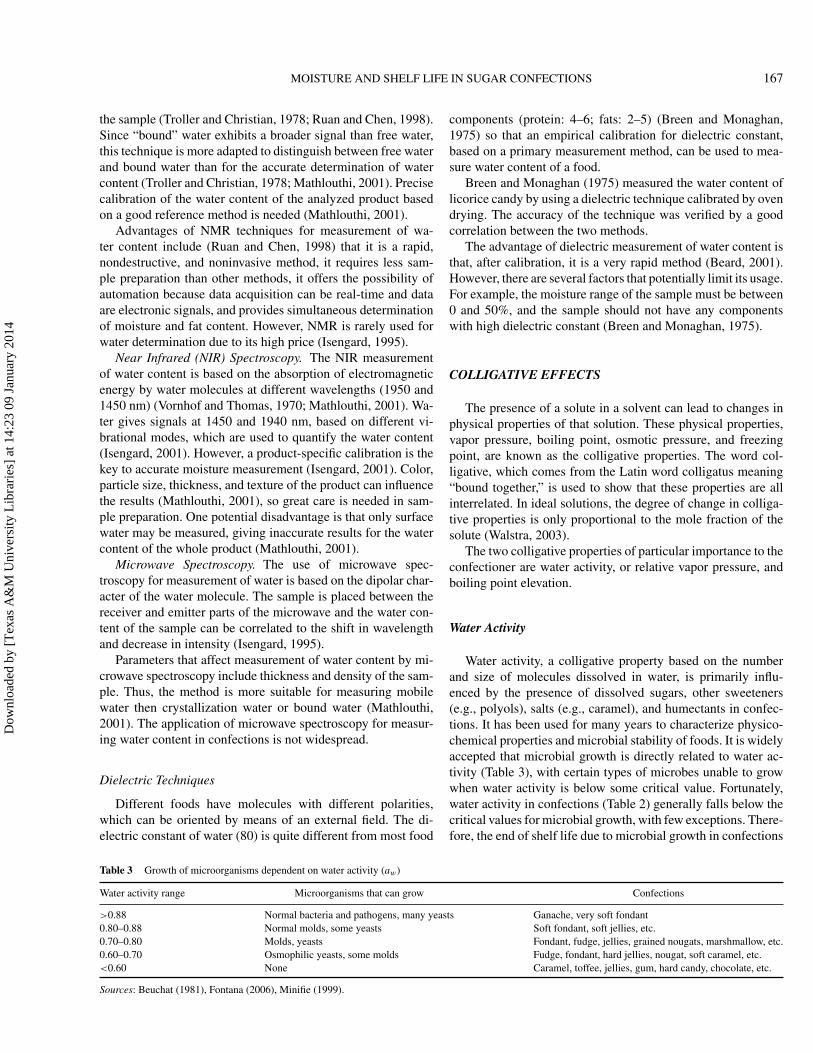
Water activity, a colligative property based on the numberand size of molecules dissolved in water, is primarily influ-enced by the presence of dissolved sugars, other sweeteners(e.g., polyols), salts (e.g., caramel), and humectants in confec-tions. It has been used for many years to characterize physico-chemical properties and microbial stability of foods. It is widelyaccepted that microbial growth is directly related to water ac-tivity (Table 3), with certain types of microbes unable to growwhen water activity is below some critical value. Fortunately,water activity in confections (Table 2) generally falls below thecritical values for microbial growth, with few exceptions. There-fore, the end of shelf life due to microbial growth in confections
Table 3 Growth of microorganisms dependent on water activity (aw)
Water activity range Microorganisms that can grow Confections
>0.88 Normal bacteria and pathogens, many yeasts Ganache, very soft fondant0.80–0.88 Normal molds, some yeasts Soft fondant, soft jellies, etc.0.70–0.80 Molds, yeasts Fondant, fudge, jellies, grained nougats, marshmallow, etc.0.60–0.70 Osmophilic yeasts, some molds Fudge, fondant, hard jellies, nougat, soft caramel, etc.<0.60 None Caramel, toffee, jellies, gum, hard candy, chocolate, etc.
is generally not an issue. However, the end of shelf life dueto moisture loss or gain, with subsequent changes in texturaland other properties, is often the main problem in confections.Thus, an understanding of water activity is important for controlof shelf life and stability.
Thermodynamic Definition of Water Activity
In the food industry, water activity is generally defined asthe ratio of the vapor pressures of the food to that of pure water(Nielsen, 1998; de Man, 1999). However, thermodynamically,the ratio of vapor pressures is not the true thermodynamic wa-ter activity under all conditions and is often incorrect in manyconditions of importance to shelf life of foods and confections.
Thermodynamically, water activity, aw, is the ratio of chem-ical potentials, often simplified to the ratio of fugacities (Reidet al., 1987; Sereno et al., 2001):
aw(T , P, x) = fw(T , P, x)/f o
w(T , P o) (4)
where, fw is the fugacity of the water in the food with molefraction of water, x, and f o
w is the fugacity of pure water at thesame temperature, T , and pressure, P . Fugacity is sometimescalled the “escaping tendency,” indicative of the ability of themolecule to escape from the food surface.
Under conditions where there is equilibrium between waterin the food and the air, and assuming ideal solutions, the fugacityratio can be expressed as a ratio of vapor pressures to give thecommonly accepted form for water activity, aw (Sereno et al.,2001; Nielsen, 1998; deMan, 1999):
aw = pw(T , P, x)/po
w(T , P ) (5)
where, pw is the vapor pressure measured in the air above afood and po
w is the vapor pressure of pure water at the sametemperature and pressure.
Again, Equation (5) is not true under all conditions sinceit assumes ideal solutions and complete equilibration betweenwater in the food and water in the air. At the high sugar con-tents found in confections, neither assumption may be true.The ability for the water in the confection to truly equilibratewith the air surrounding it depends on the ability of the wa-ter molecule to migrate/diffuse within the confection. In hardcandy, for example, it is doubtful that sufficient time can ever beallowed for the water to completely equilibrate between candyand air. The same is probably true, although to a lesser extent,for hard, amorphous candies like caramel and toffee. Grindingthese candies into a fine powder provides the best opportunityto expose the maximum surface area to the air and allow nearequilibration.
Despite limitations to the water activity approach at low watercontent, it is widely used in the food industry, and as long asthe limitations are recognized, water activity can still provide
useful information. For example, a difference in water activitybetween two components of a confection will lead to moisturemigration until the two components have attained approximatelythe same water activity. Moisture migration occurs to alleviatethe thermodynamic difference until equilibrium (equal chemicalpotentials) is reached.
Equilibration in moisture between the confection and thesurrounding air space (both within a package and external to thepackage) also occurs. Since water activity is the ratio of vaporpressures, it is in the same general form as relative humidity(RH) of the air. Typically, water activity is used to predict anEquilibrium Relative Humidity (ERH), or the RH at which thecandy neither gains nor loses water from the air. ERH is thengiven as (Nielsen, 1998):
ERH(%) = aw(100) (6)
Again, ERH is the relative humidity at which the productdoes not gain or loose moisture to the air surrounding the con-fection (Jackson, 1995). If the surrounding atmosphere has adifferent RH from this value, the confection will either gain orlose moisture as it strives to equilibrate with the air.
Packaging is, in part, designed to protect the confection frommoisture gain or loss to the surrounding environment. Many con-fections, such as hard candies, gum, and caramels, are wrappedindividually and then bagged in an overwrap package. This pro-vides two layers of protection against moisture migration, atleast until the package is opened. Other confections, such ascandy bars, however, have only a single package layer protect-ing it from the environment. Equilibration between moisture inthe candy and the air within the package occurs rapidly withslower equilibration of moisture between the internal air spaceand the outside, ambient air depending on the barrier propertiesof the package layer.
Prediction of Water Activity
Over the years, numerous methods have been developed tocalculate or predict water activity of confections. Many of thesemethods have been reviewed by Teng and Seow (1981), Vega-Mercado et al. (1994), and more recently by Sereno et al. (2001).Methods to calculate water activity include
(1) completely empirical approaches,(2) semi-empirical approaches based on thermodynamic prin-
ciples, and(3) the local composition models where solution properties are
calculated from group contribution methods (Sereno et al.,2001).
Recent developments in predictive methods for water activityhave been primarily in the area of solutions used for osmoticdehydration (Sereno et al., 2001), which generally contain
Dow
nloa
ded
by [
Tex
as A
&M
Uni
vers
ity L
ibra
ries
] at
14:
23 0
9 Ja
nuar
y 20
14
MOISTURE AND SHELF LIFE IN SUGAR CONFECTIONS 169
mixtures of sugars and salts. This discussion will focus on thosepredictive methods most relevant to confectionery systems.
Empirical methods. One of the first methods (if not the first)of predicting water activity in confectionery products was devel-oped by Grover (1947). In this empirical approach, the relativevapor pressure (or equilibrium relative humidity) was calculatedby first summing the contributions of each of the ingredients inthe confection to give an equivalent sucrose concentration, Es ,according to an equation of the form:
Es =∑
cf (7)
where, c is the concentration of each ingredient and f is anempirical conversion factor appropriate for each ingredient.The relative vapor pressure was then determined from a tablethat contained sucrose concentration effects on relative vaporpressure.
Another well-known empirical equation for predicting wateractivity of sugar syrups is that developed by Money and Born(1951). In a similar manner as Grover (1947), different sugarswere assigned empirical parameters that were used to calculateequilibrium relative humidity of various sugar mixtures. Theequation gave a reasonable fit to experimental values of relativevapor pressure over a narrow range of sugar concentrations, butfor some reason predicted 104% RH for 100% water and wentto infinity at 0% water.
Over the years, these empirical methods did not gain muchfavor in predicting water activity in confections, in part, becausemore accurate methods have been developed since then.
Semi-Empirical Models. One of the most common, and mostsuccessful, methods for predicting water activity in confectionsis the method originally developed by Norrish (1964, 1966). Thismodel is based on the thermodynamic definition of water activityas related to molar concentrations of confectionery syrups, butuses an empirical fitting of interaction parameters based onexperimental data. In this sense, the method of Norrish is oftencalled a semi-empirical model for predicting water activity. TheNorrish equation for prediction of ERH is (Norrish, 1964):
log(ERH) = log(xw) −∑
[(−Ki)0.5xi]
2 (8)
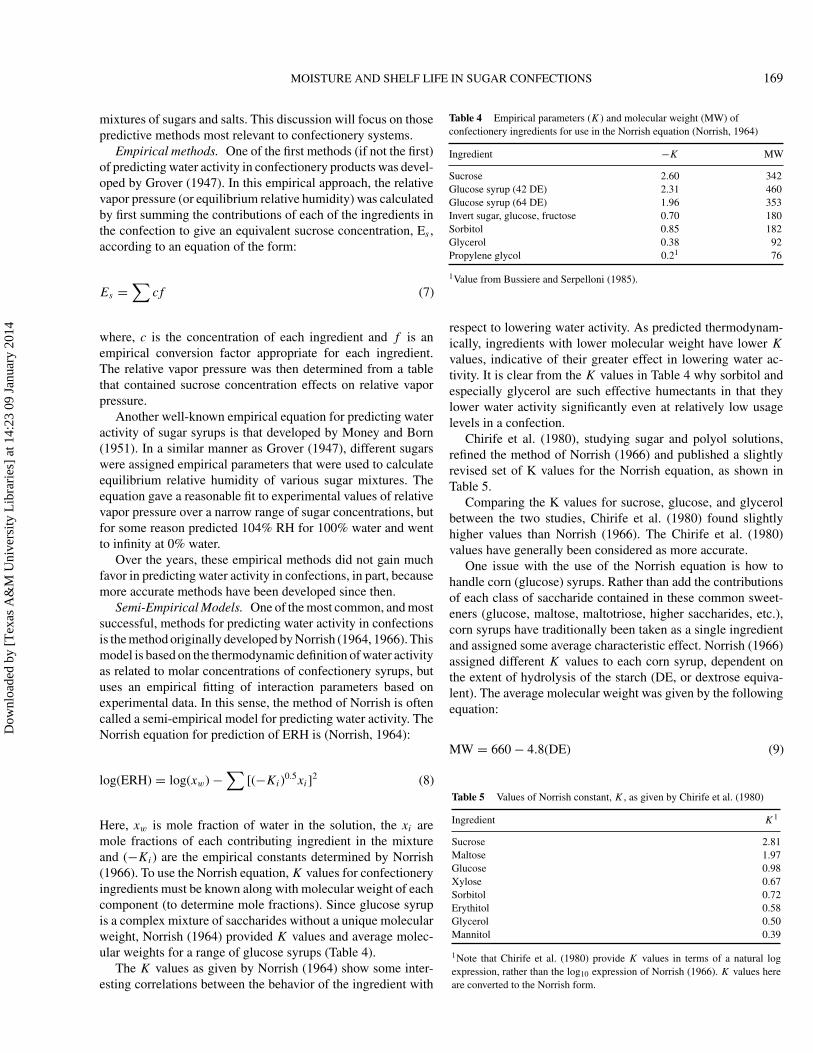
Here, xw is mole fraction of water in the solution, the xi aremole fractions of each contributing ingredient in the mixtureand (−Ki) are the empirical constants determined by Norrish(1966). To use the Norrish equation, K values for confectioneryingredients must be known along with molecular weight of eachcomponent (to determine mole fractions). Since glucose syrupis a complex mixture of saccharides without a unique molecularweight, Norrish (1964) provided K values and average molec-ular weights for a range of glucose syrups (Table 4).
The K values as given by Norrish (1964) show some inter-esting correlations between the behavior of the ingredient with
Table 4 Empirical parameters (K) and molecular weight (MW) ofconfectionery ingredients for use in the Norrish equation (Norrish, 1964)
respect to lowering water activity. As predicted thermodynam-ically, ingredients with lower molecular weight have lower K
values, indicative of their greater effect in lowering water ac-tivity. It is clear from the K values in Table 4 why sorbitol andespecially glycerol are such effective humectants in that theylower water activity significantly even at relatively low usagelevels in a confection.
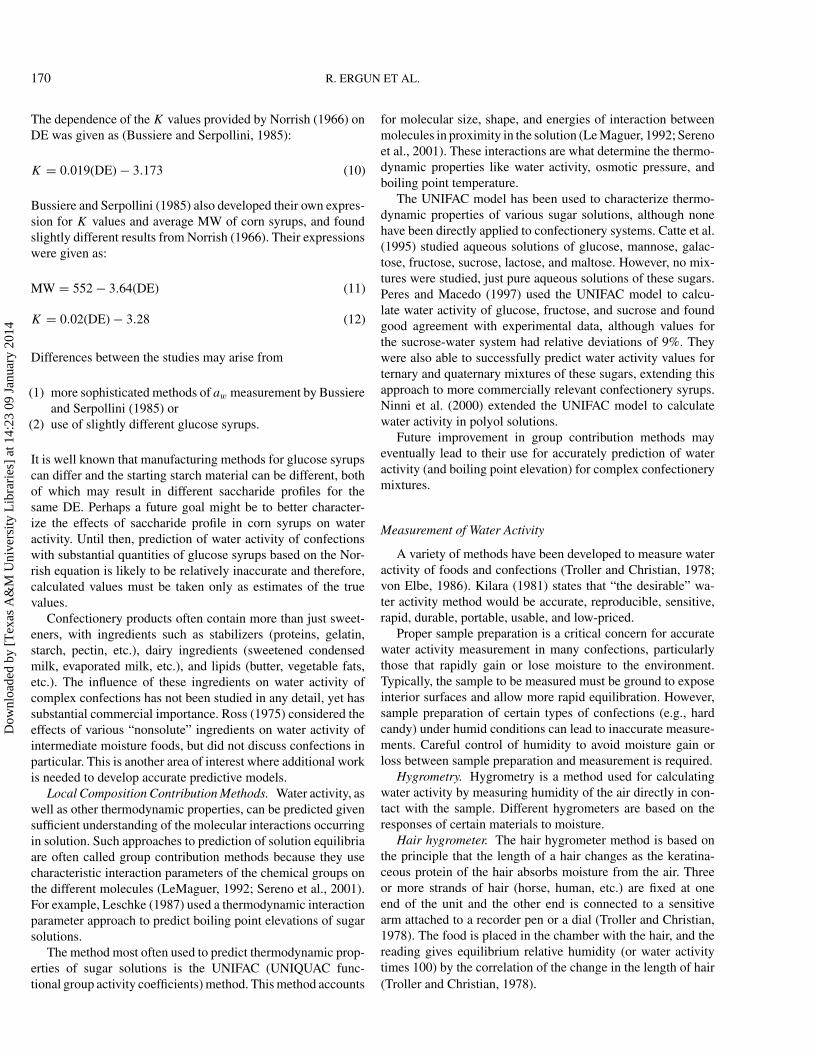
Chirife et al. (1980), studying sugar and polyol solutions,refined the method of Norrish (1966) and published a slightlyrevised set of K values for the Norrish equation, as shown inTable 5.
Comparing the K values for sucrose, glucose, and glycerolbetween the two studies, Chirife et al. (1980) found slightlyhigher values than Norrish (1966). The Chirife et al. (1980)values have generally been considered as more accurate.
One issue with the use of the Norrish equation is how tohandle corn (glucose) syrups. Rather than add the contributionsof each class of saccharide contained in these common sweet-eners (glucose, maltose, maltotriose, higher saccharides, etc.),corn syrups have traditionally been taken as a single ingredientand assigned some average characteristic effect. Norrish (1966)assigned different K values to each corn syrup, dependent onthe extent of hydrolysis of the starch (DE, or dextrose equiva-lent). The average molecular weight was given by the followingequation:
MW = 660 − 4.8(DE) (9)
Table 5 Values of Norrish constant, K , as given by Chirife et al. (1980)
1Note that Chirife et al. (1980) provide K values in terms of a natural logexpression, rather than the log10 expression of Norrish (1966). K values hereare converted to the Norrish form.
Dow
nloa
ded
by [
Tex
as A
&M
Uni
vers
ity L
ibra
ries
] at
14:
23 0
9 Ja
nuar
y 20
14
170 R. ERGUN ET AL.
The dependence of the K values provided by Norrish (1966) onDE was given as (Bussiere and Serpollini, 1985):
K = 0.019(DE) − 3.173 (10)
Bussiere and Serpollini (1985) also developed their own expres-sion for K values and average MW of corn syrups, and foundslightly different results from Norrish (1966). Their expressionswere given as:
MW = 552 − 3.64(DE) (11)
K = 0.02(DE) − 3.28 (12)
Differences between the studies may arise from
(1) more sophisticated methods of aw measurement by Bussiereand Serpollini (1985) or
(2) use of slightly different glucose syrups.
It is well known that manufacturing methods for glucose syrupscan differ and the starting starch material can be different, bothof which may result in different saccharide profiles for thesame DE. Perhaps a future goal might be to better character-ize the effects of saccharide profile in corn syrups on wateractivity. Until then, prediction of water activity of confectionswith substantial quantities of glucose syrups based on the Nor-rish equation is likely to be relatively inaccurate and therefore,calculated values must be taken only as estimates of the truevalues.
Confectionery products often contain more than just sweet-eners, with ingredients such as stabilizers (proteins, gelatin,starch, pectin, etc.), dairy ingredients (sweetened condensedmilk, evaporated milk, etc.), and lipids (butter, vegetable fats,etc.). The influence of these ingredients on water activity ofcomplex confections has not been studied in any detail, yet hassubstantial commercial importance. Ross (1975) considered theeffects of various “nonsolute” ingredients on water activity ofintermediate moisture foods, but did not discuss confections inparticular. This is another area of interest where additional workis needed to develop accurate predictive models.
Local Composition Contribution Methods. Water activity, aswell as other thermodynamic properties, can be predicted givensufficient understanding of the molecular interactions occurringin solution. Such approaches to prediction of solution equilibriaare often called group contribution methods because they usecharacteristic interaction parameters of the chemical groups onthe different molecules (LeMaguer, 1992; Sereno et al., 2001).For example, Leschke (1987) used a thermodynamic interactionparameter approach to predict boiling point elevations of sugarsolutions.
The method most often used to predict thermodynamic prop-erties of sugar solutions is the UNIFAC (UNIQUAC func-tional group activity coefficients) method. This method accounts
for molecular size, shape, and energies of interaction betweenmolecules in proximity in the solution (Le Maguer, 1992; Serenoet al., 2001). These interactions are what determine the thermo-dynamic properties like water activity, osmotic pressure, andboiling point temperature.
The UNIFAC model has been used to characterize thermo-dynamic properties of various sugar solutions, although nonehave been directly applied to confectionery systems. Catte et al.(1995) studied aqueous solutions of glucose, mannose, galac-tose, fructose, sucrose, lactose, and maltose. However, no mix-tures were studied, just pure aqueous solutions of these sugars.Peres and Macedo (1997) used the UNIFAC model to calcu-late water activity of glucose, fructose, and sucrose and foundgood agreement with experimental data, although values forthe sucrose-water system had relative deviations of 9%. Theywere also able to successfully predict water activity values forternary and quaternary mixtures of these sugars, extending thisapproach to more commercially relevant confectionery syrups.Ninni et al. (2000) extended the UNIFAC model to calculatewater activity in polyol solutions.
Future improvement in group contribution methods mayeventually lead to their use for accurately prediction of wateractivity (and boiling point elevation) for complex confectionerymixtures.
Measurement of Water Activity
A variety of methods have been developed to measure wateractivity of foods and confections (Troller and Christian, 1978;von Elbe, 1986). Kilara (1981) states that “the desirable” wa-ter activity method would be accurate, reproducible, sensitive,rapid, durable, portable, usable, and low-priced.
Proper sample preparation is a critical concern for accuratewater activity measurement in many confections, particularlythose that rapidly gain or lose moisture to the environment.Typically, the sample to be measured must be ground to exposeinterior surfaces and allow more rapid equilibration. However,sample preparation of certain types of confections (e.g., hardcandy) under humid conditions can lead to inaccurate measure-ments. Careful control of humidity to avoid moisture gain orloss between sample preparation and measurement is required.
Hygrometry. Hygrometry is a method used for calculatingwater activity by measuring humidity of the air directly in con-tact with the sample. Different hygrometers are based on theresponses of certain materials to moisture.
Hair hygrometer. The hair hygrometer method is based onthe principle that the length of a hair changes as the keratina-ceous protein of the hair absorbs moisture from the air. Threeor more strands of hair (horse, human, etc.) are fixed at oneend of the unit and the other end is connected to a sensitivearm attached to a recorder pen or a dial (Troller and Christian,1978). The food is placed in the chamber with the hair, and thereading gives equilibrium relative humidity (or water activitytimes 100) by the correlation of the change in the length of hair(Troller and Christian, 1978).
Dow
nloa
ded
by [
Tex
as A
&M
Uni
vers
ity L
ibra
ries
] at
14:
23 0
9 Ja
nuar
y 20
14
MOISTURE AND SHELF LIFE IN SUGAR CONFECTIONS 171
Equilibrium conditions require sufficient time; however, thistime can be shortened by circulating air through the system.Although, hair hygrometers lack sensitivity (only good to 0.03aw) they are useful for range-finding and for a rough estimationof water activity (Troller and Christian, 1978). Low cost is anadvantage of using the method.
Electronic hygrometer. Electronic hygrometry is based onthe measurement of conductivity or resistance of a hygroscopicsalt in equilibrium with the surrounding atmosphere. The salt’sability to conduct electricity is measurably changed as mois-ture is absorbed or desorbed by the salt (Troller and Christian,1978). The instrument has a sensor, a sample chamber, and apotentiometer. According to the water activity of the sample inthe chamber, a hygroscopic material, usually LiC1 or sulfonatedpolystyrene, in the sensor gives different conductivity or resis-tance. The sensor works as an electric transducer and changesin capacitance are read in response to changes in relative hu-midity (Mathlouthi, 2001). The instrument must be calibratedwith solutions of known aw.
Electric hygrometry is considered precise, quick, and conve-nient. However, the units are relatively expensive and are subjectto contamination from glycols, ammonia, acetate ions, and otherorganic volatiles (Kilara, 1981).
Dew Point. Dew point measurement of aw of confections isa commonly used technique due to the convenience and shortmeasurement times. The dew point is the temperature at whichcondensation of water vapor occurs (saturation is reached) asair is cooled (no change in water content). To measure aw, anair stream in equilibrium with the food sample is directed at acooled mirror or sight glass. A beam of light from a neon lampis directed onto the mirror and reflected into a photodetectorcell. When condensation occurs on the mirror (meaning thedew point is reached), a change in reflectance is sensed bya photodetector. The equilibrium (dew point) temperature isrelated to ERH through a standard relation between relativehumidity and dew point temperature.
Dew point measurement gives accurate results over the entirerange of aw (von Elbe, 1986) and in a relatively short time (1–2 h). The main limitation of the dew point method is that it canbe affected by certain volatiles, such as ethanol and propylene,which can co-condense on the mirror.
The accuracy and time required to reach equilibrium can bereduced by crushing, slicing, or grinding the samples, therebyexposing a greater surface area to the air. This also allows ho-mogenization of the sample. For multi-domain foods with a cen-ter and outer coating that have different aw, like hard candy witha chewy or gum center, the two domains must be separated priorto measurement. Also, careful control of the humidity duringsample preparation is needed to ensure accurate measurementssince grinding of a candy in conditions of high humidity cancause sufficient moisture sorption to give erroneous readings.
Sorption Isotherms. The sorption isotherm method is basedon the determination of equilibrium relative humidity, or thepoint at which the sample neither gains nor loses moisture. Af-ter measuring the amount of water gained or lost by the sample
in a determined time (often only 1 to 2 hours), moisture contentsare plotted against aw. This plot intersects with the line present-ing zero moisture change at the aw value of the sample (Labuzaet al., 1976; Troller and Christian, 1978). This method has pro-vided good results for confectionery products (Smith, 1965;d’Alton, 1969), with accuracy within +0.02 (Sloan and Labuza,1975, 1976). However, despite a reduction in measurement timethrough automation of this method, sorption isotherms are gen-erally no longer used for measurement of aw.
Boiling Point Elevation
The boiling point of a solution is the temperature where thetotal vapor pressure above the solution reaches ambient pres-sure. With solute addition, vapor pressure of the solution de-creases and as a result, higher temperature is necessary to reachthe point where total vapor pressure equals ambient pressure(Walstra, 2003). The change in boiling point, �Tb, or boilingpoint elevation, is given by (Walstra, 2003)
�Tb = − T 2b,1
�Hv,1R ln (x1) ≈ −28 ln (x1) ≈ 0.51m2 (13)
where Tb,1 is the boiling temperature of the pure solvent, �Hv isthe enthalpy of vaporization (40.6 kJ/mol for water at 100oC andatmospheric pressure), x1 is the solvent (water) mole fraction,and m2 is the solute concentration (moles/L).
Literature data for boiling point temperature of sugar solu-tions, particularly at higher concentration, is highly inconsistent(Norrish, 1967; Jackson, 1995). This can mostly be attributed tothe difficulty in measuring the exact water content at a specificboiling temperature since evaporation continues during cooling(Batterham and Norgate, 1975). Rapid cooling is essential toobtain the most accurate results. Tables of boiling point eleva-tion for various sugar solutions of importance to confectionscan be found in Norrish (1967) and Pancoast and Junk (1980);however, the values at high dissolved solids contents should beused with caution for the reasons noted above.
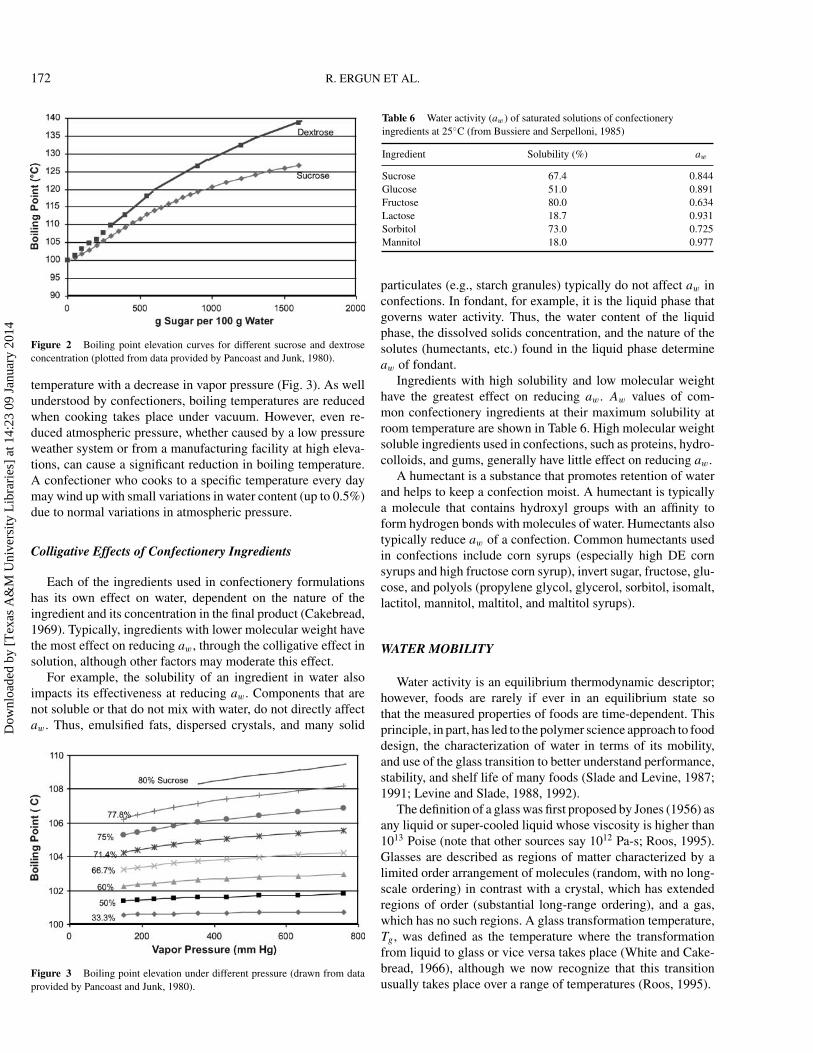
Solute concentration and molecular weight determine thedegree of boiling point elevation. Based on its lower molecularweight, glucose (dextrose) solutions boil at higher temperaturethan sucrose solutions of equivalent weight percentage (Jackson,1995). For example, Fig. 2 compares the boiling point elevationof sucrose and dextrose solutions.
The effects of glucose syrup on boiling point elevation de-pend on the specific saccharide composition (Norrish, 1967;Pancoast and Junk, 1980). Higher DE corn syrups give higherboiling point elevation than lower DE corn syrups, but cornsyrups of the same DE from different manufacturers might haveslightly different boiling point elevation.
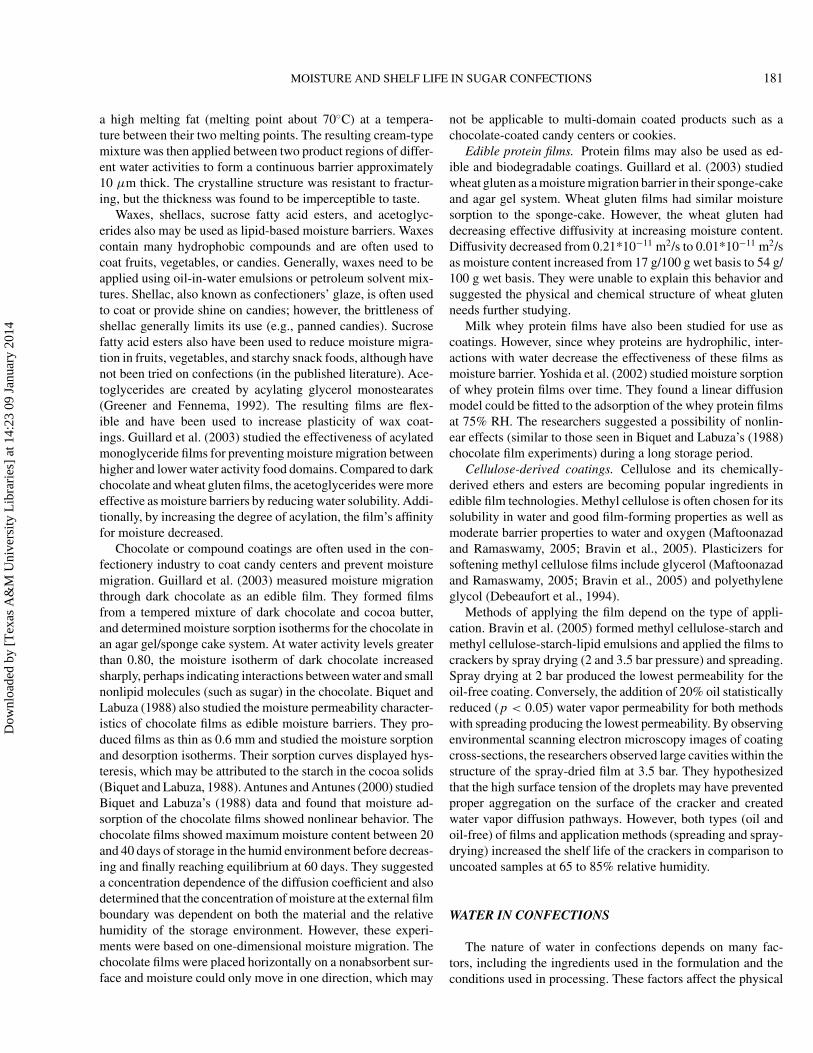
Another factor that affects boiling temperature is the pres-sure (Jackson, 1995). The boiling point is defined as when va-por pressure reaches ambient pressure, so changing ambientpressure affects boiling temperature, with a decrease in boiling
Dow
nloa
ded
by [
Tex
as A
&M
Uni
vers
ity L
ibra
ries
] at
14:
23 0
9 Ja
nuar
y 20
14
172 R. ERGUN ET AL.
Figure 2 Boiling point elevation curves for different sucrose and dextroseconcentration (plotted from data provided by Pancoast and Junk, 1980).
temperature with a decrease in vapor pressure (Fig. 3). As wellunderstood by confectioners, boiling temperatures are reducedwhen cooking takes place under vacuum. However, even re-duced atmospheric pressure, whether caused by a low pressureweather system or from a manufacturing facility at high eleva-tions, can cause a significant reduction in boiling temperature.A confectioner who cooks to a specific temperature every daymay wind up with small variations in water content (up to 0.5%)due to normal variations in atmospheric pressure.
Colligative Effects of Confectionery Ingredients
Each of the ingredients used in confectionery formulationshas its own effect on water, dependent on the nature of theingredient and its concentration in the final product (Cakebread,1969). Typically, ingredients with lower molecular weight havethe most effect on reducing aw, through the colligative effect insolution, although other factors may moderate this effect.
For example, the solubility of an ingredient in water alsoimpacts its effectiveness at reducing aw. Components that arenot soluble or that do not mix with water, do not directly affectaw. Thus, emulsified fats, dispersed crystals, and many solid
Figure 3 Boiling point elevation under different pressure (drawn from dataprovided by Pancoast and Junk, 1980).
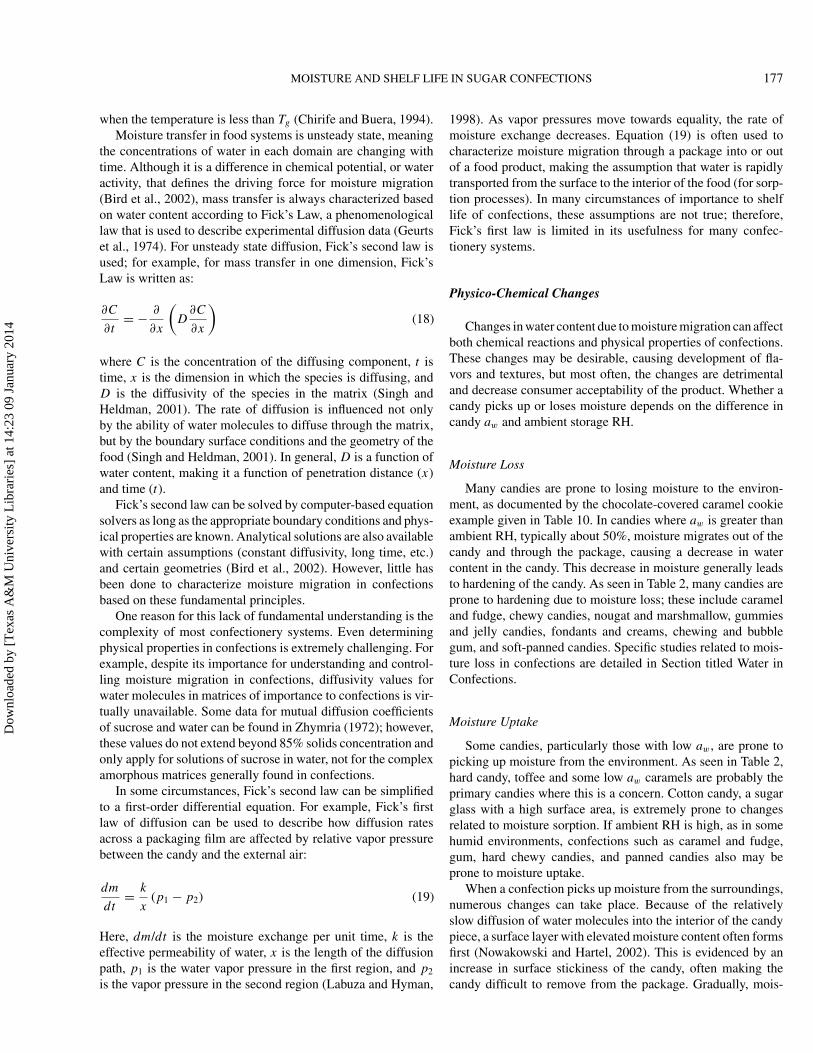
Table 6 Water activity (aw) of saturated solutions of confectioneryingredients at 25◦C (from Bussiere and Serpelloni, 1985)
particulates (e.g., starch granules) typically do not affect aw inconfections. In fondant, for example, it is the liquid phase thatgoverns water activity. Thus, the water content of the liquidphase, the dissolved solids concentration, and the nature of thesolutes (humectants, etc.) found in the liquid phase determineaw of fondant.
Ingredients with high solubility and low molecular weighthave the greatest effect on reducing aw. Aw values of com-mon confectionery ingredients at their maximum solubility atroom temperature are shown in Table 6. High molecular weightsoluble ingredients used in confections, such as proteins, hydro-colloids, and gums, generally have little effect on reducing aw.
A humectant is a substance that promotes retention of waterand helps to keep a confection moist. A humectant is typicallya molecule that contains hydroxyl groups with an affinity toform hydrogen bonds with molecules of water. Humectants alsotypically reduce aw of a confection. Common humectants usedin confections include corn syrups (especially high DE cornsyrups and high fructose corn syrup), invert sugar, fructose, glu-cose, and polyols (propylene glycol, glycerol, sorbitol, isomalt,lactitol, mannitol, maltitol, and maltitol syrups).
WATER MOBILITY
Water activity is an equilibrium thermodynamic descriptor;however, foods are rarely if ever in an equilibrium state sothat the measured properties of foods are time-dependent. Thisprinciple, in part, has led to the polymer science approach to fooddesign, the characterization of water in terms of its mobility,and use of the glass transition to better understand performance,stability, and shelf life of many foods (Slade and Levine, 1987;1991; Levine and Slade, 1988, 1992).
The definition of a glass was first proposed by Jones (1956) asany liquid or super-cooled liquid whose viscosity is higher than1013 Poise (note that other sources say 1012 Pa-s; Roos, 1995).Glasses are described as regions of matter characterized by alimited order arrangement of molecules (random, with no long-scale ordering) in contrast with a crystal, which has extendedregions of order (substantial long-range ordering), and a gas,which has no such regions. A glass transformation temperature,Tg , was defined as the temperature where the transformationfrom liquid to glass or vice versa takes place (White and Cake-bread, 1966), although we now recognize that this transitionusually takes place over a range of temperatures (Roos, 1995).
Dow
nloa
ded
by [
Tex
as A
&M
Uni
vers
ity L
ibra
ries
] at
14:
23 0
9 Ja
nuar
y 20
14
MOISTURE AND SHELF LIFE IN SUGAR CONFECTIONS 173
The importance of Tg to confections has been recognizedfor many years. For example, White and Cakebread (1966) dis-cussed the correlation between glass transition and the control ofmoisture in hard candy and other sugar-containing food productsover half a century ago. Yet, the application of Tg to understandand control moisture in food systems came with the polymerscience approach, as made popular in the mid-1980s by Sladeand Levine (1987, 1991).
Many foods, particularly dried foods and confections withlow water content, are in the amorphous metastable state, wherethe material lacks long-range molecular order. The amorphousphase can be divided into the glassy state and rubbery state.An amorphous glassy material has a high internal viscosity andlow internal mobility (Roos, 1995), whereas the rubbery statehas a viscous, more fluid-like state. The temperature (or rangeof temperatures) where the transition between glassy state anda more fluid-like rubbery state occurs is the glass transitiontemperature (Tg) (Kauzmann, 1948).
Tg has been proposed as a physicochemical parameter thatis an indicator of food properties, stability, and safety (Levineand Slade, 1992). Keeping any product at a temperature be-low Tg severely retards diffusion-based modes of deterioration.Above Tg , molecular mobility increases and viscosity decreases,which leads to time-dependent structural transformations suchas stickiness and collapse during food processing and storage(Roos, 1995). From a kinetic perspective, reactant moleculesmust exhibit a minimum degree of mobility to collide with, ori-ent toward and react with one another (Sherwin et al., 2002;Sherwin and Labuza, 2006), which occur only at dramaticallyreduced rates when the product is held below Tg .
The glass transition temperature depends on molecularweight, degree of cross-linking of polymer, and plasticizer (e.g.,water) concentration (Graaf et al., 1993). Carbohydrates withlow molecular weight generally have lower Tg , whereas thosewith high molecular weight generally have higher Tg (White and
Table 7 Glass transition temperature (Tg) of sweeteners(dry state) found in confectionery products
Sources: Roos and Karel (1991), Noel et al. (1991), Roos(1995), Fennema (1996), Raudonus et al. (2000).
Table 8 Effect of water content on glasstransition temperature (Tg) of sucrose
Water content (%) Tg (◦C)
0 691 612 503 424 355 29
Source: Nowakowski, 2000
Cakebread, 1966; Slade and Levine, 1991; Roos, 1995). Table 7shows Tg values for a variety of compounds important for con-fectionery manufacture, whereas Table 8 shows the strong effectof water content in decreasing Tg of sucrose. Only a few percentof water can cause a large decrease in the Tg of a confection.
When different sugars are mixed, as in most confectioneryformulations, Tg of the mixture depends on the relative ratiosof the sugars added, the Tg values of each sugar found in themixture, and, of course, the water content. According to Table 7,the Tg of 42 DE corn syrup solids is slightly higher than that ofsucrose so mixtures of the two sugars should have Tg somewherebetween those values (Table 9) and thus, addition of 42 DE cornsyrup causes the Tg of the mixture to increase slightly. Useof 20 DE corn syrup, however, generally causes a much moresignificant increase in Tg of the mixture (Nowakowski, 2000).
During cooking of sugar syrups, inversion of sucrose intoglucose and fructose often occurs. This mixture, according toTable 7 (which shows Tg values for the two components) has amuch lower Tg than sucrose, perhaps around 15◦C, which is avalue often cited for honey solids (Bhandari and Hartel, 2005).Thus, inversion of a confectionery syrup during cooking leadsto a decrease in Tg and thus, to reduced stability of the sugarglass.
Although it is widely accepted that molecular mobilitydecreases dramatically when a confection is held below itsTg , mobility does not decrease to zero, especially for smallermolecules like water (Fennema, 1996). In sugar glasses heldbelow their Tg , water still has substantial mobility. Levineand Slade (2002) discussed molecular mobility in terms ofthe concept of average Tg for mixtures of components. Themeasured Tg of a mixture should be considered the point wherea molecule with an average molecular weight of the system
Table 9 Glass transition temperatures (onset of calorimeter scan) for dry(less than 1%) corn syrup–sucrose mixtures (Gabarra and Hartel, 1998)
1Addition on a dry solids basis (g corn syrup solids/100 g total solids).2DE-dextrose equivalent.
Dow
nloa
ded
by [
Tex
as A
&M
Uni
vers
ity L
ibra
ries
] at
14:
23 0
9 Ja
nuar
y 20
14
174 R. ERGUN ET AL.
150
100
50
0
0 20 40 60 80 100
Boiling point
elevation
Sucr
ose
solu
bilit
y
Gl a
sstr
ansi
tion
Freezing pointdepression
DILUTE SOLUTION
SUGARCRYSTAL+ SOLUTION
ICE + SOLUTION
GLASS
Composition (wt %)
Tem
per
atu
re (
°C)
Figure 4 State diagram for pure sucrose-water binary system (from Hartel,2001).
would be immobilized. In mixtures of sugars with water, thewater molecule is significantly smaller than the sugars, so itwill have considerable mobility even when the temperature isslightly below Tg . Thus, even when a hard candy is maintainedat a temperature below Tg , penetration of water molecules intothe matrix can occur, albeit at a slow rate dependent on thedifference in storage temperature and Tg . Furthermore, flavormolecules in that same hard candy sugar glass also has somemobility even if the candy is held below the average Tg . Thearea of molecular mobility below Tg has a significant impact onthe shelf life and stability of amorphous or glassy candies likehard candy and deserves future attention to seek ways to limitflavor loss and moisture uptake of these confections.
To document what state of matter might be expected atdifferent temperatures and water contents, a state diagram isoften used. The state diagram combines the phase boundarylines for solute (solubility curve) and solvent (freezing pointcurve) in a binary system, with the glass transition conditionsuperimposed (Slade and Levine, 1991; Roos, 1995). A statediagram for sucrose-water is shown in Fig. 4 (Hartel, 2001).State diagrams determine the range of temperatures where aconfection with known moisture content can be safely stored(Roos, 1995), but also can be used to document the path ofprocessing steps on the state of a confectionery system (Hartel,2001).
MOISTURE TRANSPORT
A freshly packaged confectionery product undergoes watermigration as it seeks equilibrium among the various elements ofthe product (Cakebread, 1976). Figure 5 schematically showsthe types of exchange that can take place in a complex product.
If there are multiple regions within the product with differentwater activity, water will migrate between these regions until theaw values of all regions/domains are the same (equilibration).There is also moisture exchange with the air in any headspace
Figure 5 Moisture migration pathways for chocolate-covered candy bar sys-tem.
within the package. If the package is a perfect moisture barrier,the headspace attains a RH in equilibrium with the water inthe confection (ERH). However, moisture exchange through thepackage, between the headspace and outside air, also occurs, ata rate depending on the difference in RH between inside andout, and the barrier properties of the package material. Since ex-ternal storage conditions (temperature and RH) are continuallychanging, water migration out of (or in to) the product occurscontinuously throughout its shelf life.
Compare a commercial packaged chocolate-covered candybar made with caramel and a cookie over its shelf life(Table 10). Early in its shelf life (within one month of pro-duction), there was still a significant difference in water activitybetween the caramel and cookie. However, over time, the wateractivity values nearly equilibrated between caramel and cookie.Interestingly, under the conditions of storage in this experiment,the entire bar lost moisture through the package and the wateractivity of both components decreased significantly. Note thatthe aw values of both caramel and cookie decreased despite be-ing surrounded by chocolate, a relatively good water barrier. Notsurprisingly, the texture of this product changed dramatically,with the caramel getting hard and chewy (originally soft) andthe cookie becoming stale due to moisture loss.
To help understand changes in moisture content in confec-tionery products with multiple elements, it is important to un-derstand the sorption and desorption behavior of each element.Furthermore, the rate of exchange of moisture is governed by thethermodynamic driving force and ability of water molecules to
Table 10 Change in water activity of commercial, packagedchocolate-covered bar containing caramel and cookie (Hartel, unpublishedresults)
Water activity Early1 Aged2
Bar average 0.32 0.21Caramel 0.31 0.22Cookie 0.23 0.20
1Within one month of manufacture.2Stored for one year at about 22◦C and 40–55% relative humidity.
Dow
nloa
ded
by [
Tex
as A
&M
Uni
vers
ity L
ibra
ries
] at
14:
23 0
9 Ja
nuar
y 20
14
MOISTURE AND SHELF LIFE IN SUGAR CONFECTIONS 175
move through and between each element of the candy. The endof shelf life then depends on the rate of moisture migration andthe effect of water content on the physico-chemical propertiesof the candy.
Sorption/Desorption Curves
Sorption and desorption profiles for a food are generallycreated by graphing equilibrium moisture content (on a drybasis) versus water activity (aw) or relative vapor pressure (RVP)at constant temperature. These profiles are commonly known asmoisture sorption isotherms. Sorption curves show equilibriumrelations between water in the candy and the surrounding air,but do not give information about the rate of moisture exchange.
Traditionally, saturated salt solutions have been used to de-termine moisture sorption isotherms because they produce aconstant vapor pressure in the atmosphere above the solution atconstant temperature (Bell and Labuza, 2000). The vapor pres-sure is dependant on the salt being used as well as temperature.Saturated salt solutions tend to decrease relative vapor pressureas temperature increases because of increased solubility (Belland Labuza, 2000). Isotherms can be generated gravimetricallyby determining equilibrium moisture content over a range ofwater activities. Samples are held at constant relative humidityover different saturated salt solutions and allowed to equili-brate. Bell and Labuza (2000) recommend weighing samples atseven-day intervals until the moisture content does not fluctuateby more than two milligrams per gram dry matter. Methods ofdetermining the moisture content include oven drying (air, vac-uum, or microwave) as well as the Karl Fischer titration (seeSection titled Water Content Determination Methods). Once theequilibrium moisture content has been determined, dry basismoisture content is plotted versus water activity (or relativevapor pressure) to give the sorption isotherm.
New automatic methods, known as controlled atmospheremicrobalances, allow sorption isotherms to be generated usingvery small (milligram) samples (Bell and Labuza, 2000). Thesemachines use computers to measure change in mass of samplesat a given relative humidity enclosed in a microbalance. Whena defined equilibrium has been reached, the program automati-cally cycles to the next humidity and repeats the process (Belland Labuza, 2000). Because sample sizes are small, the samplemust be homogeneous. Other automatic systems measure largersamples at regular intervals by moving samples into a weighingcell at regular intervals. This system allows multiple productsto be used and relative humidity is changed in steps at weeklyintervals (Bell and Labuza, 2000).
Many foods show a sigmoidal-shaped isotherm, representedby the Type II isotherm in Fig. 6. The Type I isotherm is seenin anti-caking agents that hold large amounts of moisture at lowaw where moisture binds strongly to the ingredients and fillsnonswelling cavities (Bell and Labuza, 2000). Some amorphouscarbohydrates also show Type I isotherms. Sugar glasses, likehard candy and cotton candy, are extremely hygroscopic and
Moi
stur
e C
onte
nt (
g H
20/1
00 g
sol
ids)
0.2 0.4 0.6 0.8
Water Activity
15
0
30
Type I
Type II
Type III
CrystallineSucrose
Figure 6 Common moisture sorption isotherms (adapted from Bell andLabuza, 2000).
follow Type I isotherms. Iglesias et al. (1997) found that thesorption isotherm of freeze-dried amorphous trehalose followedType-1 sorption behavior.
Foods with high levels of small, soluble molecules and smallamounts of polymeric compounds may exhibit a Type III curve(Fennema, 1996). Many candies, including caramel, fudge, andnougat may have sorption isotherms that follow either Type IIor Type III behavior. Hadjikinova et al. (2003) found Type IIIsorption curves for sugar-free hard candies made with sorbitoland isomalt.
For pure crystalline ingredients (e.g., sucrose), moisture isonly able to interact by hydrogen bonding at the surface of thecrystal (Bell and Labuza, 2000) since the packing arrangementof the crystal lattice excludes foreign molecules such as water.Thus, moisture content remains low and nearly constant until aw
is high enough to cause dissolution of the crystal surface (Fig. 6)at the deliquescent point (Bell and Labuza, 2000). Above thisrelative humidity, water is able to dissolve the crystal and themoisture content increases quickly.
Principles of Moisture Migration
For moisture to move within a system, there needs to be adriving force, or a difference in the thermodynamic state of thewater that causes water to migrate from one state to anotherto allow equilibration. The thermodynamic driving force is ex-pressed in terms of a difference in chemical potential, µ, ofwater between two regions. However, since chemical potentialis not easily measured, a difference in water activity is generallyused to characterize the driving force for moisture migration(Labuza and Hyman, 1998).
The rate at which moisture migrates from one region of afood to another is dependent on the magnitude of the drivingforce and the ability of water molecules to move from the regionof higher water activity to the region of lower water activity. Thegeneral equation that governs the rate of moisture migration can
Dow
nloa
ded
by [
Tex
as A
&M
Uni
vers
ity L
ibra
ries
] at
14:
23 0
9 Ja
nuar
y 20
14
176 R. ERGUN ET AL.
be written as:
Rate = Driving Force
Sum of Resistances(14)
The driving force for moisture migration is related to the dif-ferences in water activity between two domains with the candyand the RH of the surrounding air. The resistances to moisturemigration are related to how fast water molecules move eitherthrough the candy matrix or the package in which the candy iscontained. Diffusion of liquid water is the primary mechanismof moisture migration within confections, although other mech-anisms (vapor diffusion, capillary flow, etc.) may play a role attimes. For packaging materials, the rate of water vapor diffusiongoverns the resistance to water migration.
Driving Force
When a material is in equilibrium, no net chemical reactionsor exchange of material occurs. Any change in the energy of thesystem can be expressed by the change in Gibbs free energy,dG:
dG = −SdT + V dP +∑
i
µidni (15)
Here, S is entropy, T is temperature, V is volume, P is pressure,µi values are chemical activities of each species (water, sucrose,etc.), and ni are molar concentrations of those component ingre-dients. At equilibrium, dG= 0 for a system and no net exchangeof any species within the system occurs. For equilibrium, thechemical potential of each species must be constant and in asystem with two regions (e.g., a multi-domain confection as di-agrammed in Fig. 5), the chemical potentials of each species ineach domain must be constant (Levine, 1995; Bird et al., 2002).
Chemical potential is often defined in terms of activity of aspecies, say water, as:
µw = µow + RT ln(aw) = µo
w + RT ln(pw
/po
w
)(16)
where, µw is the chemical potential of water, µow is a reference
chemical potential, R is the ideal gas law constant, T is thetemperature, aw is water activity, pw is the partial water vaporpressure above the food and po
w is the vapor pressure of purewater (Labuza and Hyman, 1998). This approximation assumesthat the system exhibits ideal solution behavior, something thatis certainly not true in most, if not all, confections. Despitethis shortcoming, the water activity, or relative vapor pressureis often used to describe chemical potential and equilibrium infoods. Thus, if the domains diagrammed in Fig. 4 are all atequilibrium with each other, then the water activities of eachdomain must all be the same.
If the system is not in chemical equilibrium, meaning thechemical potential of any species is not equal across domains,material transfer occurs until equilibrium is reached. In the case
of moisture, if the water activities of the different domains arenot equal, there will be a driving force for moisture migrationbetween domains; however, transport of salts, lipids, flavors, andother components across the domains follows the same generalprinciples.
Mechanisms
Mechanisms for moisture migration differ slightly for sorp-tion and desorption. In the case of sorption of moisture into aproduct from humid air, the steps involve first moisture adsorp-tion onto the surface polar sites followed by penetration (bydiffusion or some other mechanism of mass transfer) into thecandy matrix. When a product loses moisture to dryer air, thewater simply moves through the candy matrix (again by diffu-sion or some other mass transfer mechanism) until it reaches thesurface, where it is removed by air convection.
Adsorption of Moisture to the Food Surface. As moisture isadded to a dry food product, adsorption first occurs at accessible,polar surface sites. This moisture is strongly bound and haslittle mobility. Monolayer coverage is reached when all of thepolar surface sites are associated with a single layer of moisture(Fennema, 1996). The value for monolayer moisture contenthas been observed to decrease with increasing temperature, asdocumented by Iglesias and Chirife (1984)
ln (Xm) = β + αT (17)
Here, Xm represents the monolayer moisture content on a drybasis (g water/100 g dry solid) and temperature, T (◦C). α andβ are parameters that are calculated from least squares analysisof a plot of ln(Xm) versus T . This equation has been used toestimate monolayer moisture content between 5–60◦C for meatsand starchy foods (Iglesias and Chirife, 1984).
Above the monolayer value, moisture first adsorbs to remain-ing available surface sites by hydrogen bonding. This moistureplasticizes solutes and many reactions accelerate as the reac-tant mobility increases. Once a complete monolayer has beenformed, further adsorption creates a bulk phase. This mois-ture can be frozen, decreases viscosity, and supports microbialgrowth (Fennema, 1996).
Moisture Transport Rates. Diffusion is the main mechanismfor moisture transfer in most food systems. The rate of diffusionis dependent on the structure and chemical characteristics ofeach component. Diffusion depends on the concentration ofdiffusing species, temperature, and the properties of the matrixthrough which diffusion is occurring (Guinee and Fox, 2004).Porosity of the structural elements through which diffusionoccurs and the local viscosity of the adsorbed aqueous phase areimportant factors that affect the rate of diffusion (Labuza andHyman, 1998). In amorphous systems such as hard candies andlow water content caramels, diffusion rates differ depending onwhether the matrix is in the glassy or rubbery state. In the glassystate, molecular mobility is severely limited and therefore,diffusion-limited processes or reactions occur at lower rates
Dow
nloa
ded
by [
Tex
as A
&M
Uni
vers
ity L
ibra
ries
] at
14:
23 0
9 Ja
nuar
y 20
14
MOISTURE AND SHELF LIFE IN SUGAR CONFECTIONS 177
when the temperature is less than Tg (Chirife and Buera, 1994).Moisture transfer in food systems is unsteady state, meaning
the concentrations of water in each domain are changing withtime. Although it is a difference in chemical potential, or wateractivity, that defines the driving force for moisture migration(Bird et al., 2002), mass transfer is always characterized basedon water content according to Fick’s Law, a phenomenologicallaw that is used to describe experimental diffusion data (Geurtset al., 1974). For unsteady state diffusion, Fick’s second law isused; for example, for mass transfer in one dimension, Fick’sLaw is written as:
∂C
∂t= − ∂
∂x
(D
∂C
∂x
)(18)
where C is the concentration of the diffusing component, t istime, x is the dimension in which the species is diffusing, andD is the diffusivity of the species in the matrix (Singh andHeldman, 2001). The rate of diffusion is influenced not onlyby the ability of water molecules to diffuse through the matrix,but by the boundary surface conditions and the geometry of thefood (Singh and Heldman, 2001). In general, D is a function ofwater content, making it a function of penetration distance (x)and time (t).
Fick’s second law can be solved by computer-based equationsolvers as long as the appropriate boundary conditions and phys-ical properties are known. Analytical solutions are also availablewith certain assumptions (constant diffusivity, long time, etc.)and certain geometries (Bird et al., 2002). However, little hasbeen done to characterize moisture migration in confectionsbased on these fundamental principles.
One reason for this lack of fundamental understanding is thecomplexity of most confectionery systems. Even determiningphysical properties in confections is extremely challenging. Forexample, despite its importance for understanding and control-ling moisture migration in confections, diffusivity values forwater molecules in matrices of importance to confections is vir-tually unavailable. Some data for mutual diffusion coefficientsof sucrose and water can be found in Zhymria (1972); however,these values do not extend beyond 85% solids concentration andonly apply for solutions of sucrose in water, not for the complexamorphous matrices generally found in confections.
In some circumstances, Fick’s second law can be simplifiedto a first-order differential equation. For example, Fick’s firstlaw of diffusion can be used to describe how diffusion ratesacross a packaging film are affected by relative vapor pressurebetween the candy and the external air:
dm
dt= k
x(p1 − p2) (19)
Here, dm/dt is the moisture exchange per unit time, k is theeffective permeability of water, x is the length of the diffusionpath, p1 is the water vapor pressure in the first region, and p2
is the vapor pressure in the second region (Labuza and Hyman,
1998). As vapor pressures move towards equality, the rate ofmoisture exchange decreases. Equation (19) is often used tocharacterize moisture migration through a package into or outof a food product, making the assumption that water is rapidlytransported from the surface to the interior of the food (for sorp-tion processes). In many circumstances of importance to shelflife of confections, these assumptions are not true; therefore,Fick’s first law is limited in its usefulness for many confec-tionery systems.
Physico-Chemical Changes
Changes in water content due to moisture migration can affectboth chemical reactions and physical properties of confections.These changes may be desirable, causing development of fla-vors and textures, but most often, the changes are detrimentaland decrease consumer acceptability of the product. Whether acandy picks up or loses moisture depends on the difference incandy aw and ambient storage RH.
Moisture Loss
Many candies are prone to losing moisture to the environ-ment, as documented by the chocolate-covered caramel cookieexample given in Table 10. In candies where aw is greater thanambient RH, typically about 50%, moisture migrates out of thecandy and through the package, causing a decrease in watercontent in the candy. This decrease in moisture generally leadsto hardening of the candy. As seen in Table 2, many candies areprone to hardening due to moisture loss; these include carameland fudge, chewy candies, nougat and marshmallow, gummiesand jelly candies, fondants and creams, chewing and bubblegum, and soft-panned candies. Specific studies related to mois-ture loss in confections are detailed in Section titled Water inConfections.
Moisture Uptake
Some candies, particularly those with low aw, are prone topicking up moisture from the environment. As seen in Table 2,hard candy, toffee and some low aw caramels are probably theprimary candies where this is a concern. Cotton candy, a sugarglass with a high surface area, is extremely prone to changesrelated to moisture sorption. If ambient RH is high, as in somehumid environments, confections such as caramel and fudge,gum, hard chewy candies, and panned candies also may beprone to moisture uptake.
When a confection picks up moisture from the surroundings,numerous changes can take place. Because of the relativelyslow diffusion of water molecules into the interior of the candypiece, a surface layer with elevated moisture content often formsfirst (Nowakowski and Hartel, 2002). This is evidenced by anincrease in surface stickiness of the candy, often making thecandy difficult to remove from the package. Gradually, mois-
Dow
nloa
ded
by [
Tex
as A
&M
Uni
vers
ity L
ibra
ries
] at
14:
23 0
9 Ja
nuar
y 20
14
178 R. ERGUN ET AL.
ture migrates into the interior of the candy, causing softening ofthe matrix due to the elevated water content. Water acts as a plas-ticizer and Tg decreases as the moisture content increases (Roosand Karel, 1991). The increased water content and reduction inTg of the candy matrix enhances mobility of all molecules thatmake up the confection. Flavor molecules, which may have beentrapped within the amorphous candy matrix prior to moisturesorption, now have sufficient mobility to diffuse out of the candymatrix. This leads to candies with reduced flavor, in addition tothe physical softening.
In cotton candy and certain hard candies, the enhanced mo-bility due to decreased Tg often leads to crystallization of thesucrose unless sufficient crystallization inhibitors are presentin the formulation. Graining, or sugar recrystallization, causessubstantial change in hard candy confections (Lees, 1965). Assugar crystals form, the water content of the liquid phase sur-rounding the crystal increases in water content due to the ex-clusionary process of forming the crystal lattice. This increasedlocal moisture content causes a change in moisture dynamics.Moisture continues to penetrate into the candy matrix ahead ofthe crystallizing front. In the crystallizing region, however, theincreased water activity causes moisture to migrate back outinto the air, resulting in a net loss in weight. Makower and Dye(1956) and Palmer et al. (1956) documented the initial moistureuptake of a sugar glass followed by moisture loss after initiationof graining. Graining also leads to concentration of flavors inthe crystallization zone followed by rapid flavor loss (Levi andKarel, 1995).
7 SHELF LIFE
Shelf life is the length of time that a food maintains anacceptable level of quality. The end of shelf life for a foodproduct is characterized by the presence of undesirable physico-chemical qualities or microbial levels. As noted in the previoussection, moisture affects both physical and chemical attributesthat determine shelf life, including crystallization, glass transi-tion, and rate of enzymatic or non-enzymatic reactions. Addi-tionally, the water activity of a food system affects the growthof bacteria, mold, and yeasts that may cause spoilage or safetyconcerns.
Although Table 2 gives the general range of aw values forvarious confectionery categories, whether a candy dries out orpicks up moisture is determined by the relative values of aw andstorage conditions. Furthermore, the rate of moisture migration,which ultimately determines shelf life, depends on how easilywater molecules move through the candy matrix and packagingsystem. Thus, it is important to understand how these factors af-fect the rate of moisture migration (see Section titled MoistureTransport). In this section, methods for measuring shelf life, in-cluding accelerated tests, will be discussed along with methodsof enhancing shelf life.
Shelf Life Measurement
Although not the only mode of failure for confections, mois-ture migration is arguably the major determinant in the end ofacceptable shelf life for many confections. Thus, shelf life test-ing in confections often evaluates changes in physico-chemicalproperties related to moisture changes. Shelf life testing mayincorporate either sensory or analytical methods, or may com-bine multiple types of tests. Ultimately, shelf life is defined asthe time when the consumer no longer finds the confection ac-ceptable, so sensory testing is almost always incorporated intoshelf life testing protocols.
Confections that tend to change in hardness can be tested dur-ing storage using texture profile analysis (TPA). This methoduses a two-cycle compression test to compile force data dur-ing compression (Nielsen, 2003). The data can be correlatedwith hardness or the point where the product fractures. Baianoand Del Nobile (2005) studied hardness in almond paste prod-ucts during storage. The study was conducted under acceleratedconditions (37◦C) meant to simulate worst-case conditions forstorage. Hardening was the limiting factor in the shelf life ofthe almond paste products. A sensory panel test was used todetermine maximum acceptable hardness. This correlated to amaximum force of 25 N on a texture analyzer. The length of ac-ceptable shelf life was determined as the length of time in whichthe maximum compression force remained under 25 N (Baianoand Del Nobile, 2005). Hardness testing could also be used withconfections that soften or lose crispness during storage.
Stickiness is a physical condition that is related to cohesiveforces within the confection and adhesive forces between differ-ent materials such as a hard candy and its wrapper (Nowakowski,2000). Stickiness can be measured by mechanical texture anal-ysis as both adhesion from touching a material (tack) as well asfrom peeling two materials apart (peel) (Nowakowski, 2000).Results showed an increase in stickiness with increased moisturecontent to a maximum dependent on the corn syrup composition.Above the maximum, stickiness decreased as additional mois-ture reduced cohesion. Nowakowski (2000) also determined thatpeel force was higher in sugar glasses with a high ratio of cornsyrup to sucrose.
Accelerated Shelf Life Studies
Accelerated shelf life studies are conducted by changing thestorage conditions to hasten the deteriorative processes that oc-cur during storage. In confections, elevated temperatures andhumidities are often used to enhance product degradation in ac-celerated shelf life tests. A product with a one-year shelf lifemay be evaluated under accelerated storage conditions withinperhaps a month in certain circumstances.
However, it is often difficult to extrapolate the results froman accelerated study to normal shelf life conditions. Empiricalrelationships are usually developed to correlate accelerated con-ditions with normal storage conditions. For example, one weekat accelerated storage conditions may correlate to four weeks of
Dow
nloa
ded
by [
Tex
as A
&M
Uni
vers
ity L
ibra
ries
] at
14:
23 0
9 Ja
nuar
y 20
14
MOISTURE AND SHELF LIFE IN SUGAR CONFECTIONS 179
normal storage. However, these correlations are almost alwaysproduct specific, and caution must be exercised when extrapo-lating from one product and formulation to another.
Increasing temperature is often used to change the rates ofreactions in accelerated storage studies. A general rule of thumbis that an increase of 10◦C generally causes a doubling of re-action rates (Taub and Singh, 1998); however, not all reactionsfollow this general rule. Fluctuating temperatures generally alsoenhance physico-chemical changes, including moisture migra-tion. Since many rates of reactions and physical processes in-crease exponentially with temperature (e.g., the Arrhenius equa-tion), the average reaction rate under cycling temperatures isslightly higher than the reaction rate at the equivalent aver-age temperature of the thermal cycles. Thus, cycling tempera-tures promote more rapid degradation than holding at constanttemperatures.
Rates of moisture migration also can be manipulated bychanging the relative humidity at which the product is stored. Forexample, storage of hard candy at elevated humidity (75–80%)accelerates moisture migration through the package and signif-icantly decreases shelf life, whereas storage at dry conditions(20–30% RH) promotes drying of candies like marshmallowand fudge. However, there is little public domain informationregarding how well these studies correlate with shelf life undernormal conditions.
A major caveat in all accelerated storage studies is that themode of deterioration at the accelerated conditions must be thesame as the mode of deterioration under normal conditions. Itdoes little good, for example, to study shelf life of hard candydue to graining under accelerated conditions if it is loss of flavorthat limits shelf life at normal conditions. Therefore, predictionsfrom accelerated studies may not always be reliable for complexsystems (Hough et al., 2006).
Extending Shelf Life of Confections
Equation (14) can provide a guide for designing strategiesto reduce the rate of moisture migration and extend shelf life.The rate of moisture migration can be reduced, and shelf life ex-tended, by either decreasing the driving force for water transportor increasing the resistance to migration.
Decreased Driving Force
One approach to reducing moisture migration is to removethe driving force, or difference in water activity between tworegions in a multi-domain confection or between the candy andthe air. However, since water content plays such an importantrole in textural properties of confections, it is often difficult tomanipulate water activity to reduce the driving force for mois-ture migration. In the caramel covered cookie example usedpreviously, it may not be possible to design a soft caramel withsufficiently low aw and/or a crisp cookie with sufficiently highaw to completely prevent moisture migration over time. How-ever, through manipulation of formulation to change aw of either
or both component, sufficient change in the driving force maybe possible to extend shelf life, at least to some extent.
To manipulate aw of a formulation, humectants are oftenemployed. Addition of ingredients with a high affinity for water,such as invert sugar, organic acids, glycerol, etc., can reducewater activity, while maintaining product textural qualities. Forexample, replacement of a portion of the sucrose or corn syrupwith a humectant in the caramel example above might reducewater activity without negatively affecting texture.
Increased Resistance to Moisture Migration
In the chocolate-covered caramel and cookie product de-picted in Fig. 4, water migrates from caramel into cookie inaddition to migrating through the chocolate coating and pack-age layer into the surrounding air. The rate of moisture migrationinto and through each component of this confection depends onthe diffusivity of water molecules through each matrix. The dif-fusivity of water molecules into the porous cookie structure willbe different from diffusivity through the caramel.
One approach to increasing the resistance to moisture trans-port (decreasing diffusivity) is to manipulate the structure ofeach part of the candy matrix. Since diffusivity generally de-creases with decreasing water content, a denser matrix at lowermoisture content might be sufficient to reduce mass transfer ratesand increase shelf life. Unfortunately, no methods to modifycandy structure without negatively affecting textural propertieshave been published.
Another approach to reducing the rate of moisture migra-tion is to protect hygroscopic elements within the candy matrix.For example, fruit acids such as citric and tartaric acids arehygroscopic and using high levels in a food to create a char-acteristic sour flavor can result in increased driving force formoisture migration. Corriveau et al. (2003) patented a processto minimize the effect of a high acid level in confections. Themethod involved completely or substantially encasing the hy-groscopic ingredient by locating it between two layers of theconfection itself. While this idea can be extrapolated to otherhygroscopic ingredients, the confection must be significantlyless hygroscopic than the entrapped component and the levelof addition must be low enough that it is not detrimental toconsumer acceptance.
Yet another method to reduce moisture migration is throughuse of appropriate barrier layers. This includes the packaginglayer, which protects the candy from the ambient air, and ediblebarriers, which slow moisture migration between domains withdifferent water activities. Edible barriers and packaging layerscan extend shelf life by reducing the rate of moisture migration,but often cannot completely prevent moisture from moving be-tween components and into the surrounding air. For example,in Table 10, both the caramel and cookie layers lost moisturedespite being surrounded by a chocolate layer, which acts as awater barrier, and a packaging barrier.
Packaging. Packaging has many roles in determining theshelf life of a food. Physically, packaging acts as a barrier to
Dow
nloa
ded
by [
Tex
as A
&M
Uni
vers
ity L
ibra
ries
] at
14:
23 0
9 Ja
nuar
y 20
14
180 R. ERGUN ET AL.
prevent contamination by undesirable microorganisms or dirt.Different packaging materials can also preserve the environmentwithin the package by being selectively permeable to moleculessuch as oxygen or water. Other materials may be designed tokeep light out, slowing the rates of some reactions in the food.Accordingly, packaging costs can range from low to greater thanthe cost of the food itself depending on the level of technologyneeded.
The ability of a packaging material to protect the food productagainst moisture migration is largely dependant on the material’spermeability and the ability to seal it properly. Permeability in-volves dissolution and diffusion of the molecules through thepackage layer. Permeability is dependant on the type of vapor,packaging material, vapor pressure, temperature, and interac-tions of the vapor with the material itself (Sacharow, 1968). Thedegree of crystallinity and symmetry of the material also af-fect permeability. Greater degree of order and structure reducesthe ability of a molecule to permeate the packaging material.While thickness is not a direct indicator of permeability whencomparing different packaging materials, increasing thicknessgenerally decreases permeability for any given packaging.
Although the type of packaging being used is important tomoisture migration properties, how the confection is packagedis equally as important. The packaging should cover the entiresurface of the candy and be completely sealed at all edges. Gapsat the edges of the packaging due to twist-wrapping or cuttingthe edges too short provide open areas for moisture migrationor other contamination.
Polymer films and composites. Polymer films such aspolyethylene, polypropylene, and polyvinyl chloride are com-mon packaging materials for confectionery products. Thesefilms can be manufactured to be transparent, allowing consumersto see the product before purchase. Polymer films also are lightweight, can be sandwiched with other packaging materials aslaminates, and can be formed in many ranges of strength andflexibility. Permeability to moisture and gases is dependent onthe chemical composition of the individual film as well as filmthickness.
Baiano and Del Nobile (2005) compared moisture loss andhardening of almond paste (marzipan pastries) through twomulti-layer polymer films containing either a layer of ethylene-vinyl alcohol (EVOH) or nylon. The EVOH film had betterbarrier properties for both moisture and oxygen, and shelf lifeof the almond paste was extended by 0.5 months by using EVOHrather than nylon.
Polymer-coated papers or films are becoming popular pack-aging materials due to their light weight and biodegradability.While aluminum foil has been the traditional wrapping materialto protect chocolate bars, coated papers are being created withspecific properties such as resistance to grease and low oxygenpermeability (Anonymous, 1998). Chewing gum, chewy candysuch as taffy, and chocolates are often packaged using coatedpapers.
Metal foils. Metal foils such as aluminum or tin have beena traditional wrapping material for chocolate and other con-
fections due to their low permeability in comparison to manyplastic wrappings (for similar thicknesses). Foil has good barrierproperties for water vapor and other gases as well as light. Themain path of moisture transmission in foil is through pores—small holes that allow direct movement of moisture. Althoughno work has been published on confections, a study by Allinsonet al. (2001) demonstrated foil’s ability to preserve the activityof a moisture-sensitive pharmaceutical compound during stor-age. Aluminum foil blister packages (12 mil thick) were com-pared to polyvinyl chloride (PVC), Aclar (laminated PVC), andcyclic olefin blister packages as well as high-density polyethy-lene (HDPE) bottles. The foil maintained 100% assay of theactive ingredient over a six-month period at 75% RH. How-ever, aluminum foil is more expensive than polymer films andis generally reserved for purposes requiring a nearly completebarrier to moisture, gases, or light. Lack of strength at low thick-nesses is also a disadvantage as small tears in the foil reduce theeffectiveness of the barrier.
Edible coatings as moisture barriers. Edible coatings orfilms are often used as protective barriers against moisture mi-gration in foods. The coatings can either be used on the surfaceof the product to prevent moisture uptake from the environmentor placed between regions of varying water activities within theconfection. Lipid-based films are often used due to their goodwater vapor barrier properties, however, protein and cellulose-derived coatings have also been developed as moisture barriers.
Lipid-based edible film technology. Lipid-based coatings orfilms may be used to prevent or slow transfer of moisture intoor out of a confection or between two different domains (e.g.,cookie and caramel). Coatings composed purely of lipids maybe used, although composites containing both lipids and hydro-colloids may be formed to create more fracture-resistant films.Unfortunately, the hydrocolloids themselves may attract andbind moisture, reducing barrier effectiveness over time. Mois-ture adsorption is accelerated when the hydrophilic materialsare in contact with product regions having water activity greaterthan 0.75 (Loh and Hansen, 2002).
Lipids containing saturated fatty acids (i.e., stearic andpalmitic acid) are often used in composite films since the sat-urated fatty acid chains assemble in a more uniform crystalpacking arrangement to make a better water barrier. Also, byincreasing chain length, the melting point increases and molec-ular mobility decreases (Greener and Fennema, 1992). However,since pure fatty acid mixtures are difficult to obtain in nature,natural oils or animal fats are often used. Because of their flu-idity, oils are generally hydrogenated or combined with otherfatty acids to create coatings. Haynes et al. (2004) described abakeable lipid-based film made up of a highly crystalline fat, acrystalline carbohydrate, and a crystalline food fiber. The crys-talline fat was less able to migrate during baking or storage andits structure provided an effective moisture barrier. The carbohy-drate reduces the amount of lipid needed to coat the surface of thefood product, while the fiber increases flexibility and strength.Loh and Hansen (2002) formulated an oven-stable lipid barrierby milling a low-melting oil (melting point less than 35◦C) with
Dow
nloa
ded
by [
Tex
as A
&M
Uni
vers
ity L
ibra
ries
] at
14:
23 0
9 Ja
nuar
y 20
14
MOISTURE AND SHELF LIFE IN SUGAR CONFECTIONS 181
a high melting fat (melting point about 70◦C) at a tempera-ture between their two melting points. The resulting cream-typemixture was then applied between two product regions of differ-ent water activities to form a continuous barrier approximately10 µm thick. The crystalline structure was resistant to fractur-ing, but the thickness was found to be imperceptible to taste.
Waxes, shellacs, sucrose fatty acid esters, and acetoglyc-erides also may be used as lipid-based moisture barriers. Waxescontain many hydrophobic compounds and are often used tocoat fruits, vegetables, or candies. Generally, waxes need to beapplied using oil-in-water emulsions or petroleum solvent mix-tures. Shellac, also known as confectioners’ glaze, is often usedto coat or provide shine on candies; however, the brittleness ofshellac generally limits its use (e.g., panned candies). Sucrosefatty acid esters also have been used to reduce moisture migra-tion in fruits, vegetables, and starchy snack foods, although havenot been tried on confections (in the published literature). Ace-toglycerides are created by acylating glycerol monostearates(Greener and Fennema, 1992). The resulting films are flex-ible and have been used to increase plasticity of wax coat-ings. Guillard et al. (2003) studied the effectiveness of acylatedmonoglyceride films for preventing moisture migration betweenhigher and lower water activity food domains. Compared to darkchocolate and wheat gluten films, the acetoglycerides were moreeffective as moisture barriers by reducing water solubility. Addi-tionally, by increasing the degree of acylation, the film’s affinityfor moisture decreased.
Chocolate or compound coatings are often used in the con-fectionery industry to coat candy centers and prevent moisturemigration. Guillard et al. (2003) measured moisture migrationthrough dark chocolate as an edible film. They formed filmsfrom a tempered mixture of dark chocolate and cocoa butter,and determined moisture sorption isotherms for the chocolate inan agar gel/sponge cake system. At water activity levels greaterthan 0.80, the moisture isotherm of dark chocolate increasedsharply, perhaps indicating interactions between water and smallnonlipid molecules (such as sugar) in the chocolate. Biquet andLabuza (1988) also studied the moisture permeability character-istics of chocolate films as edible moisture barriers. They pro-duced films as thin as 0.6 mm and studied the moisture sorptionand desorption isotherms. Their sorption curves displayed hys-teresis, which may be attributed to the starch in the cocoa solids(Biquet and Labuza, 1988). Antunes and Antunes (2000) studiedBiquet and Labuza’s (1988) data and found that moisture ad-sorption of the chocolate films showed nonlinear behavior. Thechocolate films showed maximum moisture content between 20and 40 days of storage in the humid environment before decreas-ing and finally reaching equilibrium at 60 days. They suggesteda concentration dependence of the diffusion coefficient and alsodetermined that the concentration of moisture at the external filmboundary was dependent on both the material and the relativehumidity of the storage environment. However, these experi-ments were based on one-dimensional moisture migration. Thechocolate films were placed horizontally on a nonabsorbent sur-face and moisture could only move in one direction, which may
not be applicable to multi-domain coated products such as achocolate-coated candy centers or cookies.
Edible protein films. Protein films may also be used as ed-ible and biodegradable coatings. Guillard et al. (2003) studiedwheat gluten as a moisture migration barrier in their sponge-cakeand agar gel system. Wheat gluten films had similar moisturesorption to the sponge-cake. However, the wheat gluten haddecreasing effective diffusivity at increasing moisture content.Diffusivity decreased from 0.21*10−11 m2/s to 0.01*10−11 m2/sas moisture content increased from 17 g/100 g wet basis to 54 g/100 g wet basis. They were unable to explain this behavior andsuggested the physical and chemical structure of wheat glutenneeds further studying.
Milk whey protein films have also been studied for use ascoatings. However, since whey proteins are hydrophilic, inter-actions with water decrease the effectiveness of these films asmoisture barrier. Yoshida et al. (2002) studied moisture sorptionof whey protein films over time. They found a linear diffusionmodel could be fitted to the adsorption of the whey protein filmsat 75% RH. The researchers suggested a possibility of nonlin-ear effects (similar to those seen in Biquet and Labuza’s (1988)chocolate film experiments) during a long storage period.
Cellulose-derived coatings. Cellulose and its chemically-derived ethers and esters are becoming popular ingredients inedible film technologies. Methyl cellulose is often chosen for itssolubility in water and good film-forming properties as well asmoderate barrier properties to water and oxygen (Maftoonazadand Ramaswamy, 2005; Bravin et al., 2005). Plasticizers forsoftening methyl cellulose films include glycerol (Maftoonazadand Ramaswamy, 2005; Bravin et al., 2005) and polyethyleneglycol (Debeaufort et al., 1994).
Methods of applying the film depend on the type of appli-cation. Bravin et al. (2005) formed methyl cellulose-starch andmethyl cellulose-starch-lipid emulsions and applied the films tocrackers by spray drying (2 and 3.5 bar pressure) and spreading.Spray drying at 2 bar produced the lowest permeability for theoil-free coating. Conversely, the addition of 20% oil statisticallyreduced (p < 0.05) water vapor permeability for both methodswith spreading producing the lowest permeability. By observingenvironmental scanning electron microscopy images of coatingcross-sections, the researchers observed large cavities within thestructure of the spray-dried film at 3.5 bar. They hypothesizedthat the high surface tension of the droplets may have preventedproper aggregation on the surface of the cracker and createdwater vapor diffusion pathways. However, both types (oil andoil-free) of films and application methods (spreading and spray-drying) increased the shelf life of the crackers in comparison touncoated samples at 65 to 85% relative humidity.
WATER IN CONFECTIONS
The nature of water in confections depends on many fac-tors, including the ingredients used in the formulation and theconditions used in processing. These factors affect the physical
Dow
nloa
ded
by [
Tex
as A
&M
Uni
vers
ity L
ibra
ries
] at
14:
23 0
9 Ja
nuar
y 20
14
182 R. ERGUN ET AL.
state of the matrix, the texture of the product and its stabilityduring storage. In this section, the nature of water in a varietyof candy products is discussed along with the effects of differ-ent ingredients used in these confections. Any recent studies onwater-related properties are highlighted, although limited tech-nical work has been published on many candy categories.
Hard and Candies
Hard candies are subcooled, highly supersaturated sugar so-lutions that have such a high viscosity they are in the glassystate (Kitt, 1993; Jeffery, 2001). Lollipops, candy canes, med-icated confections (cough drops), soft-centered sweets, peanutbrittle, and laminated or honeycombed sweets are examples ofhard candy. They are made with glucose (corn) syrups, sucrose,and other sugars as well as colors, flavors, and acids (Jackson,1995). Commonly used ratios of sugar to corn syrup are 70:30for basic hard candies or 45:55 for center-filled co-extrusions(Jackson, 1995). The sugars and corn syrup are dissolved inwater and boiled to very high temperatures (295–305◦F; 147–152◦C) to give very low moisture content. The syrup is allowedto cool until it reaches a plastic (amorphous) state. The flavors,colors, and acids are then added to the candy mass before it isformed into the desired shapes and cooled to room temperature(Minifie, 1999). Equilibrium relative humidity (ERH) values ofhard candies are 26–32% (Jackson, 1995) and the moisture con-tent is 1–3% (Kitt, 1993), although commercial products oftenhave water content between 3 and 5%, depending on conditionsand time of storage.
Table 11 shows the water content and water activity of a va-riety of commercial hard candies directly from the supermarket(Nowakowksi, 2000). Exactly how long or under what condi-tions these products had been stored is not known; the datasimply provide a snap shot of moisture content at the point atwhich these commercial samples were analyzed. Typically, wa-ter content was above 3%, and often well over 4%, with glasstransition temperatures as low as 26◦C (79◦F). Despite the lackof details on these candies, Table 11 provides some interestinginformation regarding hard candy stability.
Stability of hard candy is related to its glass transition tem-perature, which is determined by the types of sweeteners usedand the water content (Gabarra and Hartel, 1998; Nowakowskiand Hartel, 2002; Smidova et al., 2004). Sweeteners with high
Table 11 Water content and glass transition temperatures (Tg) ofcommercial hard candies (Nowakowski, 2000)
molecular weight, like 42 DE corn syrup, typically increaseTg , whereas those with lower molecular weight, like invertsugar, typically decrease Tg . Increasing moisture content alsodecreases Tg . Hard candy is in a stable glassy state as long asstorage temperature is lower than Tg . If the storage temperaturegoes above Tg , the candy is no longer in the glassy state andstickiness or graining cause the end of shelf life. Candies withhigh corn syrup content, particularly if high DE corn syrups areused, readily pick up moisture due to their hygroscopic char-acteristic. The added moisture lowers Tg to the point wherestickiness and loss of flavor can occur. When candies with lowcorn syrup content/high sucrose content are stored at a temper-ature higher than Tg , sucrose crystallization, or graining, canoccur, leading to softer texture and rapid flavor loss. As clearlyshown in Table 11, some of the commercial candies are dan-gerously close to leaving the glassy state, especially if ambienttemperature is elevated for any reason (summer weather, warmstorage conditions, etc.).
The specific saccharide composition in a hard candy productcomes from a combination of what went into the formulation(ingredient addition) and what happens during processing (in-version and reversion). Smidova et al. (2004) recently analyzedthe water content and saccharide composition (sucrose, fructose,glucose, maltose, and higher saccharides) of numerous commer-cial hard candies from Europe. Water content varied from 2.1 to5.1%, sucrose from 31.7 to 87.7%, glucose from 1.1 to 12.4%,fructose from 0.2 to 8.5%, maltose from 0.7 to 33.1, and highersaccharides from 0 to 44.9%. Fructose content, indicating inver-sion of sucrose during cooking, varied from as low as 0.2% toas high as 8.5%. Since fructose has a very low Tg , the increasedlevel of fructose led to a fairly low Tg in the candy (about 26◦C,onset temperature), compared to the average of 35 to 40◦C. How-ever, other candies, with lower fructose content, were found tohave even lower Tg , even as low as 22.4◦C (onset tempera-ture). In this study, Tg was also inversely correlated to watercontent (higher water content gives lower Tg) and positivelycorrelated with the percentage of higher molecular weight sac-charides (anything larger than sucrose and maltose). Due to thecomplex range of saccharide composition and water content inthese commercial samples, however, no firm conclusions couldbe drawn about the correlations between Tg and composition.
Simply raising Tg of a hard candy might not be the bestanswer to increased shelf life since Tg also determines the hard-ness of the candy. If Tg is too high, the candy can be too hard,sharp, and brittle (Nowakowski, 2000), leading to dusting, slowdissolution, and flavor release, and sharp mouth feel. Hard candymanufacturers who have tested high maltose corn syrups in theirformulations can attest to these problems. Thus, control of watercontent and optimization of Tg are two important requirementsto produce hard candy with high quality and long shelf life.
Moisture Sorption of Amorphous Sugar Glasses
Sugar glasses are notoriously hygroscopic, and it is oftenthe changes associated with moisture sorption that limits shelf
Dow
nloa
ded
by [
Tex
as A
&M
Uni
vers
ity L
ibra
ries
] at
14:
23 0
9 Ja
nuar
y 20
14
MOISTURE AND SHELF LIFE IN SUGAR CONFECTIONS 183
of hard candy. One of the first studies on moisture sorptionand graining of sugar glasses was conducted by Makower andDye (1956). They exposed sucrose and glucose glasses to airat different RH and characterized moisture uptake. The sugarglasses, initially at nearly zero water content, quickly pickedup moisture to a level in equilibrium with the RH of the airon contact with the matrix. As expected, higher water contentwas observed for higher RH. Since no crystallization inhibitorswere used in this study, once the water content rose above someminimum level, the supersaturated matrix began to crystallize.Upon crystal formation, the remaining liquid phase has higherwater content and its water activity increases. Thus, the syruplayer near the surface has higher water activity now than theair and moisture transfer is from candy to air, resulting in a netloss of moisture of the piece after graining has started. Makowerand Dye (1956) and Palmer et al. 1956) correlated the decreasein water content with the onset of crystallization, as character-ized by X-ray diffraction studies. Lees (1965) provides a dia-gram of this event and the penetration of a crystallizing syruplayer.
Similar effects are expected in sugar-free hard candies, al-though fewer studies have been done to quantify glass transi-tions and graining of sugar-free hard candies. McFetridge et al.(2004) evaluated moisture sorption and graining in model sugar-free candy formulations. Two types of hydrogenated starch hy-drolysate (HSH), with different polyol distributions, were mixedwith both isomalt and lactitol to make hard candies. The glasseswere exposed to high relative humidity (80%) and moisturesorption, glass transition temperature and onset of crystalliza-tion studied. Sorption of up to 40% water was observed, alongwith a rapid decrease in Tg with increasing moisture content.Interestingly, two glass transitions were observed after moistureuptake started, perhaps due to different surface and bulk condi-tions. Graining of the isomalt system was eventually observed,with the lower molecular weight HSH having more inhibitionthan the higher molecular weight HSH.
The effects of various HSH and polydextrose on moisturesorption and graining of isomalt or lactitol hard candies wasalso studied by Raudonus et al. (2000). Interestingly, they foundthat addition of HSH inhibited crystallization of lactitol, whereasit enhanced crystallization of isomalt hard candies. This may beattributed to the increased sorption rate of the isomalt matrix inthe presence of HSH, as related to the decrease in Tg observedat low (<25%) levels of addition.
Studying the mechanisms and kinetics of moisture penetra-tion into sugar glasses is an important area of research. Un-fortunately, other than measuring total change in weight (bulksorption), there are few methods to quantify moisture pene-tration into glassy systems. Magnetic resonance imaging (MRI)techniques, although useful in candies with higher moisture con-tent, typically do not work at lower moisture contents of sugarglasses. Other methods are needed. Liang et al. (2007) utilizedan infrared (FT-NIR) microspectrometer to quantify moisturepenetration rates into various sugar glasses. Initial results clearlyshow a high moisture syrup layer at the interface of the candy
exposed to humid air. The rate of moisture penetration into thesugar glass was relatively slow compared to surface sorption, sopenetration of a distinct boundary between the syrup layer andthe glassy interior was readily observed. When insufficient cornsyrup was present in the formulation, graining of sucrose wasinitiated at the surface, with the crystalline zone gradually mov-ing into the interior. A spike of high moisture content materialwas seen to slowly penetrate into the sugar glass just in advanceof the moving crystalline boundary. Understanding moisture dy-namics in these commercial systems has the potential to leadto new ingredients that may minimize the effects of moisturepenetration.
Flavor Loss
Flavor loss during storage is sometimes another concern forhard candy manufacturers. The ability of flavor molecules toescape the glassy matrix has also been related to the state of thesugars through the polymer science approach. Levi and Karel(1995) found that the loss of volatile markers from intact glasses(stored below Tg) was very slow, with only perhaps 10% ofthe flavor being lost over months of storage. However, if theglass was stored at temperatures above Tg , flavor mobility wassignificantly increased and flavor loss occurred rapidly, with arate dependent on the difference between storage temperatureand Tg . The largest and fastest flavor loss occurred, however,when the glassy matrix was allowed to crystallize. The con-centration effect of sucrose crystallization on flavor led to asubstantially increased driving force for diffusion, leading to avery rapid and nearly complete loss of flavors. Understandingthe effects of hard candy composition, including water content,on Tg and flavor migration will allow hard candy manufacturersto better design products with higher quality and longer shelflife.
Cotton Candy
Cotton candy, or spun sugar, is made by melting colored andflavored sucrose crystals in a spinning device to form fine threads(or floss) of sugar glass. Rapid cooling of the molten sugar asit exits the spinning head results in formation of a glassy statewith no crystallization. However, cotton candy, due to the highsurface area of the fine floss, is inherently unstable and is proneto moisture uptake, collapse, and recrystallization.
In principle, moisture sorption of cotton candy is similar tothat of hard candy, with the main difference being the lack ofcorn syrup in cotton candy. Prevention of crystallization in cot-ton candy is due entirely to the limited molecular mobility in theglassy state, whereas the corn syrup present in hard candy pro-vides additional inhibition. Labuza and Labuza (2004) studiedthe moisture uptake of cotton candy stored at different relativehumidity (RH). Cotton candy remained stable for over two yearswhen held at 11% RH, but crystallized within three days whenheld at 33% RH. In this range of RH, the cotton candy had
Dow
nloa
ded
by [
Tex
as A
&M
Uni
vers
ity L
ibra
ries
] at
14:
23 0
9 Ja
nuar
y 20
14
184 R. ERGUN ET AL.
picked up sufficient moisture that its Tg had been reduced tothe storage temperature (22◦C). As long as the Tg of the cottoncandy remained above storage temperature, the candy retainedits glassy nature. When Tg dropped below room temperaturedue to excessive pick-up of moisture, the candy grained, with arate of graining dependent on the difference between candy Tg
and room temperature. Graining occurred more rapidly duringstorage at higher RH because enhanced moisture uptake causeda greater reduction in Tg , which ultimately allowed the sucrosemolecules sufficient mobility to organize into a crystal lattice.
Fondant and Creams
Fondants and creams are categorized as partially crystallineconfectionery, containing about 50–60% crystalline sucrose ina saturated sugar solution (Lees, 1965; Minifie, 1999; Jeffery,2001). The general formulation of fondant and cream includes70–90% sucrose (dry solid basis), 10–30% corn syrup (dry solidbasis) and 7.5–15% water (12 to 15% most common; Jeffery,2001). The nature of both the crystals (number and size distribu-tion) and the liquid phase (dissolved sugar composition, watercontent, etc.) significantly affect the texture and shelf life offondants and creams, and both are significantly affected by thefinal water content.
Creams are similar to fondant, but are generally softer, withslightly higher water content. They have similar microstruc-ture as fondant with numerous small sugar crystals held in asaturated sugar syrup. However, creams generally contain anaerated frappe to soften the finished texture (Jeffery, 2001). Ausage level of 7 to 10 percent can lighten the texture of the creamwithout causing difficulties if the cream is to be deposited formolding (Minifie, 1999). Invertase may also be added to fondantto soften the confection over time to a cream texture (Jeffery,2001).
Fondants are made by cooking the sugar syrup mixture tothe appropriate temperature to yield the desired final water con-tent (typically, 118–120◦C). The supersaturated sugar mixtureis carefully cooled without agitation (often on a cooling drum)to between 40 and 50◦C (104 to 122◦F) before being sent into abeating tube. Crystallization of sugar is initiated all at the sametime through application of intense beating energy to promotenucleation. The product exiting the beating tube is highly crys-tallized (up to 50% crystals) and ready for further processing.
Water content has a large influence on the characteristicsand texture of fondants and creams. Lower water content givesfirmer products with higher crystallinity, whereas higher watercontent results in fewer crystals, more syrup phase, and softerproducts. Water activity of the product should be less than 0.65to maintain stability and extend shelf life.
Water activity is lowered in fondants and creams by additionof corn syrup, invert sugar, and other components (i.e., sorbitol,glycerol, etc.) with humectant characteristics (Lees, 1965). Theefficiency of different humectants in reducing aw of fondantwas given in the order of glycerol > sorbitol and invert sugar >
Table 12 Measured water activity values (aw) of various fondants (fromBussiere and Serpollini, 1985)
Corn syrupFondant Sucrose (%) solids (%) Water (%) aw
sucrose > 42 DE glucose syrup (Lees, 1965). According to thisordering, sorbitol and invert sugar were found to have about thesame effect on fondant.
Bussiere and Serpollini (1985) compared experimental mea-surements of water activity of various fondants with water activ-ity values calculated from the Grover (1947), Money and Born(1951), Norrish (1966) and a modified Norrish equation basedon the K values of Chirife et al. (1980). Table 12 shows thecomposition of each fondant formulation studied with the ex-perimentally measured aw values. Water activity varied from ashigh as 0.81 for fondant (ratio of sucrose to corn syrup solidsof 2:1) with 25% water content to as low as 0.56 for fondantmade with the same ratio of sucrose to corn syrup solids butwith only 6.3% moisture. Fondants 1 through 5 show the effectsof decreasing water content on aw. At lower water content, thereis more crystalline sucrose so the dissolved solids content in theliquid phase of the fondant increases, which drives down the wa-ter activity. Fondants 6 and 7 compare the effects of increasingcorn syrup solids in the formulation. Higher corn syrup solidsmean less sucrose crystallizes and dissolved solids in the liquidphase of the fondant is higher, and thus, aw decreases.
Comparison of the different methods of predicting aw showedthat the modified Norrish equation based on the constants de-veloped by Chirife et al. (1980) gave the best match to the ex-perimental aw values for the fondants studied by Bussiere andSerpollini (1985). In general, the modified Norrish equation pre-dicted aw values that were within about 1% of the experimentalvalues, except for Fondant 5 where the deviation was 4.6%.
Bussiere and Serpolini (1985) also studied sugar-free fon-dants made with sorbitol and hydrogenated starch hydrolysate(HSH; in this case, Lycasin). Table 13 shows the fondant for-mulations and measured aw values. As with the sugar-basedfondants (Table 12), aw decreased as water content decreasedand HSH content increased (Table 13). Again, at lower watercontent, there was more crystalline sorbitol and higher dissolvedsolids in the remaining liquid phase of the fondant. The mod-ified Norrish equation was again found to adequately predictaw, with errors generally less than 5% from the experimentalvalue. The K value used for the HSH syrup was determined bythe authors to be –2.05 with an average molecular weight of thesyrup taken to be 303.
The use of invertase in fondants and creams allows an initiallyfirm product to soften over time due to the effect of the enzyme
Dow
nloa
ded
by [
Tex
as A
&M
Uni
vers
ity L
ibra
ries
] at
14:
23 0
9 Ja
nuar
y 20
14
MOISTURE AND SHELF LIFE IN SUGAR CONFECTIONS 185
Table 13 Measured water activity values (aw) of various sugar-freefondants (from Bussiere and Serpollini, 1985)
on the state of sugar and the water content (Lees, 1965). Firmfondant or cream can be enrobed or panned with chocolate andthen allowed to soften over time during storage. Manufactureof chocolate-covered cordial cherries typically relies on inver-tase softening, as does the slight softening of boxed chocolate-covered creams during storage. The invertase breaks down su-crose molecules in solution into the component monosaccha-rides, fructose and glucose, using up a mole of water for eachmole of sucrose hydrolyzed (Silver and Karel, 1981). Thus, thewater content of the fondant or cream decreases by 1 or 2%,depending on the amount of sucrose inverted. Despite this re-duction in water content, the fondant still softens, primarily dueto the change in state of sucrose from crystalline to liquid. Foreach mole of sucrose in solution hydrolyzed by invertase, aboutone mole of crystalline sucrose dissolves to maintain satura-tion equilibrium (between crystalline and dissolved sucrose).The reduction in crystalline sucrose is the primary cause of thesoftening effect of invertase in fondants and creams, whereasthe production of invert sugar is the main factor that leads to areduction in aw.
Since a mole of water is consumed for each mole of sucrosehydrolyzed, water plays a critical role in controlling the enzy-matic reaction (Silver and Karel, 1981). The reduction of watercontent and production of glucose and fructose both lead to asignificant decrease in water activity of the cream as the enzymereacts with sucrose. The rate of enzyme reaction decreased tozero over time due to the lack of available water; however, ad-dition of water back into the system led to a rapid increase inenzyme activity (Silver and Karel, 1981; Wu, 2006). Thus, theenzyme still retains the ability to hydrolyze sucrose, but theenvironmental conditions (water activity, invert sugar, etc.) pre-vent it from being active after a certain amount of hydrolysisoccurs.
Marshmallows
Marshmallows are simply described as air bubbles sur-rounded by sugar syrup (Minifie, 1971). The sugar syrup, madeof sucrose, corn syrup, and water, is cooked to a temperatureappropriate for the desired water content, after which air iswhipped into the matrix through mechanically agitation (Jeffery,2001). Proteins, such as gelatin, gum Arabic, egg albumen, agar-agar, pectin, milk or soy protein, are typically added to the sugarsyrup to stabilize the foam (Minifie, 1971). During whipping,
Table 14 Water activity of various marshmallowproducts (unpublished data)
the density of the product decreases as the syrup and foam mix-ture expands into a light, fluffy marshmallow (Jeffery, 2001;Jackson, 1995; Minifie, 1971). Marshmallows may be eitherungrained or grained, depending on the ratio of sucrose to cornsyrup.
Water content affects marshmallow hardness and flow prop-erties. Ungrained marshmallows typically have moisture contentof 15–18% and lower density (0.5–0.7 g/ml), whereas grainedmarshmallows have moisture content of 5–10% and higher den-sity. The ERH of marshmallows is typically around 60–70%(Minifie, 1999), although this depends on the type of marsh-mallow product and processing conditions. Water activities of asampling of marshmallow products, both homemade and store-bought, are shown in Table 14 (unpublished data).
A fresh-made, ungrained marshmallow has fairly high aw,above 0.7, dependent on moisture content and composition.During storage, water activity (and moisture content) decreasein this type of marshmallow, especially in regions where the av-erage relative humidity is below 60%. Grained marshmallows,like circus peanuts, typically have slightly higher moisture con-tent than ungrained marshmallow since the liquid phase hashigher moisture content. Marbits, the small, hard marshmal-lows found in cereals, are grained and dried to low moisturecontent, so have very low aw. Unfortunately, no published stud-ies have investigated the relationships between composition andwater activity in marshmallows.
Lim et al. (2006) studied hardening of marshmallow duringstorage at 25◦C and 21% RH. The initial water content of themarshmallow was 19.5%, and although water activity was notmeasured, it was probably between 0.65 and 0.70, if not higher.As expected, storage at this low RH caused the marshmallow tolose water and harden over time. After 20 weeks of storage, themarshmallow water content had decreased to 7.9% and hardnesshad increased by greater than a factor of ten. Although water ac-tivity was not measured, it undoubtedly decreased substantiallyover this time (as seen in Table 11 for other marshmallow prod-ucts). Lim et al. (2006) also correlated the increase in hardnessduring storage to an increase in the Tg of the product. Figure 7shows that Tg was below −40◦C initially (with higher moisturecontent and aw) and increased to just above 0◦C after 20 weeks,when the moisture content had decreased to 7.9%. This increasein Tg is directly responsible for the hardening since the amor-phous sugar matrix was becoming closer to a brittle glassy state.Labuza (2006) presented similar results relating moisture lossand marshmallow hardening.
Dow
nloa
ded
by [
Tex
as A
&M
Uni
vers
ity L
ibra
ries
] at
14:
23 0
9 Ja
nuar
y 20
14
186 R. ERGUN ET AL.
Figure 7 Change in hardness relative to glass transition temperature ofmarshmallow stored at 25◦C and 21% relative humidity (numbers by eachpoint represent percent water content) (redrawn from Lim et al., 2006).
Nougat
Nougat, like marshmallow, is made by whipping a sugarsyrup into a foam (Minifie, 1999). Nougat can be crystallizedor uncrystallized, with fat and flavor added to enhance eatingcharacteristics (Jeffery, 2001; Jackson, 1995). The texture canvary in firmness depending on water content and state of thesugars (Jeffery, 2001). Soft nougats generally contain a syrupphase that is interspersed with the fat and other ingredients(Minifie, 1999). The fat affects texture and adds lubricity duringcutting and eating (Jeffery, 2001). Moisture content ranges from6% in hard nougats to 15–17% in soft nougats (Jeffery, 2001).
Both chewy and grained nougats are made by mixing eggalbumen or another protein with water and sugar to produce afrappe. The sugar, corn syrup, and water are boiled to the desiredmoisture content and added slowly to the egg albumen mixture.Other ingredients (and graining agents, if desired) are addedalong with the melted fat. The fat is added last to minimizedeflation of the foam. The finished nougat is then cooled andallowed to set before cutting (Minifie, 1999).
Nougats may be either chewy or grained/short nougats, de-pending on whether the sugar has crystalized or not. In chewynougats, corn syrup content is higher than sucrose content sothat the sugars are in the amorphous state (ungrained). Thesucrose content in grained nougat is higher than corn syrup con-tent so that the sugars are partially crystallized. Fine sugar maybe added during production to promote or seed crystallization(Minifie, 1999). Typically, grained nougats have slightly higheraw than chewy nougats at the same moisture content due to theinfluence of graining. If the nougat is grained, it has an ERHof 60–78% and if it is ungrained, it has an ERH of 40–55%(Minifie, 1999).
Hardening of nougat, both grained and ungrained, can bea problem if the confection is stored in a low relative humid-ity environment. However, no studies have been reported thatdocument these effects.
Caramel and Fudge
Caramel and fudge generally consist of sugars, corn syrup,milk protein (often from sweetened condensed milk), fat (maybe milk fat or vegetable fat), salt, and water. Fudge is typicallyconsidered a crystallized caramel (Jeffery, 2001; Jackson, 1995).The ingredients are cooked to drive off water, leaving anywherefrom about 6 to 18% water content for caramels. During cook-ing, the Maillard reaction occurs between reducing sugars andproteins to give the desired caramel flavor and color (Jeffery,2001). Caramels and toffees have an ERH between about 45and 60%, depending on moisture content and formulation, withfudge often having a slightly higher value due to the sugar crys-tallization (Willis, 1998).
Caramel is a noncrystalline amorphous sugar candy, althoughcommercial caramels may consist of some (<10%) small sugarcrystals to modify texture and reduce stickiness. The organiza-tion of protein aggregates around fat globules contained withinthe amorphous sugar matrix provides stand-up properties andprevents cold flow. Due to the wide range of water content, be-tween about 6 to 18%, caramel can have textures from soft andrunny to very hard and firm. Texture may be “short” when slightgraining occurs.
The final water content of caramel and fudge is critical tothe texture, quality, and shelf stability. The water content ofcaramel varies from as low as 4–6% to as high as 18%, withtexture ranging from very hard and brittle to soft and runny overthat range. The glass transition temperature, governed by wa-ter content and composition, directly correlates to the texture.Chung et al. (1999) measured the glass transition temperaturesof caramels made with different types of corn syrup and cor-related these results with general textural attributes. Caramelformulations were all cooked to the same temperature (119◦C,246◦F) so that the water content varied with the type of cornsyrup used in the formulation. Caramel made with high fruc-tose corn syrup had the highest water content of 9.6% (due tothe highest boiling point elevation of the corn syrups studied)and the lowest Tg of 0◦C (32◦F). This caramel was softest andrunniest, reflecting the very low Tg . On the other extreme, thecaramel made with 26 DE corn syrup had the lowest watercontent (lowest boiling point elevation) of 8.4% and the high-est Tg of 20◦C (68◦F). This caramel was quite hard, reflectiveof the fact that its Tg was only slightly below room tempera-ture. The caramels made with 42 and 62 DE corn syrups hadintermediate Tg values, as expected, of 9◦C (48.2◦F) and 5◦C(42◦F), respectively. As expected, their textures fell betweenthose of the two extremes. This example clearly shows howsimply changing the type of corn syrup in a caramel formula-tion can dramatically affect texture, in part through the effect onwater content and Tg . For comparison, Foegeding and Steiner(2002) found a Tg of −14.8◦C (5.4◦F) for a caramel made with63 DE corn syrup and cooked only to 115◦C (239◦F). The higherwater content remaining in this caramel formulation led to themuch lower Tg than found by Chung et al. (1999) for a similarcaramel.
Dow
nloa
ded
by [
Tex
as A
&M
Uni
vers
ity L
ibra
ries
] at
14:
23 0
9 Ja
nuar
y 20
14
MOISTURE AND SHELF LIFE IN SUGAR CONFECTIONS 187
Dissolved sugars and salts lower water activity to help sta-bilize against microbial growth; however, some fudge productsmay have sufficiently high aw (above 0.65) to support moldgrowth. Caramels and fudge with high water content (high aw)may need added preservatives, like potassium sorbate, to stabi-lize against mold growth.
Besides mold growth, graining (moisture loss) and stickiness(moisture gain) are potential shelf life issues for caramel. Highwater content and/or high DE corn syrup content may causestickiness, whereas inappropriate ratios of sucrose to corn syrupand sucrose to water can lead to graining (Lenz and Hartel,2005).
Gum
Gum consists of gum base, which is made of natural or syn-thetic rubber or polymers, along with gum texturizers, sugars,flavors, and humectants. Bubble gum typically contains highermolecular weight polymers than chewing gum in order to pro-vide elasticity for blowing bubbles. Sugars such as ground su-crose and dextrose are used in addition to 42 DE corn syrup(Jackson, 1995). Chewing gum is produced by first melting thegum base and then mixing in the sweeteners and other ingredi-ents. The gum is then rolled and cut into the proper size pieces.Before being wrapped, the gum is conditioned in temperature-controlled rooms to guarantee proper consistency.
The main factors that affect water activity of gum are watercontent, corn syrup (both DE and specific gravity) and othersugars, and glycerin. Chewing gum usually has an ERH between50–60% (Minifie, 1999).
Moisture loss is often the cause for the end of shelf life ofgums, which is why gum may also contain humectants to retainsoftness and hold moisture. Since gum typically has aw of about0.55, if it is exposed to dry conditions, it typically loses moistureand becomes hard and crumbly.
Gum typically has a shelf life between six months and ap-proximately one year depending on the type of product. Softbubble gum has a shorter shelf life (approximately six to ninemonths), while coated pellet gum has a longer shelf life since thehard sugar shell provides protection from environmental con-ditions. However, moisture migration between the gum centerand the hard sugar shell can lead to the end of shelf life as theshell softens and the gum hardens. No recent publications werefound in the literature that documented the effects of moistureon shelf life of gum products.
Jelly and Gummy Candies
Jelly candies like jellybeans and gummy bears consist of agelling agent (i.e., gelatin, pectin, or starch) added to relativelyhigh moisture content (15–20%) sugar syrup (Jeffery, 2001;Jackson, 1995). The syrup, which is formulated not to grainby adding more corn syrup than sucrose, is immobilized in the
gel structure (Jeffery, 2001). Textural properties of this categoryof candy depend primarily on the water content and the typeof gelling agent used. Regardless of the gelling agent, candieswith higher water content are significantly softer than candiesmade with the same ingredients but with lower water content.The ERH for these types of candies is usually given to be around60–70% (Minifie, 1999), although some hard jelly candies mayhave aw as low as 0.5.
Jelly and gummy candies are often produced by molding indried corn starch, where impressions in dried starch are filledwith hot liquid candy, which is then cooled and allowed to set.The starch pulls moisture out of the candy piece and creates a“skin” on the surface of the jellies. The skin helps prevent de-formation of the candies when removed from the starch (Lees,1979). Drying time may vary from 24 to 72 hours dependingon the candy and the desired final moisture content (Sudharsanet al., 2004). The speed at which drying occurs must be con-trolled. If skin formation occurs too rapidly, the surface maybecome too hard and trap moisture inside. This in turn can leadto “sweating” on the surface of the candy during storage (Sud-harsan et al., 2004).
Ziegler et al. (2003) documented the rate and extent of mois-ture migration from the jelly candy into starch during setting.Magnetic Resonance Imaging (MRI) was used to follow themovement of moisture from the candy into the starch and airto assess the rate of moisture migration. Due to rapid initialmoisture loss, a hard skin of dried candy was observed to format the interface with the drying starch.
Jelly and gummy candies are likely to harden over time asthe candy loses moisture to the atmosphere through the skin.Since gummy and jelly candies generally have finished aw of0.5–0.7, they tend to lose moisture and harden if stored at dryconditions.
Recent studies on physical (and sensory) properties of mix-tures of biolpolymers and sugars in low moisture systems are uti-lizing the polymer science approach (DeMars and Ziegler, 2001;Kasapis et al., 2004). The rheological/mechanical properties ofthese mixtures, either real jelly candies or simulated candies,are being studied from a fundamental approach based on under-standing molecular mobility. The effects of mixed biopolymers(for example, gelatin and xanthan gum) on the glass transition,Tg , of such systems will lead to development of advanced op-tions for new jelly candies with tailored physical properties.Control of water in these systems through gelation of the hydro-colloid is critical to control of product texture.
Compressed Tablets and Wafers
Various powdered base materials, such as sucrose, fructose,dextrose, sorbitol, mannitol, or xylitol, are used to manufacturecompressed tablet candies. In addition to the base, binders suchas gum arabic, gelatin, and alginates, along with lubricants,oils, fats, magnesium stearate or stearic acid, and color andflavor materials are used to make tablets. The ingredients are
Dow
nloa
ded
by [
Tex
as A
&M
Uni
vers
ity L
ibra
ries
] at
14:
23 0
9 Ja
nuar
y 20
14
188 R. ERGUN ET AL.
mixed, wetted, and formed into a mass that is then granulated,sieved, and dried (Minifie, 1999). This ensures even mixtureof the ingredients during the tableting process. The resultingpowder or granules are compressed under pressure to producehard sweet tablets, often with a rough surface (Minifie, 1999;Jackson, 1995). Compressed tablets have low moisture contentand are shelf stable for a long time (years).
Wafer candies, sometimes called lozenges, are made by mix-ing powdered sugar with a binder made primarily of corn syrupand gelling agent. The resulting dough contains about 5 to 10%moisture, from which candy pieces are formed either by extru-sion or by sheeting and cutting. The wafers are then dried tovery low moisture content (<4%) and thus, have very low aw
values (<0.4).The water content of the dough used to make wafers and
lozenges plays an important role in the hardness of these candies.Higher moisture content promotes a greater extent of bondingbetween crystals during drying, which leads to a harder candy.The high crystallinity and low aw of tablets and wafers makethese candies stable to moisture changes even in the presence offairly high relative humidity.
Sugar Panned Candies
Sugar panned candies are either soft panned or hard panned.Water content during manufacture and storage of sugar-pannedcandies is critical to product quality and shelf life.
Soft panned candies such as jellybeans are created by build-ing up successive layers of coating materials on candy centers ina rotating pan. For example, jellybean centers (initial water con-tent of 7 to 10%) are alternately layered with engrossing syrupsand fine-grained sugar until the desired size is reached (Minifie,1999). The shell, which may be up to several millimeters thick,makes up on average about 20 to 30% of the final product. Al-though the shell may have only 4 to 5% water content whenapplied, the high crystalline content means that the liquid phaseof the shell has much higher water content (probably as highas 10%). The soft-panned sugar shell contains relatively largesugar crystals, dependent primarily on the size of the particlesadded in engrossing. These large crystals and the relatively highwater content of the liquid phase of the shell provide the “soft”texture of these products. The coating must be applied evenlyand each layer must be dried under controlled conditions toproduce uniform confections.
Once the shell has been applied, the coating is then allowed toset as the product is stored in shallow trays in a dry environment.During this storage step, moisture can potentially move fromthe coating into the jelly center or be lost from the jellybeaninto the atmosphere. Troutman et al. (2002) studied moisturemigration in a jelly bean during curing (at 50% RH and roomtemperature) by using MRI, in addition to measuring changes inwater content and water activity of the different zones. Directlyafter the panning process, the shell had water content of 4 to4.5% with aw of 0.75, whereas the jelly candy center had initial
water content of 7 to 8% with aw of 0.64. After 2 days of curing,the water content of the shell had decreased to 3.5 to 4.0% withaw of 0.68 and the jelly candy center had also lost moisture to6.5 to 7.0% with aw of 0.60 to 0.62. The water content of thejelly bean decreased by about 0.03% and was still decreasingafter 48 hours of curing.
Moisture loss often continues throughout storage even whenthe candies are kept in the package. Hardening of jelly beansover time is widely observed and probably is the main causeof the end of shelf life. Moisture loss and hardening are furtherexacerbated by storage in an open package.
In hard panning, a highly concentrated sucrose syrup (80–85% solids) is applied to a candy or nut center tumbling in apan (Minifie, 1999). The syrup is allowed to spread over thepiece and then drying air is applied to the pan to promote rapiddrying and intense crystallization of the syrup. Extremely smalland numerous crystals, possibly fused together, are desired inhard panning to give the hard, brittle shell characteristic ofhard panned candies. Control of crystallization and drying isextremely important to obtain a high quality candy.
Ben-Yoseph et al. (2000) studied drying of thin sugar filmssimilar to those formed during hard panning. Model films weredried on a microscope stage to allow visualization of sugar crys-tallization, and drying rates also predicted by computer simula-tion of drying and crystallization. The effects of initial solutionconcentration, drying air flow, temperature and relative humid-ity were studied. Of these parameters, temperature was foundto have the greatest effect on drying and crystallization, with airflow and initial solution concentration having almost no effect.Relative humidity of the drying air had minimal effect on therate of drying or crystallization, but influenced the amount ofwater remaining in the film at longer times, with higher rela-tive humidity leading to higher moisture content, as expected.Additional studies are needed to quantify the relative rates ofcrystallization and drying in thin films similar to those foundduring hard panning.
SUMMARY
Moisture is one of the most critical factors that affects qualityand the shelf life of confections. Texture, for example, of mostcandies is significantly affected by water content, with confec-tions generally becoming harder as the moisture content de-creases. Recently, the application of the state diagram approachto characterizing the properties of confections has provided asignificant advance in our understanding of exactly how watercontent affects texture and quality.
In terms of shelf life, it is well known that the differencebetween water activity (aw) of the candy and the RH of the sur-rounding environment determines whether a confection gains orloses moisture during storage. The closer aw is to the RH duringstorage, the less potential for moisture migration to or from theenvironment. Similarly, in confections with multiple domainsof different aw, migration occurs between the domains until
Dow
nloa
ded
by [
Tex
as A
&M
Uni
vers
ity L
ibra
ries
] at
14:
23 0
9 Ja
nuar
y 20
14
MOISTURE AND SHELF LIFE IN SUGAR CONFECTIONS 189
equilibrium is reached (at equal aw values). Methods to protectconfections against moisture migration are continually beingstudied to preserve quality and extend shelf life. This includesapproaches to retard migration to the environment through useof improved packaging materials and to retard migration withinmulti-domain candies through the use of edible films and/orreformulation to balance aw of the different domains.
ACKNOWLEDGEMENT
The authors gratefully acknowledge funding from PMCA,an international association of candy manufacturers.
REFERENCES
Allinson, J. G., Dansereau, R. J., and Sakr, A. (2001). The effects of packagingon the stability of a moisture sensitive compound. International J. Pharma-ceutics. 221:49–56.
Antunes, A. C. B. and Antunes, L. J. (2000). Non-linear effects in moistureadsorption by chocolate. International J. Food Sci. Technol. 35(3):323–329.
Baiano, A. and Del Nobile, M. A. (2005). Shelf life extension of almond pastepastries. J. Food Engineering. 6:487–495.
Beard, G. E. (2001). Moisture measurement: An overview. Manufacturing Con-fectioner. 81(6):73–80.
Bell, L. N. and Labuza, T. P. (2000). Moisture Sorption: Practical Aspectsof Isotherm Measurement and Use, 2nd Ed. American Association CerealChemistry, St. Paul, MN.
Ben-Yoseph, E., Hartel, R. W. and Howling, D. (2000). Three-dimensionalmodel of phase transition of thin sucrose films during drying, J. Food Eng.44(1):13–22.
Berlin E., Anderson B. A. and Pallansch, M. J. (1968). Water vapor sorptionproperties of various dried milks and wheys. J. Dairy Sci. 51(9):1339–1344.
Beuchat, L. R. (1981). Microbial stability as affected by water activity. CerealFoods World. 26(7):345–349.
Bhandari, B. R. and Hartel, R. W. (2005). Phase transitions during food pow-der production and powder stability, In: Encapsulated and Powdered Foods,pp. 261–292. Onwulata, C., Ed. Taylor and Francis, Boca Raton, FL.
Biquet, B. and Labuza, T. P. (1988). Evaluation of the moisture permeabil-ity characteristics of chocolate films as an edible moisture barrier. J. FoodScience. 53(4):989–998.
Bird, R. B., Stewart, W. E. and Lightfoot, E. N. (2002). Transport Phenomena,2nd Ed., John Wiley and Sons, New York.
Bloch, F., Hansen, W. W. and M. F. Packard. The nuclear induction experiment.Phys. Rev. 70:474–485.
Blustein, P. and Labuza, T. P. (1972). Kinetics of water sorption in a modelfreeze dried food. Amer. Inst. Chem. Eng. J. 18:706–712.
Bravin, B., Peressini, D. and Sensidoni, A. Development and application ofpolysaccharide–lipid edible coating to extend shelf-life of dry bakery prod-ucts. J. Food Engineering. 76(3):280–292.
Breen, S. and Monaghan, R. (1975). Moisture measurement. In: Quality Detec-tion in Foods, pp. 102–105. Gaffney, J. J., Ed. American Society of Agricul-tural Engineers.
Bussiere, G. and Serpelloni, M. (1985). Confectionery and water activity deter-mination of aw by calculation. In: Properties of Water in Foods in Relationto Quality and Stability, pp. 627–645. Simato, D. and Multon, J. L., Eds.Martinus Nijhoff Publishers. Dordrecht, The Netherlands.
Cakebread, S. H. (1969). Product and process problems, calculating ERH- theMoney and Born equations. Confectionery Production. 35(10):651, 653–655.
Cakebread, S. H. (1976). Ingredient migration in composite products. Confec-tionery Production. 226:29–237.
Catte, A., Dussap, C.-G. and Gros, J.-B. (1995). A physical chemical UNIFACmodel for aqueous solutions of sugars. Fluid Phase Equilibria. 105:1–25.
Chirife, J. and Buera, M. D. P. (1994). Water activity, glass-transition andmicrobial stability in concentrated/semimoist food systems. J. Food Science.59(5):921–927.
Chirife, J., Ferro Fontan, C. and Benmergui, E. A. (1980). The prediction ofwater activity in aqueous solutions in connection with intermediate moisturefoods. IV. Aw prediction in aqueous nonelectrolyte solutions. J. Food Technol.15:59–70.
Chung, M. S., Ruan, R. R., Chen, P. L. and Xiaoan, W. (1999). Physical andchemical properties of caramel systems. Lebensmittel-Wissenschaft und Tech-nol. 32(3):162–166.
Corriveau, C. L., Guydan, T., McHale, M., Cahill, K. S. and Milosch, G. J.(2003). Confectionery Products having Improved Shelf Life and Methods fortheir Production. US Patent Number US 6 562 382 B1.
D’Alton, G. (1969). A graphical interpolation method. Confect. Manuf. Market.3:184–186.
Debeaufort, F., Voilley, A. and Meares, P. (1994). Water vapor permeabilityand diffusivity through methylcellulose edible films. J. Membrane Science.91:125–133.
de Man, J. M. (1999). Principles of Food Chemistry, 3rd Ed. Aspen Publishers,Inc. Gaithersburg, MD.
DeMars, L. L. and Ziegler, G. R. (2001). Texture and structure of gelatin/pectin-based gummy confections, Food Hydrocolloids. 15:643–653.
Duckworth. (1974). Water Relations of Food. Academic Press, New York.Franks, F. (2000). Water: A Matrix of Life, 2nd Ed. RSC Publishing, Cambridge,
UK.Fennema, O. R. (1996). Water and Ice. In: Food Chemistry, pp. 19–74, 3rd Ed.
Fennema, O. R., Ed. Marcel Dekker, New York.Foegeding, E. A. and Steiner, A. (2002). Factors regulating caramel stickiness
and texture, Manufact. Confect. 82(5):81–88.Fontana, A. (2005). Water activity for predicting quality and shelf life. Manu-
facturing Confectioner. 85(11):45–51.Gabarra, P. and Hartel, R. W. (1998). Corn syrup solids and their saccharide
fractions affect crystallization of amorphous sucrose. J. Food Sci. 63(3):523–528.
Geurts, T. J., Walstra, P. and Mulder, H. (1974). Transport of salt and waterduring salting of cheese. 1. Analysis of the processes involved. NetherlandsMilk Dairy J. 28:102–129.
Graaf de, E. M., Madeka, H., Cocero, A. M. and Kokini, J. L. (1993). Determi-nation of the effect of moisture on gliadin glass transition using mechanicalspectrometry and differential scanning calorimetry. Biotechnol. Prog. 9:210–213
Greener, I. and Fennema, O. (1992). Lipid-based edible films and coatings.Lipid Technology. 4(2):34–38.
Grover, D. W. (1947). The keeping properties of confectionery as influenced byits water vapor pressure, J. Soc. Chem. Ind. 66:201–205.
Guillard, V., Broyart, B., Bonazzi, C., Guilbert, S. and Gontard, N. (2003).Preventing moisture transfer in a composite food using edible films: Experi-mental and mathematical study. J. Food Science. 68(7):2267–2277.
Guinee, T. P. and Fox P. F. (2004). Salt in cheese: Physical, chemical andbiological aspects. In: Cheese: Chemistry, Physics and Microbiology, Vol. 1.General Aspects, 3rd Ed., P. F. Fox, P. L. H. McSweeney, T. M. Cogan andT. P. Guinee, Eds. Elsevier Press, Amsterdam.
Hadjikinova, M., Menkov, N. and Hadjikinov, D. (2003). Sorption characteris-tics of dietary hard candy. Czech J. Food Science. 21(3):97–99.
Hartel, R. W. (2001). Crystallization in Foods. Aspen Publ., NY.Hasted J. B. (1972). Liquid water: Dielectric properties. In: Water a Com-
prehensive Treatise, Vol 1, pp. 255–309. Franks, F. Ed. Plenum Press,New York.
Haynes, L., Zhou, N., Slade, L., Levine, H. and Chan, W. (2004). In KraftFoods Holdings, Inc., USA (Ed.), Edible Moisture Barrier for Food Products.(Patent Kind Code: A1 ed.). Patent Application Country: Application: US;Patent Country: US: Main IPC: A23B004-00.
Heinze P. and Isengard, H. D. (2001). Determination of the water content indifferent sugar syrups by halogen drying. Food Control. 12:483–486.
Dow
nloa
ded
by [
Tex
as A
&M
Uni
vers
ity L
ibra
ries
] at
14:
23 0
9 Ja
nuar
y 20
14
190 R. ERGUN ET AL.
Hough, G., Garitta, L. and Gomez, G. (2006). Sensory shelf life predictions bysurvival analysis accelerated storage models. Food Quality and Preference.17(6):468–473.
Iglesias, H. A. and Chirife, J. (1984). Correlation of BET monolayer moisture-content in foods with temperature. J. Food Technology. 19(4):503–506.
Iglesias, H. A., Chirife, J. and Buera, M. P. (1997). Adsorption isotherm ofamorphous trehalose. J. Sci. Food Agric. 75(2):183–186.
Isengard, H. D. (1995). Rapid water determination in foodstuffs. Trends FoodSci. Technol. 6:155–162.
Isengard H. D. (2001). Water content, one of the most important properties offood. Food Control. 12:395–400.
Isengard, H. D. and Heinze, P. (2003). Determination of total water and surfacewater in sugars. Food Chemistry. 82(1):169–172.
Isengard, H. D. and Prager, H. (2003). Water determination in products withhigh sugar content by infrared drying. Food Chem. 82:161–162.
Isengard, H. D., Schultheiss, D., Radovic, B. and Anklam, E. (2001). Alternativeto official methods used for the water determination in honey. Food Control.12(7):459–466.
Jackson, E. B. (1995). Sugar Confectionery Manufacture, 2nd Ed. Blackie,New York.
Jeffery, M. S. (2001). Grained and ungrained confections. Manufact. Conf.73(11):47–48.
Jones, G. (1956). Glass. Methuen, London.Kasapis, S., Mitchell, J., Abeysekera, R. and MacNaughton, W. (2004). Rubber-
to-glass transitions in high sugar/biopolymer mixtures. Trends Food Sci. Tech-nol. 15:298–304.
Kauzmann, W. J. (1948). The nature of the glassy state and the behavior ofliquids at low temperatures. Chem Rev. 43:219.
Kilara A. (1981). Water activity and its role in food preservation and deteriora-tion. 35th P. M. C. A. Production Conference. 38–45.
Kitt, J. S. (1993). Hard candy graining, causes and prevention. Manufact. Conf.73(11):47–48.
Knetchel Laboratories. (1996). Chemical Analysis and its Application to CandyTechnology, Skokie, IL.
Kuprianoff, J. (1958). Bound water in foods. Fundamental aspects of the dehy-dration of foodstuffs. Science. 163:1329.
Labuza, K. M. (2006). How does the loss of moisture affect the textural proper-ties of marshmallow. Poster presented at IFT Annual Meeting, Orlando, FL.
Labuza, T. P. (1968). Sorption phenomena in foods. Food Technology. 23:15–19.Labuza, T. P. (1971). Properties of water as related to the keeping quality of
foods. In: Proceedings SOS/70, Third International Congress of Food Scienceand Technology, Washington, D.C., Institute of Food Technologists, Chicago.
Labuza, T. P. and Hyman C. R. (1998). Moisture migration and control inmulti-domain foods. Trends Food Sci. Technol. 9:47–55.
Labuza, T. P. and Labuza, P. S. (2004). Influence of temperature and relativehumidity on the physical states of cotton candy. J. Food Process. Pres.28:274–287.
Labuza, T. P. and Rutman, M. (1969). Effect of surface active agents on sorptionisotherms of a model system. Can J. Chem. Engr. 46:364.
Labuza T. P., Lee, R. Y., Flink, J., McCall, W. (1976). Water activity determina-tion: A collaborative study of different methods. J. Food Science. 42:910–917.
Lees, R. (1965). Factors affecting crystallization in boiled sweets, fondant andother confectionery, BFMIRA Scientific and Technical Surveys, Number 42,Leatherhead, Surrey, UK.
Lees, R. (1977). Manufacture of high boiled sweets. Confectionery Production.43(2):55.
Lees, R. (1979). The manufacture of sugar confectionery jellies. ConfectioneryProduction. 45(1):22.
Leinen, K. M. and T. P. Labuza, T. P. (2006). Crystallization inhibition of anamorphous sucrose system using raffinose. J. Zhejang Univ. SCIENCE B.7(2):85–89.
Le Maguer, M. (1992). Thermodynamics and vapor-liquid equilibria. In:Physical Chemistry of Foods, Schwartzberg, H. G. and Hartel, R. W. Eds.Marcel Dekker, NY.
Lenz, P. A. and Hartel, R. W. (2005). Empirical models for predictingcrystallization in confections. Manufacturing Confectioner. 85(8):55–64.
Leschke, R. J. (1987). Techniques for estimating the vapor-liquid equilibriumof sugar solutions. Biotech Prog. 3(4):205–211.
Leung, H. K. and Steinberg M. P. (1979). Water binding of food constituentsas determined by NMR, freezing, sorption and dehydration. J. Food Sci. 44:1212.
Levi, G. and Karel, M. (1995). The effect of phase transitions on release ofn-propanol entrapped in carbohydrate glasses. J. Food Eng. 24(1):1–13.
Levine, I. N. (1995). Physical Chemistry, 4th Ed. McGraw-Hill, New York.Levine H. and Slade, L. (1988). Principles of cyostabilization technology from
structure /property relationships of carbohydrate-water systems-a review.Cyro-Lett. 9:21–63.
Levine, H. and Slade, L. (1992). Glass transitions in foods. In: PhysicalChemistry of Foods, pp. 83–220. Schwartzberg, H. G. and Hartel, R. W. Eds.Marcel Dekker, New York.
Levine, H. and Slade, L. (2002). Food polymer science approach to baked goods,In: Confectionery Science III, Proceedings 5th International PSU/PMCASymposium, pp. 108–115. Penn State University, University Park, PA.
Lewicki, P. P., Busk, G. C., Peterson, P. L. and Labuza, T. P. (1978). Determina-tion of factors controlling accurate measurement of aw by the vapor pressuretechnique. J. Food Science. 43:244–246.
Liang, B., Shi, Y. and Hartel, R. W. (2007). One-dimensional moisture penetra-tion into sugar glasses: Quantitative mapping by FT-NIR microspectroscopy.Food Biophysics. 2(2–3):93–97.
Lilley, T. H. (1994). Physical chemistry and links between hydration and soluteinteractions, J. Food Eng. 22(1–4):13–25.
Lim, M. H., Yin, J. and Heenan, S. (2006). The mystery of marshmallowhardening. In: Food Preservation Technology Series–Water Propertiesof Food, Pharmaceutical and Biological Materials, pp. 325–342. Beura,P., Welti-Chanes, J., Lillford, P. J. and Corti, H. R., Eds. CRC Press,NY.
Loh, J. P. and Hansen, T. S. (2002). In Kraft Foods Holdings, Inc., USA (Ed.),Fat- and Oil-Based Oven-Stable Edible Moisture Barrier for Food. (PatentKind Code: A2 ed.). Patent Application Country: Application: EP; PatentCountry: EP; Priority Application Country: US: Main IPC: A23P001-08.;Secondary IPC: A21D013-08; A23C019-16; A23C019-09.
Maftoonazad, N. and Ramaswamy, H. S. (2005). Post-harvest shelf-lifeextension of avocadoes using methyl cellulose-based coating. LebensmittelWissenschaft Teknologie. 38:617–624.
Makower, B. and Dye, B. (1956). Equilibrium moisture content and crystal-lization of amorphous sucrose and glucose. J. Agric. Food Chem. 4:72–77.
Makower, B. and Myers, S. (1943). A new method for the determination of mois-ture in dehydrated vegetables. Proc. Inst. Food Technol., 4th Conference, 156.
Martin, F. and Zipse, H. (2005). Charge distribution in the water molecule - Acomparison of methods. J. Comput. Chem. 26:97–105.
Mathlouthi, M. (2001). Water content, water activity, water structure and thestability of foodstuffs. Food Control. 12:409–417.
Matz, S. A. (1965). Water in Foods, AVI Publishing Co., Westport, CT.McFetridge, J., Rades, T. and Lim, M. (2004). Influence of hydrogenated starch
hydrolysates on the glass transition and crystallization of sugar alcohol. FoodResearch International. 37(5):409–415.
Meryman, H. T. (1966). Cryobiology. Academic Press, New York, N.Y.Minifie, B. W. (1970). Moisture determination by handy instrument aids
line adjustment. Candy Industry and Confectioners’ Journal. 135(9):5–6,19.
Minifie B. W. (1971). Marshmallow: Technology and methods of manufacture.Manufacturing Confectioner. 51(4):31–37.
Minifie, B. W. (1999). Chocolate, Cocoa and Confectionery, 3rd Ed. Aspen, NY.Money, R. W. and Born, R. (1951). Equilibrium relative humidity of sugar
solutions. J. Sci. Food Agric. 2:180–185.Mousseri, J., Steinberg, M. P., Nelson, A. I. and Wei, L. S. (1974). Bound water
capacity of cornstarch and its derivatives by NMR. J. Food Sci. 39:114.Nelson, D. L. and Cox, M. M. (2000). Lehninger Principles of Biochemistry,
3rd Ed. Worth Publishers, New York.Nielsen, S. S. (2003). Food Analysis, 3nd Ed. Aspen Publishers, Inc.,
Gaithersburg, MD.
Dow
nloa
ded
by [
Tex
as A
&M
Uni
vers
ity L
ibra
ries
] at
14:
23 0
9 Ja
nuar
y 20
14
MOISTURE AND SHELF LIFE IN SUGAR CONFECTIONS 191
Ninni, L., Camargo, M. S. and Meirelles, A. J. A. (2000). Water activity inpolyol systems. J. Chem. Eng. Data. 45:654–660.
Noel, T. R., Ring, S. G. and Whittam, M. A. (1991). Glass transitions inlow-moisture foods. Trends Food Science Technol. 1(3):62–67.
Norrish, R. S. (1964). Equilibrium relative humidity of confectionerysyrups—A nomogram. Confectionery Production. 10:769–808.
Norrish, R. S. (1966). An equation for the activity coefficients and equilibriumrelative humidities of was in confectionery syrups. J. Food Technol. 1:25–39.
Norrish, R. S. (1967). Selected Tables of Physical Properties of Sugar Solutions,B. F. M. I. R. A. Scientific and Technical Surveys. No. 51.
Nowakowski, C. M. (2000). Effect of corn syrups on stability of amorphoussugar products. Ph.D. Dissertation, University of Wisconsin, Madison,WI.
Nowakowski, C. M. and Hartel, R. W. (2002). Physical Properties and Stabilityof Amorphous Sugar Products. J. Food Sci. 67(4):1419–1425.
Palmer, K. J., Dye, W. B. and Black, D. (1956). X-ray diffractometer andmicroscopic investigation of crystallization of amorphous sucrose. J. Agric.Food Chem. 4:77–81.
Pancoast, H. M.and Junk, W. R. (1980). Handbook of Sugars, 2nd Ed. AVIPublishing Co., Westport, CT.
Peres, A. M. and Macedo, E. A. (1997). A modified UNIFAC model forthe calculation of thermodynamic properties of aqueous and nonaqueoussolutions containing sugars. Fluid Phase Equilibria. 139:47–74.
Pomeranz, Y. and Meloan. C. E. (1994). Food Analysis, 3rd Ed. Chapman &Hall, NY.
Purcell, E. M., Torey, H. C. and Pound, R. V. (1946). Resonance adsorption bynuclear magnetic moments in a solid. Phys. Rev. 69:37–38.
Raudonus, J., Bernard, J., Janssen, H., Kowalczyk and Carle, R. (2000).Effect of oligomeric or polymeric additives on glass transition, viscosity andcrystallization of amorphous isomalt. Food Research International. 33:41–51.
Reid, R. C., Prausnitz, J. M. and Poling, B. E. (1987). The Properties of Gasesand Liquids, 4th Ed. McGraw Hill, New York.
Robinson R. A. and Sinclair, D. A. (1934). The activity coefficients of the alkalichlorides and of lithium chloride in aqueous solution from vapor pressuremeasurements. J. Amer. Chem. Soc. 56:1830–1835.
Rockland, L. B. and Stewart, G. F. (1981). Water Activity: Influences on FoodQuality. Academic Press, New York.
Roe, K. and Labuza, T. P. (2005). Glass transition of amorphous trehalose-sucrose systems. J. Food Properties. 8(3):559–574.
Roos, Y. (1995). Phase Transitions in Foods. Academic Press, San Diego, CA.Roos, Y. and Karel, M. (1991). Plasticizing effect of water on thermal-behavior
and crystallization of amorphous food models. J. Food Science. 56(1):38–43.
Ross, K. D. (1975). Estimation of water activity in intermediate moisture foods.Food Technol. 29(3):26, 28, 30, 32, 34.
Ruan, R. R. and Chen, P. L. (1998). Water in Foods and Biological Materials:A Nuclear Magnetic Resonance Approach. Technomic Publ., Lancaster, PA.
Sacharow, S. (1968). Permeability of package is prime determinant of shelflife. Candy Industry and Confectioners’ Journal. 131(12):17.
Schoffski, K. (2001). New Karl Fischer reagents for the water determination infood. Food Control. 12(7):427–429.
Scott, W. J. (1957). Advances in Food Research III. Academic Press, New York.Sereno, A. M., Hubinger, M. D., Comesana, J. F. and Correa, A. (2001).
Prediction of water activity of osmotic solutions. J. Food Eng. 49:103–114.
Shanbhag, S., Steinberg, M. P. and Nelson, A. I. (1970). Bound water definedand determined at constant temperature by wide-line NMR. J. Food Sci. 35:612.
Shaw, T. M. and Elsken, R. H. (1956). Determination of water by nuclear mag-netic absorption in potato and apple tissue. J. Agric. Food Chem. 4:162–164.
Shaw, T. M., Elsken R. H. and Kunsman, C. H. (1953). Moisture determinationof foods by hydrogen nuclei magnetic resonance. J. Assoc. Off. Agric. Chem.36:1070–1076.
Sherwin, C. and Labuza, T. P. (2006). Beyond water activity and glass transi-tion: A broad perspective on the manner by which moisture can influence
reaction rates in foods. In: Water Properties of Food, Pharmaceutical, andBiological Materials, M. Pilar et al., Eds. Taylor and Francis, New York.Chapter 20.
Sherwin, C., Labuza, T. P., McCormack, A. and Chen B. (2002). Cross-polarization /magic angle spinning NMR to study glucose mobility in amodel intermediate-moisture food system. J. Agr. Food Chem. 50:7677–7683.
Silver, M. and Karel, M. (1981). The behavior of invertase in model systems atlow moisture content. J. Food Biochem. 5:283–311.
Singh, R. P. and Heldman, D. R. (2001). Introduction to Food Engineering, 3rdEd. Academic Press, San Diego, CA.
Slade L. and Levine, H. (1987). Structural stability of intermediate moisturefoods-A new understanding. In: Food Structure- Its Creation and Evaluation,pp. 115–147. J. R. Mitchell and J. M. V. Blanshard, Ed. Butterworths,London.
Slade L. and Levine, H. (1991). Beyond water activity: Recent advances basedon an alternative approach to the assessment of food quality and safety.Critical Rev. Food Sci. Nutr. 30:115–360.
Sloan, A. E. and Labuza, T. P. (1975). Prediction of water activity loweringability of food humectants at high aw . J. Food Sci. 41:532–535.
Sloan, A. E. and Labuza, T. P. (1976). Humectant water sorption isotherms.Food Prod. Develop. 70.
Smidova, I., Copikova, J., Maryska, M. and Coimbra, M. A. (2004). Crystalsin hard candies. Czech. J. Food Sci. 21(5):185–191.
Smith, P. R. (1965). A new apparatus for the study of moisture sorption bystarches and other food stuffs in humidified atmospheres. In: Humidity andMoisture, Vol III, pp. 487–494. A. Wexler and W. A. Wildhack, Eds. VanNostrand-Reinhold, Princeton, NJ.
Sperling L. H. (1986). Introduction to Physical Polymer Science. Willey-Inter-Science, New York.
Starzak and Mathlouthi, M. (2003). Cluster composition of liquid water derivedfrom laser-Raman spectra and molecular simulation data. Food Chemistry.82:3–22.
Stillinger. (1980). Water revisited. Science. 209(4455):451–457.Sudharsan, M. B., Ziegler, G. R. and Duda, J. L. (2004). Modeling diffusion
of moisture during stoving of starch-molded confections. Food BioproductsProc. 82(C1):60–72.
Supartona, W. and Isengard, H. D. (1998). Karl Fisher titration as analternative method for determining the water content of cloves. Lebensmittel-Wissenschaft und Technologie. 31:402–405.
Taub, I. A. and Singh, R. P. (1998). Food Storage Stability. CRC Press, BocaRaton, FL.
Taylor, A. A. (1961). Determination of moisture equilibria in dehydrated foods.Food Technology. 15:536.
Teng, T. T. and Seow, C. C. (1981). A comparative study of methods forprediction of water activity of multicomponent aqueous solutions. J. FoodTechnol. 16(4):409–419.
Troller, J. A. (1982). Water activity measurements with a capacitancemanometer. J. Food Science. 48(3):739–741.
Troller, J. A. and Christian, J. H. (1978). Water Activity and Food. AcademicPress, NY.
Troutman, M. Y., Mastikhin, I. V., Balcom, B. J., Eads, T. M. and Ziegler, G.R. (2001). Moisture migration in soft-panned confections during engrossingand aging as observed by magnetic resonance imaging. J. Food Eng. 48:257–267.
Vega-Mercado, H., Romanach, B. and Barbosa-Canovas, G. V. (1994). Predic-tion of water activity in food systems. A computer program for predictingwater activity in multicomponent foods Revista Espanola de Ciencia yTechnogia de Alimentos. 34(4):427–440.
Von Elbe, J. H. (1986). Measurement of water activity in confections.Manufacturing Confectioner. 66(11):51–52, 54–56.
Vornhof, D. and Thomas, J. H. (1970). Determination of moisture in starchhydrolysates by near-infrared spectrophotometry. Analytical Chemistry.42:1230.
Wallqvist, A. and Mountain, R. D. (1999). Molecular models of water:Derivation and description. Reviews Comp. Chem. 13:183–247.
Dow
nloa
ded
by [
Tex
as A
&M
Uni
vers
ity L
ibra
ries
] at
14:
23 0
9 Ja
nuar
y 20
14
192 R. ERGUN ET AL.
Walstra, P. (2003). Physical Chemistry of Foods. Marcel Dekker, NY.White G. W. and Cakebread, S. H. (1966). The glassy state in certain
sugar-containing food products. J. Food Technology. 1:73–82.Willis, D. (1998). Water activity and its importance in making candy.
Manufacturing Confectioner. 78:71–74.Wu, J. (2006). Invertase Activity in Fondant, MS Thesis, University of
Wisconsin, Madison, WI.Wunsch, G. and Grunke, S. (1998). Water content, one of the most important
properties of food. Food Control. 12:395–400.
Yoshida, C. M. P., Antunes, A. C. B. and Antunes, A. J. (2002). Moistureadsorption by milk whey protein films. International J. Food Sci. Technol.37(3):329–332.
Zhymria, L. P. (1972). Concentration and temperature ratios of coefficientsof mutual diffusion. Izd Krasnodarskogo ita Pishchevo I Promyshlennosti.2:125–128.
Ziegler, G. R., MacMillan, B. and Balcom, B. J. (2003). Moisture migrationin starch molding operations as observed by magnetic resonance imaging.Food Research International. 26:331–340.