Moisture flux estimates using AIRS version 6 data in the Arctic Boisvert, L. N., D. L. Wu, T. Vihma, and J. Susskind (2014), Verification of air / surface humidity differences from AIRS and ERA-Interim in support of turbulent flux estimation, J. Geophys. 1 Moisture flux: exchange of moisture (water vapor) between the surface (sea ice or ocean) and the lower atmosphere Dr. Linette Boisvert University of Maryland, Earth System Science Interdisciplinary Center (ESSIC), NASA GSFC
Transcript
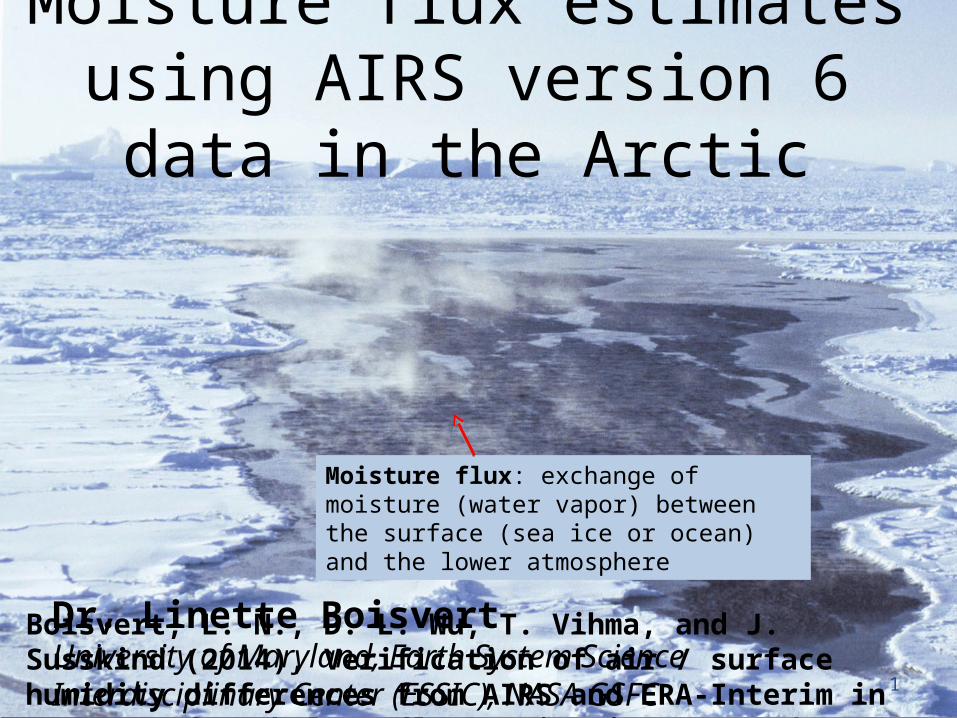
Moisture flux estimates using AIRS version 6 data in the Arctic
Boisvert, L. N., D. L. Wu, T. Vihma, and J. Susskind (2014), Verification of air / surface humidity differences from AIRS and ERA-Interim in support of turbulent flux estimation, J. Geophys. Res., accepted. 1
Moisture flux: exchange of moisture (water vapor) between the surface (sea ice or ocean) and the lower atmosphere
Dr. Linette BoisvertUniversity of Maryland, Earth System Science Interdisciplinary Center (ESSIC), NASA GSFC
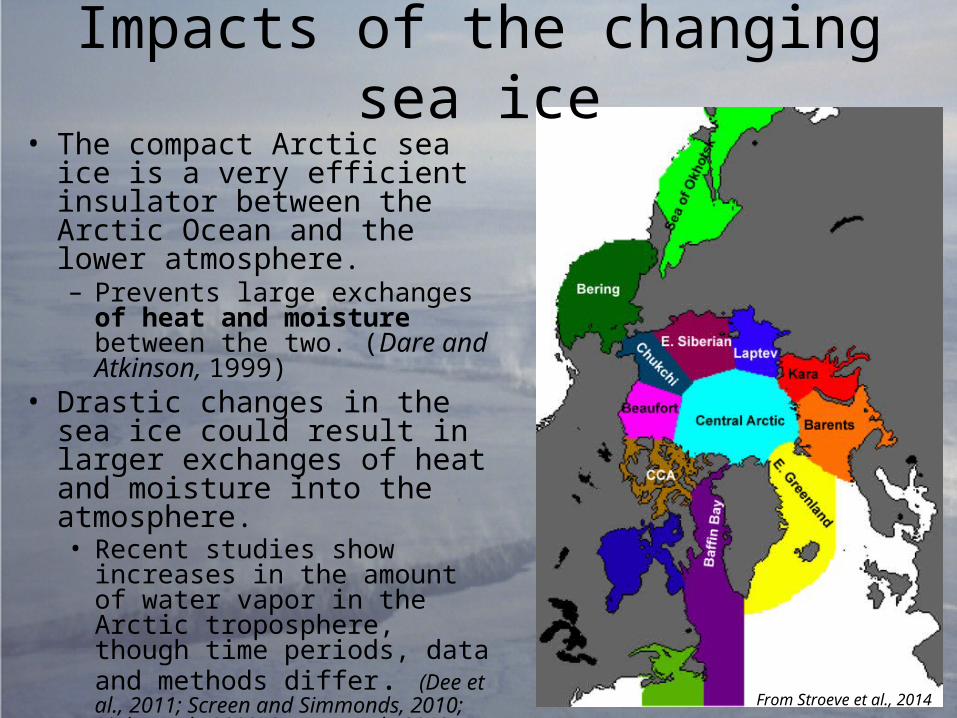
Impacts of the changing sea ice• The compact Arctic sea ice is a
very efficient insulator between the Arctic Ocean and the lower atmosphere. – Prevents large exchanges of
heat and moisture between the two. (Dare and Atkinson, 1999)
• Drastic changes in the sea ice could result in larger exchanges of heat and moisture into the atmosphere.• Recent studies show
increases in the amount of water vapor in the Arctic troposphere, though time periods, data and methods differ. (Dee et al., 2011; Screen and Simmonds, 2010; Rinke et al., 2009; Serreze et al., 2012 )
From Stroeve et al., 2014
Why accurate estimates of the moisture flux is important
• Reanalysis data show an increase in moisture in the lower atmosphere in autumn [Serreze et al., 2012].
• Increase in water vapor due to loss of sea ice cover are playing a large role in fall and winter atmospheric warming [Vavrus et al., 2011].
• The addition of water vapor into the atmosphere will enhance the loss of sea ice & in some GCM’s is more important in Arctic amplification than surface albedo feedback [Screen & Simmonds, 2010].
• Increases in lower atmospheric water vapor can lead to an increase in low-level cloudiness [Shupe et al., 2013].
Problems with estimating the moisture flux
• Calculating the moisture flux continues to be a difficult quantity to estimate [Dong et al., 2007].– Cannot be measured directly– In situ observations of input variables sparse
• Estimating the flux continues to be a problem in global data assimilation systems, particularly over high latitudes oceans [Bourassa et al., 2013].– Models do not contain parameterizations that are
suited for the Arctic. – Other issues: turbulent transfer coefficient & surface
roughness lengths not well known
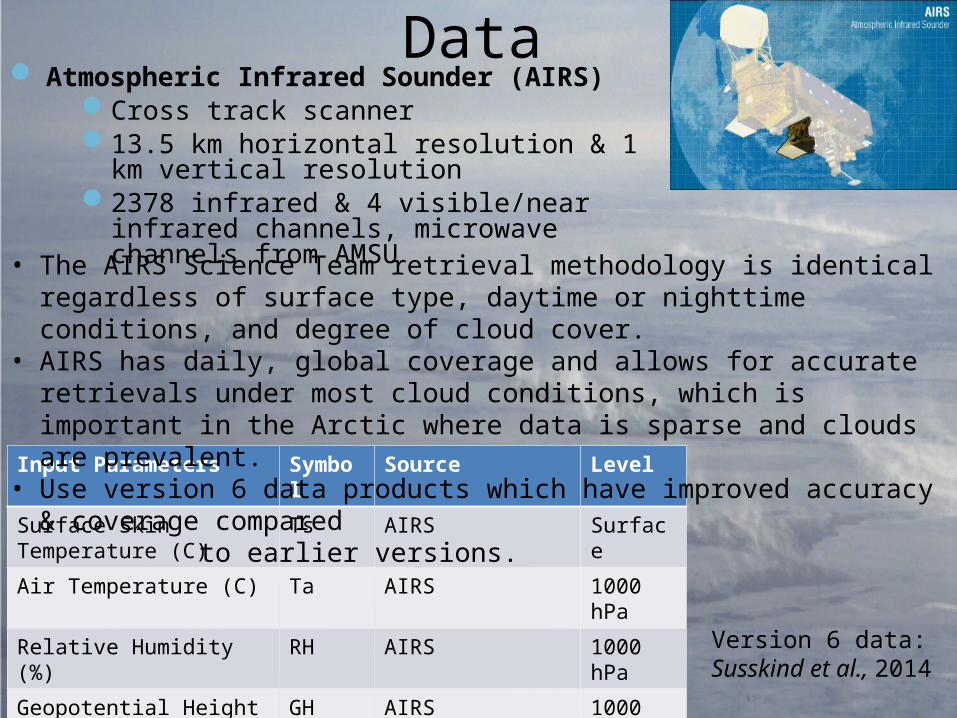
Data Atmospheric Infrared Sounder (AIRS)
Cross track scanner13.5 km horizontal resolution & 1 km vertical
• The AIRS Science Team retrieval methodology is identical regardless of surface type, daytime or nighttime conditions, and degree of cloud cover.
• AIRS has daily, global coverage and allows for accurate retrievals under most cloud conditions, which is important in the Arctic where data is sparse and clouds are prevalent.
• Use version 6 data products which have improved accuracy & coverage compared to earlier versions.
Version 6 data: Susskind et al., 2014
Effective Wind Speed
(m/s)
Specific Humidity of the air (kg/kg)
Moisture Flux
(kg/m2s)
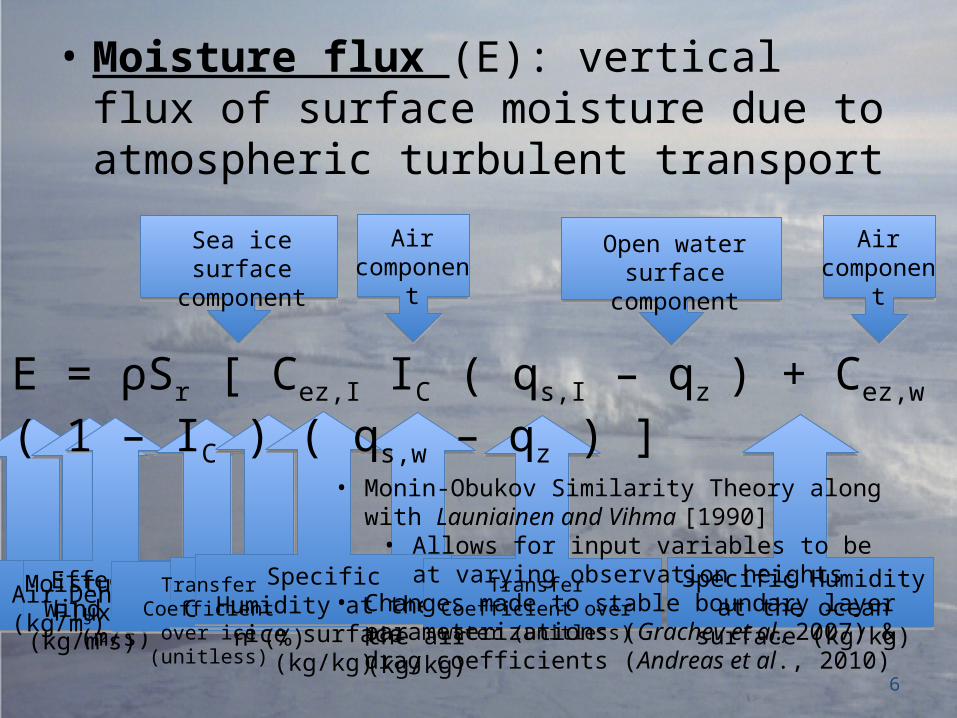
• Moisture flux (E): vertical flux of surface moisture due to atmospheric turbulent transport
6
Air Density (kg/m3)
Ice Concentration
(%)
Specific Humidity at the ice surface
(kg/kg)
Specific Humidity at the ocean surface
(kg/kg)
Transfer Coefficient over water (unitless)
Transfer Coefficient over
ice (unitless)
Sea ice surface component
Open water surface component
Air component
E = ρSr [ Cez,I IC ( qs,I – qz ) + Cez,w ( 1 – IC ) ( qs,w – qz ) ]
Air component
• Monin-Obukov Similarity Theory along with Launiainen and Vihma [1990]• Allows for input variables to be at varying
observation heights• Changes made to stable boundary layer
parameterizations (Grachev et al., 2007) & drag coefficients (Andreas et al., 2010)
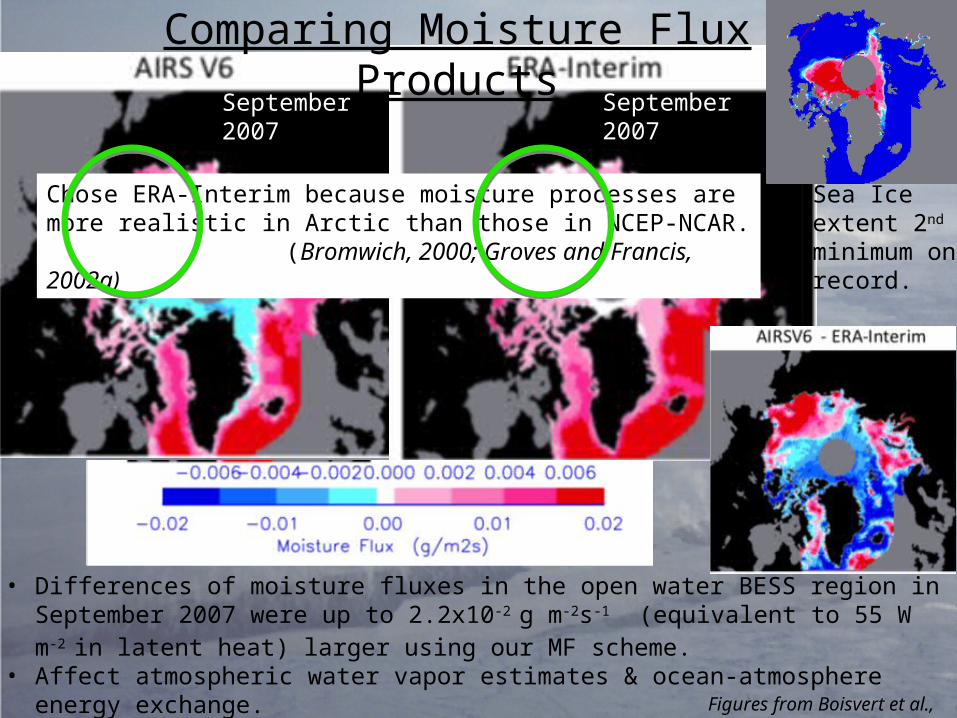
• Differences of moisture fluxes in the open water BESS region in September 2007 were up to 2.2x10⁻²
g m-2s-1 (equivalent to 55 W m-2 in latent heat) larger using our MF scheme.• Affect atmospheric water vapor estimates & ocean-atmosphere energy exchange.
Comparing Moisture Flux Products
Sea Ice extent 2nd minimum on record.
Chose ERA-Interim because moisture processes are more realistic in Arctic than those in NCEP-NCAR.
(Bromwich, 2000; Groves and Francis, 2002a)
Figures from Boisvert et al., 2014
September 2007 September 2007
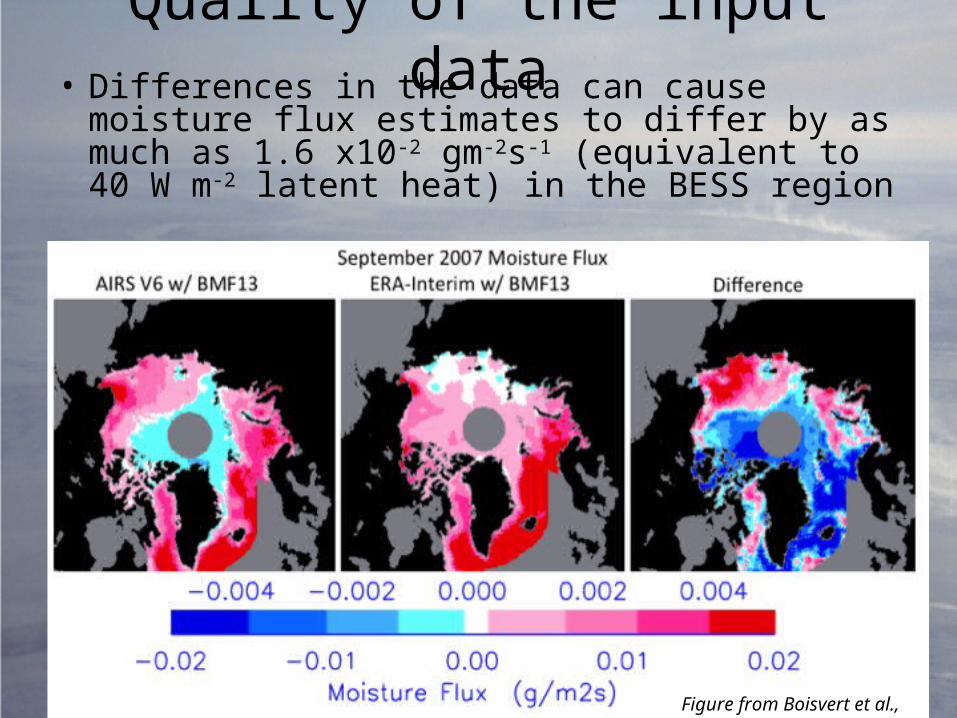
Quality of the input data• Differences in the data can cause moisture flux
estimates to differ by as much as 1.6 x10⁻² gm-2s-1 (equivalent to 40 W m-2 latent heat) in the BESS region
Figure from Boisvert et al., 2014
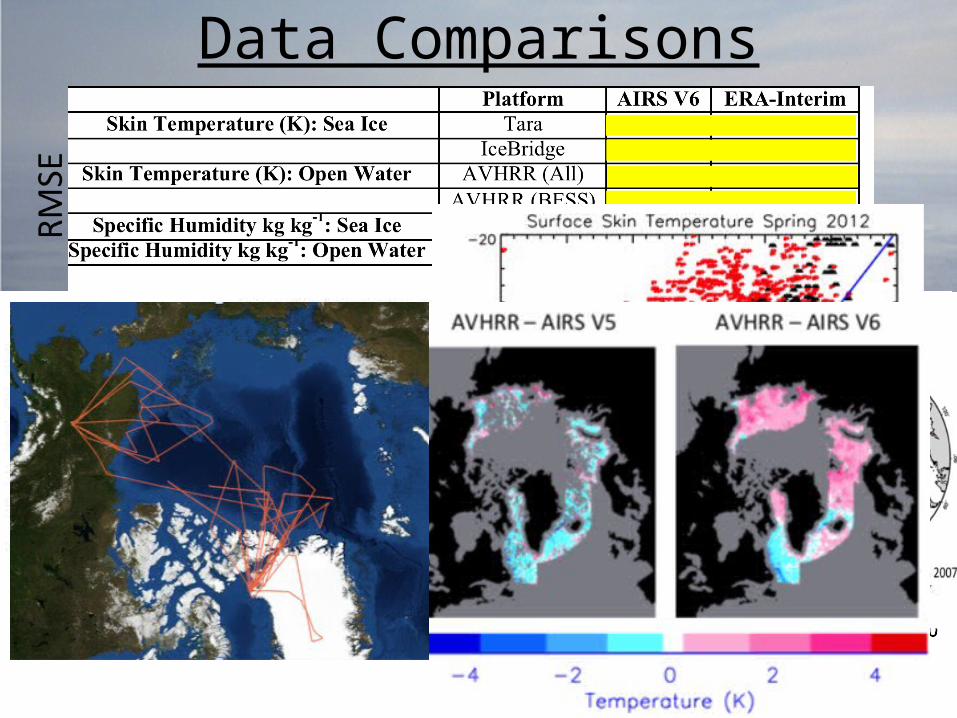
Data Comparisons
Figures from Boisvert et al., 2014
PolarsternERA-InterimAIRS V6
Tara AIRS V5ERA-Interim AIRS V6
Summary
• AIRS has some limitations, however it is still a fairly reliable data source & we trust our moisture flux products• 18% error when compared to the average moisture flux
(Boisvert et al., 2014)– Air specific humidity product accuracy needs to be improved
• Quality of the input data is very important• Would like to see more in situ measurements made in the Arctic
Large cold bias in SST -> lower qsSlight positive bias in qa -> smaller magnitude of qs-qa -> decreased moisture flux
AIRS V6 overestimates the qs-qa difference slightly
Moisture flux trends seen in the Arctic
Using AIRS V6 data
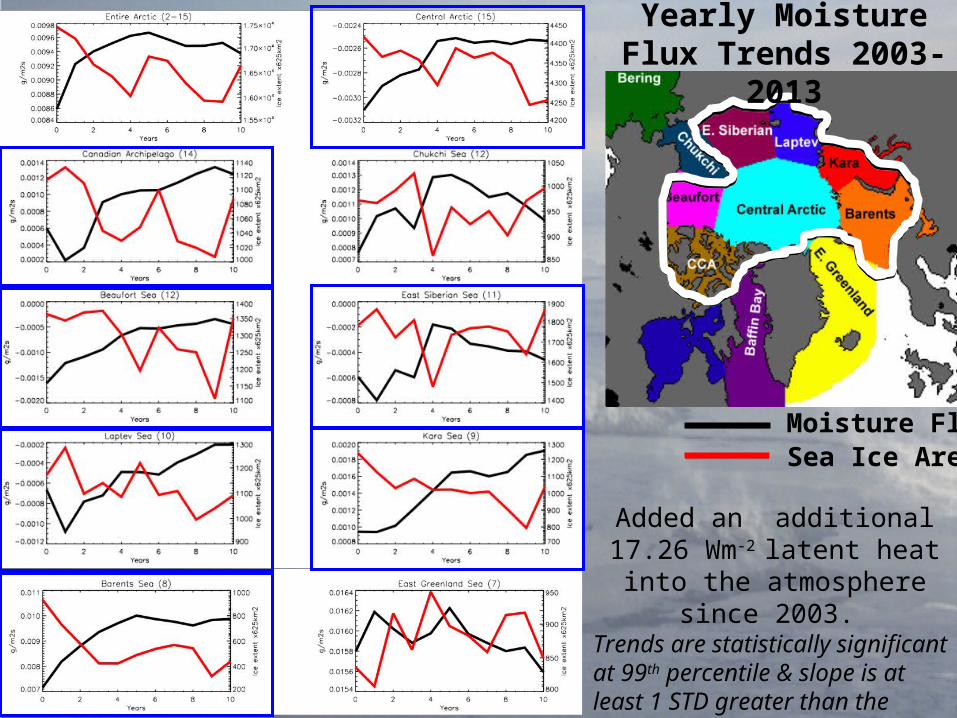
Yearly Moisture Flux Trends 2003-2013
Trends are statistically significant at 99th percentile & slope is at least 1 STD greater than the error.
Moisture FluxSea Ice Area
Added an additional 17.26 Wm-2 latent heat into the atmosphere since 2003.
MF trends seenYearly Skin Temperature Trend
Yearly Cloud Fraction Trend
Areas with increasing moisture flux trends are same areas where there are large skin temperature trends.
Yearly Moisture Flux Trends 2003-2013
Greenland
GreenlandGreenland
Yearly Ice Concentration Trend
Greenland
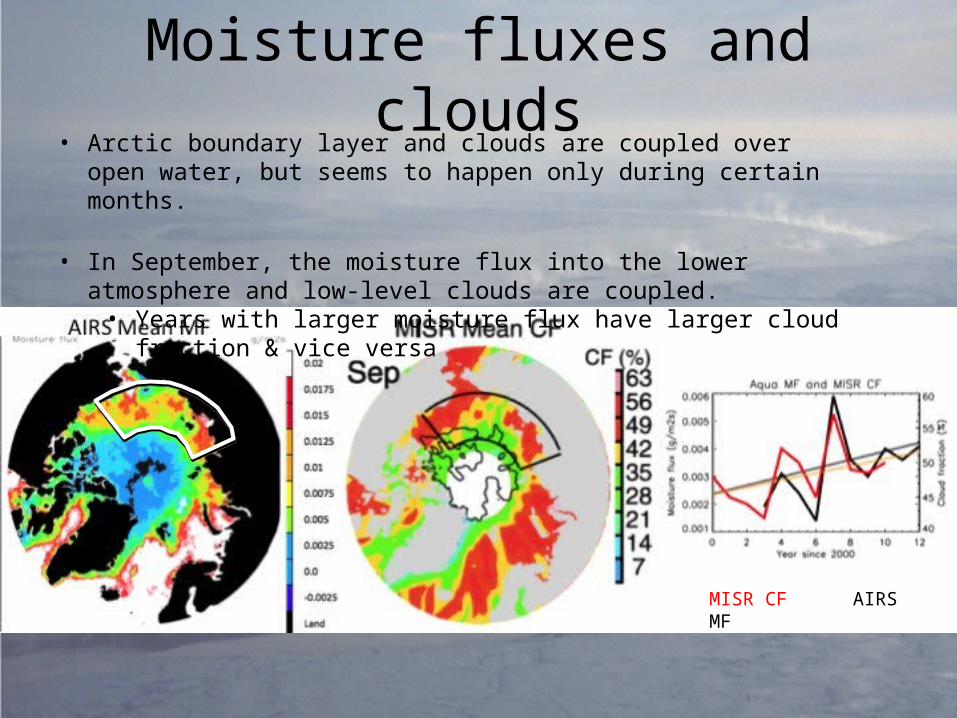
Moisture fluxes and clouds• Arctic boundary layer and clouds are coupled over open water, but seems to
happen only during certain months.
• In September, the moisture flux into the lower atmosphere and low-level clouds are coupled.• Years with larger moisture flux have larger cloud fraction & vice versa
MISR CF AIRS MF
Conclusions• Moisture flux is increasing over the majority of the region
on a yearly and seasonal (September & October, not shown) basis between 2003-2013. – These increases are seen where there has been a large change
in the sea ice area (Insulation mechanism from Screen & Simmonds, 2010).
– Smaller sea ice area leads to an increase of radiation into the open water surface (Perovich et al., 2008), increasing the skin temperature which in turn leads to a larger flux of water vapor into the atmosphere.
– More water vapor in the atmosphere leads to a higher occurrence of clouds in the fall when air temperatures drop.
– Larger moisture fluxes enhance the water vapor feedback, warming the air temperatures and causing Arctic amplification.