2008 / 3 1Significance of the evaporite occurrences in the Hawasina Window, Oman Mountains 1CO 2 capture – New challenge in refinery industry 1Transporting benzene and toluene by pipeline – First at MOL in the world MOL Scientific Magazine MOL SCIENTIFIC MAGAZINE 2008 / 3
Transcript
2008 / 3
1Significance of the evaporite occurrences in the Hawasina Window, Oman Mountains
1CO2 capture – New challenge in refinery industry
1Transporting benzene and toluene by pipeline – First at MOL in the world
MOL Scientific Magazine
MO
L S
CIE
NTI
FIC
MA
GA
ZIN
E 2
00
8 /
3
1
2008/3
MOL Scientific Magazine
MOL Scientific Magazine
CONTENTS
Challenges
György Wilde, Dr.: Alternative fuels, alternative vehicles 5
Gabriella Szalmásné, Dr. – Péter Dinka – Arthur Thernesz – Tibor Simon: CO2 capture – New challenge in refinery industry 12
Focus
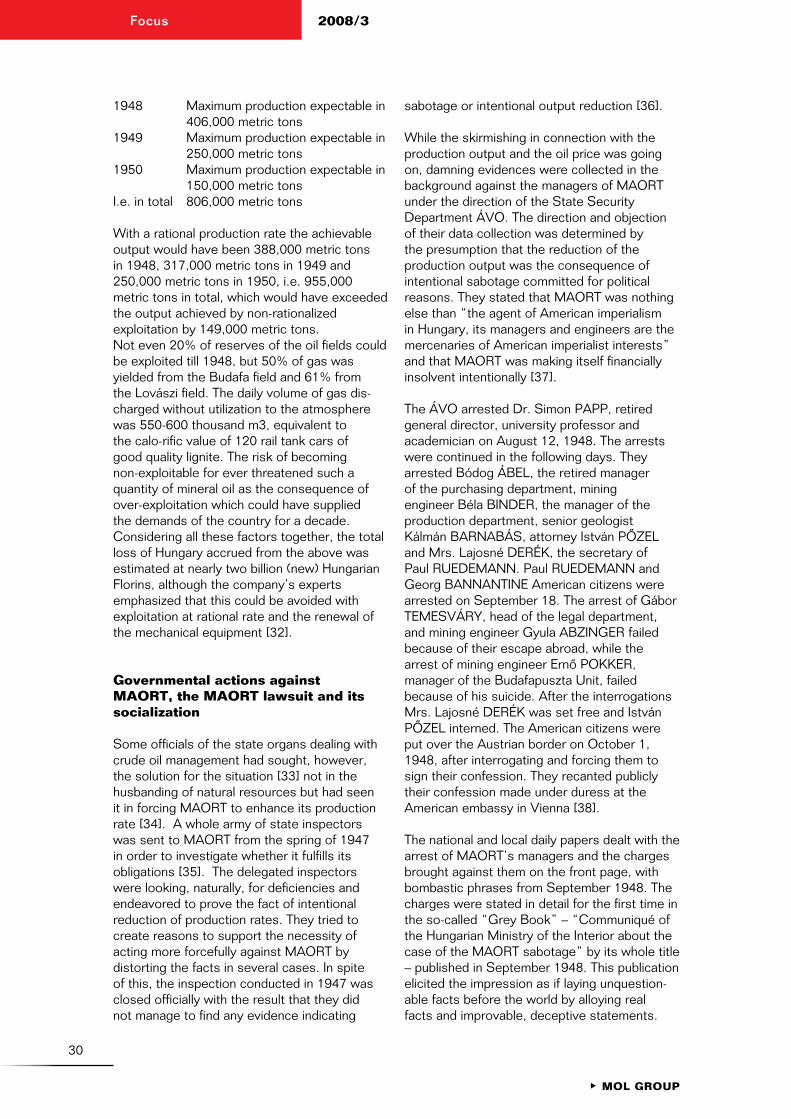
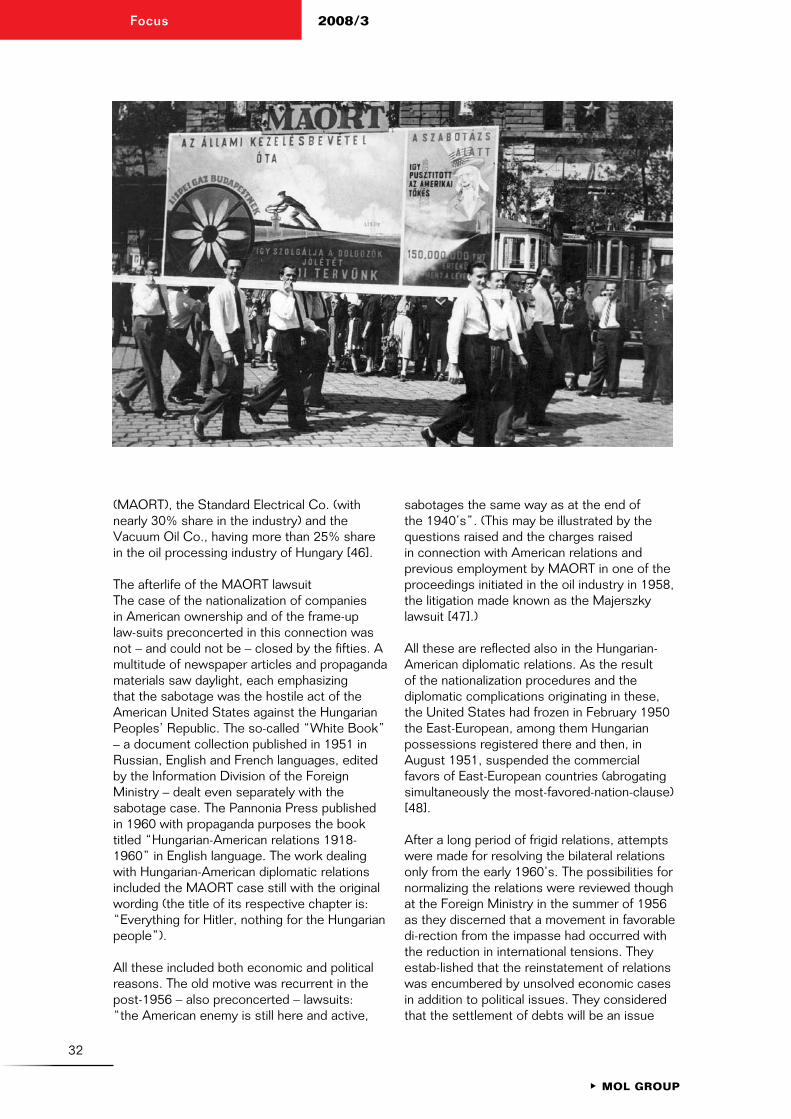
Lajos Srágli: Hungarian economy, policy and the Hungarian-American Oil Co. (MAORT) 25
István Lakat – Károly Horváth – Tibor Munkácsi – Tamás Deme – Kornél Csernik: Refinery shuttle – An innovative and efficient logistics solution for supporting the refinery operation optimized on MOL group level 38
Zsolt Buláth – Beáta Juhász: Building leadership for the future: The role of new MOL Group leadership competency model and the 360-degree feedback in leadership development 45
Development
Lajos Benedek – János Geiger – Veronika Pipicz – István Papp – Gyula Nagy – Ilona Tóth-Varga – Mária Ósvay Hnisz: Gas supply security or enhanced gas recovery? With adequate reservoir management – No need to choose! 50
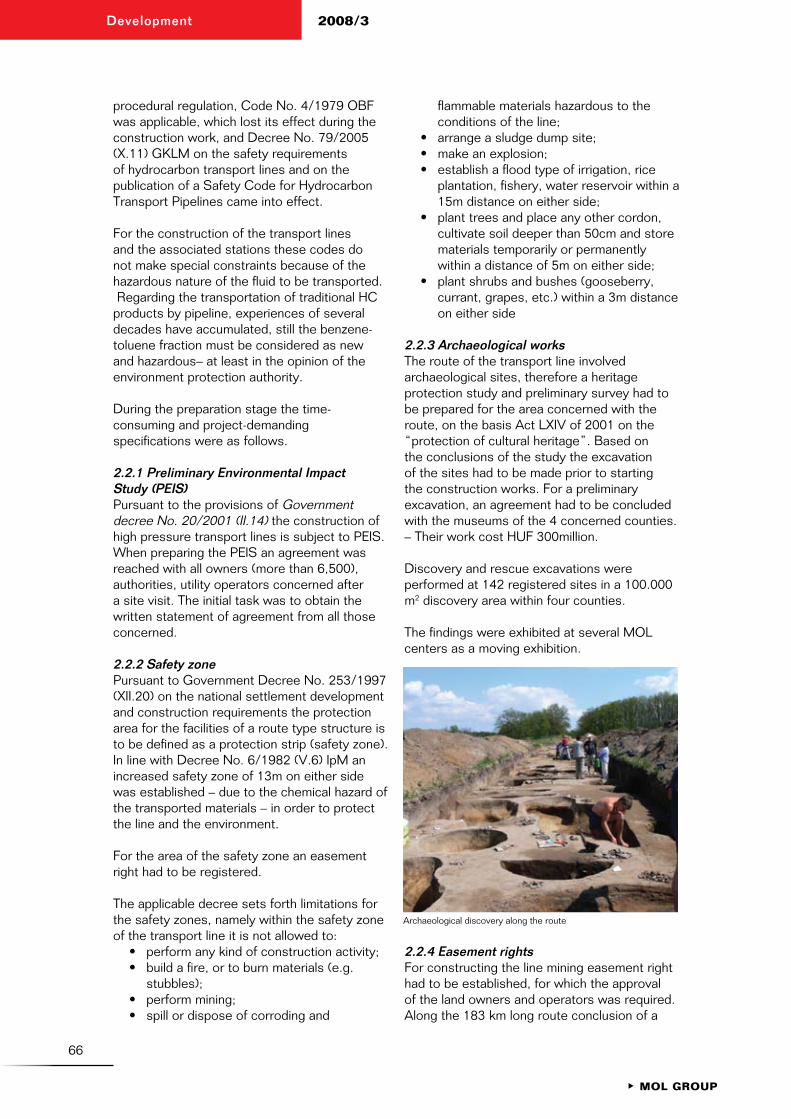
László Attila Bíró: Transporting benzene and toluene by pipeline – First at MOL in the world 63
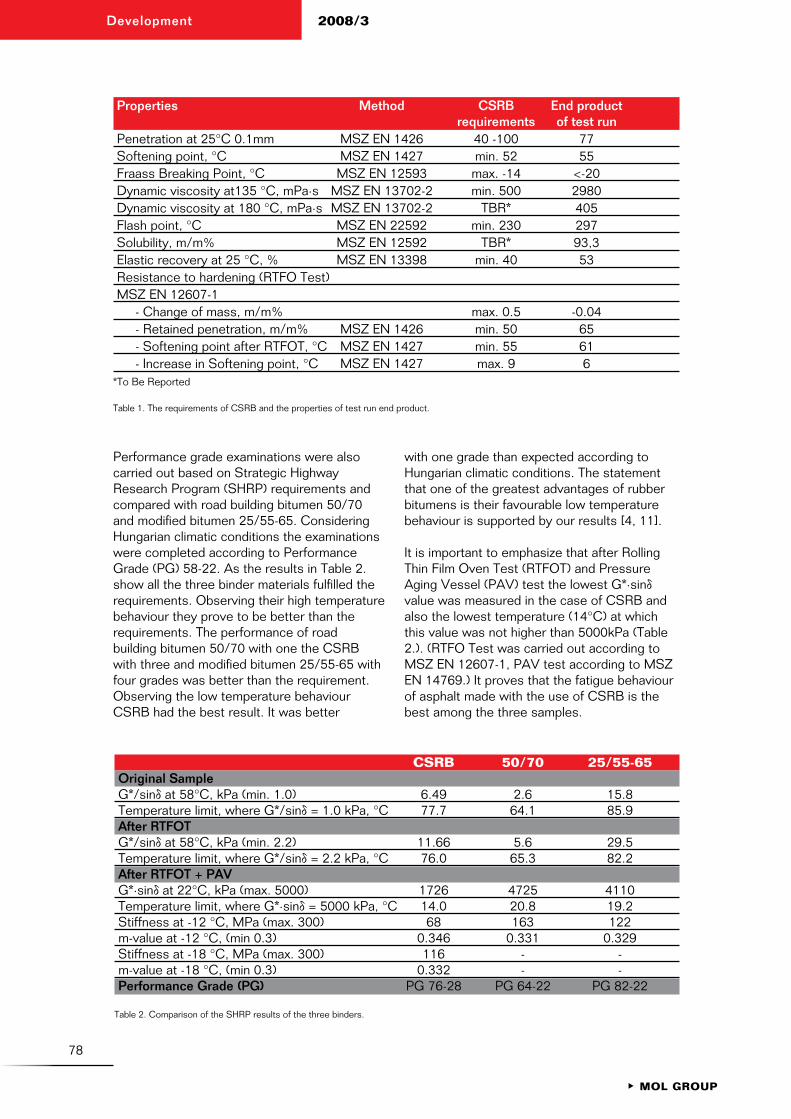
András Geiger – László Bartha – Péter Gergó: Chemically stabilized rubber bitumens 75
Jenô Hancsók, Dr. – Jenô Baladincz – László Szabó – Gábor Nagy, Dr.: Possibilities of processing used lubricating oils – Part 1. 81
2008/03
2
1MOL GROUP
2008/3MOL Scientific Magazine
Workshop
Ágoston Sasvári – Tamás Pocsai – László Csontos – Gizella B. Árgyelán: Significance of the evaporite occurrences in the Hawasina Window, Oman Mountains 87
Kristian Bartos: AVD6 unit revamp-study 93
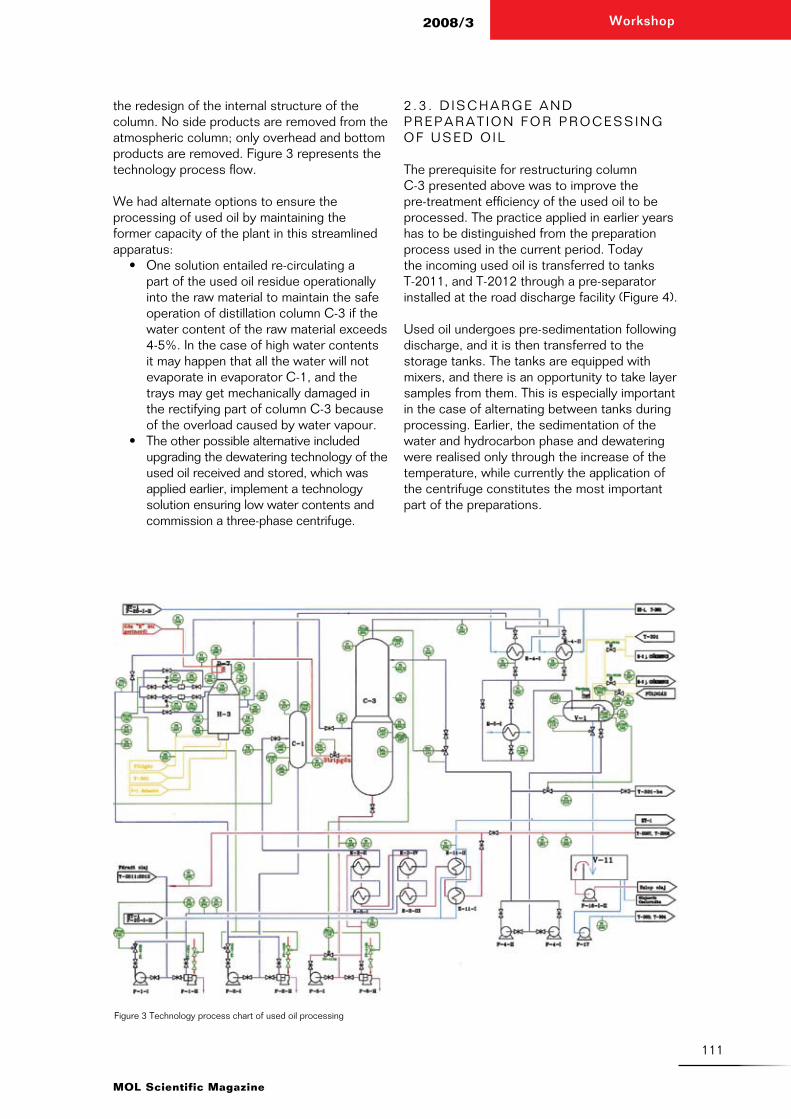
Tivadar Gál, Dr. – Szabolcs Simon: Performance monitoring and optimization of steam crackers 101 Rudolf Durgó – Gábor Bodnár: Used oil processing and utilisation in the Zala Refinery 107
Réka Söjtöriné Mészáros – Henrietta Horváth: Compliance with future regulation of air quality management in refining 115
György Isaák – Edit Reiterné Kondor – Éva Börzseiné Gyôry – Péter Söjtöri: Possibilities for wastewater reuse in Duna Refinery 124
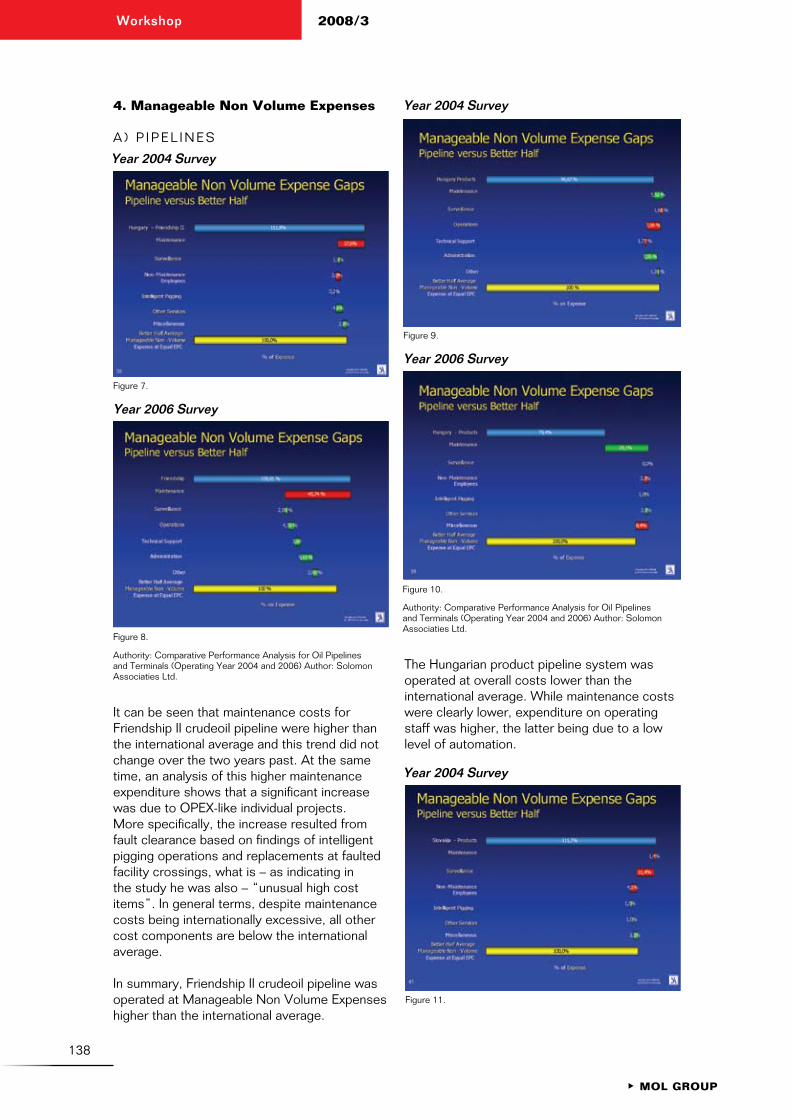
István Gergely: Maintenance related conclusions of two consecutive Solomon studies at logistics 137
Editorial Board: Béla Csorba; István Godó; Jenô Hancsók, Dr.; Horváth Péter; László Isaák; Pál Kapusy; Zoltán Kocsis; Márta Krámer, Dr.; László Lázár; Zoltán Marton; Zsolt Molnár; Attila Plecskó; László Rácz, Dr.; László Rácz, Jr.; Nóra Saláta; Dóra Somlyai; Gabriella Szalmás, Dr.; Artur TherneszManaging editor: Katalin GelencsérChairman of the Editorial Board: György Mosonyi
ISSN 2060-338X
MOL Gold and Silver Fuel Cards are currently accepted at almost 1,200 filling stations across
seven European countries, comprising the MOL network in Hungary, Romania, Serbia and Slovenia,
the Slovnaft chain in Slovakia, Tifon and INA filling stations in Croatia, MOL and Roth networks
in Austria, as a convenient payment method for companies operating vehicle fleets.
For more detailed information about MOL Cards please visit www.molgroup.hu
AE kartya hirdetes angol.qxd 12/2/08 10:47 AM Page 1
5
MOL Scientific Magazine
Challenges2008/3
Abstract
Due to high oil prices as well as the possible problems of oil supply one can often hear of alternative fuels and alternative vehicles. The article overlooks the types of fuels that can substitute today’s gasoline and diesel and investigates what could come after the internal combustion engine. Problems relating to the above possibilities are discussed as well as governments measures instrumented in order to promote the use of propellants and propulsions differing from the present ones.
Összefoglalás
Alternatív üzemanyagok, alternatív jármûvek A magas olajárak és az olajellátás esetleges problémái miatt gyakran hallani az alternatív üzemanyagokról és az alternatív jármûvekrôl. A cikk áttekinti, hogy a mai benzin és gázolaj helyett milyen üzemanyagok jöhetnek szóba, valamint hogy mi válthatná fel a belsôégésû motorokat. Ismertetésre kerülnek a fenti lehetôségekkel kapcsolatos problémák, illetve az, hogy az egyes kormányok miként igyekeznek elôsegíteni a maitól eltérô hajtóanyagok és meghajtások elterjedését.
Today some experts say there is an oil crisis. Under such circumstances, it is quite normal that the media is full of talks about alternative fuels and alternative vehicles. In the present article we discuss these topics but in the very beginning let us define what we mean by these concepts. At least in the present lecture:
• alternativefuelmeansanymaterial(natgas, DME, E85, B10 etc) which differs from the present automotive gasoline defined in the standard EN 228 or from the present diesel standard defined in the standard EN 590 (e.g. the Swedish A1);
• alternativevehiclemeansapropulsionthat differs from the present internal combustion engine irrespective of the fuel on which it runs (e.g. alternative vehicle in the Honda Clarity driven by fuel cell or Toyota Prius having hybrid propulsion, but the “H” series of BMW or the rotation (Wankel) engine of Mazda are not alternative because they have ICE propulsion even if in very unusual ways).
We shall discuss these two topics and a third one concentrating on government initiatives to help the spread of alternative fuels and alternative cars.
1. Alternative fuels
The majority of people even used to consider gasoline and diesel as “natural” fuels for engines. It can not be repeated enough times that Nicolaus August Otto designed an engine running on ethanol in 1876 and Rudolf Diesel designed an engine running on chestnut oil in 1897. The reason is very simple: by that time there was neither gasoline nor gasoil in the present meaning of the word. Neither ethanol nor biodiesel are new ideas today. Anyhow, there are now very strong forces behind biofuels so let us divide the altfuels into two groups: biofuels and other alternative fuels.
For Europe, Directive 2003/30/EC published on May 8th, 2003 [1] is of decisive importance. Its exact title is “directive on the promotion of the use of biofuels or other renewable fuels for transport”. Even the title is delusive to a certain extent because it speaks of biofuels and says no word on other renewables.
Article 2 of the Directive defines biofuel as a liquid or gaseous fuel for transport
György Wilde, Dr. (56) Chemical engineerHungarian Petroleum AssociationE-mail: [email protected]
Alternative fuels, alternative vehicles
6
1MOL GROUP
2008/3Challenges
produced from biomass. Biomass is defined as biodegradable fraction of products, wastes and residues.
B I O F U E L S
The crude oil production of the world in 2006 was cca. 4 billion tons, out of which some 2 trillion liters of gasoline and gasoil are manufactured (4 billion tons is equal to the double water volume of Lake Balaton, 2 trillion means a 2 and twelve zeros.) Compared to it the 49 million tons of ethanol and 6 million tons of biodiesel it seems they differ from the quantities of petroleum based fuels.
In 2006 from the world’s transportation fuels 58% was gasoline, 38% diesel and 4% the so-called alternative fuels. Let us look at the alternative fuels, out of which 45% was natural gas, 27% propane-butane and 28% was the so-called biofuels. It means that some 1% of the total fuel consumption was biofuels.
Sometimes they are called to be produced by the first generation process simply because it is the classical way and sometimes because their raw material can be used for raw material for food. I have to admit I saw fantasy in biofuels some years ago.
Let us see the main problems:• Energy.Theirheatingvalueislessthan
that of petroleum based fuels. In the case of biodiesel-gasoil the difference is not too significant but the heating value of ethanol is just 70% of the heating value of gasoline which means that the consumption of a car running on ethanol is 20-30% higher than the consumption in the case of gasoline.
• Productioncost.Duetoagri-origin,biofuels can not compete with petroleum based fuels produced by efficient way today. To initiate the spread of biocomponents, a national and EU incentive system is the key economic driver.
• Environmentalprotection.Inthebeginning, green movements were enthusiastic supporters of biofuels. In the meantime they changed their mind and now they speak of deforestation in the tropical areas and of application of disadvantageous mono-cultures in agriculture. The only one who is still behind the biofuels is the agrarian lobby.
• Availabilityofland.Fordrainageof
agricultural surplus is a good possibility the use of corn or rape as fuel. But if one wants to base transportation fuels on agricultural products he has to face serious shortage. Mr. György Oláh, winner of the chemical Nobel Prize in 2005, said that the annual ethanol production of Brazil could not cover a one-day-demand of the world.
For the time being, European standards for gasoline and diesel allow a maximum of 5 V% ethanol and biodiesel, respectively. Car manufacturers say it is the maximum that an engine can bear without modification. In Europe in some countries a biocontent must be reached in annual basis in other ones each liter fuel must contain biofuel in a given concentration. If the concentration of biofuels is less than 5% no problem is generated for the engine but problems appear in production mainly in the strategic storage. The stability of biodiesel is weak the vapour pressure of ethanol is too high and it is hygroscopic. The latter two difficulties could be solved if at fermentation not ethanol but butanol were produced. There are some efforts in this direction but not economical solution was found so far.
O T H E R A L T E R N A T I V E F U E L S
Let us start with those alternative fuels that are close to the ones spoken earlier. As I mentioned the car manufacturers had insisted on the maximum 5 V% of biofuels in petroleum based fuels. To be correct, not in each country was it taken seriously. For example in France the standard allows 7 V% biodiesel in gasoil, because the car importers association said the diesel engines can be operated with this concentration. In Germany the car importers insisted on 5 V%. It is a little bit strange for me. A diesel Mercedes manufactured in Böblingen can be operated by B7 in France but the same car in Germany can be operated with a gasoil that contains maximum 5 V% biodiesel.
In some countries the sale of pure biodiesel, the so-called B100 is allowed, too. In Hungary it could be sold but tax incentive is given just in that case if it is blended into gasoil so B100 would be too expensive and for this reason no station sells if. In America B50 can be sold in summer and B20 in winter but without tax incentive and in some “farmer states” like Iowa or Minnesota B2 is sold with state incentive (in the end I will speak of the American taxation system that widely differs from the European
7
Challenges2008/3
one). In Brazil B2 is compulsory and B5 will be compulsory from 2013. In Argentina B5 will be compulsory from 2010. It is important to know that in the mentioned American countries the production of biodiesel is much cheaper as the raw material is soybean not rape or sunflower and soybean in cheaper.
As regards alcohol, there is just one country, Brazil, where it is compulsory to blend ethanol into gasoline in 25 V%. In many European countri es and in the USA the so-called E85 can be sold. It is a mixture of ethanol and gasoline where the concentration of the first component varies between 70 and 85 V%. Both in the case of E85 and in Brazilian E25 some parts of the vehicle must be changed for example the sealings because due to its different character alcohol dissolves such parts that gasoline does not.
In Hungary E85 got a massive political support (among others its taxation is carried out in another way than in the case of gasoline). Despite it E85 was not a success story. In 2007 175,000 liters of E85 and almost 2 billion liters of gasoline were sold which means there is four order of magnitude between the two similar purpose products. Although the tax of E85 is much less than that of gasoline, due to the less energy content of alcohol which means a bigger consumption of cca. 30%, it is not cheaper in the reality.
Bioethanol and biodiesel are hardly alternative for gasoline and gasoil due to the reasons I mentioned earlier. But there exists a difficulty: mankind use so much energy in a year that can be produced in 400 years by the biosphere. Later or earlier we have to face serious problems and we have to find solution so let’s consider other solution they can be divided into two categories: which are produced from biomass and so are renewable and those which are based on natural gas or other raw material like coal. I have learned to syntheses that are based on biomass and have perspectives. One of them aims at ethanol the other one at substitution of diesel.
The COSKATA procedure [2] produces from biomass a mixture which is the raw material of a catalytic reaction that produces cheap alcohol. The owner of the procedure states that with his procedure a gallon of ethanol costs less than one dollar. It is ridiculously cheap but there is a big trouble the owner could not name even a pilot plant. If it is not just a dream or a tough
calculation of prices it is a gold mine. But for the time being one can not be sure of it.
The other biomass based solution is much more factual. An Argentine research institute patented the BIO-OIL procedure [3]. The basis in a heat-shock at about 500 oC, and it ends with in Fischer-Tropsch synthesis and the result is a gasoil-like material. The idea has been embodied. There is a plant in Guelph, Ontario, Canada which is in operation and starting from saw dust of pine tree it generates some 200 tons of fuel a day.
Just still some words on the so-called second generation biofuels. The Finnish NESTE has patented a procedure in which the vegetable oils/animal fats are not transestherified but hydrogenated. The result is long straight hydrocarbons with very high cetane number, propane and water. The only trouble is the source of hydrogen. It is difficult to estimate if the Neste procedure in lucrative or not. What does it mean? Neste has an industrial plant producing 170,000 tons/a and now the Finns are building the next plant with the same capacity. A similar plant is being built in Denmark and a very big having a capacity of 800,000 t/a is being built in Singapore. The dark or at least the unsure side of the coin is that Total has built a similar plant in Dunderque which is out of operation because it is not economical. We live in an interesting world. An industrial procedure that is economical in Finland is not economical in France. Thereafter we can simply understand the doubts of OMV who can not decide if built up such a plant or not.
The other so-called second generation solution is based on cellulose. This idea itself it not new at all. The saccharization of cellulose is some hundred year old. From cellulose in the first step sugar is generated and thereafter sugar is converted into alcohol. There is just one trouble: the cost. But anyhow, very big companies pour money in it and one can imagine that on a nice day it will be lucrative.
Let’s see now the other fuels which can be alternative but not renewable. The most evident is natural gas either in liquefied or in compressed form. The main trouble of use of the natural gas is the tank of the car. In the case of liquefied natural gas special (and expensive) insulation is needed, if compressed natgas is applied the construction material of the tank must be a composite where the strong
MOL Scientific Magazine
8
1MOL GROUP
2008/3Challenges
component is carbon fibre. Not a cheap solution but promising. The number of cars running on natgas is surprisingly high in some countries, for example in Italy is over 40,000 ones. Natural gas can be raw material for fuel cells but in the first step it must be converted to hydrogen.
The major advantage of natural gas as a fuel is that in many countries one of the main energy carriers if not the most significant one is natgas. In these countries there exist pipelines reaching even the households and so at these places it won’t be difficult to construct a filling station system.
The next so-called alternative fuel is, or least it can be the “autogas” as it is called in Europe, or propane as it is called in the United States. Both names are delusive. We are speaking of a propane-buthane mixture. It is not gas (mainly at higher pressure) and is not pure propane. But it is subsidized in many countries (among others in Hungary). The only trouble is that there are two subsidies. The mixture of propane-buthane use in households is completely free of tax the one sold at station is levied. Even in the latter case it is much cheaper than gasoline, but the first solution (i.e. the use of untaxed propane-butane bombs in cars) is more “lucrative”. With other word tax “cheating is a good business”.
In medium or long run hydrogen can be a real alternative. Today some 40 million tons of hydrogen is produced by the industry. (The majority is used in ammonia synthesis.) The starting material is natural gas because the reforming is cheaper than the electrolysis of water. But even so, the cheapest hydrogen is some three times more expensive than gasoline or diesel.
From the point of view of the environment the electrolysis is a very friendly procedure – supposed that the electricity was generated in a hydropower-plant or in a nuclear power station. If the electricity was generated in a coal-power-station from the point of view of carbon-dioxide there is not to much advantage and the same is valid if hydrogen is generated from natural gas.
Hydrogen as a fuel has two big disadvantages: it is very flammable and difficult to store. As hydrogen is much easier than air the leakage in the fuel system is not so big problem as it is in the case of “autogas” that can concentrate on the floor of a garage.
Hydrogen can be stored in two ways. If it is liquefied at -253 oC 35% of the energy content is lost. Another question what insulation is needed. BMW produced the so-called 740 H car where the H refers to hydrogen. This very big car had no boot because this space was filled up by the tank and its thick insulation.
If it is stored at a pressure of 700 bars special storage tank must be used as well which is very expensive and the compression needs 12 % of the energy content of hydrogen. To deliver hydrogen to stations in liquefied form is very difficult in gaseous form much simpler mainly if the natural gas pipeline could be used after some modifications.
In spite of all the troubles mentioned above there are some lonely hydrogen stations for example in Tokyo, Munich, Frankfurt, Houston. Arnold Schwarzenegger, governor of California announced to built up “hydrogen highway” in his state and a similar one will be built up in the triangle of Copenhagen-Oslo-Stockholm the so-called Scandinavian Hydrogen Route.
C O N C L U S I O N
Hydrogen can be used in internal combustion engine (see BMW) but the real prospect for its application is the fuel cell.The real alternative of the present gasoline or diesel that material which is:
It was not found yet but in medium run natural gas can be a real alternative and in longer run hydrogen can be the solution.
2. Alternative vehicles
Some car manufacturers has developed the so-called flexi cars. They can be operated by gasoline, by E85 or by any mixture of that two ones (so they are not really “alternatives”). The solution has two disadvantages: it is expensive and is not optimal. I mean that an engine is optimized for a given fuel; it can be gasoline or E85 or any mixture but just one. If an engine is optimized for gasoline it can run on E85 but the efficiency is less. The character of E85 sharply differs from gasoline for example the research octane number of E85 is far above 100.
9
Challenges2008/3
Although flexi cars get state subsidy they are not success stories. In the Hungarian car park less than 100 flexi cars exist.
2 . 1 . E L E C T R I C C A R S
It is hard to believe that there was time when more vehicles ran had electric motor than the internal combustion engine (ICE). Just very few cars run by electricity today despite all governmental efforts. In the beginning of the latest decade the governor of California wanted to promote the use of this type and similarly to the present European biofuel program there was a law prescribing the share of electric cars among the new ones. Today this share should be some 20 %... Although this Californian trial was a shameful failure the electric vehicle is not dead. It is not dead because the propulsion of hybrid cars is partly solved so, and the fuel cell vehicle is an electric car where the “fuel” in produced by the cell furthermore there are some places, for example assembly halls where the goods can not be delivered by vehicles having Otto or Diesel engine, just think of electric wheel-barrow.
The advocates of electric car used to mention the advantages:
On the other hand one has to see that:• emissionisgeneratedinpowerstations• newenvironmentalproblemsappear
(lead, acid)• itisexpensive.
The reason why the electric motor can not compete with ICE can be found in battery. The batteries are heavy, their capacity is low, the re-charge in slow. If the problems of battery is solved the electric car faces a wonderful carrier but so far no solution was found.
2 . 2 . H y B R I D V E H I C L E S
In the hybrid cars not conventional battery is applied but the so-called metal hydride. It is lighter has bigger capacity but it is very expensive. While we are speaking of hybrid vehicles it must be mentioned that they have electric motor and ICE but their operation in harmonized way by the so-called sun wheel,
in the practice it is a version of the differential gear used in each car. Sometimes just the motor works, sometimes just the engine and sometimes both of them are in operation. If we simplify the operation of the hybrid car to an extreme extent it can be said that the motor is in operation in cities the ICE outside the cities and both are operation if the car accelerates. The majority of hybrid cars was made in Japan. The Japanese car manufacturer declared that in short term the solution for the problems is the hybrid car, in medium run the vehicle running on natural gas and on long run the fuel cell. The first hybrid was the Toyota Prius. The prototype was ready in 1997 the sale in North America started in 2000 and it was success story. Some months thereafter appeared Honda Inside. For both cars, one has to join a queue which is not typical in the United States or in Canada. Behind the success stands the low consumption and the silent operation as well as that the governments helps their sales with subsidies. The really good consumption could be achieved if the ICE part of the construction were a Diesel engine. Peugeot has been speaking about starting the production such a car for many years but so far nobody has seen a Peugeot Diesel hybrid. Although more than 1 million Japanese hybrids have been sold in the USA just Ford started with the serial production.
Nowadays a special hybrid car is being developed the so-called PHEV which is the abbreviation of Plug-in Hybrid Electric Vehicle. The commuters do not travel more than 40 miles (60 km) from home to place of works. Hybrids can be built with a special battery having high capacity with which the car can be operated in 40 miles. Our friend arrives at his place of work, in the parking place he re-charges the battery, goes home and re-charges the battery again. He used the car in each working day and the ICE part of the hybrid was not operated. In the weekend when our man wants to travel more than 40 miles when the battery is discharged the ICE part of the car starts to work. This idea is popular among the American politicians because in their opinion the oil dependence of the USA can be reduced in this way. They say the car is running on “American electricity” not on imported oil. It is the other side of the same coin that a huge part of electricity is generated in coal power stations in the USA so this type of cars is operated by coal and emit a lot of CO2 .
MOL Scientific Magazine
10
1MOL GROUP
2008/3Challenges
2 . 3 . F U E L C E L L
The fuel cell is mentioned sometimes as the latest discovery but the principle has been known for more than two hundred years. In fact it is a conversed electrolysis; hydrogen and oxygen is burned in a way that electricity is generated. The fuel cell exists in many version, their common property is the high price but in spite of the high price Hitachi started the serial production (3,000 pieces a month) in 2007 and the first car operated by fuel cell in under serial production. It is Honda Clarity. Its specialty is the fact that one can not buy just lease it. But the cost of leasing is low, 600 USD a month. For the time being these cars are running in Southern California where relatively many hydrogen stations are to be found.
2 . 4 . C O N C L U S I O N
It seems that the development of vehicles in based on ICE in Europe and partly in North America. The Japanese manufacturers state that today’s hit is the hybrid propulsion. It is commonly accepted that the fuel cell vehicles can not be spread within 20 years because of the expensive storage of hydrogen and of the expensive fuel cells.
3. Incentives
In the practice incentive means tax incentive or as it is called in the USA tax credit, and due to the difference of the American and the European taxation system this topic must be divided.
3 . 1 . A . F U E L S I N E U R O P E
In Europe tax incentive is applied in each country although another possibility is given as well, namely to fix in the legislation that the fuels may be sold just in that case if they contain biofuel in a given concentration. This regulation can be found in no EU countries although it would be very favorable from the point of view of state budgets.
In Europe at least two taxes are on fuels: the excise tax and the VAT and in some countries other ones, too (e.g. in Hungary the contribution to the strategic stockpiling). In the EU it is a prescription that in those countries where exist more VAT rate the highest one must be applied for fuels, so the governments has some opportunity to play with the excise tax. The way
of thinking should be very simple; biofuels are more expensive so those fuels containing them should be less taxed irrespectively to the origin.
In some countries (e.g. in Austria or in Hungary) a tax incentive is given if each liter of fuel contains 4.4 V% biofuel. In some countries (e.g. France) the biofuel content can vary between 0 and 5 V% and the tax incentive is in connection with the biofuel content but there is no a minimum limit. In some countries (e.g. in Finnland or in Germany) not each liter has to contain biofuel but on annual average a given minimum must be met.
In order to avoid simplicity the incentive can depend on origin. In some countries (e.g. Poland) the raw material must have been produced in the country where the fuel is sold. Some countries (e.g. Hungary) prescribes European origin otherwise there is no tax incentive. Some countries (e.g. Germany or France) do not deal with the origin. In my opinion the latter ones are right. We have just one Earth.
3 . 1 . B . F U E L S I N A M E R I C A
The principle of taxation in the USA sharply differs from the European one and the American government is not so greedy and as a consequence taxes are much lower. If we strongly simplify we can say that the price of one liter gasoline in Europe is equal to the price of one gallon gasoline in the USA (1 US gallon = 3.78 liters).
In the EU the tax rate is not the same in each member state just a minimum is prescribed which is 359 EUR/1,000 liters for gasoline and 302 EUR/1,000 liters for diesel (why not 360 and 300?). In the USA the basis of taxation is the so-called federal excise tax which is 18.1 cents/gallon (cca. 32 EUR/1,000 liters). The name is delusive to a certain extent because from the federal excise tax just the free interstate highways may be built. The states may levy a tax which is called excise tax, too. Its maximum is the federal excise tax but it shows big differences (e.g. in California it is almost the same as the federal excise tax, in Texas less than the half of it.) Thereafter comes the VAT which is called sales tax in America. The states are free in fixing it so big differences can be experienced. 14% of the sales tax remains at local municipalities and this can be used as incentive for alternative cars.
11
Challenges2008/3
Of course the producers of alternative fuels want zero tax. But even if so, due to the low taxes the field of play is much less. It must be noted, however, that the price of biofuels is much less to which can be thanked to the cheap raw materials. (In contrast to the EU in the USA does not exist a complicated agricultural subsidy system for corn and the basis of biodiesel production is soy bean or palm that are much cheaper than rape or sunflower used in Europe.)
3 . 2 . A . C A R S I N E U R O P E
Tax incentive can be given but it is national authority. For example in Sweden there is tax incentive for cars capable running on E 85, in Hungary is not. In Hungary the registration fee of hybrid cars is much less than the same type with ICE. (E.g. registration fee of a Toyota Corolla is 487,000 forint that of Toyota Prius is 190,000. The registration fee a Lexus is 3,207,000 forint with ICE that of hybrid version is 190,000.) In some countries (e.g. Denmark) the owner of an electric car does not have to pay in urban parking places.
3 . 2 . B . C A R S I N A M E R I C A
In the USA three types are privileged:• whichhavetheso-calledcleanburning
engine• hybrids• whichcanrunonalternativefuels.
It is not decided yet if a car operated by fuel cell is privileged or not but for the time being this question is rather theoretical.
The owner of the privileged car can reduce his personal income tax to a given extent and same is valid if the owner is a company (the latter one can reduce the tax on profit).
The privileged cars can use free those highways, bridges and parking places where the owner of other cars has to pay furthermore they can travel with one person in the so-called HOV lanes. (HOV is the abbreviation of High Occupancy Vehicle). The American HOV lane corresponds to the European bus lanes but can be used for cars with traditional engines if more persons sit in them.
3. 3. Conclusion
Both in Europe and in America the governments want to help the use of alternative fuel and of alternative cars. There is no compulsory concentration of biofuels in traditional fuels and the intended solutions show big differences even within the continents.
References
[1.] Directive 2003/30/EC of the European Parliament and of the Council.
[2.] Wes Bolsen: Coskata. Alternative Fuels & Alternative Vehicles Conference in Las Vegas on May 11-14, 2008
[3.] Gerardo Maioli et al: BIOOIL Production from Biomass by Fast Pyrolisis – Large Scale Plant experience. 19th WPC in Madrid on June 29 – July 3, 2008.
Revised by: Tibor Vuk
MOL Scientific Magazine
121MOL GROUP
2008/3Challenges
CO2 capture – New challenge in refinery industry
Abstract
Emission of CO2 globally has been brought into attention in recent years through declarations such as the Kyoto and recent Bali conventions, and also by industry leaders committing themselves to substantial reductions. One approach to limiting CO2 emissions from combusting of carbon-based fuels is to capture the CO2 . The purpose of CO2 capture is to produce a concentrated stream that can be readily transported to a CO2 storage site. The CO2 capture and sequestration processes are in the development phase. First of all, it is necessary to become acquainted with the current practice and to identify the results achieved in the leading industrialized countries.MOL Group refinery installations, power generation facilities and chemical industry installations are subject to ETS (Emission Trading Scheme) and imposed to growing reduction requirements on GHG emission.
With the currently available techno lo-gies the removal of CO2 from the flue gases is a capital and energy intensive process due to the low pressure, low CO2 concentration and the presence of undesired components in the flue gases. This paper provides an overview of the existing and developing methods and technologies for carbon capture and summarizes the Danube Refinery opportunities to achieve substantial reduction in CO2 release in refinery by capturing CO2 from Hydrogen plant process gas.
Összefoglalás
CO2 kinyerés – új kihívás a kôolajiparban A Kiotói és a közelmúltban tartott Bali klímaváltozási konferencia meg ál lapodásai, továbbá a vezetô ipari hatalmak elkötelezettsége a károsanyag kibocsátás csökkentés mellett egyre inkább a figyelem kö-zép pontjába helyezték a glo bá lis CO2 kibocsátást. A szén alapú fûtôanyagok eltüzelése révén jelentkezô CO2 emisszió csökkentésének egyik le het-séges módja a széndioxid kinyerése. A kinyerési technológia célja, hogy olyan koncentrált formában állítsa elô a széndioxidot, amely könnyen a tárolási helyre szállítható. A széndioxid kinyerési és tárolási technológiák dön-tôen fejlesztési stádiumban vannak, ezért szükséges, hogy áttekintsük a jelenlegi gyakorlatot, azonosítsuk a vezetô ipari országokban elért eredményeket. A MOL-csoport finomítói, erômûvei, vegyipari létesítményei az EU ETS (Emisszió Kereskedelmi Rendszer) hatálya alá tartoznak, elvárás az üveg-házhatást okozó gázok emissziójának növekvô mértékû csökkentése.
Artur Thernesz (44) MEng in Chemical Engineering Refining & Marketing Division, DS Development, Százhalombatta E-mail: [email protected]
Gabriella Szalmás PhD (57)MEng in Chemical Engineering MOL Plc., Refining & Marketing Division, DS Development, Százhalombatta E-mail: [email protected]
Peter Dinka (40)MEng in Chemical Engineering Refining & Marketing Division, DS Development, BratislavaE-mail: [email protected],
Tibor Simon (65)MEng in Chemical Engineering Consulting engineerE-mail: [email protected]
13
Challenges2008/3
A füstgázokban a CO2 alacsony nyo-máson, kis kon centrációban, más egyéb nem kívánt komponensekkel együtt van jelen, az ismert rendel-kezésre álló tech nológiákkal a CO2 eltávolítása rendkívül beruházás és energia igényes folyamat. Jelen cikk áttekintést nyújt a már meg-valósított és a fejlesztési stádiumban lévô CO2 kinyerési technológiákról, a Dunai Finomító esetében bemutatja a CO2 csökkentési lehetôségeket a hidrogén gyártás folyamatában keletkezô CO2 kinyerése révén.
1. Introduction
Climate change is recognized by many observers as a potential threat to the global environment. Predicted impacts include increasing global average temperatures, rising sea levels, and changes in precipitation, with consequences for low-lying inhabited areas, agriculture, biodiversity, and human health [1].The cause of these changes is the increased levels of greenhouse gases in the atmosphere, due to human activities. Global anthropogenic emissions are emitted from industrial, residential, transportation, commercial and agricultural sources.
The major greenhouse gas is carbon dioxide (CO2 ) and the major source of anthropogenic CO2 is the combustion of fossil fuels.The volume of emitted CO2 is estimated to 26 billion metric tons in 2004 and the quantity is increasing in the foreseeable future [2].
1 . 1 I N D U S T R I A L E M I S S I O N S
Industry sectors combined dominate current global CO2 emissions, accounting for about
70% of total CO2 emissions. CO2 emissions from industry sector arise from a number of different sources, but mainly from the combustion of fossil fuels. Carbon dioxide not related to combustion is emitted from a variety of industrial production processes which transform materials chemically or physically. Fossil fuels currently supply over 80% of the world’s energy needs and will remain in abundant supply well into the 21st century [3].
A database of 8049 industrial facilities around the world has been compiled. Each of the facilities emits more than 100 kt CO2 annually [4]. Together these facilities account for 13-14 Mt/year CO2 in y 2006, mainly from industrialized countries (Figure 2.).
The main large stationary sources of CO2 in industry can be sorted:
• Powerplantsemitmorethanone-thirdof the CO2 emissions worldwide. Power plants are usually built in large centralized units, typically delivering 500-1000 MW of electrical power.
• HeatgenerationtocoverownprocessFigure 1. World carbon dioxide emissions by region, 2003 – 2030
MOL Scientific Magazine
Figure 2. Database of 8049 industrial facilities: CO2 emissions from large stationary sources
14
1MOL GROUP
2008/3Challenges
heat requirement of different industries (oil refining, cement production, metallurgy, etc.)
• Severalindustrialprocessesproducehighly concentrated streams of CO2 as a byproduct. Industrial processes that lend themselves to carbon capture are ammonia manufacturing, fermentation and hydrogen production.
• Naturalgascomingoutfromthewellsoften contains a significant fraction of CO2 that could be captured and stored.
1 . 2 R E F I N E R y E M I S S I O N S
Refinery emissions account for about 5% of industrial emissions worldwide. Most emissions from the refinery itself originate from the feedstock used. These feedstock are the main crude oil(s) to be processed, plus other imported feedstock, such as condensates or VGOs, and supplementary natural gas for fuel or hydrogen plants. Whilst most carbon emissions from the refinery will be in the form of CO2 , there are other emissions, such as VOCs, coke on catalysts (which could be landfilled) and other minor emissions. Shadow emissions from energy import (CO2 emissions derived from production of energy offsite), whilst not emitted from the refinery itself, are still important when considering the impact of the refinery operations.
The main emission sources in oil refinery are:• Fuelforprocessheating,steamraising
and incinerators• Hydrogenproduction• Cokeburn-offfromtheFCC• Flaring• Powergenerationifitispartofthe
refinery
1 . 3 C O 2 M I T I G A T I O N
The climate carbon wedge concept was introduced by two Princeton professors, Rob Socolow and Stephen Pacala. [5] These wedges describe a portfolio of energy technologies and choices about how we live, that when taken together form wedges against increasing carbon emissions.
The 50-year emissions reductions are idealized as a perfect triangle in Fig. 3. Stabilization is represented by a “flat” trajectory of fossil fuel emissions at 7 GtC/year, and BAU is represented by a straight-line “ramp” trajectory rising to 14 GtC/year in 2054. A wedge
represents an activity that reduces emissions to the atmosphere that starts at zero today and increases linearly until it accounts for 1 GtC/year of reduced carbon emissions in 50 years.Areas recommended to achieve the reductions are:
• EnergyefficiencyandConservation• FuelShift• CO2 Capture and Storage• NuclearFission• ForestsandAgriculturalSoils
In addressing refinery CO2 management Capture and Storage can be one of the solutions belonging to the CO2 mitigation concept.
The purpose of this paper to show the possibilities, methods, reality of CO2 capture in MOL Group refineries.
2. Summary of CO2 capture
The purpose of CO2 capture is to produce a concentrated stream that can be readily transported to a CO2 storage site. It should be noted that storing the flue gas stack without primarily separating the CO2 would even be more expensive. Indeed, beside CO2 , the flue gas stack consists of water and nitrogen. The latter needs to be compressed before being stored which is a very expensive process requiring a lot of compressing. CO2 capture and storage is most applicable to large, centralized sources like power plants, refineries etc.
Capture of CO2 from industrial process streams has been used for about 80 years, although most the captured CO2 is vented to the atmosphere because there was not incentive or requirement to store it. Current
Figure 3. Possible emissions scenarios (Carbon tons equivalent of CO2 tons: ~ 3,7)
15
Challenges2008/3
examples of CO2 capture from process streams are purification of natural gas and production of hydrogen-containing synthesis gas for the manufacture of ammonia, alcohols and synthetic liquid fuels [6].
All elements of CCS technology (CO2 capture from anthropogenic sources, including transportation, storage and monitoring) exist today and have been commercially deployed in various industries, specifically oil and gas production such as Sleipner, Weyburn-Midale and In Salah. However, these technology elements have not been integrated into large-scale CCS projects such as coal-fired power plants and similar low-purity streams. Some technology risks may arise from that integration process; however, the most significant risks are commercial and policy related. At this time, CCS is not commercially viable, due to the high cost of CCS and the currently weak carbon price signals. Moreover, there is no legal/regulatory regime in place that would allow potential developers and investors to adequately assess and manage their risks and liabilities in respect of CO2 sequestration.The CO2 capture and sequestration processes are in development phase. The first step in the actual preparation work is to become acquainted with the current practice and to identify the results achieved in the leading industrialized countries. [7]
There are three basic systems for capturing CO2 from use of fossil fuels and/or biomass:
Post-combustion captureCapture of CO2 from flue gases produced by combustion of fossil fuels and biomass in air is referred to as post-combustion capture. Instead of being discharged directly to the atmosphere, flue gas is passed through equipment which separates most of the CO2 . The CO2 is fed to a storage reservoir and the remaining flue gas is discharged to the atmosphere. A chemical sorbent process would normally be used for CO2 separation. Other techniques are also being considered but these are not at such an advanced stage of development.
Oxy-fuel combustion captureIn oxy-fuel combustion, nearly pure oxygen is used for combustion instead of air, resulting in a flue gas which contains mainly CO2 and H2O. If fuel is burnt in pure oxygen, the flame
temperature is excessively high, but CO2 and/or H2O-rich flue gas can be recycled to the combustor to moderate this. Oxygen is usually produced by low temperature (cryogenic) air separation and novel techniques to supply oxygen to the fuel, such as membranes and chemical looping cycles are being developed.
Pre-combustion capturePre-combustion capture involves reacting a fuel with oxygen or air and/or steam to give mainly a ‘synthesis gas (syngas)’ or ‘fuel gas’ composed of carbon monoxide and hydrogen. The carbon monoxide is reacted with steam in a catalytic reactor called a shift converter, to give CO2 and more hydrogen. CO2 is then separated, usually by a physical or chemical absorption process, resulting in a hydrogen-rich fuel which can be used in many applications, such as boilers, furnaces, gas turbines, engines and fuel cells. This process is well known also in petroleum refineries, and its use in power generation is being seriously considered. These systems are considered to be strategically important but the power plant systems of reference today are 4 GW of both oil and coal-based, integrated gasification combined cycles (IGCC) which are around 0.1% of total installed capacity worldwide.
2 . 1 T y P E S O F C O 2 C A P T U R E T E C H N O L O G I E S
Post-combustion systemsCO2 capture systems use many of the known technologies for gas separation which are integrated into the basic systems for CO2 capture. A summary of these separation methods is given below.
2.1.1 Separation with sorbents/solventsThe separation is achieved by passing the CO2
-containing gas in intimate contact with a liquid absorbent or solid sorbent that is capable of capturing the CO2 . In the general scheme of, the sorbent loaded with the captured CO2 is transported to a different vessel, where it releases the CO2 (regeneration) after being heated, after a pressure decrease or after any other change in the conditions around the sorbent. After the regeneration step is the sorbent is sent back to capture more CO2 in a cyclic process. In some variants of this scheme the sorbent is a solid and does not circulate between vessels because the sorption and regeneration are achieved by cyclic changes (in pressure or temperature) in the vessel where the sorbent is contained. A make-up flow of
MOL Scientific Magazine
16
1MOL GROUP
2008/3Challenges
fresh sorbent is always required to compensate for the natural decay of activity and/or sorbent losses. The general scheme of Figure 4 governs many important CO2 capture systems, including leading commercial options like chemical absorption and physical absorption and adsorption. Other emerging processes based on new liquid sorbents, or new solid regenerable sorbents are being developed with the aim of overcoming the limitations of the existing systems.
In Figures 4b and 4c one of the separated gas streams (A and B) is a concentrated stream of CO2 , H2 or O2 and the other is a gas stream with all the remaining gases in the original gas (A+B).
2.1.2 Separation with membranesMembranes (Figure 4b) are specially manufactured materials that allow the selective permeation of a gas through them. The selectivity of the membrane to different gases is intimately related to the nature of the material, but the flow of gas through the membrane is usually driven by the pressure difference across the membrane. Therefore, high-pressure streams are usually preferred for membrane separation. There are many different types of membrane materials (polymeric, metallic, ceramic) that may find application in CO2 capture systems to preferentially separate H2 from a fuel gas stream, CO2 from a range of process streams or O2 from air with the
separated O2 subsequently aiding the production of a highly concentrated CO2 stream. Although membrane separation finds many current commercial applications in industry (CO2 separation from natural gas) they have not yet been applied for the large scale and demanding conditions in terms of reliability and low-cost required for CO2 capture systems. A large worldwide R&D effort is in progress aimed at the manufacture of more suitable membrane materials for CO2 capture in large-scale applications.
2.1.3 Distillation of a liquefied gas stream and refrigerated separationA gas can be made liquid by a series of compression, cooling and expansion steps. Once in liquid form, the components of the gas can be separated in a distillation column. In the case of air, this operation is currently carried out commercially on a large scale. Oxygen can be separated from air following the scheme of Figure 4.c and be used in a range of CO2 capture systems (oxy-fuel combustion and pre-combustion capture). As in the previous paragraphs, the key issue for these systems is the large flow of oxygen required. Refrigerated separation can also be used to separate CO2 from other gases. It can be used to separate impurities from relatively high purity CO2 streams, for example, from oxy-fuel combustion and for CO2 removal from natural gas or synthesis gas that has undergone a shift conversion of CO to CO2.
Figure 4. General schemes of the main separation processes relevant for CO2 capture. The gas removed in the separation may be CO2, H2 or O2.
17
Challenges2008/3
2 . 2 E X I S T I N G T E C H N O L O G I E S
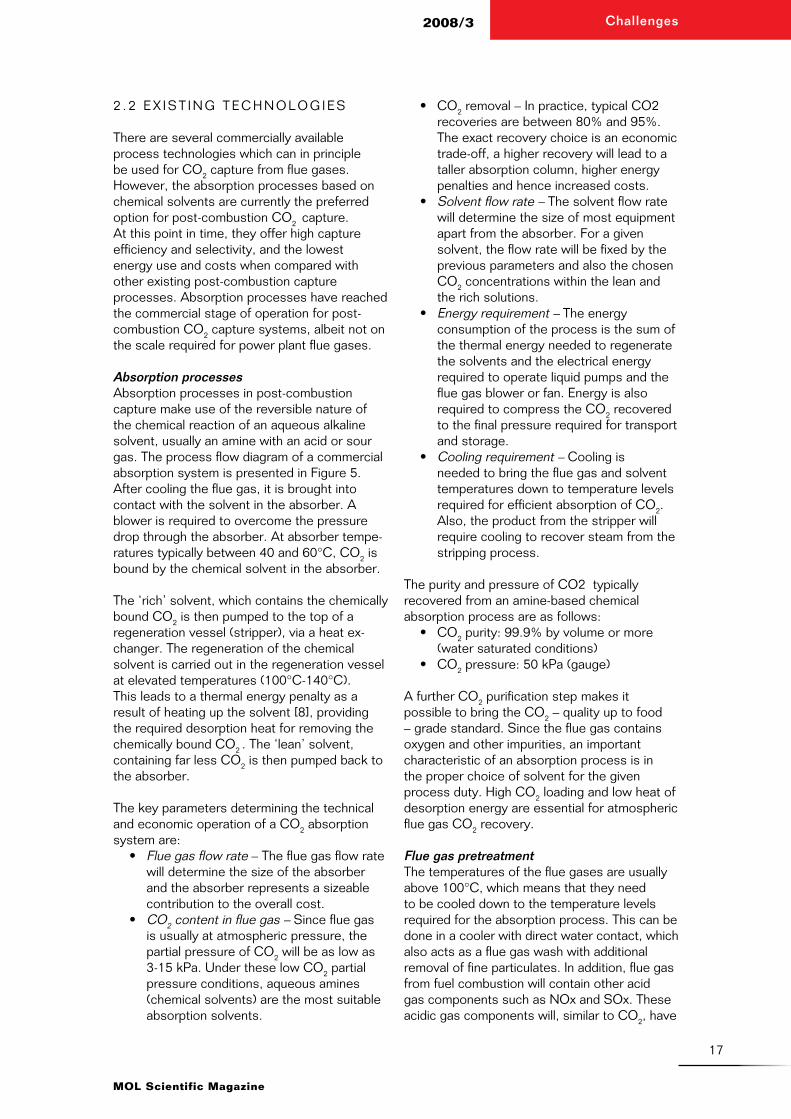
There are several commercially available process technologies which can in principle be used for CO2 capture from flue gases. However, the absorption processes based on chemical solvents are currently the preferred option for post-combustion CO2 capture. At this point in time, they offer high capture efficiency and selectivity, and the lowest energy use and costs when compared with other existing post-combustion capture processes. Absorption processes have reached the commercial stage of operation for post-combustion CO2 capture systems, albeit not on the scale required for power plant flue gases.
Absorption processes Absorption processes in post-combustion capture make use of the reversible nature of the chemical reaction of an aqueous alkaline solvent, usually an amine with an acid or sour gas. The process flow diagram of a commercial absorption system is presented in Figure 5. After cooling the flue gas, it is brought into contact with the solvent in the absorber. A blower is required to overcome the pressure drop through the absorber. At absorber tempe-ra tures typically between 40 and 60°C, CO2 is bound by the chemical solvent in the absorber.
The ‘rich’ solvent, which contains the chemically bound CO2 is then pumped to the top of a regeneration vessel (stripper), via a heat ex-changer. The regeneration of the chemical solvent is carried out in the regeneration vessel at elevated temperatures (100°C-140°C). This leads to a thermal energy penalty as a result of heating up the solvent [8], providing the required desorption heat for removing the chemically bound CO2 . The ‘lean’ solvent, containing far less CO2 is then pumped back to the absorber.
The key parameters determining the technical and economic operation of a CO2 absorption system are:
• Flue gas flow rate – The flue gas flow rate will determine the size of the absorber and the absorber represents a sizeable contribution to the overall cost.
• CO2 content in flue gas – Since flue gas is usually at atmospheric pressure, the partial pressure of CO2 will be as low as 3-15 kPa. Under these low CO2 partial pressure conditions, aqueous amines (chemical solvents) are the most suitable absorption solvents.
• CO2 removal – In practice, typical CO2 recoveries are between 80% and 95%. The exact recovery choice is an economic trade-off, a higher recovery will lead to a taller absorption column, higher energy penalties and hence increased costs.
• Solvent flow rate – The solvent flow rate will determine the size of most equipment apart from the absorber. For a given solvent, the flow rate will be fixed by the previous parameters and also the chosen CO2 concentrations within the lean and the rich solutions.
• Energy requirement – The energy consumption of the process is the sum of the thermal energy needed to regenerate the solvents and the electrical energy required to operate liquid pumps and the flue gas blower or fan. Energy is also required to compress the CO2 recovered to the final pressure required for transport and storage.
• Cooling requirement – Cooling is needed to bring the flue gas and solvent temperatures down to temperature levels required for efficient absorption of CO2. Also, the product from the stripper will require cooling to recover steam from the stripping process.
The purity and pressure of CO2 typically recovered from an amine-based chemical absorption process are as follows:
• CO2 purity: 99.9% by volume or more (water saturated conditions)
• CO2 pressure: 50 kPa (gauge)
A further CO2 purification step makes it possible to bring the CO2 – quality up to food – grade standard. Since the flue gas contains oxygen and other impurities, an important characteristic of an absorption process is in the proper choice of solvent for the given process duty. High CO2 loading and low heat of desorption energy are essential for atmospheric flue gas CO2 recovery.
Flue gas pretreatment The temperatures of the flue gases are usually above 100°C, which means that they need to be cooled down to the temperature levels required for the absorption process. This can be done in a cooler with direct water contact, which also acts as a flue gas wash with additional removal of fine particulates. In addition, flue gas from fuel combustion will contain other acid gas components such as NOx and SOx. These acidic gas components will, similar to CO2, have
MOL Scientific Magazine
18
1MOL GROUP
2008/3Challenges
a chemical interaction with the alkaline solvent. This is not desirable as the irreversible nature of this interaction leads to the formation of heat stable salts and hence a loss in absorption capacity of the solvent and the risk of formation of solids in the solution. It also results in an extra consumption of chemicals to regenerate the solvent and the production of a waste stream such as sodium sulphate or sodium nitrate. Therefore, the pre-removal of NOx and SOx to very low values before CO2 recovery becomes essential. The optimal SO2 content, before the CO2 absorption process is a cost trade-off between CO2 – solvent consumption and SO2 – removal costs. Careful attention must also be paid to fly ash and soot present in the flue gas, as they might plug the absorber if contaminants levels are too high.
2 . 3 E M E R G I N G T E C H N O L O G I E S
Other absorption processVarious novel approaches are being investi ga-ted, with the object of achieving a reduction of energy consumption and lowering the cost of the process. These new research directions include:
• Searchingfornewsolventstoachievereduction of energy consumption during of solvent regeneration.
increase the concentration levels of aqueous MEA solution used in absorption systems as this tends to reduce the size of equipment used in capture plants.
• Methodstopreventoxidativedegradationof MEA by de-oxygenation of the solvent solutions are also being investigated.
• Catalyticremovalofoxygeninfluegasesfrom coal firing has been suggested to enable operation with promising solvents sensitive to oxygen.
Adsorption processIn the adsorption process for flue gas CO2 recovery, molecular sieves or activated carbons are used in adsorbing CO2. Desorbing CO2 is then done by the pressure swing operation (PSA) or temperature swing operation (TSA) [9]. Less attention has been focused on CO2 removal via temperature swing adsorption, as this technique is less attractive compared to PSA due to the longer cycle times needed to heat up the bed of solid particles during sorbent regeneration. For bulk separations at large scales, it is also essential to limit the length of the unused bed and therefore optimize for faster cycle times.
It can be concluded that based on mathematical models and data from pilot-scale experimental installations, the design of a full-scale industrial adsorption process might be feasible. A serious drawback of all adsorptive methods is the necessity to treat the gaseous feed before CO2 separation in an adsorber. Operation
Figure 5. Process flow diagram for CO2 recovery from flue gas by chemical absorption.
19
Challenges2008/3
at high temperature with other sorbents can circumvent this requirement. In many cases gases have to be also cooled and dried, which limits the attractiveness of PSA, TSA or ESA (electric swing adsorption) vis-à-vis capture by chemical absorption.
MembranesCurrently available membrane materials include porous inorganics, nonporous metals (e.g. palladium), polymers and zeolites [10]. Many membranes cannot achieve the high degrees of separation needed in a single pass, so multiple stages and/or recycle of one of the streams are necessary. This leads to increased complexity, energy consumption and costs. Suitable membranes could be used to separate CO2 at various locations in technological processes.
Membrane processes are used commercially for CO2 removal from natural gas at high pressure and at high CO2 concentration. In flue gases, the low CO2 partial pressure difference provides a low driving force for gas separation. The removal of carbon dioxide using nowadays commercially available polymeric gas separation membranes results in higher energy penalties compared to a standard chemical absorption process. Also, the maximum percentage of CO2 removed is lower.
The membrane option currently receiving the most attention is a hybrid membrane – absorbent (or solvent) system. Membrane/solvent systems employ membranes to provide a very high surface area to volume ratio for mass exchange between a gas stream and a solvent resulting in a very compact system. This results in a membrane contactor system in which the membrane forms a gas permeable barrier between a liquid and a gaseous phase. In the case of porous membranes, gaseous components diffuse through the pores and are absorbed by the liquid. The contact surface area between gas and liquid phase is maintained by the membrane and is independent of the gas and liquid flow rate.
Solid sorbentsThere are post-combustion systems being proposed that make use of regenerable solid sorbents to remove CO2 at relatively high temperatures. The use of high temperatures in the CO2 separation step has the potential to reduce efficiency penalties with respect to wet-absorption methods. In principle, they all follow the scheme shown in Figure 7, where
the combustion flue gas is put in contact with the sorbent in a suitable reactor to allow the gas-solid reaction of CO2 with the sorbent (usually the carbonation of a metal oxide). The solid can be easily separated from the gas stream and sent for regeneration in a different reactor. Instead of moving the solids, the reactor can also be switched between sorption and regeneration modes of operation in a batch wise, cyclic operation.
Solid sorbents being investigated for large-scale CO2 capture purposes are sodium and potassium oxides and also Li-based and CaO-based sorbents, usually supported on a solid substrate. The Li-based sorbents showed good performance in a wide range of temperatures below 700ºC, rapid regeneration at higher temperatures and durability in repeated capture-regeneration cycles. The use of CaO as a regenerable CO2 sorbent has been proposed in several processes dating back to the 19th century. The carbonation reaction of CaO to separate CO2 from hot gases (T > 600ºC) is very fast and the regeneration of the sorbent by calcining the CaCO3 into CaO and pure CO2 is favoured at T > 900ºC (at a partial pressure of CO2 of 0.1 MPa).
The basic separation principle using this carbonation-calcination cycle was successfully tested in a pilot plant (40 tons d-1) for the development of the Acceptor Coal Gasification Process using two interconnected fluidized beds. The use of the above cycle involved regeneration of the sorbent in a fluidized bed, firing part of the fuel with O2/CO2 mixtures. The effective capture of CO2 by CaO has been demonstrated already in a small pilot fluidized bed. One weak point in all these processes is that natural sorbents (limestones and dolomites) deactivate rapidly.
Oxy-fuel combustion capture systemsThe oxy-fuel combustion process eliminates nitrogen from the flue gas by combusting a hydrocarbon or carbonaceous fuel in either pure oxygen or a mixture of pure oxygen and a CO2- rich recycled flue gas (carbonaceous fuels include biomass). Combustion of a fuel with pure oxygen has a combustion temperature of about 3500°C which is far too high for typical power plant materials. The combustion temperature is controlled by the proportion of flue gas and gaseous or liquid-water recycled back to the combustion chamber.
MOL Scientific Magazine
20
1MOL GROUP
2008/3Challenges
The combustion products (or flue gas) consist mainly of carbon dioxide and water vapour together with excess oxygen required to ensure complete combustion of the fuel. It will also contain others components, originated in the fuel and any diluents in the oxygen stream supplied (SOx, NOx, HCl, Hg, N2, Ar). The net flue gas, after cooling to condense water vapour, contains from about 80-98% CO2 depending on the fuel used. The CO2 capture efficiency is very close to 100% in oxy-fuel combustion capture systems.
Current methods of oxygen production by air separation comprise cryogenic distillation, adsorption using multi-bed pressure swing units and polymeric membranes. For oxy-fuel conversions requiring less than 200 tO2 d-1, the adsorption system will be economic. For all the larger applications, which include power station boilers, cryogenic air separation is the economic solution.
As for pulverized coal, oil, natural gas and biomass combustion, fluidized beds could also be fired with O2 instead of air to supply heat for the steam cycle. The intense solid mixing in a fluidized bed combustion system can provide very good temperature control even in highly exothermic conditions, thereby minimizing the need for flue gas recycling.
Chemical looping combustionThe main idea of chemical looping combustion is to split combustion of a hydrocarbon or carbonaceous fuel into separate oxidation and reduction reactions by introducing a suitable metal oxide as an oxygen carrier to circulate between two reactors (Figure 6.). Separation of oxygen from air is accomplished by fixing the oxygen as a metal oxide [11]. No air separation plant is required. The reaction between fuel and oxygen is accomplished in a second reactor by the release of oxygen from the metal oxide in a reducing atmosphere caused by the presence of a hydrocarbon or carbonaceous fuel. The recycle rate of the solid material between the two reactors and the average solids residence time in each reactor, control the heat balance and the temperature levels in each reactor. The effect of having combustion in two reactors compared to conventional combustion in a single stage is that the CO2 is not diluted with nitrogen gas, but is almost pure after separation from water, without requiring any extra energy demand and costly external equipment for CO2 separation.
In order to move particles between the two reactors, the particles are fluidized. This method also ensures efficient heat and mass transfer between the gases and the particles. A critical issue is the long-term mechanical and chemical stability of the particles that have to undergo repeated cycles of oxidation and reduction, to minimize the make-up requirement. The temperature in the reactors may be in range of 800°C - 200°C. NOx formation at these typical operating temperatures will always be low.
Oxy-fuel combustion applied to furnaces, process heaters, boilers and power generation systems is feasible since no technical barriers for its implementation have been identified. As for Chemical Looping Combustion, it is currently still at an early stage of development.
3. Examples of existing CO2 capture technologies
CO2 capture and reinjection at the Slipner field In the Sleipner gas field in the North Sea, the natural gas contains 9% of CO2, which must be reduced to 2,5% before export. The extracted 1 million tonnes CO2 per year would, if released to the atmosphere, have increased Norway's CO2 emissions by nearly 3%. In order to help meet national emissions targets – and avoid high CO2 taxes – Statoil decided to adopt an aquifer storage strategy for Sleipner, starting in 1996.
The CO2 is absorbed in an amine contact tower at a pressure of 100 bars. The amine is then stripped for CO2 in another tower. The module for the CO2 extraction process weighs 8200 tonnes – the heaviest module ever lifted offshore –, measures 50x20x35 metres and costs over 350 million ECU. Capture of CO2 from the smoke stack of gas turbines is not done on Sleipner (it would require larger facilities not well suited for offshore installations and will cost far more than the CO2 capture from a pressurised natural gas). The CO2 extracted on Sleipner is injected into a deep
Figure 6. The chemical looping combustion principle in a gas turbine cycle.
21
Challenges2008/3
saline aquifer, called “Utsira Sand”, some 1000 metres below the sea through a separate injection well. This sand is not connected to the hydrocarbon reservoirs at 3500 metres.It is the first time that CO2 is injected into an aquifer for environmental reasons. The project will provide valuable information on the feasibility of this technology. To learn the maximum of this ongoing “pilot project”, Statoil, and its license partners Elf, Exxon and Norsk Hydro, has invited interested parties to run a 3 years monitoring and verification project.
C O 2 R E C O V E R y A N D S E q U E S T R A T I O N A T D A K O T A G A S I F I C A T I O N C O M P A N y
The Great Plains Synfuels Plant , located near Beulah, North Dakota, is a gasification plant that produces Synthetic Natural Gas (SNG) from coal. Today upwards of 150 million standard cubic feet per day of SNG are produced together with numerous by-products, including anhydrous ammonia, ammonium sulfate fertilizer, phenol, cresylic acid, krypton/xenon, naphtha and carbon dioxide (CO2). Since the conception of the plant, the idea was envisioned of adding CO2 for enhanced oil recovery (EOR) to the list of by-products. In 2000, this became a reality when the company began exporting up to 95 million standard cubic feet per day of high-pressure CO2. The CO2 is delivered through a 205-mile pipeline to Weyburn Oil Fields in Saskatchewan, Canada, where it is injected into depleting oil formations to increase production and lengthen the life of the field.
4. Current commercial practice
The Kerr-McGee/ABB Lummus Crest Process – This process recovers CO2 from coke and coal-fired boilers, delivering CO2 for soda ash and liquid CO2 preparations. It uses a 15-20% by weight aqueous MEA (Mono-Ethanolamine) solution. The largest capacity experienced for this process is 800 tCO2 d-1utilizing two parallel trains.
The Fluor Daniel ® ECONAMINE™ Process - This process was acquired by Fluor Daniel Inc. from Dow Chemical Company in 1989. It is a MEA-based process (30% by weight aqueous solution) with an inhibitor to resist carbon steel corrosion and is specifically tailored for oxygen-containing gas streams. It has been used in many plants worldwide recovering up to 320
tCO2 d-1 in a single train for use in beverage and urea production.
The Kansai Electric Power Co., Mitsubishi Heavy Industries, Ltd., KEPCO/MHI Process - The process is based upon sterically-hindered amines and already three solvents (KS-1, KS-2 and KS-3) have been developed. KS-1 was commercialized in a urea production application. In this process, low amine losses and low solvent degradation have been noted without the use of inhibitors or additives. The first commercial plant at 200 tCO2 d-1 recovery from a flue gas stream has been operating in Malaysia since 1999 for urea production (equivalent to the emissions from a 10 MWt coal-fired power plant).
The Econamine FGSM technology has been implemented at 23 commercial plants worldwide. One of these plants is a 327 t/d CO2 recovery plant in the Florida Power and Light power plant in Bellingham, MA, USA. The Econamine FGSM plant was designed and constructed by Fluor, and has been in continuous operation since 1991. This facility is operating on gas turbine flue gas. This is notable for three reasons:
1. The CO2 concentration in the flue gas is low, being only 2.8 to 3.1 vol%.
2. The oxygen concentration in the flue gas is high, being approximately 13 vol%.
3. Neither a backpressure nor a pressure fluctuation in the flue gas line can be tolerated.
The quality of the carbon dioxide product is suitable for use in the food and beverage industry. Fluor is the technology vendor with experience with CO2 recovery from flue gas with a very high oxygen concentration. Large-scale carbon dioxide sequestration projects are currently being planned by Econamine FGSM. With absorber diameters of 40 to 50 feet considered feasible, CO2 recovery plant capacities of up to 8,000 t/d are achievable, depending on the inlet flue gas CO2 concentration. Even larger plants can be realized by employing multiple absorbers sharing a common stripper.
5. CO2 capture in refinery
The refineries have a large number of process heaters scattered around the site. This makes CO2 capture difficult, very expensive and impractical. However, about 60% of the CO2 is
MOL Scientific Magazine
22
1MOL GROUP
2008/3Challenges
emitted from 4-5 process units in the refinery – AVD distillation. FCC, Hydrogen manufacturing, and steam generation (Figure 7.). Some characteristics of flue gas at leaving point are shown in Table 1.
The pressure and temperature of the flue gases are not favorable for gathering and capturing the CO2 content.
The sources of CO2 identified in MOL Group refining activity are listed in Tables 2 and 3.
The source of the “chemical” CO2 is the steam reforming reaction in hydrogen manufacturing and following water shift reaction:
UNIT P [bar] T, [oC] CO2 V/V% FCC 0,991 260 7,07 AV-2 1,004 177 3,87 BEK-5 1,002 142 6,18 HGY-2 1,004 167 16,71 DCU 1,016 244 8,56Table 1. Pressure and Temperature data at stack leaving point.
Figure 7. CO2 emissions of process units (first 20 plants) in 2007, Danube refinery.
Site No. of point Heating and fuel burning, Process origin Capture Proposal sources compressors FCC H2
Coke burn “chemical” Refining Only CO2 • Danube “chemical” Refinery 54 927 231 282 • Slovnaft Refinery 50 1831 218 201 • TR+ZR 15 64 Availability @ Pressure barg 0,01-0,02 25-28 Temperature ºC 130-400 40 CO2 wt%% 6-14 65
Table 2. Sources of CO2 emissions identified in MOL group refineries per year 2007, (kt CO2/year).
23
Challenges2008/3
Table 3. Available “chemical CO2” for capturing will be after the implementation of Hydrogen plant 3 (y 2010).
Depending on the recovery efficiency and the utilization of H2 plants the quantity of CO2 captured can be about 13-15 % of the total CO2 emitted from refineries depending on the start up of new technologies.
Based upon the developed data we conclude that for refineries the single potential source is the capturing of CO2 from Hydrogen plant. We propose to continue the research in this direction in the next period.
6. Case study
The Hydrogen plant in Spain, Tarragona is integrated with a CO2 recovery (capture) system. Until now the Licensor Technip built 3 hydrogen plants coupled with CO2 recovery. Wilton, UK 20 KNm3/h Sapio, Italy 20 KNm3/h Repsol, Tarragona, Spain 60 KNm3/h
The CO2 recovery is aiming at the sales of by product CO2 for food industry (not sequestration). General flowsheet of the Hydrogen plant is shown in Figure 9.The BASF licensed CO2 recovery part of the plant consists of:
• CO2 recovery in MDA absorber on high pressure
• DesorptionoftheCO2 on low pressure• Compressionofthelowpressuregas• Drying• Bottlingthegasforfoodindustry
purposes
7. Legislation – driver for action
For the first three-year period of ETS legislation in 2005-2007 both refineries were under the allowed quota.This was due to the facts that:
• MOLGroupcarriedoutanenergyefficiency program prior to the introduction of mandatory quota. The main driver of the program was to improve energy efficiency (rationalization of heat utilization, changing steam tracing with electric cables, modernization of burners and furnace instrumentation) but it resulted lower CO2 emission too.
• RealandmonitoredCO2 emission was lower than the estimated quantity
• Authoritieshadnopracticeinsettingthequota levels; the allowance was higher than the real requirements in EU and also in Hungary.
MOL Group CO2 performance in 2nd phase 2008-2012
In the future period appear new problems making the emission balance more difficult:• TheNationalAllocationPlanII
intends to reduce the allowed quota in line with the increased CO2 reduction in EU.
• MOLGroupwillfaceapproximately 4 Mt CO2 quota deficits in the full period in case of the worst
Hydrogen Hydrogen Hydrogen Hydrogen Hydrogen Total plant 1 plant 2 plant 3 plant 1 plant 2 DR DR DR* SN SN CO2 Kt/year 77 103 155 50 77 462
Table 3. Available “chemical CO2” for capturing will be after the implementation of Hydrogen plant 3 (y 2010).
Figure 8. Accounted CO2 emissions 2007-2008
Figure 9. Cogeneration of CO2
MOL Scientific Magazine
24
1MOL GROUP
scenario, including the emissions of the planned new developments.
• Awardingquotafornewentrantsisgetting more difficult in the future
3rd phase 2013-20: The allocation scheme is not accepted yet on EU level. There are some preliminary expectations, that there will be no free allocation for energy sector, and decreasing allocation is planned to the player of oil industry till our industry would reach the zero allocation as well.
Later phases: The goal is to reduce CO2 emission by 50% by 2050 based on the 1990 level. The view is that there will be not free allocations at all, inspiring companies to spend more on developing carbon free or low carbon technologies.
MOL Group commitments in promoting sustainable development and the more stringent legislation are the motives to realize the CO2 capture in due time. Emission reduction achieved by capturing the CO2 from hydrogen plant process gas could mean 5% reduction on MOL Group level and above 10% reduction on refining level.
References
[1.] Climate Change 2001: Impacts, Adaptation & Vulnerability, IGCC, Contribution of Working Group II to the Third Assessment Report, 2001
[2.] Statistical Review of World Energy 2004, BP, Available from: http://www.bp.com/
[3.] Carbon dioxide and storage, IPCC, Special Report, 2005
[4.] Canada’s CO2 Capture & Storage Technology Roadmap CCSTRM 2006 May
Available from: http://www.CO2trm.go.ca
[5.] Stabilization Wedges: Solving the Climate Problem for the Next 50 years with Current Technologies S. Pacala* and R. Socolow*Science 13 August 2004 vol. 305. p. 398 401
[6.] Anderson, Soren; Newell, Richard: Prospects for carbon capture and storage technologies resources for the Future, Washington D.C., 2003
[7.] Thambimuthu, Kelly: Gas cleaning for advanced coal based power generation. IEA Coal Research, 1993, London, Report no. IEACR/53
[8.] White, C.; Strazisar, B.; Granite, E.; Hoffman, J.: Separation and capture of CO2 from large stationary sources and sequestration in geological formations – coal beds and deep saline aquifers, Journal of the Air & Waste Management Association, 53, 2003, 645-715.
[9.] McKee, Barbara: Solutions for 21st century, Zero emissions technologies for fossil fuels, Technology Status report. IEA Working Party on Fossil Fuels, May 2002
[10.] Davison, J.; Freund, P. ; Smith, A.: Putting Carbon Back Into the Ground, IEA Greenhouse Gas R&D Programme, 2001.
[11.] Raymond, Tan; Stanley, Santos: Chemical Looping Combustion For Fossil Fuel Utilisation with Carbon Sequestration, Velsen Noord, January 2006, IFRF Doc. No. G 23/y/2, Study report
Revised by: Géza Horváth PhD, Pannon University
2008/3Challenges
25
MOL Scientific Magazine
Focus2008/3
Abstract
The history of implementing commercial oil mining in Hungary is the story of long and thorny endeavours. The result for this small country of becoming an oil producer had been achieved by the steadfastness of purpose and the thorough grounding in the profession of its specialists. They succeeded in discovering the first major hydrocarbon field in 1937 after many failures in the country left without known raw material sources after the Trianon (Versailles) Treaty. The events starting in the following year, 1938 – when the first major Hungarian oil company, MAORT, was founded – have led to the foundation of the present national oil company, MOL Plc.The Hungarian-American Oil Co (MAORT) was founded on July 15, 1938 – with one hundred percent American share capital – for the exploitation of the petroleum and natural gas fields dis-covered by its predecessor, the European Gas and Electric Company, and the exploration of addi-tional production sites. MAORT had developed into one of the most important companies of the country due to its organization, outstanding performance and ever increasing capital stock and profits by 1941. It was the only significant oil producing company of Hungary till 1949 – its nationalisation. The role played in the national economy was emphasized by the major share of hy-drocarbons, primarily by crude oil, in
the Second World War as well as in the post-war restora-tion and damage compensation.This publication provides – in addition to the numerous references – an overview about the state actions brought against MAORT in the years 1947-48, the MAORT lawsuit and the conviction of the MAORT management on the basis of malicious prosecution. It also describes the path leading to the settlement in 1978 of the MAORT case saddling the Hungarian-American relations.
Összefoglalás
A magyar gazdaság, politika és a MAORTA magyarországi ipari méretû kôolajbányászat megteremtésének históriája hosszú és rögös út története. E kis ország számára az eredményt, hogy kôolajtermelô országgá vál-ha tott, szakembereinek kitartása, felkészültsége hozta meg. A Trianon után ismert nyersanyaglelôhelyek nélkül maradt országban számos kudarc után, 1937-ben sikerült felfedezni az elsô jelentôsebb szénhidrogénmezôt. A következô évtôl, 1938-tól – amikor az elsô jelentôs hazai olajtársaság, a MAORT létrejött – kezdôdött események vezettek a jelenlegi nemzeti olajvállalat, a MOL Rt. megalakulásához.A Magyar Amerikai Olajipari Részvénytársaság (MAORT) 1938. július 15-én alakult meg – száz szá-zalékban amerikai tôkével – a jogelôd European Gas and Electric Company által felfedezett dunántúli kôolaj- és földgázmezôk termeltetésére, továbbá újabb lelôhelyek felkutatására. A MAORT jól mûködô szervezetével, kiemelkedô teljesítményével,
Hungarian economy, policy and the Hungarian American Oil Co. (MAORT)
egyre növekvô alaptôkéjével és nyereségével 1941-re az ország egyik legjelentôsebb vállalatává fejlôdött. 1949-ig – államosításáig – Magyarország egyetlen jelentôs kôolajtermelô vállalata volt. Az ország gazdaságában betöltött szerepét a szénhidrogéneknek, elsôsorban a kôolajnak a második világháborúban, az újjáépítésben, és a háború utáni jóvátételben való nagymértékû részesedése emeli ki.A közlemény nagyszámú hivatkozás mellett áttekintést ad az államosítást megelôzô MAORT ellenes 1947-48. évi állami akciókról, a MAORT-perrôl és a MAORT vezetôinek hamis vádak alapján történt elitélésérôl. Ismerteti a magyar-amerikai kapcsolatokat megterhelô MAORT-ügy 1978. évi rendezéséhez vezetô utat.
Introduction
The exploitation of the results of the state-sponsored explorations and the initial concessions [1] were prevented by the events of the First World War and made absolutely impossible by the out-come of the war, tragic for Hungary. The Trianon Peace Treaty had not left any chance at all for rectifying the economic consequences of the war. The economic unity built up between the raw material sources located at the peripheral sections and the processing industries & consumers po-sitioned at the more central areas of the old country had been disintegrated and ceased to exist. Our industrial and transportation systems had been left without raw materials and energy carriers, while the petroleum demand of the country had been increasing continuously.
The issue in the situation arising after the First World War was not only that the oil and gas fields discovered until then remained outside our frontiers and Hungary became again a country importing petroleum – having an essential importance in respect of economic potentials and military strategy – but also the fact that no areas were known at all in the remaining portion of Hungary where promising evidences of petroleum occurrence were found.The petroleum demand of Hungary in 1920 amounted to 70,000 metric tons, representing in our energy balance only 2%, but the share of petroleum and oil products kept on ever
increasing. It was 3.72% in 1928 and already 4.62% in 1939 [2]. The increase in the number of motor vehi-cles played a decisive role in the rise of petroleum demand. The number of motor vehicles in service increased more than seven-fold from 1923 till 1937 [3].
The ratio of engines operated with diesel fuel at our power generation plants amounted to 3.24% in 1935. Agriculture required also a significant amount: 35% of our petroleum demand was con-sumed here by the end of the 1930’s. Usage for lighting purposes decreased at the same time, and the role of petroleum in the energy supply of our industrial plants strengthened only rather in the period of the Second World War in connection with the considerable alteration of the consumption areas [4].
Our petroleum and oil products import increased rapidly from the year 1920 70,000 metric tons: it amounted to 136,229 metric tons in 1929 and already to 238,276 metric tons in 1936. This represented significant burdens to our foreign trade balance, not being positive anyways: 13.7 million Pengoes (the Hungarian currency before the war) in 1933 – amounting to 4.39% of our total import in the given year – 13.4 million in 1934, 10.5 million in 1935, 15.3 million in 1936 and 22.3 million Pengoes in 1937 [5].
In spite of the importing difficulties, the import of petroleum and oil products decreased tempo-rarily only during the years of the economic crisis, but increased rapidly afterwards. In lack of domestic mineral oil production and because of the limited possibilities available for imports the capacity of our oil refineries remained unutilized, with frequent shutdowns. Only the exploration of domestic mineral oil sources could provide a solution for the problems – in spite of the promising results of the lignite hydrocracking process developed by professor Varga and implemented at Pétfürdô. The weakened status of the treasure after the First World War did not offer, however, opportunities for investing capital in the extremely expensive exploration activities to be conducted in the internal areas of the country. Although the continuation of explorations sponsored by the treasury was considered necessary, it was recognized that a solution could be provided primarily by assigning the exploration and mining rights to a foreign company dealing profes-sionally with mineral oil mining on the basis of Act No. VI/1911 [6].
27
Focus2008/3
Foundation of MAORT
The financial minister representing the Hungarian treasure and the EUROGASCO representative signed the concession treaty and contract for hydrocarbon exploration and mining, respectively, covering the entire Transdanubian area on June 8, 1933 [7]. The “Treaty” and “Contract” constituted a correct agreement between equal parties and took into consideration extensively the interests of the Hungarian state. In respect of economics it is sufficient to refer only to the fact that all the risks and costs of the expensive exploration were born by EUROGASCO and the Hungarian joint stock company to be formed, while the state received significant shares from the produc-tion (15% of oil yielded, 12% of natural and 15% of gas condensate) and, additionally, due atten-tion was paid to considerations aimed at the support of the Hungarian industry and the mitigation of unemployment.
EUROGASCO started the exploration activities deliberately, with scientifically founded methods and modern equipment. Its initial trial borings [8] did not yield satisfactory results, but the wells sunk in the neighbourhood of Budafapuszta in Zala County had created the opportunity for mineral oil production at commercial rate in Hungary [9].
Production from the Budafapuszta No. 2 well started on November 21, 1937. This is the date from which the beginning of oil production at commercial rate in Hungary and the oil industry becoming a factor having a determining nature in the national economy may be reckoned [10].
While EUROGASCO got as far as the exploration of the Budafapuszta structure with trial bore-holes, American capital had become predominant in the initially English-American stock interest. By the end of 1937 90% of the shares was in the hands of Standard Oil Company of New Jersey [11].
EUROGASCO founded a joint stock company registered in Hungary under the Terms of the Collateral Contract signed on June 24, 1938,
for the exploitation of the Budafapuszta oil field and the discovery of additional oil fields. The founders’ meeting of the Hungarian American Oil Company (MAORT) was held on July 15, 1938, and it was registered by the Budapest court of law in the list of Hungarian partnerships on July 18, 1938 [12].
MAORT till the end of the world war
The first period of the activity of MAORT (from it foundation till December 20, 1941) had shown an almost undisturbed development in relation to the circumstances amongst the uproars in the domestic and international life. Production ever increased during this period and the orga-nizational and process systems were largely established [13], and these went through only mi-nor modifications until the end of the Second World War. But even MAORT could not withdraw itself from the effects of the international and domestic political situation, particularly because of producing the raw material – oil – without which mechanized warring was not possible.
While the production from the Budafapuszta oil field continued without interruption, works were also ongoing for the discovery of further oil fields. The mineral oil field at Lovászi was discov-ered in 1940 and then those at Lendvaújfalu & Pusztaszentlászló in 1941 [14]. The drilling and production data in years 1941 thru 1944 had evolved as shown in the following table [15]:
Drilling data
Mineral oil production data (in metric tons)
MOL Scientific Magazine
Year Number of Number of Borehole boring equipment wells sunk dimensions 1941 5 53 66 175 1942 9 59 86 683 1943 11 60 87 589 1944 12 44 64 720
MAORT’s mineral oil production supplied already in 1940 the total internal demand of the coun-try and so much oil was produced already in 1940 which was sufficient for enabling the exporting one-third of the production in addition to meeting the requirements of the country inside its ex-tended borders. This proportion increased to nearly 50% in 1944 [16].
The event of year 1941 were determined even more by the war-time situation. Several factors gave incentive for increasing the production. Production at higher rate was required by the Ger-man demands for petroleum supplies in addition to the increase in domestic oil demands [17].
Hungary declared war upon the United States on December 13, 1941, thus MAORT, as a company in American possession, was operating in a hostile area from this date. The minister of industry ordered the MAORT to be taken into treasury management on December 20, 1941, based on the resolution brought by the council of ministers [18].
The war-time conditions and the subordination of the Hungarian economy to the German war economy had an extremely unfavorable effect on the until then almost undisturbed operation of MAORT.
The main efforts of the managers and specialist of the joint stock company from the time of its units being taken into treasury management were aimed at preserving the results achieved until then for the post-war times and protecting the oil fields from ruination. Their purpose was to exploit the oil resources of the fields to the fullest possible extent and not its fastest production.
The highest production rate – 837,710 metric tons – was achieved in 1943. This production out-put, however, was the result – contrary to some later opinions – of not ruthless exploitation but of the exploration and putting into productions additional mineral oil fields. The Budafapuszta oil field exceeded its peak production rate already in 1944 and its – and thereby MAORT’s production – started to drop in a natural way [19].
During the war period the role of MAORT in the Hungarian economy and industry became more and more significant – even beyond the strategic aspects. In addition to the fact that its activity had entered Hungary among the mineral oil
exporting countries by 1942, MAORT became the third largest mining company in Hungary during five years. In respect of the value of its produc-tion this amounted to 43.5% of the value of the total domestic coal production [20].
13 oil refineries existed in total in Hungary in 1943. The total share capital of the refineries hav-ing a great past did not amount to MAORT’s capital represented by stocks. MAORT’s profits amounted to more than five times that of the refineries’ profits already in 1941 [21].
Beyond the direct economic data of production and sales, the indirect effect exercised on the economy and society of the country by the operation of MAORT had also a great importance. The mitigation of unemployment, the development of the settlements in Zala County, the con-struction of infrastructure systems, the purchase orders placed at the domestic industry, etc. pro-vide unequivocal evidence of this [22].
MAORT immediately after the Second World War
The half decade following the Second World War brought about radical changes both in the Hungarian economy and in the operation of MAORT, the sole oil producing company in the country worth mentioning.
The orders of the Soviet army headquarters played a decisive role in the evolution of production from April 1945 till the signature of the peace treaty. The supply of the Soviet forces imposed a difficult task on MAORT. Their demands for fuel supply were formulated as military (sometimes expressively armed) duress [23]. The production capacity of the oil fields, the professional convictions of the experts and the arguments of natural science could not receive any role in such circumstances.
The war damage compensation and the Soviet-Hungarian economic treaty, neglecting the load-bearing capacity of the country and reflecting the duress imposed by a great power, signed on August 27, 1945 [24] – and then also the other trading agreements created subsequently after the model of this treaty – contained supply obligations which resulted in 77.8% of our total min-eral oil production being exported in the months of September through December, 1945 [25].
29
Focus2008/3
The spring of 1945 had meant for MAORT not solely that duress exerted by a foreign power was replaced by the also coercive expectation of another foreign power. It took scarcely half a year for a company built up before and during the war and operating excellently to be plunged into ex-treme peril, to the threshold of impossibility to perform. The investment projects fundamental for maintaining the production level, the replacement of worn-out assets and equipment could not be realized without the necessary financial funding [26]. Its financial problems became even more severe because – in spite of the oil price being kept arti-ficially at low level – it did not receive a single penny for its products. The Soviet army did not pay for the fuel taken from MAORT or for the mineral oil shipments delivered for military pur-poses, but even the oil refineries failed to pay the price of the mineral oil deliveries because they themselves were mostly also insolvent [27].
From August 1945 the coercive economic – and in connection with this the political – status into which the Hungarian state was plunged because of the war damage compensation stipulations and the economic & trading agreements neglecting the load-bearing capacity of the Hungarian economy was evident to an ever increasing extent in the unrealistic demands set for mineral oil production. The
officials in charge of mineral oil production of the Hungarian state also represented the Soviet interest under the mask of national interest [28].
The yield of the mineral oil fields exploited by MAORT was already decreasing during the period of entering into the said treaties and agreements. The natural drop in yields was considerably enhanced by the enforced unhealthy production rate [29].
The situation of crude oil supply for the country also evolved similarly to the desperate state of MAORT. Although the decreasing production output of MAORT still exceeded the internal de-mands of the country, the first signs of deficiency appeared already in 1946. Although the amount of oil products allocated to war damage compensation was reduced in 1946, this still exceeded 15% of the production output, and 33.8% was allocated to exports and 11% to the supply of the Red Army at the same time, while the share of the domestic market from the production was 39.7%. The Hungarian state was subjected to about 342,309 metric tons of delivery obligations from mineral oil – i.e. more than two-thirds of the total output – for war damage compensation and export purposes in the 1946/47 budgetary year [30]. According to the calculations made by MAORT experts in 1947, mineral oil production could be expected to decrease drastically in the following three years if over-exploitation were maintained and rational production rates could not be retained [31].
Variation of mineral oil production by fields (in metric tons):
Year 1946 Year 1947Budafa 205,120.442 163,730.397Lovászi 393,189.659 340,580.571Újfalu - -Hahót 76,229.443 65,036.566Total 674,539.544 569,347.534
Gas production (in m3):
Year 1946 Year 1947Budafa 127,635,610 104,590,350Lovászi 282,118,680 267,686,980Újfalu - -Hahót 2,463,224 1,793,750Total 412,217,514 374,071,080
MOL Scientific Magazine
30
1MOL GROUP
2008/3Focus
1948 Maximum production expectable in 406,000 metric tons
1949 Maximum production expectable in 250,000 metric tons
1950 Maximum production expectable in 150,000 metric tons
I.e. in total 806,000 metric tons
With a rational production rate the achievable output would have been 388,000 metric tons in 1948, 317,000 metric tons in 1949 and 250,000 metric tons in 1950, i.e. 955,000 metric tons in total, which would have exceeded the output achieved by non-rationalized exploitation by 149,000 metric tons.Not even 20% of reserves of the oil fields could be exploited till 1948, but 50% of gas was yielded from the Budafa field and 61% from the Lovászi field. The daily volume of gas dis-charged without utilization to the atmosphere was 550-600 thousand m3, equivalent to the calo-rific value of 120 rail tank cars of good quality lignite. The risk of becoming non-exploitable for ever threatened such a quantity of mineral oil as the consequence of over-exploitation which could have supplied the demands of the country for a decade. Considering all these factors together, the total loss of Hungary accrued from the above was estimated at nearly two billion (new) Hungarian Florins, although the company’s experts emphasized that this could be avoided with exploitation at rational rate and the renewal of the mechanical equipment [32].
Governmental actions against MAORT, the MAORT lawsuit and its socialization
Some officials of the state organs dealing with crude oil management had sought, however, the solution for the situation [33] not in the husbanding of natural resources but had seen it in forcing MAORT to enhance its production rate [34]. A whole army of state inspectors was sent to MAORT from the spring of 1947 in order to investigate whether it fulfills its obligations [35]. The delegated inspectors were looking, naturally, for deficiencies and endeavored to prove the fact of intentional reduction of production rates. They tried to create reasons to support the necessity of acting more forcefully against MAORT by distorting the facts in several cases. In spite of this, the inspection conducted in 1947 was closed officially with the result that they did not manage to find any evidence indicating
sabotage or intentional output reduction [36].
While the skirmishing in connection with the production output and the oil price was going on, damning evidences were collected in the background against the managers of MAORT under the direction of the State Security Department ÁVO. The direction and objection of their data collection was determined by the presumption that the reduction of the production output was the consequence of intentional sabotage committed for political reasons. They stated that MAORT was nothing else than “the agent of American imperialism in Hungary, its managers and engineers are the mercenaries of American imperialist interests” and that MAORT was making itself financially insolvent intentionally [37].
The ÁVO arrested Dr. Simon PAPP, retired general director, university professor and academician on August 12, 1948. The arrests were continued in the following days. They arrested Bódog ÁBEL, the retired manager of the purchasing department, mining engineer Béla BINDER, the manager of the production department, senior geologist Kálmán BARNABÁS, attorney István PÔZEL and Mrs. Lajosné DERÉK, the secretary of Paul RUEDEMANN. Paul RUEDEMANN and Georg BANNANTINE American citizens were arrested on September 18. The arrest of Gábor TEMESVÁRy, head of the legal department, and mining engineer Gyula ABZINGER failed because of their escape abroad, while the arrest of mining engineer Ernô POKKER, manager of the Budafapuszta Unit, failed because of his suicide. After the interrogations Mrs. Lajosné DERÉK was set free and István PÔZEL interned. The American citizens were put over the Austrian border on October 1, 1948, after interrogating and forcing them to sign their confession. They recanted publicly their confession made under duress at the American embassy in Vienna [38].
The national and local daily papers dealt with the arrest of MAORT’s managers and the charges brought against them on the front page, with bombastic phrases from September 1948. The charges were stated in detail for the first time in the so-called “Grey Book” – “Communiqué of the Hungarian Ministry of the Interior about the case of the MAORT sabotage” by its whole title – published in September 1948. This publication elicited the impression as if laying unquestion-able facts before the world by alloying real facts and improvable, deceptive statements.
31
Focus2008/3
Its editors started from the preconception that the production and other operating data may be adequate for proving the fact of sabotage by putting into these into a suitable sequence and interpreting same as necessary for the purpose [39].
The bill of indictment of the MAORT lawsuit repeated the contents of the “Grey Book” almost word-to-word [40] The bill of indictment was compiled from presumptions raised to the rank of facts, portions of inspection reports picked out from real relationships, so-called “confessions”, untrue data and findings supplied by invited “so-called” experts. A significant part of its argumentation consisted of political arguments and contentions, respectively.
The hearing of the MAORT lawsuit at the people’s court started on November 26, 1948 [41] . The sentences were announced on December 9. The sentences were severe: Simon PAPP was sen-tenced to death penalty, Bódog ÁBEL to 15 years penal servitude and Béla BINDER to 4 years imprisonment, while Kálmán BARNABÁS was acquitted. The case was tried at the second degree by the National Council of the People’s Courts on January 20, 1949. At this time they repeated the politically highly slanted charges, but amended the sentences: the death penalty of Simon PAPP was reduced to life imprisonment and the penalty of Bódog ÁBEL to 10 years penal servitude, re-voked the terms regarding the confiscation of property and other prejudicial effects in the case of Béla BINDER, and the court agreed to the acquittal of Kálmán BARNABÁS [42].
Based on the realistic consideration of the facts, neither the reduction in the volume of produced mineral oil, nor the unsuccessfulness of explorations, nor the failure to install the gas pipeline at Budapest should have formed any foundation for the charges brought against MAORT. Forceful intervention by the state was motivated by political reasons beyond economic factors [43].
It is obvious from the entire proceedings that the objective was not to punish the culprits, since they were innocent, but to justify in front of the whole world the legitimacy of taking MAORT under state control and that Hungary was unable to meet its export obligations imposed by war damage compensation requirements and international economic treaties due to sabotage. The lawsuit served
at the same time the purposes of political propaganda. Its organizers emphasized the harmful intentions of American imperialism, the presence of internal enemies and the necessity of vigilance.
A series of profound changes had started in September 1948 in the life of the company and Hungarian mineral oil mining. MAORT was taken under state control on September 24, 1948, on the pretext of sabotage.
Operating under state control was terminated as of December 31, 1949, and MAORT was nation-alized at the same time [44]. Its previously well-operating organization was disbanded and five national companies were created from it.
Thus, MAORT ceased to exist as of December 31, 1949, but it continued to exist in general consciousness. People working in the Transdanubian mineral oil mining units and the inhabitants of Zala County villages continued to refer to the units of the oil industry for years only as MAORT. EUROGASCO had brought into Hungary in 1933 modern technique & technology and advanced work organization methods, unknown here until then. MAORT, created by it, became one of the space-setters of Hungarian industry in slightly more than two years. Its existence boosted the economy of the entire country, but promoted much more in Zala County: created work opportuni-ties, good roads, bridges, heating by natural gas, etc. – infused life in a county placed into a peripheral position after the Trianon Treaty. The first expert staff on Hungarian mineral oil mining grew up under the wings of MAORT. The discoverers of the Nagylengyel field and then of the first major hydrocarbon fields in the Great plains, professors of universities, the teachers of experts living today and recognized internationally had emerged from among them [45].
According to the “inventory” taken in the course of the nationalization processes conducted dur-ing year 1949, meaning the end of the role played by foreign (said “western” at that time) capital for more than four decades, the balance statement value of foreign properties to be socialized was HUF 900 million, of which 542 million (i.e. more than half) was owned by American, 139 million by English, 90 million by Swiss and 47 million by Austrian citizens. American capital was represented to a dominant extent by the sole oil producer of the country, the Hungarian American Oil Co.
MOL Scientific Magazine
32
1MOL GROUP
2008/3Focus
(MAORT), the Standard Electrical Co. (with nearly 30% share in the industry) and the Vacuum Oil Co., having more than 25% share in the oil processing industry of Hungary [46].
The afterlife of the MAORT lawsuitThe case of the nationalization of companies in American ownership and of the frame-up law-suits preconcerted in this connection was not – and could not be – closed by the fifties. A multitude of newspaper articles and propaganda materials saw daylight, each emphasizing that the sabotage was the hostile act of the American United States against the Hungarian Peoples’ Republic. The so-called “White Book” – a document collection published in 1951 in Russian, English and French languages, edited by the Information Division of the Foreign Ministry – dealt even separately with the sabotage case. The Pannonia Press published in 1960 with propaganda purposes the book titled “Hungarian-American relations 1918-1960” in English language. The work dealing with Hungarian-American diplomatic relations included the MAORT case still with the original wording (the title of its respective chapter is: “Everything for Hitler, nothing for the Hungarian people”).
All these included both economic and political reasons. The old motive was recurrent in the post-1956 – also preconcerted – lawsuits: “the American enemy is still here and active,
sabotages the same way as at the end of the 1940’s”. (This may be illustrated by the questions raised and the charges raised in connection with American relations and previous employment by MAORT in one of the proceedings initiated in the oil industry in 1958, the litigation made known as the Majerszky lawsuit [47].)
All these are reflected also in the Hungarian-American diplomatic relations. As the result of the nationalization procedures and the diplomatic complications originating in these, the United States had frozen in February 1950 the East-European, among them Hungarian possessions registered there and then, in August 1951, suspended the commercial favors of East-European countries (abrogating simultaneously the most-favored-nation-clause) [48].
After a long period of frigid relations, attempts were made for resolving the bilateral relations only from the early 1960’s. The possibilities for normalizing the relations were reviewed though at the Foreign Ministry in the summer of 1956 as they discerned that a movement in favorable di-rection from the impasse had occurred with the reduction in international tensions. They estab-lished that the reinstatement of relations was encumbered by unsolved economic cases in addition to political issues. They considered that the settlement of debts will be an issue
33
Focus2008/3
given high priority to by the Americans in the course of negotiations. Although the issue of debts was not re-viewed seriously by anyone at this time, it could be established that the United States may have significant claims from Hungary, originating in the loans taken from the 1920’s, the war damages and the nationalization actions. The settlement of the debt amounting to hundred millions even when calculated in US dollars was not found advantageous at that time and the positions was taken that its settlement should be drawn out as long as possible. (The position taken even in 1959 was: “Let us not take the initiative” [49].)
The representatives of the United States and Hungary started material negotiations with regard to the settlement of issues pertaining to the rights of property from 1964. The positions hardly ap-proached each other during these negotiations till the early 1970’s, only the opposing demands and claims were clarified. The claim stated by the United States for war damage compensation and nationalization losses at the start of negotiations was USD 226 million, but this was reduced shortly to USD 58.2 million. The single largest item among the compensation demands related to nationalization losses was MAORT, representing a value of USD 28 million [50]. The United States announced in 1970 that it would reduce their total claim to USD 35.7 million but the Hungarian delegation declared even this sum to be unacceptable. The changes occurring in the international atmosphere and the east-west relations also played a role in that the negotia-tions of rights of property issues could move out from the impasse by 1972. The preliminary agreement allowing possibly its becoming effective after its approval by the respective governments could be achieved in the course of the negotiations held from October 2 to 12, 1972. Under its terms Hungary would pay a symbolic amount, USD 18.9 million, during 20 years in equal an-nual installment as the total and final settlement of all kinds of claims related to rights of property, nationalization and war damage compensation [51]. (The condition for the willingness to pay was, however, the renewed granting of the most-favored-nation-clause.)
The agreement intended to resolve the rights of property issue was signed on March 6, 1973, by Péter VÁLyI, the deputy chairman of the Council of Ministers, and William P. ROGERS [52].
The issue of war damage compensation was settled by December 1976: as announced by the US Treasure Department, Hungary had paid USD 4.3 million upon this ground [53]. Compensations for nationalized American properties – in lack of accessible sources – cannot be tracked this clearly [54]. There were serious differences in opinion with respect to which claim may be ac-cepted as legitimate. One of the most significant items covered precisely the claim of the owners of MAORT. Although, under the terms of the agreement signed in 1933, MAORT, could have enjoyed the rights of conducting hydrocarbon exploration and production activities in the concession area as well as the other licenses originating in this agreement for forty years from the year of its registration (1938), this status had been terminated three decades before the time of negotiations. The main subject of the disputes was the profits accruable from the hydrocarbon quantity producible during this period, but not realized [55]. It was not by chance, therefore, that the Hungarian state had to stick to the charges stated in the obviously preconcerted MAORT lawsuit, namely that MAORT had not fulfilled its obligations, committed sabotage and defaulted on the agreement in effect, because it was possible to justify only in this way that the established rights were restituted to the state legitimately. After numerous pitfalls and political procrastination, the Hungarian-American relations could become settled only by 1978 to a level where the Saint Crown,
MOL Scientific Magazine
34
1MOL GROUP
2008/3Focus
treated as deposit in the United States, could be returned to Hungary as a sign of friendship and the most-favored-nation status granted to it again – although only temporarily at this time. The United States made the decision to enable Hungary to enjoy this status permanently only in October 1989 [56].
Thus, the economic issues were settled – at least on paper – in the first half of the 1970’s and a slow progress started with regard to settling the relations between the two nations. The internal politics had not changed, however, the politicians insisted on that there were sabotage acts and the internal enemy acted – with external assistance – for the purpose of impeding the peaceful so-cialist country-building work till the last minute before the change of the social system. They did not admit that sabotage litigations in 1948-49 and the following years were preconcerted lawsuits and the related documents were treated as strictly confidential material – not placed even in public archives.
References
[1.] Four million crowns were spent on state-sponsored explorations from 1893 to 1910 and 17.5 million crowns from 1910 till mid-1918. A natural gas field was discovered in 1908 at Kissármás in the course of exploration for potas-sium salt. An oil field was discovered in 1914 at the neighborhood of Egbell in County Nyitra. The small oil field at Egbell contributed to a large extend to supplying the oil demand during the First World War: oil produced here till the fall of 1918 was sufficient for the base oil produced from it to supply the lubricating oil demand of the railways. The treasury extended its exploration activity also to Croatia in the year following the success achieved at Egbell. The first borehole was sunk in 1918 at the Bujavica dome near Lipik. The drilling discovered strata containing oil and gas. The government established an Exploration Mining Institute at Kaposvár for the assistance and direction of the detailed exploration of this area. Further explorations were prevented, however, by the events of war. Sources: Ferenc BÖHM: “Mineral oil and natural gas mining in Hungary till 1935”. Proceedings of Mining and Metallurgy, May 1, 1939.
(Volume LXXII, No. 9), pp. 157-159. Simon PAPP: “Mineral oil and natural gas exploration in Hungary from 1780 till 1945”, Part I. Proceedings of the Technical Sciences Department of the Hungarian Academy of Sciences, Volume 32, No. 1-4, pp. 454-455.
[2.] János KLÁR: The importance of Hungarian energy management in the national economy. Printing House of the Révay Institute of Literature PLC, Budapest. 1946. pp. 43.
[3.] Mineral Oil, 1938. pp. 11-12.[4.] János KLÁR: op. cit. pp. 40-42.[5.] Mineral Oil, 1937, No. 18-19, p. 121;
Hungarian Statistical Review, 1934, No. 3, p. 182; 1940, No. 2, p. 163.
[6.] Ferenc BÖHM: op. cit. pp. 156-157. “Act No. VI/1911 was the first in Europe (second in the world), which declared the mining of hydrocarbons a state monopoly”. See also: Géza SZUROVy: “Amendments of concession agreements and the new Hungarian Mining Law”, Part 2. Mineral Oil and Natural Gas, Vol. 27, No. 6., June, 1994, p. 186.
[7.] Agreement between Hungarian Royal Minister of Economy and the European Gas and Electric Company (London & New york). Archive of the Hungarian Museum of Oil Industry (hereinafter: HMoOI Arch.), HMoOI Arch. Gyulay Documents 61/6; Agreement between Hungarian Royal Minister of Economy and the European Gas and Electric Company (London & New york).
[8.] Exploration drilling operations were started at the edge of the plain in Northwestern Hungary near Mihályi village on November 21, 1934. Hydrocarbon reserves worth exploitation were found, however, neither here nor at the subsequent two drilling sites (at Görgeted & Inke).
[9.] The first (No. B-1) well at Budafapuszta was sunk at the drilling point marked out by dr. Simon Papp between July 13 and December 2, 1936, to 1764 meters depth. Although technical reasons prevented the borehole to be fully investigated, it could be developed for production. The well provided significant amount of natural gas and 2.5 rail tank cars of good quality mineral oil per week initially. Production started on February 9, 1937. This was the first producing oil well in Hungary remaining after the Trianon Treaty. The gas produced from it was utilized as fuel
35
Focus2008/3
for the steam boilers used for drilling wells No. 2 & 3. HMoOI Arch. Gyulay Documents 18/4 and dr. Simon PAPP: “Mineral oil and natural gas explorations of the Hungarian-American Oil Company in the Transdanubian region”. Proceedings of Mining & Metallurgy (hereinafter: Simon PAPP:PoM&M) 1939, No. 9, pp. 219-222.
[10.] Based on the promising results of the first drilling at Budafapuszta, sinking well No. 2 at Budafapuszta was started on April 14 and completed on September 29, 1937. At the start of production (on November 21) the output of the well was 10,300 m3 gas and 62-65 m3 good quality, naphtha-rich oil per day through a 10 mm diameter nozzle. Simon PAPP: “Mineral oil and natural gas explorations of the Hungarian American Oil Company in the Transdanu-bian region”. Proceedings of Mining & Metallurgy, 1939, No. 9, pp. 219-222.
[11.] Simon PAPP: History of Hungarian mineral oil and natural gas exploration during the past 60 years. Manuscript, 1965, p. 87. HMoOI Arch., Documents of Simon PAPP 1/1.
[12.] HMoOI Arch., Documents of Simon PAPP 37/2; Gyulay Documents 61/7, Hungarian National Archive (hereinaf-ter: HNA) Z 356, MAORT Secretariat 1, file 1.
[13.] The protocol drawn up at the time when MAORT was taken into treasury management (on December 20, 1941) recorded the following items as the subject of taking into use: Units: 1st – the Bázakerettye Unit including the entire geological structure at Budafapuszta as well as the gas condensate plant and the LPG filling station; 2nd – the Lovászi Unit, including the entire geological structure at Lovászi; 3rd – the Lendvaújfalu field; 4th – the Hahót No. 5 exploration well in the neighborhood of Pusztaszentlászló; 5th – the oil pipeline running along the Lovászi-Kerettye-Budapest routing, complete with loading stations at Újudvar, Kápolnásnyék & Soroksár and all accessories; 6th – the Mihályi No. 1 deep-sunk well with the dry-ice production facility operated there; 7th – the Inke No. 1 deep-sunk well; 8th – all the geological and geophysical explorations conducted in the concession area. Personnel: 266 permanent officials, 29 temporary officials, 1650 permanent workers and 716 temporary workers.
[14.] The sinking of the first exploration well through the Lovászi dome at the drilling point marked out by dr. Simon PAPP
was started on June 6, 1940. The well produced gas and oil after penetrating the sections between 1468-1452 meters and then between 1442 and 1452 meters. Its regular exploitation started on December 1, 1940. 22 additional wells were sunk at Lovászi during the following year and all could be made productive. The opinion was formed al-ready after the sinking of the first wells that the 20 km2 size field is suitable for further development and its yield may exceed that of the Budafapuszta field. In the course of further explorations, in 1940-41, two smaller oil fields were discovered: the first not far from the Lovászi one at Lendvaújfalu and the second in the Hahót Structure in the neighborhood of Pusztaszentlászló. The production conditions of the Lovászi field (compilation of János DINDA). HMoOI Arch. Gyulay Documents 56/3. More details about the history of the Lovászi field and unit in Lajos SRÁGLI: “50 years of the Lovászi field – 1940-1950”. Publications of the Hungarian Museum of Oil Industry 4, Zalaegerszeg, 1990, p. 50. Simon PAPP: Manuscript, p. 89; Tibor LAKLIA: “The third: The Pusztaszentlászló Unit of MAORT 1941-1951”. Publications of the Hungarian Museum of Oil Industry 30, Zalaegerszeg, 2006, p. 24.
[15.] Lajos SRÁGLI: The MAORT. Útmutató Kiadó (Publishing House), Budapest, 1998, pp. 56-57.
[16.] Zoltán GyULAy: “MAORT in the Hungarian economy today” (1942). Presentation given at the committee meeting of the Hungarian National Association of Mining and Metallurgy on December 12, 1942. HMoOI Arch. Gyulay Documents 53/4, furthermore: MAORT weekly reports 1941-1944.
[17.] T. Iván BEREND - Miklós SZUHAy: “The history of capitalist economy in Hungary”. Kossuth Könyvkiadó (Publishing House) - Közgazdasági és Jogi Kiadó (Economic & Legal Publisher), Budapest, 1973, p. 262.
[18.] HMoOI Arch. Documents of Simon PAPP 47/4. OL Z 356. 1.cs. 4., 1.cs. 3.; HMoOI Arch. Documents of Simon PAPP 47/4. The decision to take the unit of MAORT and Vacuum Oil Co. into treasury management was made at the cabinet meeting held on December 19, 1941. According to some opinions (Adámy-Németh: op. cit. p. 143) this was interconnected with the negotiations of Prime Minister Bárdossy conducted in
MOL Scientific Magazine
36
1MOL GROUP
2008/3Focus
Germany, i.e. it was made according to German expectations. The memoranda of Simon PAPP and other MAORT prove, however, that taking into treas-ury management was decided just for the opposite purpose: to prevent the assertion of the German intentions – the total submission of MAORT. This made it possible to avoid having it expropriated, confiscated as the property of the citizens of a hostile country.
[19.] HMoOI Arch. MAORT weekly reports, 1944.
[20.] HMoOI Arch. Gyulay Documents, 53/4.[21.] Ernô HAUER: “The position of MAORT
in the Hungarian oil industry and commerce”. HMoOI Arch. Gyulay Documents, 42/2.
[22.] Lajos SRÁGLI: “Through the pitfalls of politics. The history of MAORT from 1938 to 1949”. Hungarian Museum of Oil Industry, Zalaegerszeg, 2008, 43-73, pp. 105-139.
[23.] HMoOI Arch. Weekly reports, 1945. Documents of Simon PAPP, 47/6.
[24.] Péter SIPOS - István VIDA: “The Soviet-Hungarian economic treaty concluded on August 27, 1945, and the western diplomacy”. Külpolitika (Foreign Policy), 1985/4, pp. 102-123. The issue was raised that the Soviet-Hungarian treaty was ensuring a kind of exclusiveness for the Soviet Union. This was not so in principle, but in reality obliga-tions exceeding upper limits of the productive capacity of the Hungarian economy – as the items set forth in the treaty moved at this range – did not allow Hungary to enter into similar treaties with other countries.
[25.] OL Z 357. 3. cs.[26.] HMoOI Arch. Documents of Simon PAPP,
19/2, Gyulay Documents, 44/6.[27.] HMoOI Arch. Documents of Simon PAPP
38/10., 42/9. 42/2., HNA Z 356. 10.cs.[28.] OL XIX-F-1-oo 1.d.2.; HMoOI Arch.
Documents of Simon PAPP 49/13; Lajos SRÁGLI: “Through the pitfalls of politics. The history of MAORT from 1938 to 1949”. Hungarian Museum of Oil Industry, Zalaegerszeg, 2008, pp. 104-115.
[29.] Dr. Simon PAPP tried to call attention to the losses caused by over-exploitation in the October 1946 issue of the journal Magyar Technika (Hungarian Technics): “According to the calculations of MAORT the over-exploitation from April 1, 1945,
till July 31, 1946, amounted to 170,454 metric tons and entailed the following losses: 1. About 296,800,000 m3 gas was discharged to air without utilization. This is equvalent to 534,000 metric tons of Tata coal in heating value. 2. 17,963 metric tons of light naphtha and LPG was also discharged to air with this quantity. 3. About unproducible 401,000 metric tons of crude oil remained in the strata because the lifting gas energy was lost.”
[30.] HNA XIX-F-1-oo 1.d. 2., XIX-F-1-l 9. d.[31.] Lajos SRÁGLI: The MAORT 87.[32.] HMoOI Arch. Gyulay Documents, 45/3.,
46/4.; HNA XIX-F-1-l 11.d.[33.] Especially Zoltán GOMBOSI, the
Ministerial Commissioner of Minery Oil Management, who – in addition to his own private interests – had also the task to fill up the social demotratic party fund from the sums “skimmed off” from MAORT.
[34.] OL XIX-F-1-oo 3.d. 9.[35.] OL XIX-f-1-oo 2.d. 3., HNA Z 356. 10.cs.
83.[36.] OL XIX-F-1-l 9.d. 27.; HMoOI Arch.
Documents of Simon PAPP 49/4.[37.] OL XIX-F-1-oo 2.d.3.; HMoOI Arch.
[38.] HMoOI Arch. Gyulay Documents, 53/1; Documents of Simon PAPP 27/2; Simon PAPP: “My life”, 2nd edition, pp. 193-205. US ambassador Chapin protested immediately against the arrest of American citizens. The US State Deparment instructed the ambassador to negotiate with Mátyás RÁKOSI, the Premier of the Hungarian Communist Party and Prime Minister, and inform him that failing to set free the two American citizens would result in severe sanctions by the United States in economic and other areas. Sándor BALOGH: “The foreign policy of Hugary 1945-1950”. Kossuth Könyvkiadó (Publishing House), Budapest 1988, p. 305.
[39.] HMoOI Arch. Gyulay Documents, 53/1, 49/9.
[40.] The bill of indictment was completed by November. Its editors were captain György VÁRADI from ÁVH, the State Security Authorities, people’s prosecutor Márton BODONyI from the Budapest office of the people’s prosecurs and Pál SZÉKELy supplied the bulk of the data for its preparation. His assistors, the experts of the indicment were Géza SZUROVy and László FORGÁCS.
37
[41.] HNA Z 356. 10.cs.100.; The proceedings of the lawsuit are described in detail and authentically in: Simon PAPP: “My life". Second, extended edition. (Edited by: Lajos SRÁGLI & János TÓTH). Hungarian Museum of Oil Industry, Zalaegerszeg, 2000. pp. 226-228.
[44.] The socialization was contrary to the armistice agreement (ratified in Act No. V/1945) and the year 1947 peace-treaty, in which Hungary obligated itself that ”It will reinstate the status existing before the war with tegard to all the legitime rights and interests of the United Nation and its citizens and will return their properties in fully intact condi-tion.”
[45.] Detailed by: Lajos SRÁGLI: “Through the pitfalls of politics. The history of MAORT from 1938 to 1949”. Hungar-ian Museum of Oil Industry, Zalaegerszeg, 2008.
[46.] György RÁNKI: “The economy of Hungary in the first 3-years plan period (1947-1949). Közgazdasági és Jogi Kiadó (Economic & Legal Publisher), Budapest 1963, pp. 201-202. 86 foreign companies operated in Hungary be-fore the socialization process in year 1949, employing 22,000 workers in total.
[47.] Lajos SRÁGLI –János TÓTH: “The Majerszky lawsuit and its circumstances”. Zala Collection No. 34. (Zalaegerszeg, 1993), pp. 271-287.
[48.] László BORHI: “The United States and the Soviet zone 1945-1990”. MTA Történettudományi Intézet (Hungarian Academy of Sciences, Institute of Historical Science), Budapest 1994, pp. 30-33.
[49.] HNA XIX-J-1-j USA 5.d.[50.] HNA XIX-J-1-j USA 17.d.[51.] Ibid, In respect of the settlement of law of
property issues see also: Péter MIHÁLyI: “Old foreign debts and compen-sation in Eastern-Europe after 1945. Valóság (Reality), 1987, No. 4, as well as: Péter MIHÁLyI: “Was compensation paid by Hungary for the socialization of MAORT?”. Magyar Nemzet (newspaper Hungarian Nation), October 27, 1988; Lajos SRÁGLI: “The Americam capital and its fate in the Hungarian oil industry. Külügyi Szemle (Foreign Affairs Review), 2005/3-4, pp. 203-229.
[52.] HNA XIX-J-1-j USA 19.d.[53.] László BORHI: op. cit. p. 131.[54.] The sources deposited in the archive may
be researched up to year 1989 for the time being, but all materials related to this subject have not even been supplied to the archive.
[55.] The sum claimed under this title was only USD 17 million, but the Hungarian party did not deem it acceptable under Hungarian law. HNA XIX-J-1-j USA 19.d.
[56.] László BORHI: op. cit. p. 138.
Focus2008/3
MOL Scientific Magazine
38
1MOL GROUP
2008/3Focus
Abstract
Refinery Shuttle – an innovative and efficient logistics solution supporting the refinery operation optimized on group levelFor optimizing its downstream business, the oil industry uses a linear programming supporter tool worldwide, namely PIMS. MOL Group uses this tool on group level, involving the operation of both the Bratislava and the Százhalombatta refineries. This multimodal optimization can reveal synergies, which result in just more than the sum of the optimized parts. Utilizing those synergies often depends on the possibilities of the whole operation, including logistics solutions. PIMS raised the need of refinery transfers, but the sufficient logistics
solution was lacking. Group Logistics worked out an innovative theoretical solution, which was realized with the cooperation of two railway companies and a forwarding agent finally. The rail bridge connection between Bratislava and Százhalombatta, the so called refinery shuttle, which started its operation in April 2007, fulfilled all the expectations and provides a sufficient logistics support of integrated refinery operation. The refinery shuttle is a novelty, at the same time creating the best industry practice, thus MOL Group Logistics set the pace for the industry.
Összefoglalás
Refinery Shuttle – egy innovatív és hatékony logisztikai megoldás a csoportszinten optimalizált finomítói mûködés támogatásáraAz olajtársaságok világszerte alkalmazzák downstream üzletük optimalizálására a PIMS lineáris programozási eszközt. A MOL csoportszinten használja ezt az eszközt, bevonva a pozsonyi és százhalombattai finomítók mûködését. Ez a multimodális optimalizáció olyan szinergiákat tárhat fel, melynek eredménye több mint az optimalizált részek összessége. A szinergiák kihasználása gyakran függ a mûködés egészétôl, így a logisztikai lehetôségektôl is. A PIMS felvetette a finomítói transzferek szükségességét, de hiányzott a hatékony logisztikai megoldás. A Logisztika szervezet kidolgozott egy újszerû elméleti megoldást, melyet végül két vasúti társaság és egy szállítmányozó bevonásával valósított meg. A
István Lakat (53) Economist Refining and Marketing / LogisticsLogistics MOL senior manager,MOL Plc.,
Kornél Csernik (38)Chemical engineerRefining and Marketing / SCMJoint Supply and Distribution Planning ManagerMOL Plc.
Károly Horváth (49)Transport engineer, graduate in business administrationsales managerMÁV CARGO Plc.
Tibor Munkácsi (57)Economist – university degreekey account managerMávtranssped Ltd.
Tamás Deme (36)Engineer – university degreetransport specialistMávtranssped Ltd.
Refinery shuttleAn innovative and efficient logistics solution for supporting the refinery operation optimized on MOL group level
39
Focus2008/3
Pozsony és Százhalombatta közötti vasúti híd, a finomítói “shuttle”, mely 2007. áprilisában kezdte mûködését, teljesítette a vele szemben támasztott valamennyi elvárást, és hatékony támogatást nyújt az integrált finomítói mûködéshez. A finomítói “shuttle” egyidejûleg egy olyan újdonság, mely a legjobb ipari gyakorlatot teremtette meg, és mutatott utat a saját területén.
Looking for the common optimum of the elements of entire value chain. The role of optimization in a multi-site environment
In the article of “PIMS a Tool for Optimizing Dowstream” by Csaba Mészöly (MOL Szakmai Tudományos Közlemények – 2008/1), MOL Group Downstream business optimization planning process and its linear programming supporter tool: PIMS was introduced. The PIMS model of MOL Group is a multi period, multi plant abstraction; it can handle more refineries, markets in one integrated model for several time periods. This means that the optimum feedstock purchases, transfers between production units, refineries, processing details, distributed and marketed quantities are calculated in one single model. The optimum represents the highest cash generating solution with all other limiting conditions met. The optimal solution is proposed as a downstream plan for different time horizons (e.g. monthly, annual, etc).
Mergers or acquisitions (abbreviated M&A) are tools used by companies for the purpose of expanding their operations aiming at an increase of their long term profitability. Synergy between 2 companies is the simple equation of M&A where the whole is greater than the sum of the individuals. In case of SN and MOL downstream cooperation, PIMS is the tool which has revealed the synergies in the refineries’ harmonized operation and the value creating points: possible market synergies, transfers between refineries.
Planning refinery transfers
Refinery transfer means that semi-finished products produced at specific production units are transported to another refinery where it can be processed economically. This may be continuous under operating conditions when
the transfer is economical normally and ad hoc when the excess can be processed or stored in a co-refinery during turnarounds or unplanned S/D.
Transferring semi-finished products between the Bratislava Refinery (BR), and the Danube Refinery (DR) is a good example of a continuous, mutually advantageous conjunction. Let us think over a BR to DR and a DR to BR transfer!
RHC residue
The Residue Hydrocrack unit (abbreviated RHC) in BR, besides naphtha and middle distillates, produces 38% less attractive RHC residue in a quantity of 400-500 kt a year. This quantity has to be placed.
The demand of Heavy Fuel Oil (abbreviated HFO) blended from RHC residue is continuously decreasing, the prices are shrinking, the SO2 emission limit for power plant significantly decreases. These constrains have a strong influence on the possible use of RHC residue. In a stand alone optimum for BR (no transfers between refineries), the RHC residue would limit the operation of other units, or even crude oil processing.
On the other hand, the demands and prices in the bitumen market are quite attractive. In a stand alone optimum, the DR Delayed Coker unit (abbreviated DC) could have free capacity as the vacuum residue of the Atmospheric and Vacuum Distillation units (abbreviated AV units) are pushed to bitumen production. In a multi plant optimal solution the RHC residue
MOL Scientific Magazine
Figure 1. RHC residue placing possibilities from BR (only the referred units)
40
1MOL GROUP
2008/3Focus
can be processed by the Delayed Coker unit (abbreviated DC) and gas oil production can be increased on Group level.
Vacuum gas oil (VGO)
In DR the capacity of VGO Hydrotreater Unit (abbreviated HDS-MIC) is one of the bottlenecks, which means that utilizing the AV and DC units the produced VGO (yields: 23% in AV, 41% in DC) cannot be processed totally in HDS-MIC time-to time. In a stand alone optimum for DR VGO sales is the solution.
On the other hand, VGO Hydrotreater Unit (VGH) in BR time to time can have free capacity in a standalone optimum for BR. In a multi plant optimal solution VGO can be transferred to BR and gas oil production can be increased on Group level.
Based on the group level optimization, the RHC residue and VGO transfers between refineries have created value in 12 months out of the last 1,5 years. In the given price environment of HFO, bitumen, white products, evaluating the capacity utilization in the consumer units creates value, the transfers are more economical than any other solution.
The limits of logistics manageability of the transfers
The multi-refinery optimization model formulates goods movements similar to RHC residue and
VGO as a common optimum of the DR and BR that can become operational in practice only when Logistics can offer economically efficient support which is capable of handling large volumes in addition to other conditions. The goods transportation methods can be in principle the following: by river, pipeline or rail. River: the Százhalombatta port can load and discharge a relatively wide range of goods if the necessary development is realized. The Bratislava port can load only gas oil via a direct refinery pipeline connection, and there is no opportunity to discharge at all. Any development of the port would require an enormous CAPEX expenditure with a long payback.Pipeline: there is no direct pipeline connection between the two refineries, the investment would also require enormous financial sources, and pipeline transport would be deemed almost impossible because of the physical properties of some required products, the potential volumes and the alternating transport directions.Rail: Transportation by rail proved appropriate although it has remained an opportunity in principle only because of a number of factors (high charges, often unpredictably long delivery times, complete uncertainty of turn back times of empty wagons, and high specific wagon rental fee because of the above fact, etc.). Railway, operating with low reliability and high costs, did not offer a real alternative in practice. At the same time, Logistics set forth the thoughts, needs and expectations in the 2007 integrated rail forwarding tender (See below). In case these conditions are fulfilled, PIMS requirements could be realized.
Conflict of interests between the logistics requirements and the limits of the service providers: outlines for a solution
Supply Chain Management (SCM) has formed the potential options resulting from optimization, and Logistics had to convert it to a set of specific requirements for the external logistics provider market. This was indicated in the frame of the 2007 rail forwarding tendering process in the following ways:
• consignmentsshouldalwaysbedeliveredbetween the two refineries in block-train for an adequately fast transportation. The requirement was maximum 24 hours on a fix schedule, instead of the earlier 3-7 day long trip.
Figure 2. Semi-finished transfers possibility from DR (only the referred units)
41
Focus2008/3
• thesystemshouldbesufficientlyflexible.Subject to refinery needs, MOL should have the possibility to change the weekly number of trains, reduce or increase it with almost any limit and consequence.
• anygoodsshouldbeinsertedtoblock-train, in any repartition including the private railcars to be transported as goods by rail. This requirement has been in deviation from the earlier practice and charge setting rules of the railways.
• thefreightcostsneedtobe15-20%lower than the earlier ton based fee, and there should be a rate for a complete train without regard to goods classification, which is used by the railways normally.
The terms of the railway transportation are changing. The customers want to have a shorter delivery time, the parties fighting for better financial results. But to operate a block train system with products of different custom codes (NHM) is an unusual method. The custom code classification of the goods is used as a general rule ensuring for the railway companies the optimum income and the simplest organization of trains at the same time. Therefore, accepting this requirement should be considered as revolutionary step.
Through setting the above, some needs have been expressed which are in conflict with the earlier practice. But the solution -- considered as an unusual one -- has been supported by certain changes over the past years. These can be seen by the example of MÁV Cargo Zrt. indicating that the liberalization and privatization processes have been put in place or are still in progress in a number of European countries.
MÁV Zrt. and its cargo branch were operating in a relatively stable environment before 1990. Accession to the European Union, however, required a new organizational structure defined on a commercial basis and compatible with community legislation. The business, service and control functions were first separated in 2002.
Following the accession to the EU in 2004, rail liberalization was started through the opening of the transportation market, thereby opening access to the railway network for private railway companies (commonly known as Eisenbahn Verkehrsunternehmen [EVU]). Thus, MÁV Zrt had to offer a competitive alternative not only to other means of transportation, but also to new railway companies. To this end, it outsourced
its Cargo Branch in a separate company in 2006, and MÁV Cargo Zrt. (hereinafter: MC) has been active as an independent market player since then. The new company is the legal successor of the Cargo Branch of MÁV Zrt only in terms of labor law, but regarding all other aspects, it is a new, autonomous and independent legal entity as it could take on the goods transportation business in an efficient way and maintain its position on the international markets.
Hungarian Railways were given a derogation from applying the provisions of the European Community on access to railway network capacity until 31st December 2006. During the interim period, the Hungarian party provided access to the Hungarian part of Trans-European Transport Network only by 20% of the network capacity for the railway companies of the Community.
The effect of derogation ceased on 1st of January 2007, so the railway network can be used by all the companies as of 2007 that have a license of a rail company and operate a pool of assets for railway transportation. In order to create the competition neutrality of the commercial railway companies and regulated conditions, the Hungarian Rail Office was established in 2006, and its tasks were taken over by the National Transport Authority (Department of Railway Regulation) by the 1st of July 2008 according to Govt. Decree 156/2008 (VI.6.).
At present time 21 companies have a railway transportation license in Hungary. Private railway companies achieve a larger share in the railway transportation market every year, meanwhile MC kept its market leader position. In the year of terminating the derogation, private railway represented for only about 5% of the total turnover, which will increase by an additional 2-4% in 2008, according to analysts. In order to facilitate the use of open-access railway infrastructure, the countries of the European Economic Area (EEA) publishes the data of railway infrastructure, determines the conditions for access to the railway infrastructure, the services offered by the infrastructure providers and the charges for the access. The application of the provisions of the Network Regulations (hereinafter NR) is binding for the rail infrastructure providers, for the organizations authorized to use the network services, as well as for the railway capacity allocation department alike. MC can
MOL Scientific Magazine
42
1MOL GROUP
2008/3Focus
carry out transport by purchasing the services determined in the NR. This contains the costs of used (railway) lines, operating activities, train sorting, use of electricity, use of locomotive, etc. MC develops a technology for the specific transport for each and every case and optimize the costs on this way.
The decade-long conditions of railway transportation have fundamentally changed in Hungary, as well as in numerous European countries. Open access to the railway network and the appearance of private service providers (EVU’s) have increased the competition and promoted the implementation of new constructions such as the set of requirements put forward by MOL LOG.
The coordination between several collaborating railway companies – in the present case a Hungarian and a Slovak rail service provider – is not the core business of an international oil company. We have therefore communicated our needs to rail forwarding agents, of which Mávtranssped was the one capable of consistently enforcing them with the MC and the cargo branch of the Slovak Railway (ZSSK Cargo).
A new system is born. Operation of the “Refinery Shuttle” between the Danube and the Bratislava refineries.
For the traffic between DR and BR, a variety of tariffs were in use depending on the type and volume of the products before 2007. Daily deliveries of one type of goods often did not reach the quantity (netto cca. 1.000tons) required for a block-train; therefore, they were transported as individual consignments. Such deliveries entailed higher transportation tariffs and a longer turnaround time, which caused an additional problem in terms of the empty private wagons and because they did not arrive in time for the next loading, the planning was uncertain. From spring of 2007, in the organization of the forwarding agent Mávtranssped the complete traffic has been organized into roundtrip block-trains, under transportation conditions jointly agreed by MC and ZSSK Cargo. The mixed trains transport various products under different custom code (NHM) numbers and under strict schedule. The timetable of the BR and DR trains is organized so that the two trains coming from opposite directions have the very same arrival time at Komarno border crossing stopping just for a simple locomotive
change and they can continue their trip to the destination without any further time loss.Placing this kind of logistics arrangements into place between the refineries was quite pioneering as both cooperating railways have had to radically change their “good old” rigid system and praxis. The traditional “rail” mindset had to be abandoned. At the initiative of MOL Logistics and with the intercession of Mávtranssped a cost-based construction has been elaborated resulting in an unprecedented cost reduction.
Following the schedule of traffic between the two refineries into this system, previously decreasing rail traffic started to indicate a dynamic increase. The volume of turnover showed a slight (5%) decrease in 2006 compared to 2005 but increased by 51% in 2007. Based on the data of the first six months in 2008, additional turnover increase is forecasted.
Organizing all deliveries into this system entails benefits for MOL Group – beyond transportation cost reduction – because of the faster turn back of private railcars, as well as for Cargos due to cost savings by better organization possibilities. There are some examples in excuse of above:The turnaround time of wagons has decreased: in 2005-2006 the running time on the Százhalombatta – Komárom border crossing relation was 33 hours, while in reverse it was 48 hours on average, of which, according to statistics, an average stoppage of 23 hours arose at the Budapest-Ferencváros shunting yard. The same time in a mixed block-train diminished to 3 hours in export and 6 hours in import, while the stoppage time at the shunting yard Budapest-Ferencváros practically disappeared.
The total transportation time in a mixed block-train from DR to BR is 8 hours forth and 9 hours back. This way the transportation time decreased to one fourth in export and one fifth in import on MÁV network. Based on the above, the congestion at shunting yard Budapest-Ferencváros was also alleviated. As a result of this new system, the provider MC was able to reduce its own costs, too. The following NR charges have been saved due to block-train organization:
• 12.600,-HUF/trainforraillinecost(Transportation of single wagons with shunting and train reorganization at Budapest-Ferencváros station needs
43
Focus2008/3
two permits and train-number. According to the new system, just one permit and train-number is needed, based on a yearly timetable.)
• 2.260,-HUF/wagonshuntingchargesbecause of train reorganization
• Savingsoftractionandnetworkchargesbetween Budapest-Kelenföld and Budapest-Ferencváros stations:
- 6.600,- HUF/train on running charges, - 4.900,- HUF/train on traction charges,
and - 4.300,- HUF/train on “mixture”
transportation fee
Experiences, analysis, just in time, financial benefits on provider and client side
The Mávtranssped Kft., commissioned to organize the deliveries, was fully able to enforce MOL Logistics’ requirements, the service started in April 2007. Analyzing the experiences of the six block-trains in the first month and executing some modifications, there were already 14 block-trains a week in August. The border crossing Komárom – playing the role of a turntable – carried out the fastest locomotive change and transportation time. As a result, the trains dispatched at the loading point the previous night were arrived at the destination the following early morning. The sophisticated operation of the system brought
additional benefits, too. There is a live rail “bridge” between the two refineries, which can perform tasks that have not been envisaged and considered in the original concept but support the most optimal refinery operations. A practical example: if for any reason and all of a sudden, the storage capacity of liquid sulfur at DR should become insufficient, then some wagons from BR can be reallocated to DR in even less than 12 hours. Earlier such an action required up to 4-8 days, and as a consequence, the liquid sulfur had to be dumped into a temporary storage place, causing significant additional work and waste of energy. This type of connection can, of course, be used in the reverse direction and for any consideration.
The project has delivered the basic expec-ta tions: speed, flexibility, correct planning of rolling stock, complex usability, decreasing logistics costs. The cooperating partners (ZSSK Cargo, MÁV Cargo, Mávtranssped, SN, and MOL Logistics) evaluated the experience of the first 200 trains in Komárom in September 2007. The representatives of the railway companies declared they had no knowledge of the operation of a similar system either in the region or throughout Europe. It means that in this case not the best industry practice of others has been observed and implemented, but through this project we are setting the pace for the other market players. The tables below show the real need for this service and the efficient operation:
The proportion of the products compared to the total turnover in the refinery shuttle:
44
1MOL GROUP
2008/3Focus
List of abbreviations:
NHM: Nomenclature Harmonisée Marchandises – harmonized product specification number
NR: Network Ragulations of the limited liability company for rail capacity distribution enounced on its homepage
MC: MÁVCARGO joint stock company
Revised by: Gábor Kenessey Dr.
Number of trains between the two refineries in 2007
Number of trains between the two refineries in 2008
45
MOL Scientific Magazine
Focus2008/3
Abstract
To cope with strategic challenges, MOL Group managers need to become more effective at developing their managerial performance. They need to focus more on enhancing their own skills, building talent pools for the future, and supporting the development of their subordinates. To support managers, MOL Group introduced a new development process. The process builds on a leadership competency model that begins with a set of management expectations, in form of a scheme of behavioral competencies, which are different at each level of management. With the help of a consulting company, MOL Group created a system to measure the degree to which managers’ behavior reflects the required competencies. The system, called the 360-degree feedback tool, uses feedback from multiple sources, e.g. direct boss, secondary
bosses, peers, subordinates and other relevant members of the staff around the manager to be evaluated. These multiple sources bring more objectivity to the feedback and help managers to better identify development opportunities. In the first round, 350 top managers at MOL Group were required to complete the process. They were also required to participate on consultation with a coach and a training where they learned more about their results and received help to draft their own individual development plan for the forthcoming 2 years. Although program can not be fully evaluated after 9 months from launch, since program received positive participant feedback, therefore MOL Group decided to roll-out process for lower levels of management as well.
Összefoglalás
A jövô vezetôinek fejlesztése: Az új vezetôi kompetenciamodell és a 360-fokos értékelés szerepe a vezetésfejlesztésben a MOL-csoportnálAhhoz, hogy a MOL-csoport vezetôi a változó stratégiai kihívásoknak a jövôben is meg tudjanak felelni, vezetôi teljesítményük hatékonyabb fejlesztésére van szükség. Nagyobb hangsúlyt kell fektetniük arra, hogy vezetôi készségeiket tudatosítsák és fejlesszék, valamint gondoskodjanak
Building leadership for the future: The role of new MOL Group leadership competency model and the 360-degree feedback in leadership development
Zsolt Buláth (35)SociologistMOL Plc.Organizational development expertMOL Plc. / Human Resources / Strategic Human ResourcesEmail: [email protected]
Beáta Juhász (24)EconomistMOL Plc.Competency Development TraineeMOL Plc. / Human Resources / Competency DevelopmentEmail: [email protected]
46
1MOL GROUP
2008/3Focus
vezetôi utánpótlásukról és elôsegítsék beosztottaik karrierjét.Ennek érdekében egy új fejlesztési folyamat került bevezetésre. A folyamat alapja egy olyan vezetôi kompetenciamodell, amely a vezetôi sikerességhez elvárható készségeket és viselkedési megjelenésüket fogalmazza meg az egyes vezetôi szintek mentén. Külsô tanácsadó cég segítségével a MOL létrehozott egy mérési rendszert, mellyel a meglévô vezetôi kompetenciákat egy elvárt szinthez viszonyítja. Ez a 360 fokos visszajelzés, mely több típusú munkakapcsolatból (közvetlen felettes, kollégák, beosztottak és a vezetôvel együttmûködô, egyéb munkatársak) merít inputot. A több forrásból származó visszajelzések nagyobb objektivitást jelentenek, és elôsegítik, hogy a vezetôk minél reálisabb képet kaphassanak a fejlesztésre szoruló területeikrôl.Az elsô hullámban 350 top menedzser vett részt a folyamatban MOL-csoport szinten. A felmérés után tanácsadói konzultáció keretében ismerhették meg a folyamat célját, hátterét, és segítséget kaptak ahhoz, hogy 2 éves egyéni fejlesztési tervüket felvázolják.Bár a folyamatot nehéz 9 hónap távlatából teljeskörûen értékelni, mégis a résztvevôk pozitív visszajelzései alapján a MOL arra a döntésre jutott, hogy folytatja a rendszer kiterjesztését alacsonyabb vezetôi szinteken is.
Introduction
From last December until this year’s June more than 300 MOL Group managers were involved into a so called 360-degree feedback process. The participating managers and the selected raters of the participants, roughly 1400 persons, completed an online survey. Later participants received a detailed report about their feedback results and had a one-hour personal talk with a trained consultant on how to interpret these results. After that, participants attended a two-day long leadership training that built connection between their results and their leadership level, and gave ideas on how to turn own results into a personal development plan. These were the most ‘visible’ elements of the introduction of MOL Group’s new Leadership Competency Model. Our article examines the
background of this activity, specifically looking at the conceptual base, the survey tool, and the delivery, including tactics for creating sustainable process on long-term.
The MOL Group challenge
As a young and expanding multinational company, MOL Group is experiencing organizational challenges such as the need to build leadership bench strength and to attract, develop and retain talents. As a consequence, next to professional skills and experience in the industry, having the right leadership skills are more and more important expectations from every manager. Good leadership skills are crucial at all managerial levels to be able to manage expansion and growth, to strengthen partnerships and international teamwork, to manage change and diversification of workforce, and to lead the company successfully to international markets.
Besides, external talent pool is shrinking. It is more and more difficult to find future employees from outside, who have the right types of knowledge and skills, know the industry and key stakeholders demands. Thus effective internal talent development became another HR challenge.
Need for a Leadership Competency model
These challenges have led to an increasing HR focus on providing current and future leaders with effective development programs and performance management processes to ensure that they better capitalize on strengths and identify development opportunities. This need was calling for a development of a standardized leadership competency model which, following a theoretical leadership career path from being an individual contributor to becoming a CEO, identifies and differentiates the levels of leadership and defines the relevant competencies that can make one’s successful at given level of leadership. Investigating several international best practices, finally MOL Group HR professionals selected a model developed by Personnel Decisions International (PDI), a US-based international human resources consulting firm, which provides a broad range of services and tools designed for talent and leadership development. After the internal validation of the model, consisting of series of
47
Focus2008/3
top management interviews and focus groups discussions on the model, it was introduced to MOL Group with minor adjustments only to reflect local conditions.
Introduction to the model
The model is based on the Leadership Pipeline theory [Drotter, 2006], which differentiates between the leadership levels based not on the formal hierarchy of an organization but rather on the essence of the role that somebody at the given leadership level must fulfill to contribute efficiently to organizational success.
MOL Group Leadership Competency Model defines the desired behaviors and capabilities of ideal leaders at five different stage of an ideal leadership career [1] (Figure 1.).
As the above figure shows, there are 4 turns in the pipeline that represent the major passages in a life of a leader with a theoretical career from the first level to the top. According to the Pipeline theory, as key challenges are different at each level, so as responsibilities, time applications, work values and required skills and capabilities are also different at each level.
As can be seen in the figure, the passage to the top is not linear but rather one that is bent in every level. This means that development within a level is also a development option, but the content is different from the development to be ready to change profile.
Managing transitions
To understand the value of the model, first we need to review each passage shortly. young employees at the start of their career typically enter an organization as individual contributors. Whatever they do, their skill requirements are primarily technical or
professional. They must contribute by doing the assigned work themselves within the given time frames and in ways to meet objectives. By developing their individual skills, they make increased contributions.
First passage: frontline leaders’ key challenge is to learn how to manage others. The skills newly promoted people should acquire include planning work, filling jobs, assigning work, motivating, coaching, and measuring the work of others. First-time managers usually strive to find out how to reallocate their time so that they not only complete their assigned work but also help others perform their tasks effectively. They must become skilled at how to shift from "doing" work to getting work done through others otherwise they might fail if they spend all their time on putting out fires, missing opportunities, and handling tasks themselves. Second passage: perhaps the biggest difference is that mid level managers’ job must be pure management. They must learn to manage other managers and, this way, areas that are outside of their own professional experiences. Developing subordinate managers is also essential at this level because frontline managers frequently don't receive formal training in how to be a manager, and therefore they are dependant on their bosses to coach them about the job.
Third passage: at Business Unit Leader level, probably the biggest shift is to focus on planning and managing business at strategic level. Newly appointed leaders at this stage must learn to look at plans and proposals not just from a technical point of view but also from a profit perspective and a longer-term view. To sustain business they need to learn balancing between future goals and present needs and make trade-offs between the two. To run own business efficiently, leaders must also learn to integrate areas below them and to work closely with a wider variety of people from other
MOL Scientific Magazine
48
1MOL GROUP
2008/3Focus
functions; they need to become more sensitive to the diversity of issues and communicate clearly and effectively.
Fourth passage: to run a business successfully requires different set of skills than to do the same with two or more businesses. Leadership becomes more holistic at this level. Managers at this level must become proficient in evaluating strategy for capital allocation, deployment purposes and portfolio strategy about assessing whether they have the right core capabilities to win.
Above levels and passages expressed more clearly by the competency profiles that list desired competencies on each of the five levels. The competencies are categorized around 4 meta-competencies:1. Personal Leadership: how to manage
yourself; key competencies are ‘adaptability’ and ‘establishing trust’’.
2. People Leadership: how to manage others; competencies include: ‘open communication’, ‘collaboration’, ‘talent enhancement’, etc.
3. Result Leadership: how to manage work and processes; competencies include ‘planning’, managing execution’, ‘focus on customers’, etc.
4. Thought Leadership: how to make quality decisions; competencies include ‘analysis’, financial acumen’, ‘strategic thinking’, etc.
Meta-competencies are the same at all five levels but competencies and related behavioral descriptions (i.e. expected behaviors) change. Not every competency shows up at each level and their content also varies.
The theory’s key message is that a significant development has to be made at each passage as someone wants to step to the next level of leadership; skills that made someone successful at one level might hinder their effectiveness as leaders on another level. The four meta-competencies are stable, meaning that the ‘hard’ and ‘soft’ side of a leadership role (i.e. ‘hard’ management skills in Thought and Results leadership vs. ‘soft’ ones in Personal and People leadership skills) must be in balance at all levels. The model also suggests that one barrier to organizational effectiveness is that managers can not make the transitions well and they still manage one or more levels below their actual level (i.e. mid-level leader focusing too much on technical/professional issues instead of leaving
this to his people). Therefore, to improve overall effectiveness, organizations need to measure if people in given leadership positions have the right competencies required at the given level and help managers to develop in their own level or to make the transition.
Assessing the leadership competencies: the 360-degree feedback
Competency assessments can determine leadership gaps, detect organization-wide problems, and measure the alignment of leaders with key organizational priorities. The results can provide indirect input to career management highlighting those employees with key attributes necessary to fulfill future leadership roles and direct input to individual development planning based on the identified personal weaknesses in competencies.
A simple one-to-one review of competencies between subordinate and supervisor could be used as a competency measurement tool. But multiple feedback sources provide different information. People change and adjust their behavior to particular situations. As such, all respondents in the feedback process may provide different feedback that is equally valid due to their unique experiences with the individual. Subordinates, peers, supervisors, dotted-line supervisors and customers all tend to base their feedback on different experiences. Therefore the key advantage of a 360-degree feedback tools is to elicit multiple point of views from a wider range of sources.
Using a 360-degree feedback also provides a structure for organizations to measure competencies throughout the organization based on the same platform. The unified approach brings employees to the same standard and allows them to focus on developing only essential skills.
Common problems with the 360-degree feedback
To achieve valid and constructive results with a 360-degree feedback, certain conditions, sum-marized in the following points, have to be met.
• Goaloftheassessment.Thoughsome organizations use a 360-degree feedback for performance measurement and selection, past experience shows
49
Focus2008/3
that this tool should be used only for development purposes, clearly separated from performance appraisal. Any link to performance appraisal might undermine the validity of feedback to a significant extent. (This extent, in fact, depends on company culture.) The strict separation permits that 360-degree feedback talks can focus on competencies and development needs while the appraisal talks can address individual performance and business results.
• Adequatebasefortheassessment.MOL Group’s assessment tool is based on the new leadership competency model. The model ensures that different competency requirements are measured at different levels and only competencies that really make a difference in leadership performance are reviewed at each level (according to the result of extensive researches made by PDI)
• Selectingtheraters.Numberofratersshould be above a minimum number to ensure quality feedback (at MOL, 8-20 raters are suggested). According to MOL protocol, participants select their raters and submit their list of raters to primary boss for their approval. This approach, i.e. participants to propose then cross-check list with direct boss, can ensure that only relevant persons are asked to give feedback and they have no negative or positive bias to participant.
• Privacyofresults.Resultsaremadeavailable only to the participant and his/her primary boss, who is responsible for development (planning, budgeting, implementation) of the participant. Results are not available to HR that only facilitates, supports and monitors development process. Group reports to senior management contain only anonymous, aggregated results.
Implementing the 360-degree feedback process at MOL Group
The competency model was introduced by the first round of the 360-degree feedback process in autumn, 2007. The project, named CoMet, included contributors from all parts of Human Resources, and PDI as, external consultant. After designing and validating the solution, the project team started a pilot with DS senior management team and the whole of HR management, in total 23 persons. The pilot
received a supportive feedback, so the real phase could start with 330 managers.
The ultimate goal of the 360-degree feedback is to provide specific and objective foundation to individual development planning. At the end of the measurement process all participants must have an own individual development plan approved by their boss. A sophisticated training catalogue is under development, which will provide the opportunity for managers to choose a tailor-made training for each competency gap. The second round of the assessment is due in October-November 2008 with remaining part of the management, another 300 persons, at lower levels.
Success factors for the 360-degree feedbackThe project was evaluated through different sources. We collected feedback from participants and HR partners who supported the process. Participants feedback suggest that the 360° feedback tool worked for them and individual reports can ensure solid and reliable input to plan own development. Especially the written comments section at the end of the survey seemed to be very a useful tool for giving direct feedback for respondents and had a big impact in the individual reports. Overall results (aggregated group reports) also proved to be a very useful source of information and provided us good insight to actual MOL Group leadership style and can be used in designing future development efforts. To sum up, we can say that tool is ready for future use with minor adjustments only.
The competency model and the Pipeline theory behind the tool, as also participant feedback from training sessions showed, have a heuristic value and aligned to MOL Group way of working and its strategic priorities, although small changes might be appropriate. As we see, the model is a proposed framework, a ‘language’ that helps to initiate a meaningful discussion about leadership (‘what is leadership’, ‘what makes a good leader’, what should be in the focus of a leader?’, etc.). This discussion and experiences with the model can even lead to the modification of the model and that is all right – what is important is to form a shared philosophy of leadership and a good approach to leadership development through a joint and, probably, time-consuming dialogue. The journey has just started.
Revised by: Edina Echter
MOL Scientific Magazine
50
2008/3Szakmai Tudományos Közlemények
Abstract
In January 2006, a serious havaria situation emerged in the gas transmission of Central Europe due to the dispute between Ukraine and Russia leading to a shutdown of gas supplies. Therefore the Hungarian Parliament passed a bill on strategic gas storage, after which the Hungarian government called for a tender in
the implementation of strategic underground gas storage. The tender winner MOL Plc. has planned and developed a 1.2 Bn m3 working gas capacity underground gas storage which has 20 Mm3 daily peak capacity even for as long as 45 days. The planned UGS is situated in the SE part of Hungary, in the Algyô field, which is the largest hydrocarbon accumulation in the Pannonian Basin. The initial GOC refers to 1756 mss depth. The reservoir can be found in the uppermost sandstone series showing good reservoir quality. The well sortiered, middle and coarse grain sandstone contains saturated light oil (0.32 cP, 45 API) reservoir with significant gas cap. Initial resolved gas ratio is 121m3/m3 at 182.5 bar reservoir pressure. The initial C3 and C4 content of the gas cap is 4.3 mol% while the C5+ content is also above 3.5 mol%. During the 41 year-long exploitation history, water injection at GOC technology had been used for improvement of the oil recovery factor following primary depletion mechanism. As a result of the IOR technology, 41.7% recovery factor was reached by December of 2006. The reservoir management had dual aims. One of the aims was to establish an underground gas storage matching the tender conditions and meeting strategic requirements. The second aim was to introduce an EGR process by recycling dry working gas leading to an increase in the recovery of mid hydrocarbon components from the gas cap and the accelerated production
Gyula Nagy (52)Project managerCorporate ServicesE-mail: [email protected]
Lajos Benedek (36).Reservior engineering and modelling managerE&P, Geology and REservoir ManagementE-mail: [email protected]
Veronika Pipicz (57)Reservoir engineer expert
István Papp (56)Reservoir engineer expertE&P, Geology and REservoir ManagementE-mail: [email protected]
Mária Ósvay Hnisz (55)Reservoir geologist expertE-mail: [email protected]
Ilona Tóth Varga (47).Petrophisical expertE&P, Geology and REservoir Management
Janos Geiger, Dr. (54)University of SzegedAssociate Professor
Gas supply security or enhanced gas recovery? With adequate reservoir management – No need to choose!
1MOL GROUP
2008/3Development
51
Development2008/3
of condensate. A 3D, compositional simulation model was developed to evaluate the potential of the gas cycling. During the up-scaling of the static geological model, certain flowing units and rock bodies were identified in identical and interconnecting depositional environment. Comparing the production forecast cases due to the introduction of EGR gas injection it allowed for an additional 39.6 km3 condensate increase and 46.2 km3 advanced condensate production until 2010. It is planned to drill an additional 44 wells and to complete them with 5” diameter of tubing size, which number includes 10 horizontal wells. In order to avoid sand control problems the wells will be gravel packed. The development of UGS is very ambitious since the strategic volume has to be available by January 2010. This case study summarizes the planning and the preparation of the gas cycling and the UGS development project and the potential for handling existing risks, as well as it highlights what additional benefits can be reached by the application of the reservoir management improving efficiency of the UGS dramatically.
Összefoglalás
Ellátásbiztonság vagy növelt hatékonyságú gáztermelés (EGR)? Megfelelô tároló menedzsment mellett nem kell választani!2006 januárjában az Oroszország és Ukrajna közötti gázvita miatti tranzit gázszállítás kimaradása komoly havária helyzetet teremtett Közép Európa ellátásában, ezért a magyar parlament elfogadta a stratégiai gáztárolásról szóló törvényt, amelyet követôen a magyar kormány egy stratégiai gáztároló megvalósítására írt ki tendert. A tender nyertes MOL Nyrt. megkezdte egy névlegesen 1.2 Mrd m3 mobil kapacitású biztonsági tároló tervezését és fejlesztését, melynek napi csúcskapacitása 20 Mm3/nap akár 45 napon keresztül. A földalatti gáztároló a Magyarország dél-keleti részén található Algyô mezôben fekszik, amely a pannon medence legnagyobb szénhidrogén felhalmozódása. A ten-
ger szint alatt 1756 méteres mély ség-ben (kezdeti gáz-olaj határ) elhe lyez-kedô tároló a homokkô sorozat legfelsô részében helyezkedik el és kedvezô tároló-tulajdonságokkal rendelkezik. A jól osztályozott, közepes és durva szemcséjû homokkô sorozatban egy könnyû olajat tartalmazó (0.32 cP, 45 API) telített olajtelep fekszik, jelentôs kezdeti gázsapka vagyonnal. A kezdeti gáz-olaj viszony 121 m3/m3, 182.5 bar kezdeti nyomás mel-lett. A gázsapka C3-C4 tartalma 4.3 mol%, a C5+ tartalom 3.5 mol%. A 41 éves termelési múlt során az elsôdleges mûvelési mechanizmust követôen az olajkihozatal növelése céljából gáz-olajhatári besajtolást végeztek, amelynek eredményeként az olajtest esetében 2006 decemberére 41.7%-os kihozatalt értek el. A tároló menedzsment célja kettôs volt, egyrészt, hogy olyan a kiírási feltételeknek megfelelô földgáztárolót hozzon létre, amely megfelel a stra-tégiai elvárásoknak, másrészt a mobilgáz feltöltés megkezdésével és a gázforgatás megindításával egy olyan EGR eljárást vezessen be, amely lehetôvé teszi a közepes komponensû szénhidrogének gyorsított ütemû kitermelését és kihozatalának növelését a gázsapkából. Egy 3 dimenziós, kompozíciós szimulációs modell került kidolgozásra a gáz-tá rolás és gázforgatás gazdasági potenciáljának meghatározása céljából. A statikus geológiai modell up-scale folyamata során az egyes áramlási egységeket az összekapcsolódó és megegyezô ülepedési környezetben található kôzettestek alapján jelöltük ki. Összehasonlítva az elôrejelzési változatokat elmondható, hogy a gázforgatásos EGR eljárás segítségével 46.2 em3 elôrehozott kondenzátum termelésre van lehetôség 2010-ig, 39.6 em3 többlet kondenzátum termelés mellett. A gáztároló fejlesztésénél 44 db új kút fúrását tervezték, 4.5”-es termelôcsô átmérôvel, amelyek közül 10 db vízszintes kút. A ho-mok olási problémák elkerülésének érdekében mindegyik kút szûrôs kiképzéssel ellátott. A tároló fejlesztés megvalósítása igen ambiciózus, hiszen a stratégiai készletnek 2010. január l-tôl már rendelkezésre
MOL Scientific Magazine
52
1MOL GROUP
2008/3Development
kell állnia. Ez az esettanulmány összefoglalja a gázforgatási- valamint a tároló fejlesztési projekt tervezési és elôkészítési lépéseit, a fennálló kockázatok kezelési lehetôségeit, illetve azt, hogy a megfelelô tároló menedzsment alkalmazásával milyen járulékos elônyök érhetôk el, amelyek javítják a földalatti gáztároló gazdaságosságát.
Introduction
The initial function of underground gas storage is to balance gas consumption and resources at all times (seasonal, daily and hourly fluctuations) chiefly in the residential and commercial sectors, where demand is especially sensitive to changes in temperature. In addition, storage makes it possible to meet peak winter demand. The relative peak demand on the coldest day of the year is a very important parameter for the gas industry, because it conditions the size of the gas distribution network. In Hungary, during the maximum daily send-out registered on 26-27 January 2006 (89 Mm3/d), storage facilities supplied 52% of the demand. In fact, storage facilities provide many more services. They can play an important role in eliminating the risk of supply shortages (interruption of a supply source, technical problems in the pipeline system). In January of 2006 serious havaria situation emerged in the gas transmission of Central Europe because of dispute between Ukraine and Russia leading to a shutdown of gas supplies. Therefore the Hungarian Parliament passed a bill on strategic gas storage, after which the Hungarian government called for a tender in the implementation of strategic underground gas storage. This tender created the opportunity of MOL Plc. being engaged in the gas storage business again after its gas trade and underground gas storage branch (with 5 underground gas storages) were sold to EON Plc. in 2006. After screening the domestic gas storage opportunities MOL suggested developing a gas cap of oil reservoir which had already brought into production more than 40 years ago. The Szôreg-1 reservoir is situated in the SE part of Hungary, in the Algyo field, which is the largest hydrocarbon accumulation in the Pannonian Basin. The tender winner MOL Plc. planned and developed a 1.2 Bn m3 working gas capacity underground gas storage which has 20 Mm3 daily peak capacity even for as long as 45 days meeting the tender conditions.
Background
The 76 hydrodynamical units of Algyô field contain mainly gas and saturated oil, but undersaturated oil and gascondensate reservoirs can also be found here. The reservoirs were formed on a compaction anticline of North-North West, South-South East direction, at a depth of 1500-2600 m below sea level. The structure consists of the four following rock types:
A schematic geological cross section of the structure can be seen in Figure 1.
The pressure of the reservoirs is hydrostatic, more or less having interconnection with the Pannonian age aquifer system of the Hungarian Great Plains. Hydrocarbons have been produced from this field for more than 40 years.
The main part of the reserves is in the Upper-Pannonian delta sandstone having large areal heterogeneity. 90% of the recoverable oil and gas reserves in the field is contained in this sandstone.
The Szôreg-1 reservoir is located nearly in the uppermost deltaic formation of the structure. The reservoir is lithologically closed in this SE direction, having water influx from other directions.
Geological environment
Unfortunately, there are no cores available been able to penetrate the whole span of the rock body. However, on the basis of the analysis of sporadic cores the following general picture can be drawn. The general sequence of Szôreg-1 starts with argillaceous marl strata, which is alternated with clay stone, marl, coaly argillaceous marl. This lower sequence expresses a delta lobe abandonment process, as it can be derived from the general sedimentological evolution of the Algyô Field. This rock type can appear at higher stratigraphical positions, too, but in that case it contains lignite intercalations. In these situations transitions from argillaceous marl, marl to lignite are very characteristic. The thickness of the lignite bands or layers can vary from a few cms to tens of centimeters. Foliation
Deep water Deep water turbidity fansturbidity fans
Delta Delta slopeslope
Delta Delta plainplain
SzSzőőregreg--11
Figure 1.
53
Development2008/3
and shiny sliding surfaces are important features.
Fine siltstones are grey, dark grey rocks showing foliation or earthy crackings. They have a great amount of macrofauna, somewhere forming coquinas, too. This rock type is generally rich in coalified plant fragments. Fine siltstones have a gradual transition towards coarse siltstones, but they can be interbedded by thin fine sandstone bends, as well.
Coarse siltstones are gray, but frequently show ochre discoloration. Their mica and fine sand contents are quite high. In general they are laminated by coalified plant fragments. Fine sandstones are light gray, and laminated by coalified plant fragments and mica. They have gradual transitions towards coarse sandstones and coarse siltstones.
The coarse sandstone samples are laminated, but the massive structureless development is also frequent. In some places, the clay mineral content of the pore space can be high. In these situations the pore throats are narrower, and clay and carbonate minerals have
developed within the pore spaces. Otherwise, the carbonate content appears in the form of carbonate grains. Horizontal bedding and high and low angle cross bedding are the most characteristic sedimentary structures observable.
The main geological parameters are summarized in Table 1. and Figure 2. show the top map of reservoir.
According to the well logs, the inner heterogeneity of Szôreg-1 is considerable; i.e. these rock types, despite the sequence starting argillaceous marl, can not form laterally continuous layers. They are only present for some tens or hundreds of meters. The interfingering of the different layers is characteristic.
A schematic stratigraphical cross section of the structure and a CT image of a typical core sample can be seen on Figure 3.
On the bases of the integrated study of core descriptions, core analysis, well logs and sand body geometry, the depositional history of Szôreg-1 rock body can be outlined as follows (Figure 4.): As a result of the abandonment of the former delta lob, extensive interdistributary bay sedimentation must have characterized the studied area. During the initial stage, sand accumulation concentrated to the SW part, where the appearance of one larger and several smaller distributary mouth bars indicated the starting of a new lob-prograding period. Later these discrete mouth bar bodies merged and a laterally extended sheet-like sand body was formed within the SW region. As a background lobe became more active, new higher energy distributaries incised into this sheet. By their lateral migration, another sheet-like sand body was formed pushing further into the bay. New mouth bars developed and merged just in front of the channels. In the meanwhile a quite typical fluvial deposition was dominating in the background. As a consequence it can be stated, that the above mechanism resulted in the filling up of an interdistributary bay mimic the larger delta sedimentation. The main difference is obviously the scale and the fact that the driving force in the accumulation of Szôreg-1 was a multiple source crevassing process and the main delta channels were outside of the area analyzed. According to the depositional strikes they must have been at the SW and NE wing of the Algyô Field.
The reservoir fluid is saturated light oil of 45 API (800 kg/m3) with significant gas cap. The initial oil formation volume factor is Boi = 1.4 m3/m3 and the initial solution gas-oil ratio is GOR = 121 m3/m3. The oil viscosity at reservoir conditions is 0.32 cP. The initial gas formation volume factor is Bgi=0.00607 m3/m3. As Table 2. shows, the initial gas cap composition is rich in C2 and C3 components and the total inert content is slightly more than 2 %.
Production history and performance
The field development started in 1967 with short after the discovery of the field with the completion of production wells, similarly to the rest of the significant reservoirs. Only 3 wells were brought into production until 1969 in order to test production, and it was followed by the completion of an additional 23 wells in the next 3 years. The production history of the oil producer wells until the end of 2006 is presented in Figure 5.
Significant oil production was started parallel with starting of water injection on the initial GOC. The injection history of the field until the end of 2006 is presented in Figure 6.
The intensification of the field production was fulfilled in two main different timing periods. The first period is between 1979-1983 when
the water injection was extended step by step in the main producing areas and the second part is between 1984-1988 when the whole oil body was depleted at high rate parallel along with water injection. The peak production was about 1000 m3/d and the production regime was limited to 400 m3/m3 gas-oil ratio. The average water cut reached 60% in 1988 even though flooding was not uniform and a slower than average flooding could be detected in the western part. In the following period there was a decreasing oil production with unchanged production regime, however, it was stopped
for a short time between 1993-1995 when several wells had perforation modifications and the injection rate was increased. The applied production technology was an artificial gas lift system. The GOR had been gradually increasing since 1995 and the water injection was stopped in 2003 for good before the high rate depletion of the gas cap started. Before starting the high rate gas cap withdrawal the cumulative water injection had been more than 20 Mm3 and the oil recovery factor had already reached 40% and even the gas cap had also been partly depleted through the oil producer
Figure 5.
Figure 6.
MOL Scientific Magazine
56
1MOL GROUP
2008/3Development
wells reaching the gas cap recovery factor of 40%. With the starting of high rate gas cap production the GOR limit for the oil production was liberated and the total liquid production of the oil wells was increased as much as possible before drastic gas cap production inducing the water front movement to minimize oil loss.
The high rate gas cap withdrawal was started in the beginning of 2005 through 5 vertical and 3 horizontal wells. Production history of gas cap can be seen in Figure 7.
As a consequence of good reservoir characteristics the initial well’s productivity was favourable so a 79% ultimate recovery factor was estimated for the gas cap at 130 bar abandon pressure and due to the efficient water displacement a 43.2% ultimate recovery factor was estimated for the oil rim. The reservoir pressure decreased from the initial 182.5 bars to 155.2 bars by the end of 2005. The horizontal wells were completed with re-entry drilling from the existing wells and with slotted liner completions in the horizontal section. Sand
control problems were not expected during the production.
Capacity measurement results of A-925 hori-zontal gas well are summarized in the Table 3.
It is not negligible that there was a blow-out in 1969 during the oil rim development (A-168 well) which caused more than 389 Mm3 gas transmission to the other upper pannonian layers until the middle of 1970 according to the material balance calculations.
Long production history as well as transmitted gas volume together with water injection on GOC caused relevant movement of GWC in the certain blocks found mainly in the north-western and western part of the reservoir. The calculated saturation distribution was controlled by using OH and CH logs and 3D seismic attributes analysis as well. Time related gas saturation changing can be seen in Figure 8.
Not only during the material balance calculation but also through numerical simulation process
was it possible to reach adequate reservoir pressure matching in provided time dependent aquifer parameters and intensity were used. That effect caused by the common upper-pannonian aquifer system through which the different reservoirs interfered with each other. The gas saturation distribution map can be seen in Figure 9.
Until the end of 2006 it was produced 485 Mm3 gas was produced through the gas producer wells. At this stage of the gas cap production it was called for a tender the implementation for a strategic underground gas storage in 2006 which had to have minimum1.2 Bnm3 working gas capacity on 20 Mm3 daily peak capacity even for as long as 45 days. According to the tender documents the UGS will have to be
ready for the production from January of 2010 there for taking into consideration the short time frame it turned out that Szôreg-1 reservoir was appropriate such purpose.
Problem handling from the reservoir management point of view
The further development conception, aimed to screening competitive UGS implementation, of the reservoir was elaborated by a multi-disci p linal team. The team members were reservoir engineers leading the operation and geologists connected to the different phases of the preparation, production engineers, experts of surface technology and over-works and of course economists.
During the planning the following crucial issues with there pros and cons had to be considered:
• longproductionhistory,well-knowncharacteristics
• aconsiderablenumberofpenetratingwells (more than 300)
partly water flooded gas cap• existingwellpattern• goodqualityinformationsources-3D
seismic measurement, several open hole and cased hole (carbon/oxygen) log measurements
To evaluate different UGS development scenarios, the following examinations were carried out.
MOL Scientific Magazine
Figure 8.
Figure 9.
58
1MOL GROUP
2008/3Development
Modelling
The creating a 3D full field simulation model was necessary in order to analyze the production history and to determine the existing potential cushion gas volume and further reservoir development strategy. The hidrodynamical simulation model was based on a 90-layer-geocellular model sized 100m*100m. The modelled attributes were sand contents (cores+760 wells micrologs), porosity, N2G ratio and initial water saturation. The up-scaling was based on the cumulative relative frequency of areal extent of sand content bins and the relative distance from the permeable top.
The cumulative relative frequency of the areal extent of sand content bins vs. distance from the permeable top is presented in Figure 10.
The simulation grid was rotated in an angle of -43 ° had 108×68 gridpoints in thirteen layers. Concerning the lithological delimitation of the east contour, the number of active elements was 85 thousands. It was necessary to evaluate a compositional PVT model to analyse the
behaviour of reservoir oil and the gas cap phase to describe the effect of the dry gas injection. After reducing the number of components, the phase behaviour of the system could be adequately described using eight hydrocarbon components.
The result of the characterization is in Table 4.
Six OWC equilibrium regions were used during the initialization. The volume of aquifer is 6.5 Bm3 (Red=9.5). The capillary and relative permeability curves were based on core laboratory measurements. The main results of history matching are in Figure 11.
The history matching results were controlled by using of 3D seismic attribute analysis and log measurement as well.
Forecasting further reservoir development strategies
It was an important aspect during the elaboration of further reservoir development
MappingDeposition of sediments with sandstonecontent higher than 90% started at ~36 mGood sandstone (>90%) depositions between22-28m, 10-19m and 3-4m relative topermeable top
The largest sandstone (>90%) depositionsbetween 12-16mAs the areal extent of good sandstone (>90%) deposits increasesso decreasesthe extent ofsuch deposits which sand content is between 40-70%.The progradation of the delta system wassignificantly faster with coarser sediments thanin the caseof older upper pannonian reservoirsThe retrogradation of the delta system took a longer time
strategies that despite of the long production history there is a considerable gas reserve in the gas cap together with significant condensate content. According to the calculation from the end of 2006 the gas reserve which can be considered as cushion gas is almost 2400 Mm3 together with 375 km3 condensate volume. After the recoverable reserves and potential cushion gas volume had been estimated the object of further examinations was to evaluate and calculate the mobile capacity scenarios.
As shown above, the potential UGS had to meet the tender requirements appropriate to the implementation of 1.2 Bn m3 working gas capacity with 20 Mm3 daily peak capacity even for as long as 45 days.
Several scenarios were worked out in order to optimize the investment and to analyze the behavior of reservoir. The greatest uncertainty was the scheduling of the UGS withdrawal since in case of strategic UGS usage highly depends on external circumstances. According to the experiences every 5th year occurs an extraordinary event (abnormal weather conditions, havaria in gas pipeline system) justifying the operation of the storage. During the simulation we examined the minimum cushion gas volume necessary for securing peak capacity, the effect of various injection schedules, the effect of the oil body’s production strategy, the possibility of implementing a well-pattern and surface technology. The calculations showed the recoverable gas reserve is appropriate for
scenario 1 scenario 2 scenario 3scenario 4 base case
Figure 12.
60
1MOL GROUP
2008/3Development
ensuring the required volume of strategic mobil gas even at continuous operation (base case).
Changes in forecasted reservoir pressure in case of some characteristic scenarios are presented in Figure 12.
Tracing the changes in the reservoir pressure shows that the pre-scheduled injection (January 2008) of the mobile gas volume led to more uniform pressure build-up and to a lower loading pressure. This is a risk reducing feature since it means more uniform water-displacement and lower load.
Maintaining high level liquid production (base case and scenario 4 vs. scenario 3) – which was done earlier after the starting of the gas cap withdrawal – shows further risk reducing qualities. Such production significantly reduces the average reservoir pressure decelerating water influx during the first injection period; moreover it generates greater economical results although higher specific artificial gas lift volume is needed.
Finding possibilities for improving capacity was a crucial issue when examining the various ways of storage. According to the calculations it is possible to reach additionally 700 Mm3 mobile gas capacity (scenario 3 and scenario 4) in that case the havaria situation occurs only in every 5th year. This case additional cushion
gas replacement is not needed and in the 5th
year the extra gas volume will be produced from the original cushion gas body. Maintaining the safety distance between production wells and influxed water front it is necessary to reduce the production level in the next year (almost 300 Mm3 mobile volume) to leave enough time to restore the reservoir pressure and contacts.
Even 1.9 Bm3 mobile capacity can be ensured by drilling of 44 new wells but the existing gas producer wells (only in producing function) will be used also for improvement of deliverability.
The planned well pattern and top map is presented in Figure 13.
The selection of the surface well locations was a really challenging procedure because the field area is well developed (many other well completion, surface facilities, two rivers) so it was difficult to select any locations which correspond to the reservoir management requirements as well. The total well number includes 10 horizontal and 14 deviated wells. Despite of the long sand free production it was selected Halliburton production screen completion to avoid sand control problems.
The schematic cross section of planned horizontal well completion is presented in Figure 14.
Figure 13.
Economical screening examination
Preliminary economical screening examinations were made in all of the cases. The economical application was significantly affected by amount of cushion gas volume and the technological elements. The main elements are 44 wells, 7 compressors with 12.7 Mm3/d injection-capacity, 5 gas processing unit with JT expansion technology, 3 main gas gathering stations and the 210 bar specific pressure production and injection trunkline system. Because of the forecasted high rate condensate production a propane cooling unit will be installed.
The main question is how it is possible to utilize the condensate rich cushion gas volume more effectively and there is any way to increase the existing oil production? With the application of the pre-scheduled dry gas injection and recycling we had a chance to reach a more profitable development leading to an increase in the recovery of mid hydrocarbon components from the gas cap and an accelerated production of condensate. Forecasted condensate production in case of some characteristic scenarios is presented in Figure 15. For the pre-scheduled injection project and gas recycling a temporary injection system was implemented with the installation of 4 pieces 2 stage compressors and using of existing gas producer wells. According to the plans until to the middle of 2009 more than 500 Mm3 dry gas will be injected from which 1 Mm3/d will remain in the reservoir as a mobile gas volume. Figure 16 shows the comparison of the C7-C9 saturation changing during the pre-scheduled injection period.
Comparing the production forecast cases due to the introduction of EGR gas
injection it allowed for an additional 39.6 km3 condensate increase and 46.2 km3 advanced condensate production until 2010.
Because of the given favourable infrastructures, development costs less than 3,0 USD/bbl with low operation costs are needed to the application of the technology. As a result of the gas recycling taking place in the reservoir, there is a possibility to increase the total profitability by 5 percent.
MOL Scientific Magazine
Figure 14.
0102030405060708090
100
2007
.01
2007
.10
2008
.07
2009
.04
2010
.01
2010
.10
2011
.07
2012
.04
2013
.01
2013
.10
2014
.07
2015
.04
2016
.01
2016
.10
2017
.07
2018
.04
2019
.01
2019
.10
2020
.07
2021
.04
Forecasted condensate production (103 m3/quarter)
scenario 2 scenario 3 scenario 4 scenario 1 base case
Figure 15.
Development2008/3
61
62
1MOL GROUP
Conclusion
• Thedevelopmentandthecondensaterecovery enhancing method of a strategic UGS has been presented.
• ThepotentialUGSmetthetenderrequirements appropriate to the implementation of 1.2 Bn m3 working gas capacity with 20 Mm3 daily peak capacity even for as long as 45 days.
• Accordingtothecalculationsitispossible to reach additionally 700 Mm3 mobile gas capacity in the certain circumstances.
• Thebasisofthetechnologywasthereservoir management view and a multidisciplinary team elaborated the further development strategy.
• Byusingtheexistingfavourableinfrastructure it was possible to launch the injection and the gas-recycling project which resulted in reduce of the risk of implementation.
• Astheeffectofinjectedgasitallowedalmost for an additional 39.6 km3 condensate increase and 46.2 km3 advanced condensate production until 2010.
As a result of the gas injection starting in 2008, the value of the reservoir will be increased with more than 5%.
Acknowledgement
The authors thank the Hungarian Oil and Gas Plc. (MOL Plc.) and the Hungarian Hydrocarbon Stockpiling Association (MSZKSZ) for permission to publish this work. We also thank each member of the UGS development team for their support and many useful discussions.
References
[1.] Dr. J. Geiger, J. Komlósi: Szôreg-1 telep rezervoárgeológiai feldolgozása, MOL report 1999.
[2.] I. Papp: Szôreg-1 telep mûvelési felülviszgálata, MOL report 2002.
[3.] I. Papp: Szôreg-1 biztonsági gáztároló mûvelési terve, MOL report 2007.
Revised by: Eszter Vizler
2008/3Development
Figure 16.
63
Abstract
Start of TVK Olefin 1 unit in August 2003 and of the new Olfin-2 Plant in the following year has created a 710 kto/year transport demand increase between Százhalombatta and Tiszaújváros.Magnitude of transported volume, as well as high environmental hazardous impact of the products have led to it jointly, that throughout the successful execution of the biggest pipeline construction of the past years MOL Plc. has grown its pipeline system with another 183 km.The transportation experiences from the first year have justified the expectations, what say the product pipeline is operating in a cost efficient way ensuring the safety of the environment to maximum degree.Please, join us on a journey, what lets us have an insight through the past into the future and shows us how the product pipeline transportation is equal to the challenges of the new millennium.
Összefoglalás
TVK Olefin-1 üzem 2003. augusztusi, valamint az új Olefin-2 üzem egy évvel késôbbi indulása 710 kto/év CH termék többlet szállítási igényt generált Százhalombatta – Tiszaújváros viszonylatban.A szállítandó volumen nagysága, valamint a termékek magas környezetkárósító hatása közösen vezettek ahhoz, hogy az elmúlt évek
legnagyobb csôvezeték építési projektjének sikeres végrehajtásával újabb 183 km-el növekedett a MOL Nyrt. csôvezetékrendszere.Az elsô év szállítási tapasztalatai igazolták azon elvárásokat, mely szerint a csôvezeték úgy mûködik költség hatékonyan, hogy emellett maximálisan biztosítja környezet védelmét.Kérem, tartsanak velünk azon az úton, mely bepillantást enged a múlton keresztül a jövôbe, és megmutatja, hogyan felel meg a távvezetékes termékszállítás az új évezred kihívásainak.
MOL Scientific Magazine primarily contains the presentation of trade novelties, upgrades and projects to be implemented within the premises of PMD.
Part of the fields of activities by this Division – operating crude oil and crude product transport pipeline systems – is considered as a mining activity, and as such is somewhat unknown to the colleagues. On the account of the project, in the above title the writer would like to present the transportation activity by pipeline, with a special emphasis on maintaining safety.
The development in the equipment and methods for transporting hydrocarbon products is closely integrated into the development of the oil industry. As early as prior to the 2nd World War, oil industry experts realised that the safe and cost effective transportation of high volumes of liquid hydrocarbons could be implemented via high pressure HC product transport pipelines. The advantages of this transportation method are availability on a continuous basis, easy adaptation to geological properties, and the high rate of safety. In addition to environment protection and economic aspects, it is also important that both the transportation losses and the maintenance and operating costs are lower with this transport method – primarily
László Attila Bíró (54)General managerLogistics, Product PipelineE-mail: [email protected]
Transporting benzene and toluene by pipeline – First at MOL in the world
Development2008/3
MOL Scientific Magazine
64
1MOL GROUP
2008/3Development
due to the low specific energy and manual work indices. However, its disadvantage is its high investment cost.
In Hungary the establishment of the product transport line network started in 1965, and by today it has a length of more than 1300km. The network was implemented so that starting from Százhalombatta it connected up the refineries providing a possibility for moving semi finished and finished products amongst them. The supply to the logistical terminals of MOL, to several thermal power plants, to petrochemical complex Tiszai Vegyi Kombinát (TVK) and to Ferihegy Airport is also via pipeline. The Eastern product line, which provides a connection into the Ukrainian – Russian product pipeline system and supplies high sulphur gas oil to Tisza Refinery (TR), is of a great importance. In 2007 the volume of transportations via the product pipeline system exceeded 7.5 M tons.MOL product transport pipeline system is shown in the map below:
1. Background
As part of its development program, TVK commissioned the pyrolytic gasoline treating unit in Olefin-1 Plant in August 2003, followed by the construction of the new Olefin-2 Plant in the following year.
MOL has undertaken a commitment to transfer an annual 1,850 kto of chemical feedstock, mostly chemical naphtha and chemical gas oil produced in the Danube Refinery (DR) and transported to Tiszaújváros via pipeline. It also has undertaken a commitment to re-purchase the by-product fraction (so called twin products) generated in a significant quantity. Of the products C9+ fraction is sold to AES Tisza Power Plant, while benzene and toluene (BT) and C8 fractions are processed at Százhalombatta. The BT fraction contains high
quantities of valuable components, benzene and toluene, which when recovered can be marketed, while C8 fraction can be used in the modern motor gasoline production as a blending component.
In order to satisfy the commitments undertaken the implementation of project “Logistical functions in transporting and storing the TVK olefin twin products” was launched in 2003.
Throughout the project:• AnewsizeDN200transportpipeline,
metering station and pumping station were constructed between TR and TVK.
• InordertotransferC9+fractiontoAESTisza Power Plant a new discharge line and a pumping and metering station were constructed.
• Forestablishingtheconditionsforreceiving BT and C8 fractions in Tisza and Danube Refineries a discharge yard upgrade, pump installations, arrangement
of new piping connections were implemented along with revamping 2 off 10 m3 tanks.
Concurrently with the project titled “Logistical functions in transporting and storing the TVK olefin twin products” the preparations commenced for constructing the new high pressure product transportation line between Tiszaújváros and Százhalombatta. All these upgrades became necessary for providing the streams amongst
TVK, TR, DR and AES Tisza PP, which is illustrated below on a schematic flow diagram.
In defining the diameter and flow capacity of the transport line the transportation of a total of 710 kto/year of HC product had been taken into consideration based on the above.
2. Preparations for constructing the BT pipeline
2 . 1 R I S K A N A L y S I S F O R T H E C O N S T R U C T I N G T H E H I G H P R E S S U R E H C T R A N S P O R T L I N E
In addition to the transportation of the BT and C8 fractions and the imported gas oil to Százhalombatta via pipeline the transportation can be ensured by rail.
65
Development2008/3
Transportation by rail implies a significant environmental risk since the proper handling and inspection of the BT, which is especially hazardous to health, is ensured at the railway dispatch and discharge points only.
Based on the risk analysis performed:• Fortransportationbypipelinethe
probability of pipe rupture is one order of magnitude lower than that of the serious incidents arising from railway transportations.
• Fortransportationbypipelinethespecificrisk values are dominantly lower.
• Forsocialriskthedatagiveahigherriskto transportation by rail, which result from the fact that the railway wagons pass through densely populated areas (such as Budapest, Miskolc etc.).
• Accordingtotheriskanalysisandtotheinternational data bases processed BT runs no greater risks from safety and health points of view than the gasoline and oil grades transported for decades, because in an emergency:- Although a toxic vapour concentration may develop, however the population can be evacuated in the time available.
- A carcinogenic impact may develop in case of contact for a prolonged time only, which – considering the odour threshold limit of benzene – is not typical.
- Hazard sources typical of gasoline – pool fire, jet fire – may develop.
From MOL Group’s business profit point of view. it also matters whether the movement of this great volume of goods is made by railway with a significant additional cost, or by pipeline, with a cost amounting to approximately 15 to 20% of the former.
2 . 2 P R E P A R A T I O N A N D P E R M I S S I O N S
During the procedure of receiving the permissions – which concerned a total of 18 authorities, of which a few examples are mentioned here only – OLAJTERV were preparing the construction design documents on a commission by MOL.
The Hungarian Mining Agency nominated the Mining Inspectorate of Miskolc as an authority granting permission, since the transport equipment concerned the area of competency for several Mining Inspectorates. The Miskolc Mining Inspectorate issued the construction permit in October 2005. The construction permit and the statement of position by the North Hungarian Environment Protection Nature Conservation and Water Management Directorate as professional authority included very severe specifications due to the hazardous nature of the fluids transported.
At the time of the project Act No. XLVIII of 1993 on mining and Government Decree No. 203/1998 (XII.9) on its enforcement were addressing the construction and operation of hydrocarbon transport pipelines. As regards
MOL Scientific Magazine
66
1MOL GROUP
2008/3Development
procedural regulation, Code No. 4/1979 OBF was applicable, which lost its effect during the construction work, and Decree No. 79/2005 (X.11) GKLM on the safety requirements of hydrocarbon transport lines and on the publication of a Safety Code for Hydrocarbon Transport Pipelines came into effect.
For the construction of the transport lines and the associated stations these codes do not make special constraints because of the hazardous nature of the fluid to be transported. Regarding the transportation of traditional HC products by pipeline, experiences of several decades have accumulated, still the benzene-toluene fraction must be considered as new and hazardous– at least in the opinion of the environment protection authority.
During the preparation stage the time-consuming and project-demanding specifications were as follows.
2.2.1PreliminaryEnvironmentalImpactStudy(PEIS)Pursuant to the provisions of Government decree No. 20/2001 (II.14) the construction of high pressure transport lines is subject to PEIS.When preparing the PEIS an agreement was reached with all owners (more than 6,500), authorities, utility operators concerned after a site visit. The initial task was to obtain the written statement of agreement from all those concerned.
2.2.2SafetyzonePursuant to Government Decree No. 253/1997 (XII.20) on the national settlement development and construction requirements the protection area for the facilities of a route type structure is to be defined as a protection strip (safety zone).In line with Decree No. 6/1982 (V.6) IpM an increased safety zone of 13m on either side was established – due to the chemical hazard of the transported materials – in order to protect the line and the environment.
For the area of the safety zone an easement right had to be registered.
The applicable decree sets forth limitations for the safety zones, namely within the safety zone of the transport line it is not allowed to:
plantation, fishery, water reservoir within a 15m distance on either side;
• planttreesandplaceanyothercordon,cultivate soil deeper than 50cm and store materials temporarily or permanently within a distance of 5m on either side;
• plantshrubsandbushes(gooseberry,currant, grapes, etc.) within a 3m distance on either side
2.2.3ArchaeologicalworksThe route of the transport line involved archaeological sites, therefore a heritage protection study and preliminary survey had to be prepared for the area concerned with the route, on the basis Act LXIV of 2001 on the “protection of cultural heritage”. Based on the conclusions of the study the excavation of the sites had to be made prior to starting the construction works. For a preliminary excavation, an agreement had to be concluded with the museums of the 4 concerned counties. – Their work cost HUF 300million.
Discovery and rescue excavations were performed at 142 registered sites in a 100.000 m2 discovery area within four counties.
The findings were exhibited at several MOL centers as a moving exhibition.
2.2.4EasementrightsFor constructing the line mining easement right had to be established, for which the approval of the land owners and operators was required. Along the 183 km long route conclusion of a
Archaeological discovery along the route
67
Development2008/3
contract became required with more than 6,500 property owners, and in respect of more than 1,000 real properties. Approximately 60% of the owners agreed to the land use, while an administration procedure had to be filed for the balance.
In the contract MOL undertook to compensate for the damages caused by the line construction work, including payment for green damages (re-cultivation) and other damages occurred, along with the reduction in value due to the easement right limitations.
MOL purchased the land areas required for the sectioning stations.
3. Constructing the line
Almost the whole line was laid next to operating crude oil, natural gas and product pipelines.
Preparations and the procedure of receiving the permissions took more than 2 years. All this was implemented by the staff of the Projects Implementation organisation and OLAJTERV.
In the individual project proposal EB approved the EPC approach as an implementation model, first time in the projects to be implemented within the premises of Logistics. Due to the deadline modifications of the preparation activities, the projects implementation organisation looked after most of the activities itself. They performed:
museums in order to allow compliance with the heritage protection act;
• havingtheconstructiondrawingsprepared;
• thepurchaseofhighvaluematerials(piping, pumps);
• implementationoffacilitysupervisionthrough a contracted partner.
Contracting competency turned into a general construction competency, later transferred to OLAJTERV.
3 . 1 S O C I A L C H A L L E N G E S H I N D E R I N G C O N S T R U C T I O N
• Archaeology Agreements had to be concluded with 4
museums of the areas concerned for a nearly 100,000 m2 area discovered, and
their implementation provided for prior to and during the construction work.
• Environment protection The expectations of nearly 30
professional authorities had to be satisfied. It may sound unbelievable to the reader, but from some areas the gopher population was displaced. In other marshy areas the fish species Umbra Krameri was rescued, while in several nature conservation areas the construction work had to be timed in accordance to the hatching season of the birds of prey.
• Liaison with landowners Some of the 6,500 landowners tried to
stop construction, and in order to prevent sabotage, the presence of police force and security services was necessary.
3 . 2 T E C H N I C A L C H A L L E N G E S
• Procurement Due to the large scale of pipeline
construction works in Asia, the purchase with the short deadline of the major amount of piping, pipeline pumps and the special emergency preventing devices caused extreme difficulties. .
• Designing Due to the changing specifications of
the professional authorities, the different requirements of municipalities and land owners, and surface water areas generated by rainy weather, more than 2% of the construction drawings had to be modified during the construction work.
• Construction work The short construction deadline, the pipes
of high magnetism difficult to weld, the quality assurance and project managing problems encountered by the general
Surface water on the construction route
MOL Scientific Magazine
68
1MOL GROUP
2008/3Development
contractor were all occurring as tasks to solve on a continuous basis.
3 . 3 S U C C E S S F A C T O R S O F T H E C O N S T R U C T I O N W O R K
It can be stated clearly that the facility was implemented within a short period of time unparalleled in the transport line construction practice in Hungary, and that fact has been due to the following:
• Throughouttheconstructionworktheoperator the investor and the main contractor established a join project management. In order to solve the frequent crisis situations the project management established direct client relation with its subcontractors in order to involve high number of experts, and a new type of facility supervisory activity was implemented. The latter means that the project commissioned a third party independent company to perform the qualitative and quantitative control through the total duration of the construction work. The skills and commitment of the subcontractors involved in the construction work must be noted in any case.
• Duringtheactivityoftheprojectmanagement – due also to the accurate definition of responsibilities and competencies – a transparent, traceable change management had been implemented. The direct interventions into the construction process were executed in close co-operation with Logistics, DS Development, HSE and Projects Implementation.
The pie chart below presents the division in the project costs of the line construction work.The data shown on the pie chart illustrate well the cost differences between a project
within the fence line and the construction of a high pressure transport line to be laid in an area covered with easement rights. The construction work, the design engineering and the materials used amounted to 58% of the total costs. The balance of the costs covers associated expenses, which are characteristic of a transport pipeline work only: easement rights (24%), compliance with both the heritage protection law (5%), and with the special regulations by the professional authorities (8%), and other costs (5%).
4. General description of the product transport pipeline
4 . 1 T H E P I P E L I N E R O U T E A N D I T S E q U I P M E N T
The length of this new product pipeline between Tiszaújváros and Százhalombvatta is 183.1 km, its size is DN200 and pressure rating is PN63 bar.
The product pipeline has been constructed using longitudinally welded steel pipes of material grade L360MB corresponding to a safety factor of 2. The pipes used had been insulated on the outside in the factory.
Between the starting point at Tiszaújváros and the receiving point at Százhalombatta 19 sectioning stations had been built. The product pipeline is of a design, which can be pigged all along the line. A pig starting and a pig receiving station had been installed at Tiszaújváros and Százhalombatta, respectively.
The product pipeline had been laid with a 1.2m soil cover all along the line, with the exception where the line runs in populated area, or near a water base. In the Gyömrô and Alsonémedi region the cover thickness is 3m, while near the water base at Tököl the cover is 1.5m. A plastic route marking foil is placed above the line, in which wires of a safety function are running. If the wire gets damaged the protection system sends a signal to the dispatcher centre, and identifies the location of the damage.
The route of the product pipeline follows that of the existing crude oil transport line Friendship 2, however goes around the edges of the water base at Csány. From the sectioning station at Tököl to the edge of the water base the line was laid into a sand bed
69
Development2008/3
during the construction of the route, which was surrounded with a 2mm thick PE sheet since along that section a bypass around the water base was not feasible. The PE sheet was placed on top of the line with an overlapping.
Along the complete route of the product pipeline active cathodic protection has been installed. The starting point of the transport line has been arranged in the premises of the logistic terminal at Tiszaújváros. After a filtration at the starting point the products are discharged into the transport line by means of the pipeline pumps via the metering and control station. Of the two filtering and pressure control and metering pipe branches installed one is duty and to other is standby. Of the two parallel connected pipeline pumps one is duty the other is standby under normal operation.
The product line route crosses both Greater Danube and Small Danube. For crossing River Danube the pipeline size DN200 pressure rating PN63 bar laid earlier for this purpose, and its spare line size DN150 pressure rating PN63 had been used, while in crossing Small Danube no spare line had been laid. In case the line, which crosses Small Danube, is damaged, the section will be closed and the spare line size DN200 pressure rating PN63 bar – which had been constructed for product pipelines made earlier – existing under Small Danube will be used.
The sectioning stations along the product pipeline have been installed more closely in order to reduce the quantity of spilled product in an emergency, therefore so called sub-sectioning stations have been included between the existing sectioning stations on the Friendship 2 route. The isolation valves have been located in lockable manholes, with hydrocarbon sensors and manhole cover opening detectors mounted in the manholes. In the sectioning stations redundant process control devices have been installed with temperature and pressure measuring, leakage detecting and pig pass indicating functions.On the two sides of the isolating valve at the sectioning stations one nozzle size DN100/PN63 has been mounted so that in an emergency the damaged section can be drained into the adjacent intact pipe section by connecting the emergency pump.
Passing through the pig receiving station at Százhalombatta, the transported products flow
into the storage tanks via the flow metering and controlling station.
4 . 2 S P E C I A L F U N C T I O N S O F T H E P R O C E S S C O N T R O L S y S T E M
• Piperapturedetection:thesystemshutsdown the transportation immediately and isolates the complete line.
• Realtimeleakagedetection:bycomparing the product flows going in and coming out at every 5 seconds
• Locationfinding:accurateandquicklocation of the leakage, tapping or rapture point within 100 m , using two independent – acoustic and hydraulic – methods
• Modelcompensatedhydraulicsupervision: indicates immediately an abnormal behaviour of the transport line.
4 . 3 M E A S U R E S T A K E N I N O R D E R T O I N C R E A S E S A F E T y I N R E S P E C T O F T H E M A T E R I A L S U S E D A N D T H E E X A M I N A T I O N S P E R F O R M E D
• Longitudinallyweldedsteelpipewitha safety factor of 2 instead of the 1.7 specified
• Factoryappliedexternallargerthannormal PE insulation in 3mm thickness
• Everypieceofpipeisfactoryexaminedwith 100% US shell examination at the longitudinal weld seams
4 . 4 E N G I N E E R I N G S O L U T I O N S A N D M E A S U R E S T O G U A R A N T E E T H E S A F E O P E R A T I O N O F T H E L I N E
• Warningandsignaltags,safetycolourcoding and pictograms
• Preventiveprotection Above the line at a depth of 60cvm from
the terrain a plastic sheet has been laid all along the line, on which a caption warns of the presence of the line. The sheet has 2 sensing and signalling wires woven into it, which close one circuit per pipe section. If for example a trenching machine was working in this forbidden place above the line he would damage first the sheet and the wires. This would break the circuit and the supervisory
MOL Scientific Magazine
70
1MOL GROUP
2008/3Development
system could identify the location of the damage from the change in the resistance with an accuracy of metres. The dispatcher alerts the standby group and the security services immediately who can arrive at the site within half an hour and stop the work before the line would be damaged.
• Linerouteinspectionbyair During the aerial checking carried out
at a weekly frequency the line and its safety zone can be clearly inspected, and changes can be clearly monitored, e.g. if an unreported work was being, or had been, carried out since the last inspection. Also a yellow discolouration of the vegetation can also be easily monitored and spotted in the vicinity of the pipeline, which could relate to the penetration of the HC product into the soil.
• Regularwalkingalongtherouteline The route of the line is also walked along
once every week, and every event is reported, which jeopardises the line and the safety zone. If due toe any failure the product spills into the environment its characteristic odour is detected promptly and reported without delay.
• Activechatodiccorrosionprotection system
• Processcontrolsystem,whichisdistributed both in space and functionality.
The photo below shows a sub-sectioning station, with the warning and prohibiting signs mounted on the fence. The isolating valve is located in a covered manhole.
4 . 5 P R O C E S S C O N T R O L S y S T E M
T O G U A R A N T E E T H E S A F E O P E R A T I O N O F T H E L I N E
• Thecentralremotesupervisionprovidessite inspection and operator intervention.
• Processcontroldevicesinstalledatthestarting, receiving and sectioning stations
• Hardwireddataconnectionbetweenstarting and receiving stations, and the GSM and GPRS data connections amongst the sectioning stations
• Redundantprocesscontroldevices,automatic mode of operation and other additional safety features.
5. Safety of operations
The causes of pipe rupture occurred on the West European high pressure HC transport pipelines (some 30,000 km) in the last 25 years:
The data from Mid-Eastern Europe and from Hungary within it, differ significantly from those shown in the table and this difference explains the special protection methods used on the BT transport line.
Starting from the 90s more than 150 process upsets have been caused by third party interferences in Hungary – and these interferences were intentional in vast majority of the cases for the purpose of stealing fuel.
The high standards of operations and the associated maintenance are reflected in the fact that not failure or pipe rupture has occurred due to technical reasons.
In the picture below a pipeline tapping is shown where the offenders had mounted a nozzle on the pipe using a clamp to draw fuel. Due to the improper nozzle connection the damage to the environment was significant also in this case.
Cause Frequency Relation to Relation to comparison to gross spilled net spilled in all incidents quantity quantity Rupture 25% 30% 35% Operator error 7% 3% 3% Corrosion 30% 14% 19% Natural hazard 4% 4% 4% Third party 34% 49% 39%
Picture of a sub-sectioning station
71
Development2008/3
6. Responding to process upsets
The transportation by pipeline is not within the scope of the year 1999 Act No. LXXIV on the managing and organising the protection against disasters, and on the protection against serious incidents in connection with hazardous materials.
The losses arising from the damages to the pipeline may represent serious emergencies, so the safety of operations must be addressed.
6 . 1 P O S S I B L E C A U S E S O F P R O C E S S U P S E T S
Any incident or phenomenon – occurring on the transport line and its equipment – which deviates from the transportation activities under normal conditions, is deemed to be a process upset. The most frequent process upsets that may occur on transport pipelines can be classified into four groups:
Damage to the environment occurs when the transported products escape into the environment (soil, groundwater), so not all process upsets can be considered to be a loss incident or emergency from environment protection point of view.
Tapping the line with a clamping method
Hazards Preventive and protection options General practice BT transport line Intentional tapping - Informing signs -/+ + - Increase in the laying depth of the line - + - Prohibitive signs + + - Security services + + Accidental cutting - Signs + + - Marker ribbon (above pipe) + + - Duplicated communication cable - - - Iron/reinforced concrete cover - - - Limitations in cultivation + + - Monitoring system -/+ + Corrosion leak - Increase in safety factor -/+ + - More frequent sectioning possibilities - + - Stress testing - + - Increased maintenance - + - Tube in tube arrangement with leak detection - - - Internal coating -/+ - - Active cathodic protection + + - External insulation of an increased thickness - + - More frequent intelligent pigging - + Operational failure - Increase process discipline - + - Increase instrumentation requirements - + - Redundant automation -/+ + Natural hazards - Route setting + + - Construction of a spare leg + +Legend: - will not be used + will be used -/+is used occasionally
72
1MOL GROUP
2008/3Development
6 . 2 E M E R G E N C y R E S U L T I N G I N T H E S P I L L O F H A Z A R D O U S M A T E R I A L
In case the process upsets result in material spills, the establishment of rates is necessary on the basis of the spilled quantities for giving the emergency response instructions. The rates of emergency are:
• Fora100lit/hspilltheidentificationofthe spill location is necessary using the Operation Supervisory System (OSS). This quantity is probably not erupting suddenly through the surface of the line, so it will not even come to the surface without disturbing the soil, and is endangering directly the soil only or maybe the groundwater when the ground water table is high.
• Fora100to1000l/hspillitisprobablethat the spilled BT spreads out in a pool on the surface, and flashes into the air intensely at a rate subject to the ambient temperature, where it propagates quickly depending on the wind, terrain and cultivation conditions and can endanger the human health directly.
• Forspillabove1000l/hitishighlylikelythat BT fraction comes to the surface, and propagates quickly through flashing into the air.
This is the first condition system of classifying the process upsets. The second one is made by the environment along the pipeline route, and it takes a joint consideration of the two systems to qualify a process upset.
Along the BT line the following have been considered as receptors (potential targets of impact):
0. No special object or population to be protected within a 500 m zone on either side
I. Area important from nature conservation point of view within 500 m
II. Surface water or nearby (within 100 m), or flood land (within flood dams)
III. Area populated or suitable for human living within 500 m
The table below is presented as an example to show, which receptors (potential targets of impact) concern the various sections of the BT line.
6 . 3 P R E L I M I N A R y q U A L I F I C A T I O N O F A P R O C E S S U P S E T
In case of material loss the location of the process upset or emergency must be identified and the sensitivity tests must be carried out for the line section involved in the emergency in accordance with the rate of spilling using the maps (map sections) and/or tables supplied on the basis of the spill rate and the receptors and factors influencing the sensitivity at the location of the spill.
Process upset qualification matrix – Alarm stages
A Sending scout units is justified only.B Sending scout units, starting technical
rescue units from both ends (DR and TR) and starting standby group
C Same as for B plus immediate notification to and involvement of emergency response and other resources (local fire brigade, Water Management Agencies)
/F Immediate notification to, and if necessary involvement of, the competent Water Management Agency
In case the emergency site is on fire then Stage C comes to effect in all cases
Starting End Section No special Area important Surface Area point point length object to from nature water populated or (km+m) (km+m) (m) protect within conservation human living suitable for Settlement County 500m point of view within within within 500m 100 m 500 m
Before the transport pipeline was commissioned 134 railway tankers arranged into 6 target freight trains were transporting the benzene-toluene fraction to Százhalombatta on a continuous basis, representing a potential hazard source for the population living close to the railway line. The product quantities shown in the table for 2007 amount to approx. 10,000 RTCs on an annual level, due to the increased quantities
According to the economic calculations supporting the individual project proposal to the Board the return period of the project is 6 years from the time of commissioning. The economic calculations take into account an annual quantity of approx. 270 thousand tons for transportation via the pipeline.
In the light of the year 2007 transportation details the expected return period of the project will be less, some 4 years.
MOL Scientific Magazine
74
1MOL GROUP
2008/3Development
In conclusion some details to support the sonorous article title
• Theprojectwasimplementedbythescheduled date, from the budgeted costs and at high engineering standards.
• Sincenotransportlineofasimilarnaturehas been constructed in this business area, several engineering and trade novelties have been implemented for the increased safety, such as for example the preventive protection, use of piping with safety factor 2, increased level of strength pressure test, model-compensated hydraulic supervision, special high accuracy leak detection and location finding etc.
The safety improving measures, which are indications of MOL’s commitment, had increased the project costs by approx. HUF 1.5 Billion.
• Duringpipelinetransportationusingdirectcontact between the products the quality protection to the products is provided at a maximum rate; transportation with a minimum product mixing has been implemented for the sulphur-free BT and the C8 fractions and gas oils of approx. 1.500 ppm sulphur.
• Anewtypeofco-operationhasbeen established with the concerned population, authorities, museums and nature conservation agencies in order to comply with the applicable laws and decrees.
• Throughanewinterpretationoftheproject management function a facility supervisory activity was developed, a traceable transparent change management was implemented and the frequent crisis situations were handled.
The transportation experiences from the first year after commissioning have confirmed the expectations; the line is operating in a cost-efficient way ensuring the safety of the environment to maximum degree.
Finished/semi finished Quantities products transported (in thousand tons) BT fraction 210,6 C8 fraction 56,8 Gas oils 143,3 Gasoline ESZ-95 grade 52,5 Total 463,2
quantities transported in year 2007
75
Development2008/3
Abstract
It was proven that blending bitumen with crumb rubber, which is produced from scrap tires, is not just a waste treating method, but an excellent solution to improve the performance of asphalt pavements compared to roads made of conventional bitumen. The application of rubber bitumen is most widely spread in the US, where the production of the rubber modified binder is in situ, close to the road construction. The Cooperative Research Center of the University of Pannonia together with the MOL Group developed a new, patented production method, which is capable of the production of chemically stabilized rubber bitumen (CSRB) in existing, refinery bitumen modifier units (normally production of rubber bitumen would need special equipments). The results gained so far from test runs and road constructions attract the attention to the fact that the appearance of a binder of such quality on the domestic market shows not only economical benefits, but
can contribute to the improvement of the road system. Governmental promotion of the CSRB usage in road construction similarly to the Portugal example would be a favourable way to profit at national level from the recycling of the waste tires and the longer life cycle of the higher quality roads.
Összefoglalás
Kémiailag stabilizált gumibitumenekAz elhasznált gumiabroncsokból elô állított gumiôrlemények bitu me-nekhez való keverése és gumibitumen elôállítása nem csak hulladékkezelési lehetôség, hanem egy olyan útépítési kötôanyag elôállítását is jelenti, amely alkalmazásával a hagyományos bitumeneknél sokkal jobb minôségû aszfaltút építhetô. A gumibitumenek útépítési alkalmazása máig az Egyesült Államokban a legelterjedtebb, és az itteni gyakorlatra az a jellemzô, hogy a gumibitumen elôállítása az útépítés helyszínén történik. A VIKKK keretein belül a MOL és a Pannon Egyetem olyan elôállítási eljárást dolgozott ki, amellyel a kô-olaj-finomítóban a modifikált bitu-menek elôállításához alkalmazott berendezésekkel állítható elô a kémiailag stabilizált gumibitumen (KSGB).Az eddigi kísérleti gyártások ered-mé nyei és útépítési tapasztalatok arra hívják fel a fel a figyelmet, hogy egy ilyen minôségû kötôanyag hazai piacra való bevezetése a gazdasági elônyök mellett hozzájárulhat az úthá-lózat minôségének javításához is. A KSGB hasznosításának kormányzati támogatása az útépítésben, a Portu-gáliában már alkalmazotthoz hasonló módon nemzeti szinten tenné lehetôvé a veszélyes hulladéknak számító gumiabroncsok hasznosítását és
Chemically stabilized rubber bitumens
András Geiger (29)Chemical engineerDS Development, Product Development, SzázhalombattaE-mail: [email protected]
Péter Gergó (28)Chemical engineerUniversity of Pannonia, Faculty of Engineering, Institute of Chemical and Process Engineering, Department of Hydrocarbon and Coal Processing, VeszprémE-mail: [email protected]
Prof. László Bartha (63)Chemical engineer, MSc, PhDUniversity of Pannonia, Faculty of Engineering, Institute of Chemical and Process Engineering, Department of Hydrocarbon and Coal Processing, Veszprém E-mail: [email protected]
MOL Scientific Magazine
76
1MOL GROUP
2008/3Development
az aszfalt utak élettartamának, minôségének jelentôs javulását.
1. Introduction
In industrially advanced countries 9 kg of waste tires are generated yearly counting to a single person [1]. In the United States 2-3 billion metric tons, illegally deposed scrap tires exist, while this number is around 5.5 billion in the European Union [2]. In Hungary 2.7 million cars are running, and yearly 40-50000 tons scrap tires are generated [3].
Producing crumb rubbers and blend with bitumens is an environmentally friendly way of utilization of scrap tires, while the process generates high quality pavements. Mass production of rubber bitumens started in the U.S. in the early 60’s based on the findings of Charles McDonald who started using ground tire rubber to improve the engineering properties of road construction asphalts [4].There are two production methods for crumb rubber modification, mentioned by the literature [5, 6]. During the dry process the rubber crumb are mixed with the aggregates first, then with the hot bitumen, while in the wet process the rubber is reacted with bitumen at elevated temperatures and certain duration to obtain improved engineering properties. The next stage of the developments are the chemically modified/chemically stabilized rubber bitumens and their production method (improved wet process) [7, 8, 9]. These binders are more stable and the crumb rubber acts as an active modification agent in the rubber-bitumen disperse system.
After the first trials it was quickly proven that the production of the rubber bitumens means a lot more than just a utilization method of waste tires. By using rubber bitumen in pavements the quality and durability was enhanced compared to roads built with regular bitumen binders. The following advantages are usually provided regarding the rubber bitumen pavements: longer life, lower life cycle cost, wider utilization temperature range, noise reduction effect and less deformation [4, 10]. By applying the suitable production parameters the rubber bitumen can reach, in some properties even exceed (e.g. cold properties, fatigue) the properties of the expensive synthetic polymer (like SBS) modified bitumen [11].
The application of rubber bitumen is most widely spread in the US, where the production of the rubber modified binder is in situ, close to the road construction. Normally the rubber bitumen binder is needed to be mixed with aggregates within 4 hours because of its high ability for phase separation [12]. The spread of the technology is very rapid in these days, and excellent experiences were reported from Asia and some parts of Europe (mostly in Portugal and Spain). For example, Portugal, in a government order of 2007 recognizing the environmental and quality advantages promoted certification and acceptance of the product [13].
2. Production method chemically stabilized rubber bitumen (CSRB)
The Cooperative Research Center of the University of Veszprem together with the MOL Group developed a new, patented production method [14], which is capable of the production of chemically stabilized rubber bitumens in existing, refinery bitumen modifier units (normally production of rubber bitumen would need special equipments). During the binder blending more intense dissolution of the rubber can be achieved in the bitumen, and by applying antisettling additives the phase separation of the disperse system can be significantly reduced. The high viscosity of the classic rubber bitumens, which causes issues quite often, can be reduced to the level of existing, MOL produced polymer modified binders, by applying suitable technological parameters.
A combined method was used for preparing chemically stabilized rubber bitumens [14]. In the first step, in presence of bis-succinimide type of antisettling additive, chemical degradation at 200-220°C results a partial devulcanisation of the crumb rubber particles. The second step involves a high shear mixing (mechano-chemical dispergation) with the use of colloid mill. It occurs at the temperature of rubber vulcanization at approximately between 160-180°C. The polar antisettling additive and these technological parameters ensures the dispergation of the undissolved rubber particles and components, inorganic filling materials of the rubber, and help to originate an elastic network resulting a stable polymer matrix. The production can be followed by measuring the viscosity.
77
Development2008/3
3. The effect of crumb rubber composition
Beside the technological parameters and the application of antisettling additive during the production of CSRB a great importance is attributed to the quality of used crumb rubber. According to our laboratorial experiments a big difference in the quality of rubber bitumens produced in the same conditions can be noticed even if the size distribution of crumb rubbers are the same. The difference in quality could be mainly noticed in their storage stability. In certain cases the difference in softening point measured by MSZ EN 13399 exceeded 10oC in other cases, however, only 2-3oC difference in softening point could be measured. As a result crumb rubbers were investigated in detail and correlation was searched between their chemical composition and storage stability of CSRB.
The rubber analytical examinations were completed according to ASTM-D297-93 standard. Adherent water content, ash content, acetone and chloroform extract, polyisoprene content, total rubber polymer content and carbon black content were determined. During the experiments a wide range of waste rubber was applied. The effect of crumb rubber particles’ size could be eliminated by using of crumb rubbers with nearly the same size distribution. According to the test results the higher polyisoprene content and the smaller acetone extract and ash component were in the crumb rubber, the smaller settling tendency was measured (Figure 1.).
Crumb rubbers T1-T9 were made from different technical rubber waste materials and their composition changed in a wide
interval that is why these crumb rubbers can not be recommended for CSRB production (Figure 1.). CSRBs produced by using crumb rubbers deriving from Pécs have only a slight separation. Only truck and passenger car waste tires are ground in this plant. The change of the composition of these crumb rubbers was small based on the results. Crumb rubbers made in Croatia (Cr1-Cr2) proved to be acceptable for production of CSRB as well. Other two samples, derived from Austria (Au) and Slovakia (Sl) each, were examined. These were made from used tires as well and only a slight settling tendency in CSRBs was noticeable. Regarding the storage stability, crumb rubbers made from tires of Michelin (Mi) and Taurus (Ta) in Kazincbarcika, were very advantageous, as well. It can be stated that if the ratio of Polyisoprene / (Aceton extract + Ash content) is appropriate, then CSRB can be produced which tends only less to phase separation.
According to the properties of CSRBs which were produced from debris rubber with different chemical compositions – especially storage stability and the Hungarian crumb rubber market–, crumb rubber deriving from Pécs was found the most applicable for CSRB production by test run.
4. Test run for production of CSRB and road construction
In October 2007 using crumb rubber derived from Pecs 20 tons of CSRB was produced by Zala Refinery during a successful test run. The production time was about 12 hours the occurring chemical reactions were followed by measuring viscosity of samples taken by certain times. Table 1. shows the properties of the produced CSRB and the quality of requirements of CSRB gained Building Industrial Technical License (ÉME) this year.
The properties of CSRB produced during test run fulfilled the requirements of Technical Transportation Terms of CSRB. Regarding certain properties (e.g. Fraass Breaking Point) much better results were measured than the required value. The Technical Transportation Terms do not contain requirement for storage stability of CSRB (Table 1.), however, during the examination based on MSZ EN 13399 3°C difference in softening point could be measured. It is lower than the allowed maximum 5°C defined in case of modified bitumens of ÚT 2-3.502.
Figure 1. Correlation between composition of crumb rubbers and storage stability of CSRBs.
MOL Scientific Magazine
78
1MOL GROUP
2008/3Development
Performance grade examinations were also carried out based on Strategic Highway Research Program (SHRP) requirements and compared with road building bitumen 50/70 and modified bitumen 25/55-65. Considering Hungarian climatic conditions the examinations were completed according to Performance Grade (PG) 58-22. As the results in Table 2. show all the three binder materials fulfilled the requirements. Observing their high temperature behaviour they prove to be better than the requirements. The performance of road building bitumen 50/70 with one the CSRB with three and modified bitumen 25/55-65 with four grades was better than the requirement. Observing the low temperature behaviour CSRB had the best result. It was better
with one grade than expected according to Hungarian climatic conditions. The statement that one of the greatest advantages of rubber bitumens is their favourable low temperature behaviour is supported by our results [4, 11].
It is important to emphasize that after Rolling Thin Film Oven Test (RTFOT) and Pressure Aging Vessel (PAV) test the lowest G*·sinδ value was measured in the case of CSRB and also the lowest temperature (14°C) at which this value was not higher than 5000kPa (Table 2.). (RTFO Test was carried out according to MSZ EN 12607-1, PAV test according to MSZ EN 14769.) It proves that the fatigue behaviour of asphalt made with the use of CSRB is the best among the three samples.
Properties Method CSRB Endproduct requirements oftestrun Penetration at 25°C 0.1mm MSZ EN 1426 40 -100 77 Softening point, °C MSZ EN 1427 min. 52 55 Fraass Breaking Point, °C MSZ EN 12593 max. -14 <-20 Dynamic viscosity at135 °C, mPa·s MSZ EN 13702-2 min. 500 2980 Dynamic viscosity at 180 °C, mPa·s MSZ EN 13702-2 TBR* 405 Flash point, °C MSZ EN 22592 min. 230 297 Solubility, m/m% MSZ EN 12592 TBR* 93,3 Elastic recovery at 25 °C, % MSZ EN 13398 min. 40 53 Resistance to hardening (RTFO Test) MSZ EN 12607-1 - Change of mass, m/m% max. 0.5 -0.04 - Retained penetration, m/m% MSZ EN 1426 min. 50 65 - Softening point after RTFOT, °C MSZ EN 1427 min. 55 61 - Increase in Softening point, °C MSZ EN 1427 max. 9 6*To Be Reported
Table 1. The requirements of CSRB and the properties of test run end product.
CSRB 50/70 25/55-65 Original Sample G*/sinδ at 58°C, kPa (min. 1.0) 6.49 2.6 15.8 Temperature limit, where G*/sinδ = 1.0 kPa, °C 77.7 64.1 85.9 After RTFOT G*/sinδ at 58°C, kPa (min. 2.2) 11.66 5.6 29.5 Temperature limit, where G*/sinδ = 2.2 kPa, °C 76.0 65.3 82.2 After RTFOT + PAV G*·sinδ at 22°C, kPa (max. 5000) 1726 4725 4110 Temperature limit, where G*·sinδ = 5000 kPa, °C 14.0 20.8 19.2 Stiffness at -12 °C, MPa (max. 300) 68 163 122 m-value at -12 °C, (min 0.3) 0.346 0.331 0.329 Stiffness at -18 °C, MPa (max. 300) 116 - - m-value at -18 °C, (min 0.3) 0.332 - - Performance Grade (PG) PG 76-28 PG 64-22 PG 82-22
Table 2. Comparison of the SHRP results of the three binders.
79
Development2008/3
Using the 20 tons of CSRB deriving from the test run new wearing course was constructed by Betonút on one section of Budapesti (Figure 2.) and one of Endrôdi street in Veszprém. No engineering problems were noticed during asphalt mixing, transportation, spreading, compaction and rolling. It was also highlighted by the road constructors that despite the low ambient temperature (6-8°C) the asphalt mixture was easy to handle.
This year comprehensive asphalt test are being carried out by Budapest University of Technology and Economics producing and using three types of asphalt mixtures (AB-11/F,
ZMA-11, K-22/F) produced with the use of CSRB. During the examinations they are being compared with asphalt mixtures produced with road building bitumen 50/70 and modified bitumen 25/55-65. The evaluations of AB-11/F asphalt mixture examinations have been partially completed (Table 3.). According to results gained so far it can be stated that water sensitivity of asphalt test specimen produced with the use of CSRB is better than with 50/70 and is slightly poorer than that of produced with the use of modified bitumen 25/55-65. The rutting resistance is the same but the cracking temperature of the asphalt specimen produced with the use of CSRB is lower that is more advantageous.
5. Summary
As a result of last years’ laboratorial experiments a process has been elaborated by which CSRB can be produced by using the bitumen plant equipments. The technological parameters and the chemical composition of available crumb rubbers were determined. CSRB made in Zala Refinery in October 2007 was used successfully during asphalt mixing and road construction. The measured results of CSRB according to the performance behaviour test were very advantageous. According to the asphalt test results carried out so far CSRB performed much better than bitumen 50/70. One of the most significant deterioration progress of asphalt roads is the
Figure 2. Road construction in Veszprém in October 2007 with the use of CSRB
Type of Binder CSRB 50/70 25/55-65 Type of Asphalt mixture AB-11/F AB-11/F mAB-11/F Determination of Marshall stability and flow according to MSZ EN 12697-34 Marshall-stability, kN 13.0 12.5 Marshall-flow, kN 3.7 4.7 Marshall-stiffness, kN/mm 3.5 2.7 Determination of water sensitivity according to MSZ EN 12697-12 Tensile strength of wet test specimen / Tensile strength of dry test specimen *100%
85 82 95
Determination of rutting resistance according to UT 2-3.301 M3.2. Thickness of test specimen, mm 41 41 41 Relative deformation, % 1.0 2.6 1.0 Determination of Asphalt cracking temperature according to NA RT. MF 3/2004 Cracking temperature, °C -31.0 -24.8 Tensile strength at Cracking temperature, N/mm2 5.12 5.08
Table 3. Comparison of three asphalt mixtures produced with the use of three different binders.
MOL Scientific Magazine
80
1MOL GROUP
2008/3Development
low temperature cracking. Regarding the low temperature deterioration CSRB performed better than 25/55-65 modified bitumen. These results attract the attention to the fact that the appearance of a binder of such quality on the domestic market shows not only economical benefits, but can contribute to the improvement of the road system. Governmental promotion of the CSRB usage in road construction similarly to the Portugal example would be a favourable way to profit at national level from the recycling of the waste tires and the longer life cycle of the higher quality roads.
[3] Sinka, G.: A gumi és a környezetvédelmi szabályozás. Gondolatok és kérdések 2005 júliusában, Mûanyag és gumi, 42 (7), 2005.
[4] Zareh, A., Way, G.B.: 35 years of Asphalt-Rubber Use in Arisona, Proceedings Asphalt Rubber 2006 Conference, Palm Springs, California, 2006.
[5] Anon, A.: Design procedures and construction practices, U.S. Department of Transportation, Federal Highway Administration, FHWA-SA-92-22, 1993.
[6] Pinheiro, J., Soares J.: The effect of crumb rubber and binder-rubber interaction time on the mechanical properties of asphalt-rubber mixtures (Dry process), Asphaltrubber proceedings 2003, ISBN 85-903997-1-0, 707-718, 2003.
[7] US 5762700, Memon, M., Ghulam, M.: Catalytic process for producing free radicals on crumb rubber, 1997.
[9] Geiger, A., Bíró, Sz., Gergó, P.: Hulladék gumiabroncsok hasznosítása, gumibitumenek elôállítása, Magyar Kémikusok Lapja, 63. évfolyam 7-8. szám, 2008.
[10] Malpass, G.A., Khosla, N.P.: Use of Ground Tire Rubber in Asphalt Concrete Pavements - A Design and Performance Evaluation, Transportation Research Record, ISSN: 0361-1981, 1515, 1995.
[11] Martínez, G., Caicedo, B., González, D., Celis, L.: Performance of a test truck using crumb rubber asphalt and other modifiers, Proceedings Asphalt Rubber 2006 Conference, Palm Springs, California, 2006.
[12] Shatnawi, S: Asphalt rubber maintenance treatments in California, Proceedings of the Asphalt Rubber 2003 Conference, December 2003, Brasilia, Brazil. ISBN: 85-903997-1-0, 38-39
[13] Portugee Governement Order: Ministries of the Environment, Planning and Regional Development and of Public Works, Transportation and Communitations, Number 4015/2007, January 30, 2007.
[14] WO/2007/068990, Bíró, Sz., Bartha, L., Deák, Gy., Geiger, A.: Chemically stabilized asphalt rubber compositions and a mechanochemical method for preparing the same, 2007.
Revised by: Dr. László Szirmai
81
Abstract
In this paper the necessity and importance of recycling of used motor oils are reviewed. The reusable and non-reusable used motor- and other lubricant oils are displayed. The composition and main analytical and performance properties of used engine oils are detailed.
Összefoglalás
A közleményben összefoglalják a hasz-nált kenôolajok újra hasz no sításának szükségességét és je lentôségét. Is-mertetik a használt kenôolajok fi zi-kai és alkalmazástechnikai tu laj don-ságait, összetételüket és szennyezô komponenseit. Részletezik az Európai Unióban újrahasznosításra kerülô ke nôolajok mennyiségét, illetôleg a legfontosabb újrahasznosító ka-pacitások.
In spite of the increasing the oil drain interval of engine oils produced from growingly modern additives belonging to Group II-IV according to API base oil group (high i-paraffin content, decreased sulphur-, nitrogen- and aromatic content) and from newly developed additive packages (decreased sulphur, iron-, phosphorus-, and halogen content), the quantity of consumed motor oils and other lubricating oils show increasing tendency in the world. The first reason is the intensifying motorization of developing countries (e.g. Eastern Europe, China, India, etc.). Due to this the recycling of used engine oils and other lubricating oils in various forms gets growing attention. Accordingly, in the first paper of our present article series we summarize the necessity and importance of the above mentioned as well as the properties of used engine oils. In the next part of the article series we detail in detail the possibilities for recycling the used motor oils and the methods of their industrial realization.
1. Introduction
Nowadays, due to the highly increasing volume (Fig 1 and 2, [1]) of transportation (roadway, railway, air and water), the number of roadway vehicles and other transport vehicles increased significantly and the volume of growth is going to still intensify in the future. (Fig 3, [2]). Between 1970 and 2010 passenger transportation as per passenger kilometer will triple, furthermore, the growth of freight transport volume will be even more than that. Naturally, this tendency is also true for the whole world, but in less motorized regions, in so called developing countries, the growth is even more intensified.
In parallel, the consumed quantity of engine fuels and other engine fluids (cooling liquids, brake oils, gearbox oils, etc.) began to increase strongly as well. According to preliminary estimations, lubricating oil consumption of the world will increase with ca. 2.6 million tons between 2005 and 2010 (Fig 4, [3-6]). The
Jenô Baladincz (48)Chemical engineerMOL-LUB Ltd.Production Director Email: [email protected]
László Szabó (44)Mechanical engineer, sales area manager MOL-LUB Ltd.Production ManagerEmail: [email protected]
Gábor Nagy (30)Chemical engineerUniversity of PannoniaInstitute of chemical and Process EngineeringDepartment of Hydrocarbon and Coal ProcessingEmail: [email protected]
Dr. Jenô Hancsók (61)Chemical engineer, EUR ING, Dr. Techn, PhD, habil.expert of technical, accreditation and intellectual propertyUniversity of PannoniaInstitute of Chemical and Process EngineeringDepartment of Hydrocarbon and Coal ProcessingEmail: [email protected]
Possibilities for processing forused lubricating oils – Part 1.
Development2008/3
MOL Scientific Magazine
82
1MOL GROUP
2008/3Development
main reason for the relatively small growth estimated in North-American region and the small decrease predicted for Western-Europe was the decrease of lubricating oil consumption per capita (from ca. 7.3 kg/person to 5.6 kg/person) [7]. The reason is that one of the main objective of researches and developments in the past decade has been to develop and manufacture such engine oils and motor vehicle
engines in which the replacement period of motor oils increased significantly. Similar to many other industries, Asia develops most dynamically also regarding lubricants and due to the high growth ratio of motorization, this development pace will even grow more in the near future. Meanwhile in 2005, regarding the total lubricant consumption, the share of Asia and Oceania was 31.5%, however based on the prognoses it may increase even to 34.2% by 2010.
By these days such motor vehicle engines and engine oils have been developed, that with their combined application the replacement period of engine oils can be increased and the emission of harmful materials might be decreased significantly (Fig 5). In parallel with the previous, the demand increased for environmental friendly, biodegradabla lubricant oils with small heteroatom and aromatic content that can be used in modern engines as well. These modern lubricating oils can be manufactured from modern base oils and additives which will ensure the high performance level [8,9].
Each country ratificating Kyoto Protocol undertook the significant decrease of their emission of harmful materials as well as other environmental actions, among them the higher rate of collection and recycling of used engine oils and other lubricants (industrial oils). As comparison it was found out that the energy content of 1 litre used engine oil is ca. 8000 kJ, which corresponds to one day energy consumption of a 100 W light bulb or 2 hours energy consumption of a 1000 W electric heating unit [8]. Approx. 50 litre crude oil is required to produce 1 litre engine oil, however 1 litre engine oil can be produced from 1.6 litre used engine oil. These facts suggest that the collection and recycling of used engine oils to either lubricants or energetic products
Figure 1. Change in passenger transport in the European Union
Figure 2. Change in freight transport in the European Union (tons kilometer)
Figure 3. Change in the stock of road vehicles in the world (OECD: Organization for Economic Co-operation and Development)
Figure 4. Lubricant consumption change in the world
Figure 5. Change in the replacement period of motor oils due to developments
83
Development2008/3
promotes the saving of fossil energy carriers and the provision of sustainable development, and thus the creation of a liveable environment. The environmental problem caused by the high quantity of used lubricating oil is currently attempted to be resolved simultaneously from multiple sides. On one hand it is an important criteria to ensure the biodegradability of modern engine oils and other industrial oils, on the other hand the already mentioned increase of the oil replacement period also constitutes one of the
main objectives of research and development activity [10,11]. Apart from these, in the previous decade several modern processes were also developed for the effective recycling of used engine oils and other industrial oils.
The 2004/17/CE and 2004/18/CE directives as well as the 75/442/EEC directives released in 2005 by the European Union focused on the regional collection and recycling of used engine oil in higher amount [9]. In 2005 approx. 37% of the total consumed
Country Consumed oil, tons Collectable oil * Collected oil tons % tons %** %*** Austria 109000 53622 49 33500 62 31 Belgium 173100 63105 36 60000 95 35 Denmark 71718 46909 65 35000 75 49 Finland 88809 49595 56 39677 80 45 France 841356 422197 50 242500 57 29 Germany 1032361 463304 45 460000 99 45 Greece 87800 40161 46 22000 55 25 Ireland 38900 17194 46 15303 86 39 Italy 617594 196737 32 189595 96 31 Luxemburg 10170 4652 46 4564 98 45 The Netherlands 152694 66468 44 60000 90 39 Portugal 102000 52842 52 39620 75 39 Spain 510980 255236 50 160000 63 31 Sweden 142814 77232 54 61786 80 43 United Kingdom 840834 401474 48 352500 88 42 Total 4820130 2211329 46 1776044 80 37* Under collectable oil that oil quantity shall be understood, which is accessible after consumption, the
non-collectable oils e.g. are the so-called process oils ** in percent of the collectable oil *** in percent of the used oil
Table 1. quantity of used and collected lubricants in each countries of the European Union (2005)
Denomination Recollection %Motor oils for motor vehicles equipped with Diesel or Otto engines 70
Diesel motor oils for freight vehicles 60Motor oils for two stroke engines 0Other motor oils 10Automatic transmission fluids, ATF 90Motor oils for transit engines 80Industrial engine oils 70Hydraulic oils 70Heat treating oils 60Cutting oils 20Metal working emulsion 20Corrosion protection products 0Turbine oils 90Insulation oils 90Compressor oils 40General machine oils 20Other, non-lubricative industrial oils 0Processing oils 0
Table 2. Recollection rate of used oils in Hungary
MOL Scientific Magazine
84
1MOL GROUP
2008/3Development
lubricating oil was collected in the European Union (Table 1, [9,15]), which meant approx. 80% of the collectable oils. In Hungary, an expertise estimation prepared in 2008 considering the types of consumed lubricants and the condition of machines and motor vehicles (Table 2) showed that approximately 60% of the total amount of lubricants can be recollected, thus the recollection ratio in Hungary is 40%. In Europe Germany and Italy possess the highest capacity plants capable for processing used oils (Table 3, [9,15]).
2. Properties of used engine oil Processing of used engine oils is affected by the composition and other properties of them, which highly depend also on the interaction between engine oils and engine fuels [13]. We have already detailed these interactions in a previous article series entitled “Mobility and environment” [16,17], therefore we omit to detail them in our present article.
Used engine oils contain contaminating materials due to wearing and combustion, and their chemical composition also differs from new oils’ due to oxidation and other chemical reactions. Most important contaminating materials in used engine oils are:
• Combustionproducts:- Water: in case of a perfect process, engine fuel combusts into carbon monoxide and water. In normal operating conditions the steam vents through the exhaust system, though after cold-start a part of the arising water may get also into engine oil that aids forming sludge at the bottom of oil sump.
- Carbon black: in case of mainly Diesel-engines due to combustion, carbon black also forms, a part of which gets into engine oil.
- Engine fuel: a part of the non-combusted en gine fuel accumulates also in engine oil.
• Contaminationsoriginatingfromwearing:- Metals: majority of metal particles coming from the cylinder wall and from the piston get into the engine oil. Such particles are e.g.: iron (400-800 mg/kg), chromium (30-50 mg/kg), copper (2-5 mg/kg), magnesium (150-400 mg/kg), nickel (2-7 mg/kg), calcium (600-2000 mg/kg), aluminium (300-800 mg/kg), arsenic (0-5 mg/kg) etc. Other part of the metals originated from additives that are originally in engine oil (e.g.: zinc-dialkyl-dithio-phosphates) (Table 4, [14]). Such particle is e.g. zinc.
- Dust: Dust and other solid contaminating materials (mainly silicates) get into engine oil through air filter and promotes sludge formation.
• Oxidationproducts:lubricantscontainalso such molecules that oxidize due to heat load exercised in normal operating conditions within engine space, they form complexes with metals and compose organic acids.
• Halogenisedhydrocarbons:totalhalogenic content of used engine oils is between 500-1000 mg/kg in general.
Due to the contaminating materials present in relatively high amount, certain analytical and application properties of used engine oils change as well. Its extent is also affected by the composition of engine fuel (eg.: in case of diesel gas oils their vegetable oil fatty acid methyl ester content). Viscosity of used engine oils, for example, significantly decreases with the increase of engine fuel concentration (Fig 6, [12]).
Flash point significantly decreases by increasing the concentration of engine fuel especially in case of engine oils of gasoline-driven engines. Flash point point of engine oils of
Country Company Capacity, tpaBelgium Mootay & Pisart Co WOS Hautrage 3200
Table 3. The greatest used oil processing plants of the European Union
85
Diesel-engines decreases in smaller extent by increasing the concentration of diesel gas oil, and the extent of decrease is also affected by the FAME content of diesel gas oil [12].
Properties of used lubricants may differ significantly, which may complicate or hinder
their recyclability. We summarized in Table 5 the lubricants which are recyclable in high amount and those which are regeneratable in themselves in small amount due to their special properties [15]. Form separating oils, brake oils and special oils (containing polychlorinated biphenyls which are carcinogenic) or synthetic oils are not recommended to blend and recycle together with other oils in high amount due to their properties.
Conclusion
Based on the knowledge presented in this paper of the article series we stated that the processing of used engine oils is very important as well as their repeated processing from the viewpoint of both environmental protection and crude oil saving. The problem of the treatment of used engine oils is intended to be solved from multiple sides. On one hand
such developments have been carried out in recent years in case of mainly freight motor vehicles, by the aid of mainly motor vehicles, which helped to increase the oil drain interval of engine oils significantly. On the other hand modern engine oils produced from biodegradable raw materials are also used in more and more quantities. Beyond the previous, in recent decades the recycling of used engine oils also gained greater ground as it is now already controlled by directives of the European Union as well. Possibilities of used oil reprocessing and their industrial realization methods will be detailed in the next part of the article series.
Development2008/3
Effect Additive Antiwear agents zinc-dialkyl-dithio-phosphates, metal containing dialkyl- hydrogen-phosphites, triaryl-phosphites and phosphate, dithiocarbamates “Extreme pressure” (EP) additives Metal containing alkyl- or aryl-sulphides, -disulphides, sulphur-treated olefins, vegetable oils and their esters, phosphites, phosphates and thiophosphates, chlorinated hydrocarbons; molybdenum-disulphide containing suspensions Detergents, dispergents Calcium and magnesium phenolates, -phosphonates, -sulphonates and salicylates Corrosion inhibitors zinc-dialkyl-dithio-phosphates; iron containing alkyl- imidazolins, alkyl-benzene-triasols, etoxylated phenols;Table 4. Metal containing motor oil additives
Figure 6. Change of kinematic viscosity of used motor oils (40°C) in function of their engine fuel content (Diesel motor oil, 5% FAME: diesel gas oil with 5% FAME content, FAME: fatty acid methyl ester)
Recyclable oils Oil regeneratable in themselves, or recommended for energy production
High VI oils Oils containing Engine oils of gasoline polychlorinated biphenyls and diesel engines (PCB) Gearbox oils Oils containing halogenids Non-synthetic Synthetic oils hydraulic oils Brake oils Other gear oils Fatty oils Transformer oils Oils containing Bearing oils asphaltenes Compressor oils Metal working oils Turbine oils containing fatty acids Machine oils Form oils quench oils Cylinder oils Heat transmission oils VI – viscosity index
Table 5. Recyclable oils and oils recommended only for energy production
MOL Scientific Magazine
86
1MOL GROUP
2008/3Development
References
[1] Lepsényi, I.: „Strukturális változások a nemzetközi és a hazai jármûgyártásban”, Gépipar, 2005, 36(11-12), 1-5.
[11] Baladincz, J., Nemesnyik, Á., Nagy, G., Hancsók, J.: „Környezetbarát motorolajok III. Szintetikus alapolajok”, Magyar Kémikusok Lapja, 2007. 62(2), 53-58.
[12] Heine, C., Fischer, T.: “Development of a Simple, Cost Efficient and Reliable Method for the Determination of the Fuel Content in Used Engine Oils”, Automotive and Industrial Lubrication, Proceedings of the 15th International Colloquium, Esslingen, Germany, 2006. jan. 17-19.
[13] Hancsók, J., Auer, J., Baladincz, J., Kocsis, Z., Bartha, L., Bubálik, M., Molnár, I.: “Interactions between Modern Engine Oils and Reformulated Fuels”, Petroleum and Coal, 2005, 47(2), 55-64.
[14] Auer, J., Borsi, Z., Hancsók, J., Lakics, L-né, Lenti, M., Nemesnyik, Á.: „Tribológia 2 Kenôanyagok és vizsgálataik”, Budapest, Tribotechnik Kft., 2003.
[16] Hancsók Jenô, Bartha László, Baladincz Jenô, Kocsis Zoltán: „Motorbenzinek és motorolajok kölcsönhatásai”, Magyar Kémikusok Lapja, 2007, 62(7), 230-234.
[17] Hancsók Jenô, Bubálik Márk, Bartha László, Baladincz Jenô, Kocsis Zoltán: „Dízelgázolajok és motorolajok köl csön-hatásai, azok következményei”, Magyar Kémikusok Lapja, 2007, 62(8-9), 281-286.
[18] “Technical guidelines on used oil re-refining or other re-use of previously used oil”, 3rd Meeting of the Conference of the Parties to the Basel Convention, Geneve, Switzerland, 1995. Sept.
Revised by: László Galambos
87
Abstract
In 2006 and 2007 geologists from MOL Plc. conducted field trips in the central Oman Mountains in order to describe and evaluate the potential hydrocarbon systems; to reveal source-, reservoir- and seal rocks and to outline possible hydrocarbon bearing structures. Bedding, cleavage, fold and fault data were recorded during the field work. Numerous samples were collected for the organic geochemical, rock mechanical and thermochronological measurements. During the fieldwork we observed several occurrences of small gypsum diapirs in the Wadi Dil and Wadi Hawasina area; these evaporite bodies rise from beneath the Hawasina Nappes. Structural
analysis of the wider area suggests that they belong to the Palaeozoic (Infra Cambrian or Permian) of the underlying Arabian Platform or to the Late Cretaceous sequences. In all the three cases the occurrence of the evaporites has a crucial role in the hydrocarbon systems of the area and points to the existence of the Autochtonous sequence beneath the oceanic nappes. This shows the possibility to explore the classical petroleum systems of the Arabian Peninsula below the Oman Mountains.
Összefoglalás
Az ománi Hawasina-ablak területén található evaporit elôfordulások jelentôségeA 2006-2007 években a MOL Plc. geológusai terepmunkát végeztek az Ománi-hegységben található Hawasina tektonikus ablak területén. A munka célja a terület szénhidrogén rendszereinek megismerése, a le-hetséges anyakôzetek, tározó-, és zárókôzetek feltérképezése és mintagyûjtés ezekbôl további la-boratóriumi vizsgálatok céljára. A munka során tektonikai adatokat, rétegzési, palássági, redôzôdési és törési irányokat is felmértünk, melyek a lehetséges tároló szerkezetek lo-ka lizálását segítik elô. Számos minta került begyûjtésre szerves geokémiai, kôzetmechanikai és termokronológiai vizsgálatokra. A térképezés során több kisméretû gipsztestet fedeztünk fel a Wadi Dil és a Wadi Hawasina területén. Ezek elhelyezkedése, rétegsorban elfoglalt helye és a környezô triász korú radiolarit rétegekkel való érint-kezés módja arra utal, hogy ezek a gipsztestek diapírszerûen, a mé-lyebb rétegekbôl préselôdtek a fel-
Ágoston Sasvári, (29)Geologist MsC,Middle East, Africa and Caspian Exploration and ProductionE-mail: [email protected]
Tamás Pocsai, (28)Geologist MsC,Middle East, Africa and Caspian Exploration and ProductionE-mail: [email protected]
László Csontos, (51)MSc Geology; PhD GeologyMiddle East, Africa and Caspian Exploration and ProductionE-mail: [email protected]
Gizella B. Árgyelán (45)GeologistMiddle East, Africa and Caspian Exploration and ProductionE-mail: [email protected]
Workshop2008/3
Significance of the evaporite occurrences in the Hawasina Window, Oman Mountains
MOL Scientific Magazine
88
1MOL GROUP
2008/3Workshop
színre. Több lehetséges forrást is megjelölhetünk, ahonnan ezek az evaporitok származhatnak. Az Arab-tábla autochton rétegsorában két jelentôs evaporit horizont is ismert, az elsô a késô prekambriumi korú Ara Formációban, míg a második a perm korú rétegekben. További lehetôségként felmerülhet az evaporit késô kréta keletkezése is, ebben az esetben az autochton rétegsorának tetején helyetfoglaló gipsz kiváló csúszófelületet képezhetett a takaróképzôdés során. Bármelyiket is feltételezzük a fenti három esetbôl, az evaporitok elôfordulása kulcsszerepet tölt be a terület szénhidrogén rendszereiben, és egyúttal bizonyítja az autochton rétegsor jelenlétét a Hawasina ablak alá tolt helyzetben.
Introduction
The Oman Mountains lies on the north-eastern corner of the Arabian Peninsula. It is classically regarded as a type example of an ophiolite overthrusted passive continental margin of the Tethys Ocean. Glennie et al. (1973, 1974)
produced the first comprehensive stratigraphy of the whole mountain range. They described the main tectonic and stratigraphic units of the area. Due to their work the Oman Mts. contains (from top to bottom) obducted ophiolites (Semail Nappe) and sheared-off oceanic sediments (Umar, Hamrat Duru and Sumeini nappes) above the Arabian platform (Fig. 1 and 2). The underthrust Arabian Platform is exposed in two major antiformal windows; these are the so called Saih Hattat and Jebel Akhdar windows. A third window, i.e. the Hawasina Window exposes the oceanic nappes.
The well known hydrocarbon systems of the Arabian Platform are abundant and effective in the Oman region. From this rise the question of the existence and effectiveness of these hydrocarbon systems in the underthrust segments of the Arabian Platform below the Oman Mountains. The Hawasina Window is a positive, antiformal structure, covered by the well sealing oceanic sediments of the Hamrat Duru Group; therefore it is the best feature to evaluate this concept. Fieldwork was conducted to reveal the potential hydrocarbon systems of the area and to describe the deformation style and potential hydrocarbon bearing structures below the Hawasina Window. During the fieldwork we found several differences between our observations and the previously published geological maps (Villey et al. 1986). One of the most important result was the existence of small evaporite (mainly gypsum) diapirs in the middle of the Hawasina Window around the Wadi Dil and Wadi Hawasina. These evaporites has a key role in the understanding of the general build up of the Hawasina Window and points to the possibility of the existence of the Arabian Platform sequence beneath the oceanic cover nappes.
The general build-up of the Hawasina region
In the Hawasina Window (Fig. 1) three ma-jor units, three nappes can be classically differentiated: Sumeini, Hamrat Duru and Umar units (see Fig. 2A). These are composed of oceanic volcanites and sediments (first Lees 1928, then e. g. Allemann & Peters 1972, Glennie et al. 1973, 1974, Béchennec 1988, Béchennec et al. 1988, 1990). The Sumeini Unit – the lowermost identified nappe unit – is composed of the mainly calcareous and shaly slope-sediments of the Arabian Plate (Glennie et al. 1974, Graham 1980a, b, Béchennec
Figure 1. Location of the Hawasina Window area in the Oman Mountains, Arabian Peninsula. The main tectonic units are indicated by different colours. The Hawasina Window is a tectonic window, where the older oceanic nappes of the Hamrat Duru series outcrop-ping from below the younger Semail Ophiolite.
89
Workshop2008/3
1988, Béchennec et al. 1988, 1990). The sediments of the Hamrat Duru Unit are deposited in a starved oceanic basin; this was the subbasin of the Neo-Tethys Ocean (e. g. Glennie et al. 1974, Graham 1980a, b). The lithology of the Hamrat Duru sediments is very variable: even in the same litostratigraphic unit we can separate fine and coarse calcareous, cherty, shaly and sandy members (Fig. 2B). The Umar Unit – tectonically on top of the Hamrat Duru formations – is the most heterogenous unit; following several paleofacies-reconstruction works (Béchennec 1988) these deposits are derived from and around within-oceanic volcanic islands with atoll-like reefs of several ages (Permian and Triassic). The uppermost tectonic cover, the Semail Ophiolite is the obducted oceanic lithosphere of the Neo-Tethys Ocean (e. g. Glennie et al. 1974 and Searle et al. 1980).
Stratigraphic and tectonic position of the evaporites
Evaporite bodies were mapped in two different stratigraphic and tectonic positions. 1) Right below the Hamrat Duru Nappes in the Hawasina Window and 2) beneath heavily folded Sumeini exposures in the qumayrah half-window.
1) In the middle part of the Hawasina Window a greyish, soft rock surrounded by its pinkish, purple, ocker alteration zone is exposed.
Strong sulphurous smell and many gypsum veins and smaller gypsum and sulphur crystals indicate that the grey and soft rock is in fact microcrystalline gypsum. The region is gently uplifted with respect to its neighbourhood; the pinkish oxidized gypsum is topped by radiolarite and shale.
The contact cannot be sedimentary for two reasons: first, oceanic sediments are very rarely underlain by evaporates, and secondly, clearly discordant contacts are recognised. These are always in the form of broken, upwards dragged
layers of Triassic radiolarite (Fig. 3C and D). Gypsum body is always broader downwards and is found in the core of regional folds (Fig. 3A). The contact can be qualified as “intrusive”; i.e. gypsum protrudes from below and uplifts the radiolarite above. The internal structure of the gypsum intrusions is marked by xenoliths embedded in soft gypsum and by centimeter thick gypsum veins. The xenoliths-clasts are often aligned and arranged into parallel sets. These are marked by an incipient subvertical cleavage and by the long axis of the non-gypsum clasts. From a fortunate exposure in the junction of wadi Hawasina it is clear that the cleavage and alignment of the xenoliths marks flow paths (Fig. 3B). In all the gypsum comes from below the Al Jil Formation and intrudes them, flows upwards. It forms fingers in the order of 100 m diameter. The gypsum fingers should be provisioned from a greater evaporite stock at depth. This should also contain halite and cover salts, because several gypsum finger samples tasted halite/silvine.
The stratigraphic position of the evaporite fingers was controlled by collection of clasts from the gypsum ash. In several exposures smaller and bigger diameter clasts or fragments of layers were found within the soft matrix. The composition of the clasts ranges from purple polymict sandstone to red shale, white quartzite, conglomerate,
Figure 2. A) Main tectonic units of the Oman Mountains; B) Schematic stratigraphy of the Hamrat Duru Units (figure is not to scale).
A
B
MOL Scientific Magazine
90
1MOL GROUP
2008/3Workshop
grey limestone, black-white banded chert and black, oolithic limestone. These latter were partly coupled with black, sulphur-rich clay. Black clay with sulphur was also found as individual blocks. Frequently rounded individual pebbles were also discovered. One of these was composed of coarse grain granite.
2) Another evaporite occurrence was visited at the qumayrah half-window. There the stratiform-like evaporite is stratigraphically above the qumayrah (Sumeini) marl and potentially below Hamrat Duru units. It is important to know, that because of complex double folding, it is also geometrically beneath the Sumeini. Gypsum forms 20-50 cm thin layers with interlayered variegated sandstone, shale and black, thinly layered laminated limestone. No fossils were found so far. The structural position of this evaporite is quite strange. On one hand, it lies geometrically in lower position, in the core of a sheared syn-cleavage fold, overturned to the west. A smaller thrust affects the overturned limb and puts the normal limb with a row of stratiform gypsum exposures on top of the overturned limb. However, this fold occurs on the fully
overturned limb of an earlier tight/isoclinal fold of the Sumeini succession, so the youngest formation is in direct contact with the evaporite. This raises the possibility of the evaporite being Late Cretaceous in age. This might be possible, although not supported by any neighbouring occurrence. The eventual Late Cretaceous evaporite deposition might be due to the emersion ahead of the advancing nappes.
Problem of origin and timing
A quick interpretation of the collected clasts suggests an old, Cambrian – Late Precambrian or alternatively Early Permian age for the evaporite succession, because these are the two age intervals, when large amounts of evaporites were deposited in the near surroundings. Miocene evaporites were ruled out because of the geometric reasons. No identified Mesozoic rock of the Autochtonous succession was found as clasts. Petrographical investigations on thin sections (Al Harty et al. 2007) were performed from sandstone and carbonate clasts and control samples of Matabat sandstone of Hamrat Duru unit. Petrographically sandstone clasts
Figure 3. Outcrops of the gypsum stocks in the Wadi ad Dil. A) Panoramatic view of the largest gypsum finger; B) Clasts of different litholo-gies in the gypsum ash, aligned along surfaces indicating streamlines of the rising evaporite. C) and D) Steep contacts of the gypsum with the overlying Triassic radiolarites (note the dragging upward of the chert layers).
91
Workshop2008/3
in gypsum were rich in feldspar; a feature not known in Hamrat Duru sandstones but common in Precambrian, Cambrian and Permo-Carboniferous sandstones in Oman. Some clasts had fluiviatile or aeolian facies, again not conformable to deep marine or turbiditic facies of the Hamrat Duru clastic formations. Aeolian facies in particular are well known in the Amin sandstone of Infracambrian age of Interior Oman. Fluviatile facies may correspond both to Precambrian-Cambrian and Permo-Carboniferous clastic rocks. Thin section interpretation of some dark carbonates suggests microbial algal lamination, common in Ara Formation of Infracambrian age. Oolithic limestones with dark shale interbeds also suggest Precambrian Kharous or Hagir Formations. Alternatively, these may occur in Permian shallow marine deposits as well. No fossils were found so far.
In summary, many studies of clasts or the position of the evaporite itself suggest that the gypsum fingers rose from a larger evaporite body of possible Late Precambrian – Palaeozoic or Late Cretaceous age.
Interpretation – HC accumulation model in the light of tectonic position of the evaporites
Although the extent and age of this evaporite body are not known yet precisely, three alternative positions seem plausible based on field indications. These are best explained by the generalized cross sections (Fig. 4).
Our first model supposes the evaporite may rise from a deeper level of the Autochtonous; this level may be of Infra-Cambrian (i.e. Ara) age (Fig. 4A). Clasts within the gypsum plugs may support this interpretation. In this case an underthrust portion of the Late Proterozoic Fahud Salt Basin could exist below the Hawasina culmination. This play invokes source rocks at Natih (Cretaceous) and late Precambrian levels, and potential reservoir rocks in the Permian-Triassic dolomites. The effective seal would be the Salil shales (Lower Cretaceous).
The second theoretical position (Fig. 4B) of the evaporite is supposed to be Permian and located within the Autochtonous. In this case the detachment below the Sumeini units is the
Salil shale. The source rocks are the same as above, but only the Permian dolomites can be the reservoir, as the evaporite layer forms a seal on top of them.
As a third variant, the evaporite may be also located right beneath the Sumeini unit (Fig. 4C). In this case this relatively thin detachment horizon separates the Autochtonous and the Sumeini nappes. Originally this evaporite might have been a stratigraphic term at the basis of Sumeini succession or at the highest (i.e. Late Cretaceous) position of the Autochtonous. Source rocks are the same as above. All classical Autochtonous reservoirs are viable in this play. Seal is provided by the evaporitic detachment itself.
From these three possibilities, we prefer the third solution. The wide-spread indication of evaporites, combined with the distant surface exposures suggests the existence of a more developed, areally widespread sheet of evaporites. The limited size of intrusions (Hawasina Window) and the stratiform nature (qumayrah half-
Figure 4. Structural models explaining possible tectonic position of the evaporite. A) Evaporite rising from below the Autochtonous series, it implies the Late Precambrian age of the gypsum; B) Evaporites rising from the Palaeozoic sequence of the Autochtonous of the Arabian Table, it implies the Permian age of the salt; C) Gypsum acts as a detachment horizon on the top of the Autochtonous sequence, in this case the evaporite is possibly of Late Cretaceous, Permian of Infra Cambrian age. (sections are not for scale)
MOL Scientific Magazine
92
1MOL GROUP
2008/3Workshop
window) suggest a relatively thin body. These points to a detachment, which could explain the mobility of the nappes, as well as geometrical requirements of the Sumeini structures.
Conclusion
Structural dips and magnetotelluric data suggest a major dome beneath the Hawasina Window. This dome would correspond to the upwarp of the Autochtonous, similar to Jebel Akhdar. The axis of the dome strikes NW-SE. In the southern zone of this dome we observed several occurrences of small gypsum diapirs which rise from beneath the Hawasina Nappes. We suggest that they originate from the Late Precambrian or the Permian of the underlying Arabian Platform, indicating the presence of the Autochtonous series below the Hawasina Nappes. Due to another possible model they can originate form the basal detachment of the Sumeini Units.
In all three cases the existence of the evaporite point to the presence of the Autochtonous series below the Hawasina culmination and shows the possibility to explore the classical hydrocarbon systems of the Arabian Peninsula below the rugged terrain of the Oman Mountains.
References
[1] Allemann, F. & Peters, T.: „The ophiolite-radiolarite belt of the North-Oman Mountains”, Eclogae Geologicae Helvetiae, 1972, 65, 657-697.
[2] Al-Harthy, A., Ahmed, I., & Nasir, S.: „Report on the petrographic description of thin sections from Wadi Al-Hawasina”, Sultan qaboos University, Muscat, 2007, 33 p, manuscript, MOL PLC Library, Buda-pest.
[3] Béchennec, F.: „Géologie des nappes Hawasina dans les parties orientale et centrale des Montagnes d’Oman”, Thèse Docteur d’Etat, Université Pierre et Marie Curie, Paris 6., 1988, 474 p
[4] Béchennec, J., Le Métour, D., Rabu, M., Villey, M. & Beurrier, M.: „The Hawasina Basin: A fragment of a starved passive continental margin, thrust over the Arabian
Platform during obduction of the Sumail Nappe”, Tectonophysics, 1988, 151(1-4), 323-333.
[5] Béchennec, F., Le Métour, J., Rabu, D., Bourdillon-Jeudy-de-Gricssac, C., De Wever, P., Beurrier, M. & Villey, M.: „The Hawasina Nappes: stratigraphy, palaeogeography and structural evolution of a fragment of the south-Tethyan passive continental margin” in: Robertson, A. H. F., Searle, M. P. & Ries, A. C. (Eds.), The Geology and Tectonics of the Oman Region. Geological Society of London, Special Publication, 1990, 49, 213-224.
[6] Glennie, K.W., Boeuf, M. G. A., Hughes-Clarke, M. W., Moody-Stuart, M., Pilaar, W. F. H. and Reinhardt, B. M: „Late Cretaceous nappes in Oman Mountains and their geological evolution”, American Association of Petroleum Geologists Bulle-tin, 1973, 57, 5-27.
[7] Glennie, K. W., Hughes-Clarke, M. W., Boeuf, M.G., Pilaar, W. F., & Reinhardt, B. M.: „Geology of the Oman Mountains”, Verhandelingen van het Koninklinjk Nederlands Geolgisch Minjbouwkundig Genootsschap, 1974 , 31, 423 p.
[8] Graham, G. M.: „Structure and sedimentation of the Hawasina Window, Oman Mountains”, Ph. D. Thesis, Milton Keynes, England, Open University, 1980a, 422 p.
[9] Graham, G. M.: „Evolution of a passive margin, and nappe emplacement in the Oman Mountains” in: Panayiotou, A. (ed.): Ophiolites Proceeding International Ophiolite Symposium, Cyprus, 1980b, 414-423.
[10] Lees, G. M.: „The geology and tectonics of Oman and parts of south eastern Arabia”, quarterly Journal of the Geological Society of London, 1928, 84, 585-670.
[12] Searle, M.P., Lippard, S. J., Smewing, J. D. & Rex, D.C.: „Volcanic rocks beneath the Semail Ophiolite in the northern Oman Mountains and their tectonic significance in the Mesozoic evolution of Tethys”, Journal of Geological Society, London, 1980, 137, 589-604.
[13] Villey M., Béchennec F., Beurrier M., Le Métour J., Rabu D.: “Geological map of yANqUL, Scale 1:100.000” - Bureau de Rescherces Géologiques et Minieres, Orleans, France, 1986
93
Workshop2008/3
Abstract
AVD6 is in production since 1971 with daily processing of crude oil 6500 tons. It has operated since that with a few mode and equipment changes and is used for production of primary products (intermediate products) for production of fuels. Current processing of crude oil is 8500 t/day. As we can see, the processing has several times increased since start-up. Mode changes in processing also need changes and modifications ( modernization ) of old equipments, which because of the capacity are insufficient for current processing of crude oil.On the basis of capacity (increased processing compared to designed conditions) and technical conditions of the equipments (large wear), and on the basis of the new requirements for products, the require of revamp resulted. The main goal of this project is list and short description of some problems and their possible solution for revamp the AVD6. This work does not contain detail proposals and does not describe procedure of implementation, only hypothetically and theoretically shows possible solutions, which are need further explaining in more detail, resp. chemical-engineering projects and estimations.
Összefoglalás
Az atmoszférikus-vákum desztilláció 1971-tôl van mûködésben, amikoris a maximum napi feldolgozás 6500t volt. Azóta egy-pár kissebb-nagyobb változáson ment végig, mind a beren-dezések, mind a rezsim részérôl. Az AVD6 a kôolaj feldolgozás elsô
állomasa, ami nagy szerepet játszik az üzemanyagok gyártásában. A jelenlegi napi feldogozás 8500t körül van. Itt látni, hogy 37 év alatt a feldogozás lényegesen megnôtt. Ez az kapactásnövelés a berendezések jávításával és kicserélésével jár, mivel teljesen más kapacitásra vannak dizajnálva, ill. elöregedtek. A folyamatos kapacitásnövelés, a berendezések élettartalma és a folyamatos új követelmények a termékek minôségére, az AVD6 üzem rászorul a revamp-ra.Ezen munka célja az AVD6-os üzem problémáinak a felsorolása, ill. rövid leírása volt és a lehetseges revamp érékelése. Ez a munka nem tartalmaz részletes leírásokat, nem tartalmaz pontos tehnológiai megoldásokat, csupán teoretikusan rámutat a lehetséges megoldásokra, amik még több tanulmányt, mérnöki projektet és számításokat igényelnek.
Atmospheric-vacuum distillation – process description
AVD6 contains atmospheric and vacuum distillation. Process of crude oil desalting is before these two primary distillations. Crude oil distillation represents the first and basic process of separation in refinery.
The crude oil is after desalting subjected to rectification, in which the crude oil is distillated to fractions based on their different boiling points. For hydrocarbons applies that in individual homological rows their boiling point increases with their molecular weight.
Crude oil is at entrance to desalting process to electrostatic dehydrators is preheated in heat exchanger row to 110-120°C. Desalted crude oil with salt content lower that 5 mg/l NaCl and water content lower than 0.2 % vol. is preheated in heat exchanger net to 165-185°C and is fed to preflesh column, in which the lightest fractions are distillated, whereby decreasing of atmospheric furnace and column load achieved. The head of the column takes the gasoline fraction and the gases appr. 5-10
Kristián Bartos (26) Chemical engineer , Crude Distillation AreaP1.1 - Distillations and bitumensUnit management workerE-mail: [email protected]
AVD6 unit revamp-study
MOL Scientific Magazine
94
1MOL GROUP
2008/3Workshop
% of the crude oil feed.. The bottom of the preflesh column is pumped through atmospheric furnace to atmospheric column.
The bottom of preflesh column is through a system of exchangers and atmospheric furnace sprayed to atmospheric column at temperature 340-360°C, in which the division to gasoline, kerosene, gas oil, light heating oil and atmospheric rest occurs. This column operates at pressure gauge 25-40 kPa.
Atmospheric distillation column is a tower, in which the vapors and the liquid flow counter currently. Division of feed raw material represents multi-level distillation. Distillation is a process, in which, based on volatility, in mixture of materials is structure of developing steams different to liquid structure. Vapors are richer on light, more volatile components and heavier components are concentrated in liquid. Division ability of distillation is based on different volatility of components. Pressure, temperature and structure or raw material has impact on efficiency of distillation.
Vapors exiting from distillation trays do bubble through a layer of a little colder liquid on the closest higher distillation trays; here also con densates a part of heavier components of vapors. Loose condensation heat causes that the lightest components of liquid on distillation tray evaporate. Surplus amount of liquid flows away through an overflow to closest lower distillation tray and to inner reflux. Vapors enriched by light components bubble through another distillation tray, in which the process repeats itself.
Concentration of light components in vapors exiting from individual distillation trays in column increases upwards. Vapors of the lightest hydrocarbons exit through the head of column, the heaviest components are concentrated in liquid at the bottom of the column. A temperature slope is created in the entire height of the column. While fractionation of wide mixture of hydrocarbons, which represent the feed for atmospheric column, individual hydrocarbons are concentrated according to their boiling points in particular heights of columns. This fact is used for side stream such as kerosene, light gas oil and heavy gas oil.
With feed of raw material to column is bigger amount of heat brought to column than the amount that is diverted from column by individual products side stream. For thermal
equilibrium is needed to divert heat through side circulation pump-around, which allow decreasing of the amount of vapors flowing in column; this allows using a column with smaller diameter while maintaining the same capacity and sharpness of division. Thermal profile of column and the quality of side fractions is influences by amount and temperature of side reflux.
Side distillates of atmospheric column (also of vacuum column) contain while exiting the column still a portion of light fraction, which decrease the flash point of these distillates. Therefore, side distillates are lead to side stripping columns, where are stripped with water steam. The stripped light fractions together with water steam are diverted back to column to the tray above take off. The higher is the flash point of a distillate, the bigger is the amount of water steam needed for stripping.
Kerosene, gas oil and light heating oil and after the heat exchange and cooling down pumped away for further processing at following production columns.
Preflesh and atmospheric gasoline is after mixing heated in exchanger row and is stripped to redistillation column. Required heat in redistillation column is provided by a steam boiler. In redistillation column is as a main product obtained unstabilized C5/C6 fraction, light gasoline as a side steam product and heavy gasoline which is diverted from the bottom of the column.
In stabilization column is unstabilized C5/C6 fraction, preheated by exiting product, divides to hydrocarbon gases, liquid C3/C4 fraction and stabilized C5/C6 fraction. Heat to the bottom of the column is provided by a steam boiler.
While distillation, the temperature cannot be increased arbitrarily, because at a temperature higher than 360°C the crude oil products degrade (crack) the more the higher is the temperature. Therefore, in distillation at atmospheric pressure gasoline, kerosene and gas oil is obtained. Fractions with higher end of distillation, for example oil distillates cannot be obtained, because as a result of degradation their viscosity would decrease, their flash point would decrease and chemical stability of these oils would worsen, as well.
Degradation of oil fractions can be prevented by decreasing the boiling point of fractions; this can be obtained by two techniques:
Usually, both techniques are combined, that means that there is a vacuum distillation and at the same time stripping steam is added. Using of vacuum is based on the fact that by decreasing the outside pressure functioning on a surface of atmospheric rest in vacuum column is decreased the boiling point of hydrocarbons. So, if we decrease the pressure functioning on the liquid surface, the temperature at which the pressure of steams equals to the functioning pressure is lower and the liquid boils at lower temperature. Vacuum in column is gained by withdrawing of the gases and condensation of steams exiting from the head of the column. Condensation occurs in barometric condensator, withdrawal of the gases is done by air ejectors or water-circular pumps.
Atmospheric rest from the bottom of the atmospheric column is pumped after preheating in vacuum furnace as a feed to vacuum column at temperature 385-410°C.
In vacuum 5-10 kPa (a), which creates a three-level ejector vacuum-creating system. The vacuum gas oil leaves through the head of the column, vacuum distillates are taken as the side fractions and bitumen is withdrawn from the bottom of the column. quality of vacuum distillates are regulated similarly as atmospheric side distillates- by stripping with water steam in side stripping columns.
Current condition of equipments
In this work, as I mentioned, I would like to show some bottlenecks at unit. All of my investigations are on the basis of sighting at unit and on the basis of revision of equipments during TA 2006.
Bottlenecks:1. destalters2. athmospheric and vacuum column 3. vacuum-creating system (hereinafter VTS)
Increased capacity and quality changes require modifications of:
Function of electrostatic desalters is the desalting and dewatering of crude oil. Technological mode of desalting should be carried out so, that desalting of crude oil achieved under assigned content of salts and water. The limits are given in work instrumentations PI07. Desalting is carried out at temperature 90-120°C and pressure 0,5 MPa with water in two-stage system. Crude oil comes through the heat exchanger network into the 1 stage of desalting. Water is added and mixed with crude oil in mixer, than fed into the electric field of electrodes. Among of electrodes due to alternate electric field crashing of emulsion of water and crude oil consequently sedimentation of water onto the bottom of the desalter occur. Voltage between the electrodes is appr. 22000-44000V. Water is drawn from the bottom of the desalter and the crude oil is fed into the 2 stage of desalting ( second desalter D1/2 ), where the process is repeated. With this method we can decrease the amount of salt in crude oil below 4 ppm and amount of water to 0,2 %wt. For desalting helps liming, but this combination from the view of decreasing of corrosion is insufficient.
New trends and studies show new technologies of desalting. Firm NATCO prefers horizontal desalters in form cylinder.
Desalting principle is similar, than current desalting, in some cases is used alternative current with direct current. Firm NATCO guarantees content of salts under 1 ppm and water 0,1 %wt. Volume of current desalters is 600 m3 , what is from the view of safety unwanted. Consideration of firm NATCO is about 150-200 m3 at processing 6,5Mt/year of crude oil. If the content of slats and water in crude oil decreases, the amount of auxiliary chemicals will decrease (e.g. contrary to corrosion, liming chemicals, demulsifier etc.)Building-in of new system from the view of finances and civil engineering works is too difficult. The costs of implementation will be appr. 60-70 MSKK with totally shut-down of unit for 2 month.
F1, F2 – furnaces
Vertical cylindrical furnaces F1 and F2 with common chimney have operated since 1971 with designed capacity 312000 kg/h – F1 and
MOL Scientific Magazine
96
1MOL GROUP
2008/3Workshop
97
Workshop2008/3
156820 kg/h – F2. Current feed is 320000 kg/h – F1, what is by 2,6% more than designed value and 160000 kg/h – F2 i.e. increased by 2%.
Extreme events:• inyear1987–explosioninF1,damaged
elbow on waste gas piping, lining • inyear1999–explosioninF2,damaged
convection, header chamber, waste gas piping, air piping, chimney valve, lining, overhead of radiation chamber, insulation lining
• inyear2001–intensiveradiationof4 furnace tubes in B section of F1 (eliminated by decoking)
Complex analyses and evaluation of furnace condition:
1. Furnaces have equivalent conditions toward operation time, damages are commensurable to it. Extreme events i.e. explosions in radiation of F1 and F2 aggravate technical conditions of furnaces.
2. From the view of technical conditions of furnaces is possible to observe, that the maintenance of furnaces needs enormous resources, in the first place costs for heat insulation. Operation of furnaces is very difficult.
3. Lifetime of furnace tubes is 100000 hours. Our furnaces have operated since
1971 with 300000 operation time.4. On the basis of measurements with
infrared camera from 15.12.2006 is possible to evaluate heat profile:• highshellsurfacetemperatures• unequalheatload• decreasedheatloadintheconvection
5. On the basis of HAZOP study, pipelines of heating gas and burners not correlate with valid EN norms, from the view of operation safety are critical places:• replacementofunreliableflame
detectors by new one• installationofclosingvalveswithlong-
distance control for each of burner• installationofflash-offvalveand
pressure sensor for leakage of the heating resp. natural gas
C2 – atmospheric column
Original atmospheric column C2 was equipped with trays, and in 1992 was revamped due to achieve higher separation and higher capacity. Now, the atmospheric column is a column with building-in structure packing beds and trays. Fillings have high separation abilities, but too fast fouled, cleaning is not possible. High effect has a corrosion, thickness of filling material is appr. 0,2 mm, wherewith structure of its can damage. In 2003 all of existing trays were changed by new one, besides upper Monel trays.
In future, with replacing of structure packing beds by trays we can prevent some actions, what have happened during TA 2006 – for example seasoning of pyrophoric iron and subsequent deformation of shell of C2. Correction of its was developed.
On the basis of experiences at AD5 and seasoning at AVD6 replacement of three
Current desalters
New desalters cylinder in type
MOL Scientific Magazine
High-capacity Superfrac-tray
98
1MOL GROUP
2008/3Workshop
oriented fillings by new high-capacity trays recommended.
Slovnaft Refinery is operating two vacuum distillation towers located at two separate units AVD6 and VD KHK for processing of the atmospheric residuum. The side-drawn vacuum distillates are used as feed to the FCC Feed Hydrogenation Unit (VGH) and VGO Hydrocracker (SJ KHK) while the residuum is further processed at the Residue Hydrocracking Unit (RHC) and bitumens .
AVD 6 vacuum distillation process the bottom stream of the atmospheric distillation column. The 6 new internal package sections have been installed in to the vacuum column during column-upgrade in years 1992-1996, that led to the improved distillation efficiency of the column and lower pressure difference. The column has five side products, VGO and vacuum distillates (VD1- VD4), slop-wax and vacuum residue stream. Vacuum distillates were for the achievement asked quality striped in side columns C8/1-4. Due to mixing of vacuum distillates 1-3 for next processing, the striping of products is not required and we do not event suppose necessity of striping in future. Slop-Wax is not produced as an independent stream, but is sent back to the vacuum furnace F2 feed or added to
vacuum residue. Currently vacuum residue yield depends on the distillation technology mode and moves within the interval 18.65 % during production vacuum residue as LC –finer feedstock or 15,42 % during hard bitumen feedstock processing.
Following to the approved philosophy of Slovnaft future development the basic lube oil production was finished by 1.7.2003. This means, that there are no special requirements for production of five various side products at the C7 column. Today side products vacuum distillates 1,2,3 create light vacuum distillate (LVAD) for the Hydrocracker unit and side product VD4 as the heavy vacuum distillate (HVAD) is feedstock to the VHG Unit. Where for the LC-finer the starting conversion temperature equals 565°C, the starting point of the DC the currently produced vacuum residue is equal 500°C or less. In this way could decrease of the vacuum residue yield and to raise LVAD and HVAD yields simultaneously. Further we can change the VGO quality in a way, that this stream will achieve the 95% point of the DC 350°C for the summer period and 345°C for winter period and will be processed further at HDS units.
V A C U U M S y S T E M
Existing vacuum system of the column was designed many years ago for much lower processing of the Unit and it appears like main bottleneck of the vacuum part. We suppose that for any revamp of column aiming to decrease the vacuum residue yield will ask its reconstruction.
Objectives1. Decreasing of vacuum residue yield from
existing app. 42.5% to 39% from feed to vacuum part for processing soft vacuum residue as feedstock to LC Finer.
2. Decrease of existing side-drawn to two side products LVAD with FBP to 530°C and HVAD.
3. year-long production of VGO with quality for diesel pool.
4. The maximum capacity 160 tons per hour of the atmospheric residue + recirculation of the Slop-wax.
5. Reconstruction of vacuum sytem6. The expected outcome is uninterrupted
operation time (4 years between turnarounds) with as constant efficiency and capacity as possible
Capacity – phase load
99
Workshop2008/3
Heat exchanger network modification HX
Economic run of unit most characterize utilization of hot products and pumps-around by exchangers and coolers of individual product, draw-offs and feeds. Aspiration is to reduce the costs of delivery of heating and cooling mediums. Current connection of heat exchanger network HX needs some changes because of the:
1. high temperature of products in front of water coolers
2. feed VAD1 and VAD2 are not connected to the HX network
3. high temperature of products into steam generators
4. reducing of power some equipments of HX, consecutive increasing of furnace F1 load with massive application some equipments
Modification of HX is necessary to solve with complex utilization of PINCH analyses (separate work). Therefore, I have focused only for proposals of single modifications, which can bring large energy savings:
a) replacement of water cooler W12 and W10 by air coolers
b) replacement of current tube bundle of water trim cooler W9 by twisted tube
a) Water cooler W12 is used for cooling of HGO (heavy gas oil), drawn from stripper column C3 trough the steam generators R5/2 and R5/3. HGO was used for heating of demi-water for steam generation. Now, exchanger E5/3 is bypassed, what increases W12 load. HGO is drawn from E5/3 at temperature 150°C, which is too high. Required temperature of HGO like a final product is 80°C. For cooling of streams at temperature higher than 100°C water coolers are unsuitable, because of the creation of water stones. Suitable solution is the implementation of air coolers. Increasing of power of steam boilers R5/2 and R5/3 can be achieved with reconnection of HGO stream from R5/2 to R5/3 to from R5/3 to R5/2 along the decreased pressure level of produced steam.
b) Further modification of HX is the replacement of current tube bundle of
Scheme of the modified steam production network – AVD6
Scheme of the existing steam production network – AVD6
Payback: 1 year
MOL Scientific Magazine
Payback: 2,4 years
Scheme of the existing heat exanger network – Redistillation part AVD6
Scheme of the modified heat exanger network – Redistillation part AVD6
Similar problem was observed at water cooler W10.
100
1MOL GROUP
2008/3Workshop
W9 by new twisted tube. Current cooler is used for the after-cooling of gasoline drawed for preflesh column C1 through the AC1 air coolers. Duty of current cooler is insufficient.
W9 – current cooler:
Preflesh column is used for distilling-off of lightest gasolines from crude oil, wherewith we decrease the C2 atmospheric column load. Amount of distilled-off gasolines from C1 is appr. 8%, and the aspiration is 10%, thereby we will decrease the C2 load better, at the same time we will increase the AC1 air coolers and W9 water cooler load. Current power of condensation system of C1 is insufficient.
Modification of AC1 due to construction tonnage is too delimited, therefore modification of W9 is needed. Replacement of current tube bundle by twisted tube by using of current shell.This type of cooler is two-threaded in shell with special construction of tubes and material flow. With replacement we will increase the power of cooling, decrease severity of cleaning and the costs of maintenance. Pressure losses will be less, heat transfer will be increased, wherewith will decrease amount of cooling water.
Conclusion
The main goal of this project is list and short description of some problems and their possible solution for revamp at AVD6. This work does not contain detail proposals and does not describe procedure of implementation, only hypothetically and theoretically shows possible solutions, which are need further explaining in more detail, resp. chemical-engineering projects and estimations.
Revised by: Ing.Mária Lörinczová
101
Workshop2008/3
Abstract
A continuous performance monitoring system for steam crackers is presented that compares the real daily/monthly/yearly performance data to those theoretical maximum values that could be reached at optimum as well as at ideal circumstances.Theoretically maximum production data are calculated on basis of a proven pyrolysis yield model, results of which are linearized and summarized according to certain mathematical formulas. Optimum circumstances are considered when processing feeds with their real (measured) compositions at smooth operation. Ideal circumstances are counted when processing feeds with their best composition (available from the supplier) for thermal cracking. Optimum feed-furnace structures are also calculated for both cases.Besides the production data specific feed and energy consumptions are also monitored daily. Variations are analyzed and causes are registered. This monitoring system is applied for all three steam crackers of MOL Petrochemical Division. By means of a financial analysis performed in parallel, the optimum cracking severity can also be determined. On basis of performance analysis bottlenecks
of production capacity can also be discovered and development strategies can be built up as well.
Összefoglalás
Olefingyárak teljesítmény-figyelése és a termelés optimalizálásaJelen cikk az olefingyárak egy olyan teljesítmény-figyelô rendszerét mutatja be, amely a napi/havi/éves valós termelési teljesítmény-adatokat hasonlítja azokhoz az értékekhez, melyeket ideális, ill. optimális körülmények között el lehet érni.Az elméleti maximális termelési adatokat egy nemzetközileg elfogadott pirolízis hozam-modell számolja ki, amelynek az eredményeit egy általunk készített matematikai algoritmus linearizálja és összegzi. Optimális üzemi körülményeknek azokat tekintjük, amikor a rendelkezésre álló alapanyagokat dolgozzuk fel optimális (zavarmentes) körülmények között. Ideális feltételeknek a ren-delkezésre álló legjobb minôségû alapanyag feldolgozását tekintjük a fentihez hasonló körülmények között (a különbségtételt a beszállítótól kapott alapanyag minôségének és szerkezetének gyakori változása indokolja). Az elôbbiek mellett az algoritmus egy optimális kemence-alapanyag konfiguráció kiszámítására is képes.A termelési adatok elemzésén túl a program napi szinten képes figyelni a fajlagos energia-felhasználásokat is. A változások okait folyamatosan regisztráljuk és elemezzük. A le-írt monitoring rendszert a MOL PETCHEM mindhárom olefingyárában mûködtetjük. A rendszer része egy profitszámítási algoritmus is, amelynek eredményei alapján a pirolízis szigo rú-
Szabolcs Simon (30) Diploma: University of Veszprém, Chemical engineer TVK Plc., Technology Development Technologist E-mail: [email protected]
Tivadar Gál, Dr. (55)Petrochemical engineer – TVK Plc.University of Petroleum and Gases - Ploiesti (Romania)PhD, Pannon University E-mail: [email protected]
Performance monitoring and optimization of steam crackers
MOL Scientific Magazine
102
1MOL GROUP
2008/3Workshop
sága – ezáltal a termékszerkezet – vál-toztatható. A program segítségével feltárhatók a termelés szûk kereszt met-szetei is, aminek alapján felépíthetô egy fejlesztési stratégia.
1. Introduction
Taking into consideration the rising feed prices as well as the sharpening market competition in the area of plastics, it is extremely important to operate the monomer producing steam crackers at high operating rates and optimum production performances.
The latter one is influenced by many parameters and variables, such as feed quality and its structure, operating parameters, energy efficiency of the unit and many others.Gaps between the theoretically maximum and the real monomer production shall be disclosed and then covered as much as possible so as to increase the profitability of the production unit. To do this, a detailed performance analysis and monitoring is suggested for the producers that includes a mathematical-kinetic modeling and simulation of the thermal cracking process as well as identification of those factors that influence production performance. Since the thermal decomposition process is a more thousand-dimensional system, utilization of process computer simulators and certain mathematical algorithms is unavoidable.The performance monitoring system shall be easy to handle and the most important conclusions be easily drawn and forwarded to decision makers.
Manufacturers having more cracker units can enjoy the advantages of integrated operation, such as feed re-structuring opportunities, a more flexible planning and a higher level energy-integration. As an important part of the unit performance, lifetime of radiant coils and their heat-transmission shall also be monitored so that the best furnace performance could be achieved. Lifetime of radiant coils can be monitored by regular measurement of magnetic permeability of the tube metal.
2. Operating rates and production performances of the crackers
Operating rate of a cracker is usually defined as operation of the unit at its design capacity for a certain period of time. When analyzing production performance, we suggest to compare to the full load of the unit (ex. all the furnaces are in operation according to the design capacity and configuration).
Operating rates of MOL PETCHEM crackers can be seen in Fig. 1.
When the operating rate is at the maximum, we could easily think that “we are doing well, nothing else to do”. All of us know that this statement is far away from the reality. Our job starts from this point. We have to examine whether our unit operates at its best performance. If not, we have to find the reasons.
Theoretically maximum and optimum monomer (ethylene and/or propylene) production data can be calculated by means of a proven process simulator or by statistical analysis of furnace effluent compositions measured by the lab. We defined the theoretically maximum production that can be produced from ideal feed composition and structure – based on the real, best practice (ex. the best naphtha quality available for ethylene production). The optimum monomer production is considered on basis of really processed feed quality. Of course, real production data are collected on basis of the DCS production measurement. The gap between the optimum and real production data shall be further analyzed and numerically defined. This difference consists of more factors such as feed quality, cracking severity, status of radiant coils and many others (ex. measurement accuracy). We decided to divide
Figure 1. Operating rates of PETCHEM crackers
103
Workshop2008/3
this gap into four parts: effect of feed quality, effect of coil outlet temperature (COT), effect of furnace run-length and other effects (the latter one for balancing).
As the first step, the unit production calculators were set up for each product of the unit. This is the most complex part of the procedure since the process simulator can only show the effluent composition of one furnace. When the unit has more types of furnaces, a global effluent composition shall be calculated taking into account the recycled streams as well. This requires a special mathematical algorithm.Following this, the gap-analysis table was
created that calculates numerically all those effects listed above.
Figure 2 shows the gap between the theoretical maximum, optimum and the real ethylene production data and the ethylene production calculator table can be seen in Table 1. Table 2 shows a part of the gap-analyzer table.
As it can be seen in Table 1, the production calculator has a very high accuracy even for longer periods at smooth operation of the unit. Similar programs can be prepared for each product (propylene, BT-fraction, etc.) of the unit.
Figure 2. Gaps between the theoretical and real ethylene production data
Table 1. The ethylene production calculator
MOL Scientific Magazine
104
1MOL GROUP
2008/3Workshop
There can be higher deviations from the theoretically optimum production values when considering longer operation periods. As it was mentioned above, the gaps can be numerically identified. PONA-analysis of naphtha is considered when the effect of feed composition is calculated (unit vectors are set up by simulation then extrapolated). The procedure is similar when calculating the influence of COT.
Effect of furnace run-length is averaged on rotation basis – the starting point is defined by simulation. The effect can be positive when a freshly de-coked furnace enters into operation.
3. Energy-map of the cracker units
Distribution of energies by type was examined first in different sections of the units. Four energy types were considered: steam, electric power, fuel gas and cooling water. Specific energy consumptions were examined then, also by type and by section. Finally, a global specific energy consumption map was prepared by unit and the results were also compared to those of an EU leader cracker.
Figures 3 and 4 shows the distribution of steam and electric power usage in different sections of a cracker. Figure 5 shows the specific electric power consumptions in the all three crackers of MOL PETCHEM Division also by sections of the units.
We do not think there can be any big surprise for the olefin producers looking at these maps. yet, it shall be taken into account that these values are monthly-averaged and the energy consumptions can have large variations from one day to another. This is the reason why we suggest a daily monitoring of energy utilization as well.
Table 2. The gap-analyzer table
Figure 3. Steam-distribution map of a cracker
Figure 4. Electric power distribution map
105
Workshop2008/3
Figure 6 shows the comparison of specific energy consumptions of the three crackers on monthly basis. As it can be seen in the figure, there are large variations between the crackers and the cracker itself even by month. This is mainly caused by the large variation of feed quality and structure. As it can also be seen, specific energy consumptions of our crackers are closed to the leaders only at their best performance.
4. The Performance Monitoring System
On basis of calculations and analyses presented above, an excel-table was compiled for continuous, daily performance monitoring. Its first section contains the feed and production data, the second part monitors the specific feed and energy consumptions while the third section calculates the gaps between the theoretically optimum and the real ethylene production (similar table can be prepared for the other products).
Figure 5. Specific electric power consumptions by section
Figure 6. Comparison of specific energy consumptions
MOL Scientific Magazine
106
1MOL GROUP
2008/3Workshop
The table also includes a profitability calculation algorithm – this phase is still being tested. The table also contains the main plant events and some comments.
5. Conclusion
At variable feed-furnace structures and configurations process analysts always have to find the optimum feed arrangement. This can only be done effectively by accurate modeling of the processes at unit level. Processing of certain feeds is economically more advantageous in one cracker than in another one. This is usually controlled by a linear planning model (ex. PIMS) but the Performance Monitoring System is more accurate and it is easier to handle than a sub-model of a group-level system.
There is also a larger opportunity for cross re-processing of off-spec products and by-products (ex. raw pygas formed during regeneration of catalyst).
Production planning can also be more flexible since the feeds and products are stored at the same area. Furthermore, monomer products of the cracker can be distributed in more polymer units of the division – even in different locations (ex. propylene export from TVK to SPC).
The energy systems are also more flexible since the excess fuel gas or steam formed in one cracked can be supplied to another one.The performance monitoring system is also a powerful tool to support the operation of APC systems and the PIMS planning model.
References
[1] Z. Renjun, L. qiangkun, L. Huicai, N. Fenghui, Investigation of coke deposition during the pyrolysis of hydrocarbons, Industrial & Engineering Chemistry Research 26 (1987) 2528-2532.
[2] Plehiers, P. M., Reyniers, G. C., Froment, G. F.: Simulation of the run length of an ethane cracking Furnace, Industrial & Engineering Chemistry Research 29 (1990) 636-641.
[3] F.D. Kopinke, G. Zimmermann, G.C. Reyniers, G.F. Froment, Relative rates of coke formation from hydrocarbons in steam cracking of naphtha. 2. Parafins, naphthenes, mono- di- and cyclo-olefins and acetylenes. Industrial & Engineering Chemistry Research 32 (1993) 56-61.
[4] F.D. Kopinke, G. Zimmermann, G.C. Reyniers, G.F. Froment, Relative rates of coke formation from hydrocarbons in steam cracking of naphtha. 3. Aromatic hydrocarbons, Industrial & Engineering Chemistry Research 32 (1993) 2620-2625.
[5] G.J. Heynderickx, M. Nozawa, High-emissivity coatings on reactor tubes and furnace walls in steam cracking furnaces, Chemical Engineering Science 59 (2004) 5657-5662.
[6] G.D. Stefanidis, B. Merci, G.J. Heynderickx, G.B Marin, CFD simulations of steam cracking furnaces using detailed combustion mechanisms, Computers & Chemical Engineering 30 (2006) 635-649.
[7] G.J Heynderickx, E.M. Schools, G.B. Marin, Simulation of the decoking of an ethane cracker with a steam/air mixture. Chemical Engineering Science 61 (2006) 1779-1789.
[8] Z. Jegla, J. Kohoutek, P. Stehlik, Global algorithm for systematic retrofit of tubular process furnaces, Applied Thermal Engineering 23 (2003) 1797-1805.
[9] A. Niaei, J. Towfighi, S.M. Sadrameli, R. Karimzadeh, The combined simulation of heat transfer and pyrolysis reactions in industrial cracking furnaces, Applied Thermal Engineering 24 (2004) 2251-2265.
[10] S.M. Sadrameli, A.E.S. Green, Systematics and modeling representations of naphtha thermal cracking for olefin production, Journal of Analytical & Applied Pyrolysis 73. (2005) 305-313.
[11] M.E. Masoumi, S.M. Sadrameli, J. Towfighi, A. Niaei, Simulation, optimization and control of a thermal cracking furnace, Energy 31 (2006) 516-527
[12] T. Gál, PhD Thesis. University of Pannonia, Veszprém, Hungary, 2007.
[13] T. Gál, B.G. Lakatos, Modeling and Simulation of Steam Crackers, Computer Aided Process Engineering 18 (ESCAPE 14), Elsevier, 2004, pp. 655-660.
[14] T. Gál, B.G. Lakatos, Re-pyrolysis of recycled hydrocarbon gas mixtures: a simulation study, Chemical Engineering and Processing (2006) 10. 1016/j.cep.2006.11.014.
Product and Process Design Principles: Synthesis, Analysis, and Evaluation (2nd Edition). Wiley, New york, 2003.
Revised by: Dr. Gábor Nagy – PETCHEM Technology Development manager
107
Workshop2008/3
Abstract
The processing of used oil and the use of the product generated (flux oil) in bitumen production is one of the most profitable activities of the company. The collection and processing of used oil amounts to the utilisation of more than 10 thousand tonnes of hazardous waste annually, which does not pollute the environment in any form, and in addition, the reclaiming of the environmental product fee and the recycling of the products from processing generate substantial profits for the company. The receipt, treatment, processing and utilisation of the waste are carried out by the Zala Refinery. The so-called A1V distillation plant previously carrying out oil refining can realise modern processing; the plant with an annual capacity of 180 thousand tonnes, but processing only 10–12 thousand tonnes used oil only since 2002, had to be retrofitted for carrying out the new task and upgraded so that it carries out an economically viable activity, compliant with all the environmental protection criteria and legal regulations. This article deals with the description of the developments and changes which were executed by the Zala Refinery in the past 6 years so that it can carry out the processing and recycling of used oil with up-to-date means in a cost efficient way by fully
complying with the requirements set forth in its Integrated Pollution Prevention Control (IPPC) permit.
Összefoglalás
A fáradt olaj feldolgozása, és a ke-letkezô termék (fluxáló olaj) fel hasz-nálása a bitumen gyártásban az egyik legjövedelmezôbb tevékenysége vál-lalatunknak. Túl azon, hogy a fáradt olaj visszagyûjtése és feldolgozása évente több, mint 10.000 tonna veszélyes hulladék hasznosítását jelenti, ami semmilyen formában nem szennyezi környezetünket, a termékdíj visszaigénylése, és a feldolgozásból származó termék hasznosítása jelentôs profitot eredményez a vállalat számára. A hulladék befogadását, kezelését, feldolgozását és hasznosítását a Zalai Finomító végzi. A korábban kôolaj-feldolgozást végzô ún. A1V desztillációs üzemben megfelelôen korszerû feldolgozás valósítható meg, az üzemet azonban – aminek kapacitása 180 et/év, de csak évi tíz-tizenkétezer tonna fáradt olajat dolgoz fel 2002 óta – az új feladat ellátására alkalmassá kellett tenni, és korszerûsíteni annak érdekében, hogy a tevékenység gazdaságilag is kifizetôdô, és környezetvédelmi szempontból is elfogadható, a jog-szabályi elôírásoknak mindenben megfelelô legyen.A cikk azon fejlesztések leírásával, azon változtatásokkal foglalkozik, amelyeket az utóbbi 6 év alatt hajtott végre a Zalai Finomító annak érdekében, hogy az egységes környezethasználati engedélyében foglalt követelmények maradéktalan betartása mellett korszerû eszközökkel, költségtakarékosan végezhesse a fáradt olaj feldolgozását és hasznosítását
Rudolf Durgó (52)Chemical engineerTechnologist, MOL Plc. ZR Zalaegerszeg, Email:[email protected]
Used oil processing and utilisation in the Zala Refinery
MOL Scientific Magazine
108
1MOL GROUP
2008/3Workshop
1. Processing, utilisation of used oil
1 . 1 . B A C K G R O U N D
The processing of used oil takes place in the Zala Refinery in accordance with the Integrated Pollution Prevention Control permit issued by the Western Trans-Danubia Environmental Protection, Nature Conservation and Water Management Authority. Following the termination of crude oil refining at the end of 2001, the refurbished A1V distillation plant in 1993 had to be retrofitted to process used oil. The nominal capacity of the plant is 180 kt/year. The processing of used oil takes place in the atmospheric part of the plant which has been in operation since 1968 and was given its current design during the reconstruction in 1993. Depending on the quantity of used oil collected and to be processed in the plant and the quality requirements for the products generated, the use of the atmospheric part of the plant proved to be sufficient. The computerised DCS had been available, but prior to beginning the processing it had to be reviewed, and the necessary changes and programming tasks had to be undertaken.
The used oil is received by road and rail in the refinery area. The raw material qualifying as hazardous waste is received directly from the waste owners or the logistics depots in Csepel and Szajol. These two latter depots also have waste treatment licences but they do not have the means required for processing.
Figure 1 presents the quantity of used oil delivered to the Zala Refinery since 2002.
1 . 2 . R E C E I P T , S T O R A G E , P R E -T R E A T M E N T A N D P R O C E S S I N G O F U S E D O I L
The refinery uses tanks T-2011 and T-2012 for the storage of the used oil delivered, which satisfy the requirements and regulatory rules for storage in terms of both the technical and environmental protection criteria. To this end, pursuant to the requirements of the authorities the storage tanks had to be supplied with a double bottom, or double casing, while the tank yards had to be supplied with water and oil-proof insulation. The waste received in road tanker trucks is discharged into a three-compartment pre-deposit tank where a part of the water contents and the major part of mechanical contamination is sedimented. From there the used oil is pumped into one of the tanks. It is then heated to 70–80°C in the tanks, and it is being dewatered by alternating homogenisation and sedimentation. The water contents of the used oil submitted for processing should not have exceeded 5 (m/m)%, but this requirement could not be met.
During processing, the used oil is separated in the distillation column into overhead product (light hydrocarbons) and used oil residue (flux oil). The overhead is stored in tank marked T-301 and the flux oil in tanks T-2007 and T-2008. The refinery uses flux oil as a raw material for bitumen production. During blowing, the flux oil fed into the reactors with the raw material (vacuum residue) enables the generation of products whose penetration, in addition to the high softening point, is substantially higher than that of the bitumen of the same softening point produced without fluxing and with blowing. One of the very strict requirements for the quality of flux oil implies a min. 190°C flash point while the other includes complete water tightness and these requirements serve the security of bitumen production. The additives still present in the used oil residue, previously used to upgrade the properties of lube oils exercise a favourable effect on the production of building industry bitumen in terms of both the quantity of materials used for fluxing and the mechanism of the process. The overhead product, after condensation, separates to hydrocarbon and water phases. After intermediate storage, the hydrocarbon phase is transported to the Danube Refinery, where it is used being mixed in the crude oil to be refined, while the water is disposed of in the industrial sewage treatment plant.
Figure 1. The quantity of used oil delivered to the Zala Refinery between 2002–2007
109
Workshop2008/3
2. Development tasks
Following the termination of crude oil refining in 2001, several activities pursued earlier had to be revised, which had an impact on the planned processing of used oil. Of these, the most important were the following:
• Theindustrialwatersystemearlierrequired for distillation was oversized to process used oil, so it was terminated while the basic task included developing a customised cooling water system fit for adequate used oil processing in compliance with the efficient, up-to-date, environmental protection requirements.
• Theinternalstructureofthemaindistillation column (C-3) was out of date, significantly worn, so the development of a column structure ensuring efficient separation was required.
• Reducingthewatercontentsoftheusedoil to be processed below 3 (m/m)% was a condition for energy efficient processing (on the average the typical level of the water contents of used oil received is 10-15 (m/m)% ).
• Theefficiencyofthepre-treatmentandthe reduction of the water contents of the used oil for processing had to be improved with the use of tanks supplied
with mixers ensuring pre-separation and layer sampling.
• Thedisposalofso-calleddecantergasescontaining sulphur and compounds causing unpleasant smell through incineration, and the scrubbing of flue gas had to be resolved.
2 . 1 . C O O L I N G W A T E R S y S T E M
The technology was already available in the atmospheric plant; ensuring and re-cooling the cooling water required for the processing entailed a much bigger task. Subject to the quantity of the used oil delivered and collected, the plant carries out the processing 4–5 times a year, in weekly cycles. The water demand of the plant amounts to about 100-120 m3/hour, which is supplied through the installation of a pump plant and closed cooling system/cooling tower (Figure 2).The cooling water system comprises a stand-alone unit, its task being to provide for the cooling water demand of the plant at the adequate temperature level at any time. The cooling towers have been installed south of the vacuum side of the plant. A PLC unit controls the operation of the cooling unit. The cooled water is delivered by a pump to the usage points and from there back to tank T-2001 from where the water is lead onto the cooling
Figure 2. Cooling water system of used oil processing
MOL Scientific Magazine
110
1MOL GROUP
2008/3Workshop
towers. The operation of the cooling towers is regulated by the temperature of the recycling water in a way that turning on and off the fan performing the cooling takes place subject to the temperature.
Subject to the changes to the level of tank T-2001, the system operates with continuous water replenishment, and the additives (biocide, corrosion inhibitor) to protect the system are mixed in the supplementary water. The water cycle is supplied with a so-called detecting instrument for water inflow, which indicates any presence of oil to the operators who will shut down the system when it happens and open the cooling water to the oil canal. A pump compensates for the evaporation loss and ensures the replenishment of sludge water depending on the solidification of the system, where the water is supplied from an industrial water system near route ‘E’ and pumped through the filter unit to the cooling tower and the water holding space of tank T-2001. The cooling system installed has been operating reliably in the recent period.
2 . 2 . R E S T R U C T U R I N G A N D U P G R A D E O F D I S T I L L A T I O N C O L U M N C - 3
The processing in the A1V plant requires significant energy outlay because of the high water content of the incoming used oil, and, in addition, the separation capability of the distillation column was not adequate because of the outdated internal structure in poor condition.
The replacement of the internal structure of the main distillation column ensuring the processing and separation of used oil did not take place during the 1993 refurbishment. The tunnel cap tray structure designed in the sixties had become obsolete, requiring cleaning and moreover significantly worn away by now. The experts of the refinery carefully scrutinised the restructuring and refurbishment alternatives of the distillation column, having studies prepared to find a solution enabling energy efficient and cost effective operation, and the hydraulics calculations pointed out that the high water content of the raw material moving in a wide range constitutes an almost irresolvable distillation problem and causes significant excess processing costs. In order to significantly reduce the processing costs, the efficiency of processing had to be stepped up by a better preparation, more efficient dewatering and homogenisation of the raw material than previously.
The study also established that homogenisation can be ensured with side mixers installed in the storage tanks and one of its most important objectives is to evenly distribute the emulsions not degradable further, as well as the layers of various density of used oil in the tank after the dewatering achieved with the heating ( max. 70-80°C) prior to processing.
At the same time the study clearly established that a three-phase centrifuge needs to be procured, installed and continuously operated for efficient dewatering.
The laboratory tests carried out prior to the restructuring and upgrade of column C-3 have also confirmed the assumption based on calculations that the hydrocarbon vapours discharged with the water vapour from evaporator C-1 do not contain any hydrocarbons outside the boiling point range of petrols, so they need not be passed into distillation column marked C-3. Through the technology change whereby the material stream can bypass the distillation column where the load on the rectifying part of the column can be significantly reduced and thereby be made evenly, which will create the conditions for adequate operation, and by reducing the cost of refurbishment, will also reduce the costs of operation. The calculations performed have proved that reducing the earlier 1600 mm cylinder diameter to 800 mm, and the installation of six sieve trays with overflowing containing 4700 4 mm diameter bores can also provide for the separation. Based on experience and analysis it can be verified that the technology materials (raw material, light distillate and used oil residue) contain sulphur in 0.52-1.0 (m/m)%. The decomposition products of compounds with sulphur contents are corrosive; therefore, the structural elements to be newly prepared (casing, trays, down flows) were made of corrosion resistant steel.
The calculations have also indicated that in order to secure an efficient operation of the stripper course, the trays installed here should be replaced by installing four sieve trays with overflowing placed at a distance of 500 mm from one another, and containing 3200 4 mm diameter bores. This way sufficient room is created to install a draining shaft for the lower tray. The column diameter is equivalent to the previous size in this section, so it did not need to be changed. The complete change of the vapour pipe also took place concurrently with
111
Workshop2008/3
the redesign of the internal structure of the column. No side products are removed from the atmospheric column; only overhead and bottom products are removed. Figure 3 represents the technology process flow.
We had alternate options to ensure the processing of used oil by maintaining the former capacity of the plant in this streamlined apparatus:
• Onesolutionentailedre-circulatingapart of the used oil residue operationally into the raw material to maintain the safe operation of distillation column C-3 if the water content of the raw material exceeds 4-5%. In the case of high water contents it may happen that all the water will not evaporate in evaporator C-1, and the trays may get mechanically damaged in the rectifying part of column C-3 because of the overload caused by water vapour.
• Theotherpossiblealternativeincludedupgrading the dewatering technology of the used oil received and stored, which was applied earlier, implement a technology solution ensuring low water contents and commission a three-phase centrifuge.
2 . 3 . D I S C H A R G E A N D P R E P A R A T I O N F O R P R O C E S S I N G O F U S E D O I L
The prerequisite for restructuring column C-3 presented above was to improve the pre-treatment efficiency of the used oil to be processed. The practice applied in earlier years has to be distinguished from the preparation process used in the current period. Today the incoming used oil is transferred to tanks T-2011, and T-2012 through a pre-separator installed at the road discharge facility (Figure 4).
Used oil undergoes pre-sedimentation following discharge, and it is then transferred to the storage tanks. The tanks are equipped with mixers, and there is an opportunity to take layer samples from them. This is especially important in the case of alternating between tanks during processing. Earlier, the sedimentation of the water and hydrocarbon phase and dewatering were realised only through the increase of the temperature, while currently the application of the centrifuge constitutes the most important part of the preparations.
Figure 3 Technology process chart of used oil processing
MOL Scientific Magazine
112
1MOL GROUP
2008/3Workshop
2 . 4 . I M P R O V E D E W A T E R I N G E F F I C I E N C y
The used oil to be processed was admitted into the processing plant with a water content typically between 8-10 (m/m)%, and without the centrifuging action, this amount of water could have been evaporated through significant excess power input only. In addition to implementing a secure operation following the restructuring and upgrading of the column, the basic task included a thorough preparation and reducing the water content of the raw material to be processed below 2-3 (m/m)%. This low water content can be achieved by integrating and operating a three-phase centrifuge in the system (Figure 5, Figure 6, Figure 7).
80 °C material temperature is needed for centrifuging, which temperature is also sufficient for processing. The centrifuge has been installed in a building near the storage tanks, which is divided because the equipment is of explosion-proof design, while the control unit is not.
Figure 5. The operating principle of the centrifuge
113
Workshop2008/3
Legend:A waterB product dischargeC product feed1 water pressure reducer2 feed valve, complete with solenoid valve
for filling, displacement and control water3 control system and motor control unit for
separator - feed pump motor control unit - sludge pump motor control unit4 terminal boxes (mounted on separator)5 water sensor6 circulation valve7 pressure control device for sludge
monitoring8 water discharge valve9 Pneumatic 3/2-way valve with Manual
adjustment and control air solenoid valve (installed in the separator product feed line)
10 PSL pressure control device for product discharge
11 PSH pressure control device for product discharge
The high KOI content water discharged from the centrifuge is transferred to the biological sewage water treatment plant following interim storage in tank T-2002. The sludge (solid phase) is collected in containers and then relocated to the company hazardous waste storage space.
2 . 5 . T R E A T M E N T O F D E C A N T E R G A S E S
Following the 1993 refurbishment in the A1V plant, burning both the non condensing gases in the decanter and the vacuum side gases was enabled in the furnace marked H-3. After the function change of the plant and conversion to used oil processing, incineration was limited to decanter gases only, and a special burner was installed for this purpose. This has, however,
resolved only the elimination of hydrogen sulphide and organic compounds causing unpleasant smell. Subject to the sulphur content of used oil, decanter gases also contain significant amount of sulphur compounds, which are converted to sulphur dioxide upon being incinerated in the furnace. This resulted in occasional non-compliance with the required emission limits pertaining to the smokestack of the furnace as a point source in terms of the sulphur dioxide. A number of diverse scrubbing experiments were conducted in the plant to manage the problem; as an ultimate solution, the gases are passed in a furnace in the bitumen blowing unit marked H-112, and burned under controlled conditions. The excess sulphur dioxide thus generated can now be handled by the bitumen blowing flue scrub unit.
3. Experiences with processing after restructuring and refurbishment of the distillation column
The restructuring and refurbishment of column C-3 was completed in March 2007, and then the first processing of used oil took place. Processing was carried out with used oil of higher water content than planned (3-4 (m/m) %) because the procurement and installation of the centrifuge was implemented in the second half year only. In order to achieve water content even lower than before, the raw material had to be transferred through the plant and a part of the water evaporated.
Processing requires much closer attention on the part of the operators and controllers because of the higher water content. Following this, the plant conducted another three processing cycles last year.
Figure 6. Control and instrumentation of the centrifuge
Figure 7.Installation of the three-phase centrifuge
MOL Scientific Magazine
114
1MOL GROUP
2008/2Workshop
During processing, the technological parameters (temperature of head of tower, quantity of overheated vapour, temperature of raw material discharged from still H-3, quantity of material entering still H-3) were changed a number of times – always in compliance with the limits determined in the technology card – to obtain experience about the operation of the new column structure. The most important operational experiences were the following:
• ColumnC-3respondedwelltothechanges of the technological parameters, operated well in the ranges investigated.
• Capacitydidnotreachtheplannedlevel,it was achieved following the installation of the centrifuge only, when processing used oil of water content below 2 (m/m)%.
• Thequalityparametersofthebottomproduct continued to comply with the requirements during processing.
The setting into operation of a three-phase centrifuge for a better, more thorough dewatering was completed in the autumn of 2007. Its technology and energy efficiency impact on the distillation column and complete processing cycle will be evaluated following the processing in 2008.
The following conclusions were adopted for the operation of the plant and the new technology solutions:
• Asaresultofthetechnologyandenvironmental protection development implemented at the Zala Refinery, the MOL Group now has an up-to-date, efficient plant to process used oil.
• Thechangesimplementedfitconsistentlyto the other parts of the plant and enable cost efficient processing.
• Theusedoilresidue(fluxoil)canbefavourably used as a raw material in bitumen production, whereby competitive, modern building industry bitumen can be generated.
• Asaresultofthetechnologyandenvironmental protection development, in addition to modern bitumen production complying competitively with the bitumen market demand of the region, the processing and utilisation of used oil meeting strict environmental requirements is decisive in the activity of the Zala Refinery.
• Theprocessingofannually8-10ktused oil – through the reclaiming of the environmental product fee and the utilisation of flux oil as a bitumen raw material – generates a profit exceeding 1000 million HUF for MOL Plc.
Revised by: József Takács
115
Workshop2008/3
Abstract
Meeting the increasing demand for motor fuels parallel with the more and more stringent environmental norms can only be accomplished by improving engine design in parallel with the development of motor fuels. This continuously forces refineries to invest into technological development projects and this, in turn, unavoidably entails the increased emission of air pollutants from the refineries.At the same time, the oil companies have to realize in the planning of their new capital projects that it is not sufficient anymore if the technological processes to be installed satisfy the legal requirements of environment protection and comply with the limit values of permissible emissions from specific process units and areas. In addition to compliance with these limit values, the planned activities have to satisfy also the BAT (Best Available Techniques) in respect of both the technology-specific and general principles, such as the so-called Bubble principle, which states that the total emission of a refinery shall not increase with the implementation of new development projects in respect of a particular pollutant.
The application of the “Bubble principle” has been included also in the Hungarian environmental permission procedure, enabling the local municipalities to require compensations for additional emissions caused by development projects.Since MOL PLC plans to implement a large-scale capital project, in the near future which will increase the emission of air pollutants at Danube Refinery due to processing additional quantities of crude oil, a fesibility study was ordered from an independent consulting company (Fôvárosi Levegôvédelmi Kft – FLA) for the investigation of possible measures capable of reducing pollutant emissions in order to prevent the worsening of the status of air pollution in the surroundings of the refinery even after the implementation of the new capital projects.
Összefoglalás
A motorhajtó anyagok piacán ta pasz-talt növekedés kielégítése az évrôl évre szigorodó környezetvédelmi normák mellett kizárólagosan a motor-konstrukciók és ezzel pár huzamosan a motorhajtó anyagok fejlesztésével oldható meg. Ez megköveteli a fino-mítóktól az állandó technológiai fejlesztést, mely elkerülhetetlenül a finomítói légszennyezô anyag kibocsátás növekedésével jár. Ugyanakkor, az olajipari cégeknek, az új beruházásaik tervezése során tudomásul kell venniük, hogy már nem elegendô, ha a telepítendô technológia teljesíti a környezetvédelmi jogszabá-lyokban rögzített technológiai és terü leti határértékeket. A határ ér-tékeknek való megfelelésen túl a ter-
Compliance with future regulation of air quality management in refining
Réka Söjtöri (33) BSC in Environmental Engineering, BSC in EconomyTechnology development engineerDS Development, Environment- and Corrosion protectionMOL Plc. E-mail: [email protected]
Henrietta Horváth (35)MSC in Chemical EngineeringHSE ExpertRefining, HSEMOL Plc. E-mail: [email protected]
MOL Scientific Magazine
116
1MOL GROUP
2008/3Workshop
vezett tevékenységeknek teljesítenie kell BAT (Best Available Technics) ajánlásokat mind a techno lógia spe ci-fikus, mind az olyan általános elveket tekintve, mint az un. Buborék-elv, mely kimondja, hogy az új fejlesztések megvalósításával, nem nôhet a finomító összkibocsátása az adott szennyezôanyag tekintetében.A Buborék elv alkalmazása a magyar engedélyeztetési gyakorlatba is bekerült, lehetôséget adva a helyi önkormányzatoknak, hogy elôírják, a fejlesztések okozta többlet emisszió kompenzálását.Mivel a MOL Nyrt. a közeljövôben olyan, nagy volumenû fejlesztést tervez, mely a többlet kôolaj feldolgozásból adódóan növeli a Dunai Finomító légszennyezôanyag kibocsátását, tanulmányt készíttettünk a lehetséges szennyezés csökkentô intézkedések vizsgálatára, melyek alkalmazásával biztosítható, hogy a DF környezetének légszennyezettségi állapota az új fejlesztések megvalósítása után se romoljon.A kiírás során fontos szempontként volt feltûntetve a költséghatékonyság és az elérhetô környezeti haszon szem elôtt tartása. A tendert a Fôvárosi Levegôtisztaságvédelmi Kft. nyerte el. A beérkezett tanulmányban számos megfontolásra érdemes javaslat szerpel, melyek alapul szolgáltak jelen cikk megírásához.
Bubble principle – from recommendation to obligation
In this article we are going to analyse the main driving points where other outcome is possible. And going on another path the final statement could be even the opposite of the original analysis.
The precondition for issuing the Integrated Pollution Prevention Permit (IPPC permit) is the compliance with the emission limits, and with BAT. The requirements by different sectors are contained by the so-called BREFs (Best Available Techniques Reference documentations). The BREF on Mineral Oil and Gas Refineries (2003) reflects an information exchange carried out according to Article 16(2) of Council Directive 96/61/EC. The Hungarian authority uses a translated and short version.
The BREFs have been available in international professional home pages as certain recommendations for the European refineries for years. Originally these documentations do not imply or specify compulsory standards. The aim was to inform the states and the public about the accessible emission and consumption levels by adopting the certain techniques.
But now, according to the new permitting system, the IPPC permit of the DR also contains several obligations referring to compliance with BAT.
The Bubble principle is a regulation in several European countries. As the picture shows, the Bubble principle implies a single virtual stack, where all the emitted pollutants of a refinery get out to the atmosphere.
Far before the adaptation of the Bubble principle in the Hungarian permitting practice, the municipality of Százhalombatta launched an environmental protection concept in 1991. This concept restricted the further load of the ambient air, and declared that new source could be implemented only in case of compensating its extra emission, creating a virtual bubble above Százhalombatta.
This concept has not created any restriction to the MOL, yet because the developments implemented in the last decades mainly served local or global environmental protection interests.
It was the first time in 2006 that the Municipality of Százhalombatta asked for some compensational acts in course of the permitting of the Steam Generator. They had the right to do this because for receiving the IPPC permit, the approval of the IPPC documentation by the municipality is inevitable.
117
Workshop2008/3
According to its business plan, the Danube Refinery intends to implement further new investments from 2010 targeting to increase processing capacity with 18%, along with rising Russian crude oil ratio in the feed which is a raw material of higher sulphur content.
As the overall emission of contaminants may not rise, therefore, in other fields of the refinery the same reduction must be achieved as the excess emission produced by the new facilities. At the same time, the further reduction of limit values are expected, on the long term. Thus when implementing reconstructions and possible new developments we must be prepared to cope with them.
During the examination of emission reduction possibilities, attention shall be paid to the complexity of the refinery and the effects on the system shall be taken into account during the individual solutions, as well. In case of technological and technical proposals, the following aspects shall prevail:
• Incaseofenvironmentalprotectioninvestments, only the necessary but satisfactory solutions shall be implemented
• Thetechnicalsolutionsshallservebothenvironmental protection and profit production.
Emission reducing possibilities in DR
Possible solutions for reducing emission to the air can be:
• Improvementofthequalityofthefuelvia economical primary treatment (desulphurisation) or pre-treatment (oxidation to reduce NOx).
• Modificationofthetechnologytohaveaneffect on the quality or the quantity of the flue gas (catalyst replacement).
• End-ofpipetechnology–fluegascleaning, separation (SO2), flue gas treatment (NOx) via selective non catalytic reduction (SNCR) or via catalytic reduction (SCR).
One of the most important finding of the referred study is, that for reducing the emissions of the existing technologies, the end-of-pipe solutions might be possible and occasionally efficient solutions, but the technology modifications and fuel pre-treatment can be considered primarily such methods that comply with BAT.
Out of the 53 point sources of Duna Refinery:• 44pointsourcesarethefluegasesof
tube furnaces serving the technology,• 9pointsourcesaregases,fluegases
produced directly from the technological processes.
Dual grouping of point sources is important, because different solutions must be applied for reducing polluting components emitted together with flue gases of furnaces and for different gases leaving the technological processes.The two most important pollutants have to be dealt with are: the sulphur-dioxide and the nitrogen-oxides, and the proposed actions are gathered round them.
Those actions have positive effect on the emission of both pollutants like decreasing the rate of oil combusted and developing the emission monitoring system are discussed separately.
Possibilities to reduce SO2 emission
From authorising aspect of the planned developments, maintaining the recent SO2 levels within the “bubble” is not difficult problem to solve for the refinery, thanks - among others – to the recently completed Claus unit upgrades. In addition, regarding SO2, the base load of the ambient air around the refinery is far under the immission limit. The problem is however, that the net SO2 emission of the Duna Refinery is high – 1327 t in 2007. Preparing ourselwes for the likely restriction in the future, it is necessary to investigate the possible solutions.
SO2 emission is not a combustion technology issue. The sulphur content of the fuel fully converts to SO2. The sulphuric compounds like H2S originating from technological processes are also converted to SO2 via combustion, and the whole amount gets out to the air through the stack.
Rewieving the technological systems of the refinery, the referred study defined possible abatement actions in the following fields:
T H E F U E L G A S S y S T E M O F T H E R E F I N E R y
There are three plants (HDS, GOKM-3, DCU) where the quantity of the gas produced by the unit itself exceeds the plant's own demand, and it provides the quantity over its own consumptiontotheKGÜsystem.HDSandGOKM-3 provide the excess gas to the middle pressurerawmaterialofKGÜ,whilethefuelgas of DCU directly blends into the refinery's fuel gas system. The fuel gas produced by GOKM-1 does not cover the demand of plant, the required quantity is supplemented from the refinery's fuel gas system.The remaining processing units are using fuel gas from the Central Gas Processing unit which has low sulfur and C3+ content and is blended with flue gas from DC unit and natural gas in order to maintain the necessary pressure level.
Examining the quality of the refinery fuel gas in a longer time frame, the followings can, be stated:
• TheH2S content varies typically between 200-400 ppm, from which sometimes it differs significantly.
• RegardingH2andhydrocarbonsitistypical that propane and ethane vary between 5-8 vol% and 8-10 vol% respectively that can be said relatively consistent. Methane and hydrogen however, vary also between 30-50 vol % in a reverse direction to each other.
• Asthepressureofrefineryfuelgassystem is controlled by the addition of natural gas, it can be supposed that the extreme quantity change of hydrogen content causes reverse direction and significant change in natural gas feed mixing rates. This significant variation in hydrogen content might be originated from refinery technological processes, which would be reasonable to check and to reduce the extent of differences as much as possible.
• AlthoughthetaskofCentralGasPlant(KGÜ)istocollectvariouspressurelevel gases, to recover the condensable components and to recover H2S from gases by MDEA scrubbing, the scrubbing efficiency due to the significantly changing quantity and composition of gases is inadequate.
ThereviewoftheKGÜisinprogress.Theaimof the project is to ensure the low sulphuric content and constant quality of the refinery
fuel gas for the units at all times. The expected elements of the project: the intensification of the scrubber, developing spare scrubbing capacity, revision of the pipes, implementing new pipes and measuring equipments to enhance the safety of the gas supply.
The situation presented by the study is going to bebetteraftertheimplementationoftheKGÜproject This is of great important because the inconstant quality of the fuel gas and the varying sulphur content have a significant effect on the operation and SO2 emission of the several refinery gas fuelled furnaces.
In order to safely reduce refinery fuel gas the H2S content, it is recommended to examine the modification possibility of PB desulphurisation batch technology, as the quality of the refinery fuel gas waving parallel to the regenerating cycle.
The application of existing desulphurising plant for this purpose shall be considered.
It is essential furthermore the refinery scaled supervising and controlling of the fuel gas system, by monitoring the quality and quantity of the flows. By making transparent the technological, quality and balance data – for especially H2S content – of the fuel gas system, the environment-conscious operation of refinery fuel gas system and manager level supervision increase.
CENTRAL GAS PLANT (KGÜ )
AsithasbeenmentionedtheefficiencyofKGÜis going to be improved in the nearer future.Reduction of the H2S content of fuel gas emittedbyKGÜcouldbeofhighinterestin case of any authority restriction, as the reduction to at least 100 ppm the refinery SO2 emission would be possible to decrease with the quantity of ca. 140000 kg/a, which is the condition of the 25% decrease of SO2 emission. This quantity is the 10.5% of the 2006 emission.
It is important to note, that amine (MDEA) scrubbing technologies play key role in maximization of H2S recovery. The optimized operation promotes reduction of the SO2 emission of the refinery without implementing large-scale HSE projects.
Consequently the importance of the amine scrubbing and regenerating technologies has
119
Workshop2008/3
been increasing, so the continuous availability and optimized operation of these technologies have to be more emphasized, and this have to be required also in the implementation of new plants.
C L A U S U N T I T S
A dominant proportion, more than 66% of the SO2 emissions from DR are caused by the tail gases from the Claus Units. Therefore in order to protect the clean air these processes and facilities must be handled with priority importance in the reduction of SO2 emissions.
As a result of the upgrades in recent two years and also the current upgrades in the Refinery the three Claus Units on stream in DR surpass the value set forth in the statute, what is more they surpass the more stringent limits specified by the authority in terms of the rate of sulphur conversion. Meeting the value guaranteed by the licensors on its own means 200 to/year of SO2 saving for the Refinery.
According to the referenced study should further reduction be required the sulphur recovery efficiency can be increased even up to 99.95% by further improving the efficiency of the HCR sections, and especially that of the amine scrubbing and regenerating systems in the Claus units. So it is necessary to examine how can the H2S content in the regenerated (lean) amine, be dropped down to the lowest possible value by increasing the boiling rate. It can be stated that the lower the H2S contents in the incoming regenerated amine the more efficient the H2S scrubbing is within a given system. The typical value is 0.02 mol H2S/mol MDEA, however the literature say scrubbers operating on regenerated amine of a significantly lower H2S content (0.01 to 0.005) are also in service. Considering the high pollutant emissions from the Claus units in absolute terms, through a minimum improvement in the sulphur conversion rate a significant emission reduction can already be achieved at DR level.
So in respect of the sulphur conversion rate the Claus units are meeting every expectations, however – if we strictly comply with the further regulations – in case any of the Claus units is shut down the processing capacity of the Refinery will have to be turned down to a rate, at which the SO2 emissions below the limit can still be ensured after the implementation of new development projects.
Possibilities to reduce NOx emission
Complying with the “bubble concept” and the compensation of the increased NOx emission as a consequence of new developments could be a great expense to MOL. Regarding NOx, the base load of ambient air is also higher than the SO2 load, caused by among others the growing transport.
In general, nitrogen oxides are generated via three mechanisms, these are the thermal oxidation on high temperature or the spontaneous reaction, and due to the combustion of heating (fuel) materials. quantity of thermal NOx grows exponentially over 1200°C. This mechanism is significant at high temperature combustion processes especially when the feed air is preheated as well, which results in higher flame temperature and more NOx production. The application of fuels containing also nitrogen being in organic bond (e.g. residue fuel oil, black oil) increases the NOx content of the fume gas as well. By decreasing the oxygen content of combustion air, the NOx content of the flue gas decreases, at the same time the decrease of excess air causes the increase of CO emission, therefore the provision of optimal combustion condition is important.
Accordingly, the NOx emission is in significant extent a combustion technology question, and can be traced back less to technological processes.
Refinery fuel gas contains N2 gas in nearly 4vol%, which originates typically from FCC fuel gas, the N2 content of which alternates between 18-20vol%. This N2 gas behaves similarly to the N2 content of the air, therefore it can be said that the N2 content in fuel gas typically does not affect the formation of NOx during combustion.
The case is different in case of refinery fuel oil, as fuel oil contains organically bond nitrogen. The organically bond nitrogen, during combustion, transforms into NOx in significant quantities. In 2007, in average 0.087 m/m% was the nitrogen content of refinery fuel oil, which means, taken the annual consumption as a base, NOx emission (expressed in N2) between 93200 kg/a and 106300 kg/a. It is nearly 10% of total NOx quantity emitted with fuels.Accordingly, the 50% reduction of fuel oil in itself would result 5% NOx emission decrease compared to the real emission of 2006.
MOL Scientific Magazine
120
1MOL GROUP
2008/3Workshop
NOx emission that can be traced back to combustion processes
MOL started to replace the burners in the fired heaters with LowNox types more than 10 years ago during the revamps and turnarounds, and only these types were, and are today, to be purchased for the new facilities. Due to that the refinery is able to meet the NOx limit.
The combustion factors, which influence the NOx emissions, are:
• Theflametemperatureinfluencesstronglythe NOx generation. Above 1200 °C the NOx generation increases exponentially.
• InfiredheatersusingairpreheatingtheNOx generation is typically greater due to the higher flame temperature.
• Theorganicnitrogencontentsinthefuel oxidise typically to NOx during the combustion process. This concerns only the fuel oil firing in Duna Refinery.
• Inburnersoperatingonhigherexcessair(high flue gas O2 content) the NOx is also higher.
• Eachcombustionequipment,includingits burners is a unique design and the optimum operation and pollutant emission, including the NOx emission must be measured individually then the equipment operated accordingly.
• Measuringandmonitoringthepollutantson-line in the flue gas, including the NOx offers a possibility to control NOx and keep it at a minimum value in the specific process equipment on a continuous basis.
• Duetoenvironmentprotectionbeingaglobal issue several burner manufacturers can produce today so called Ultra LowNOx burners, burner systems, which comply with the most stringent environment protection regulations. In Hungary TUKI company is also able to produce such burners. It is typical of these systems that not only the burner needs replacing with the proper type, but the firing systems must also be modified. These systems are the multi tier (primary, secondary, tertiary) combustion air supplying systems and the flue gas recycle systems. In general, they reduce the flame temperature thereby reducing both the load on the radiation zone fire chamber and the thermal load on the tube surface. As a result a higher thermal load is applied to the convection zone, which in many cases results in reconstructing
the convection zone of the fired heater, typically in increasing the number of tubes.
An alternative option for reducing the emitted NOx quantity by an upgrade in combustion is the cleaning the flue gases.
It is typical for the refinery furnace capacities that the produced flue gases are formed under quasi atmospheric conditions in the quantity between several 10000Nm3/h and several 100000Nm3/h, however, the contaminating materials harmful to the environment and to be removed from the fume gas (SO2, NOx, CO, dust) are present in ppm magnitude. Due to it, the equipments of the flue gas scrubbing systems are huge indimension, the investment is of a billion magnitudes (in HUF).
We can then state that it is much cheaper to suppress the NOx generation through increasing the efficiency of the existing systems and the result-improving effects of the upgrades in firing techniques than to remove the pollutants produced without contro by flue gas treatment. That is why the referenced study also placed the emphasis on that examination.
In 2006 the NOx emission from Duna Refinery was 1 028 074 kg/year. Of that the NOx emitted by the fuel gas used for heat generation and by the equipment with a combined firing was 848 875 kg/year, which amounts to 82.6% of the total emission. So it is useful to pay the closer attention to the combustion equipment.
In the ranking of the emissions in place in DR the first 9 of the 53 point sources of the Refinery give 65.4% of the NOx emitted, which corresponds to 671 881 kg/year of NOx emission, and the first three of them give 41.5%, which is 426 256 kg/year of NOx.
Characteristic to following three point sources• P6,thecommonstackofAV-3tube
furnaces, • P29,thecommonstackofAromaticand
Xylene isomerizer,• P56,thecommonstackofAV-2tube
furnaces
That they have the highest capacity and they use combined heating.
As it is known, the NOx content increases proportionally with the increase in the excess air during operating at a high excess air rate.
121
Workshop2008/3
Therefore it is of key importance to reduce the oxygen content of the flue gases, while the fired heater must be operated at its minimum excess air, which can be achieved with its firing system. Reducing the excess air promotes CO production after a specific limit has been achieved, so this is the constraint in reducing the excess air beyond any limit, and it is important to note that the lack of combustion may cause explosion hazardous conditions.Despite the fact that the O2 measurement is implemented in almost all process units (data are collected in RIS) the control of excess air – maybe through an automation of some level – faces several difficulties. The optimum interval must be measured through test run because every system is unique. The solutions are specific to the fired heater and the throughput, and are dependent on the flow of the necessary steam to mention the more important ones only.
Despite the difficulties maybe it is useful to take further steps. Initially the regular inspection of the operation of all firing equipment, of the control, metering, regulating and mechanical parts installed, and of the settings of the burners must be provided for in order to remove the faults identified.
The reduction in excess air results in significant fuel savings, so it can be said that the control of heater excess air is an environmental and at the same time an economic issue. According to the study the NOx emissions from DR can be reduced through these measures by minimum 10% on average, which represents 100 000 kg/year of NOx.
Proposed modification at the fuel oil system of the refinery
Thanks to the environmentally – conscious operation of MOL refineries, the rate of oil firing has constantly decreased in the last few years. Today only three units (AV-2, AV-3, Aromatic units) can be fired by fuel oil, and the quality of the oil has improved, too. Contrary to the earlier practice, the max. 0,1 m/m% sulphur-laden HCO from FCC unit gets into the fuel oil system, mixing with LCO and a minimum amount of FCC residue (MCB). The emission level originates from oil combustion can be improved by increasing the rate of LCO.Refinery fuel gas contains N2 gas in nearly 4vol%, which originates typically from FCC fuel gas, the N2 content of which alternates
between 18-20vol%. This N2 gas behaves similarly to the N2 content of the air, therefore it can be said that the N2 content in fuel gas typically does not affect the formation of NOx during combustion.
The case is different in case of refinery fuel oil, as fuel oil contains organically bond nitrogen. The organically bond nitrogen, during combustion, transforms into NOx in significant quantities. In 2007, in average 0.087 m/m% was the nitrogen content of refinery fuel oil, which means, taken the annual consumption as a base, NOx emission (expressed in NO2) between 93200 kg/a and 106300 kg/a. It is nearly 10% of total NOx quantity emitted with fuels.
The annual quantity of combusted fuel oil is 50-57 kt. Calculating with 0.1 % sulphur content it means 100000 kg/a and 114000 kg/a SO2 emissions, which is 7.5-8.6 % of the total SO2 emission.
The disadvantages of fuel oil combustion against fuel gas are the following:
• Typicallythesulphurcontentoffueloilishigher than refinery fuel gas. It means 3-4 times ratio in the Danube Refinery. By this, the SO2 emission is 3-4 times higher.
• Dueto“organicbondnitrogen”existingin fuel oil, NOx is produced in greater quantity during the combustion, as the significant part of the organic bond nitrogen transforms to NOx.
• Incaseoffueloilcombustion,dustemission shall also be expected, which is not typical in case of fuel gas combustion.
• Operatingcostofthefueloilcombustionis higher, as storage is necessary in the vessels, pumping is necessary; the control of pressure and quantity is carried out by establishing returning pipes, steam is necessary to be used for oil injection.
• Significantamountofcarbonblackdeposits on the surface of furnace tubes, reducing the heat transfer efficiency. It is especially true for the convention zone tubes. And it goes with significant fuel consumption increase.
Accordingly, the 50% reduction of fuel oil in itself would result 5% NOx emission decrease compared to the real emission of 2006.
Besides the disadvantages of fuel oil against fuel gas, the sole advantage is that typically fuel oil is cheaper than natural gas. At the same time considering every aspect the economical
MOL Scientific Magazine
122
1MOL GROUP
2008/3Workshop
optimal rate of fuels has to be defined with accurate calculations, and it shall be projected to the whole refinery.
The organically bond N content of fuel oil was in general 0.087 m/m% in 2007, which means NOx emission (expressed in NO2) between 93200 kg/a and 106300 kg/a considering annual consumption. It is nearly 10% of the total NOx quantity emitted with fuels.
According to theoretical calculations, 50% or more reduction in fuel oil quantity representing ca. 20% of refinery fuel demand would realize 4% SO2 emission decrease projected to 2006 value (which means 50000 – 60000 kg/a SO2 emission reduction), and it would result 5% NOx emission decrease compared to the real emission of 2006., without substantial investment. In parallel with it dust emission would also decrease.
Legal and BAT requirements unambiguously prefer the refinery gas and natural gas combustion in the refinery furnaces. Combustion purpose application of the liquid hydrocarbons, as e.g. fuel oil type components is justified only if they cannot be used for other purposes.
The conclusions above are obviously just theoretical possibilities, but preparing ourselwes to the pozential future restrictions it should be investigated whether the technological possibilities of the Danube Refinery as well as the commercial possibilities enable usage of currently applied FCC HCO for other purposes If yes, substituting even the whole quantity of fuel oil with fuel gas and natural gas would assure alone the 10% reduction of SO2 and NOx emission.
Advantages of a well managed monitoring system
The Danube Refinery of MOL has, centralized process control system of advanced technological and technical standard.
The quantity of polluting materials emitted by the point sources are checked periodically – according to the regulation –, which serves as base for annual self-reporting. However, for accurate measurement of polluting materials emitted by point sources, the constant emission measurement would be more useful.
Over the obligation that above certain capacities the regulation stipulates the constant emission measurement, these process analyzers have dual advantage:
• BytheconstantNOxandCOmeasurement, the combustion control efficiency of furnaces increases, exceeding of limit values can be detected immediately and immediate interaction is possible.
The continuous monitoring is a sensitive question, since when the potential is given, the Authority could ask for providing the on-line data (it is a regulation in several European refinery). Therefore it is important to emphasize, that it would not be an authorised emission monitoring system, but analyzers measuring emission data, that are inevitable for the effective operation.
For accurate measurement and controllability of refinery point sources emission values, taking into account of the expenses, the long term investment strategy of an integrated air pollution monitoring system shall be established.
As the first step, installing analyzers for the on-line measurement of SO2, NOx, CO, and dust for the P6, P29, P56 point sources would be useful.
Conclusion
The evolution and increasing severity of environmental legislation and regulations, demand a new approach in the judgment of economic efficiency in decision making. The most important issues are the following:In case of non-compliance with the emission limit values set in the regulation, the authority is obliged to withdraw the operation permit of the producing facility. The shut down of certain units of the Danube Refinery would cause losses in billion magnitudes In this case the estimation of lost profit (profit loss) is one of the basements of the economic efficiency calculation.
Environmental burden fee must be paid on the mass of polluting material emission. In this case the costs spent on reducing emission must
123
Workshop2008/3
be compared to the environment burden fee that can be saved as a result of the reduced emission.
The third important factor is the “bubble principal”. It is a stipulation in codes and regulations that emission of polluting material of refinery expressed in mass may not increase as a result of the performed upgrades or new installations. Therefore, for each development project which causes extra emission of air polluting material, the emission must be compensated in other fields of refinery. It is reasonable to handle this additional investment in the business case, as part of the investment, and taking it into account when return of investment is calculated.
Following up the system of EU environmental protection regulation system, continuous increase in severity are expected in the regulation on air purity protection. In consideration thereof decisions on
environmental investment projects shall be made with special care. Such processes are reasonable to implement, which take an organic part of a long term environmental protection concept, based on which further developments could be implemented.
References
[1] Integrated Pollution Prevention and Control (IPPC), Reference Document on Best Available Techniques for Mineral Oil and Gas Refineries, February 2003
[2] Compliance with future regulation relating air quality management (2007), Fôvárosi levegôvédelmi Kft. (study available in Hungarian language)
[3] www.ippc.com[4] www.kvvm.hu
Revised by: György Isaák
MOL Scientific Magazine
124
1MOL GROUP
2008/3Workshop
Abstract
Developments aiming at the reduction of water consumption in the past decades and the total reconstruction of the wastewater treatment system in Duna Refinery completed in 2005 have resulted in the compliance of the quality of discharged wastewater even with the strictest Hungarian and EU regulations.The specific freshwater consumption of the Duna Refinery however, exceeds the benchmark value of the refineries having the most effective water management and also the specific wastewater production is above the 1m3 wastewater discharged/tons of processed crude limit required by the environmental authorities. (1.4 – 1. 6 at present)The exceeding of the above limit penalty, the so called “dilution fine” has to be paid and of course, paying the Environmental Burden Fee which is proportional to the quantity of
discharged pollutants is also an obligation. The treatment costs of the industrial water are increasing so, taking into account all the above the refinery decided to partially reuse the treated wastewater.In the present article technologies applicable for the recycling/reuse of industrial wastewater are described together with the objectives and technical scope of the wastewater reuse project with the successful accomplishment of which Duna Refinery could further increase the efficiency of its water management.
Összefoglaló
Az elmúlt évtizedekben végrehajtott víztakarékossági beruházások és a szennyvízrendszer teljes rekon-strukciója, amely 2005-re fejezôdött be azt eredményezték, hogy a Dunai Finomító kibocsátott szennyvizeinek minôsége megfelel a legszigorúbb hazai és EU elôírásoknak is.A Dunai Finomító fajlagos frissvíz felhasználása azonban meghaladja a leghatékonyabb vízgazdálkodással rendelkezô finomítókét, fajlagos szennyvíz kibocsátása pedig, felette van a környezetvédelmi hatóságok által elôírt 1m3 szennyvíz/to feldolgozott kôolaj értéknek (jelenleg 1.4 – 1.6 közötti érték).Tekintettel arra, hogy a határérték túllépése un. hígítási bírság kiszabását vonja maga után, a kibocsátott szennyvíz mennyiségét arányos kör-nyezetterhelési díj terheli, az ipari víz elôállítási költségei egyre növekednek, a finomító a szennyvíz részbeni újra felhasználása mellett döntött. Cikkünkben ismertetjük az ipari szennyvizek újrafelhasználására al kal-mas technológiákat, valamint annak a fejlesztési projektnek a célkitûzéseit és mûszaki tartalmát, amelynek sikeres
György Isaák (60)Chemical Engineer (MSc)MOL Plc. R&M, DS DevelopmentHead of Environment and Corrosion ProtectionE-mail: [email protected]
Possibilities for wastewater reuse in Duna Refinery
125
Workshop2008/3
ki vitelezésével a Dunai Finomító újabb nagy lépést tehetne elôre a víz-gazdálkodás területén.
Introduction
In the recent years, Duna Refinery has considerably upgraded its water management system.
The first step was determination of the root causes of water losses, and it was soon realized that increasing the closure of the in-plant cooling water systems (i.e. increasing cycles of concentration), the diversification and reconstruction of the older, non-efficient units could reduce the quantity of waste water (effluent) to be treated to ca. two-thirds of the former amount.
The refinery sewage system was partially upgraded, in parallel with its segregation into process (chemically contaminated) and non-process lines.
To accommodate the surges of contamination experienced during breakdowns of operation of some processing units, and to retain the large amounts of rainwater falling during intense showers, several 10 thousand m3 of new spill diversion and storm water holding capacities were established.
The new wastewater treatment plant incorpo-rating a state-of-the-art dissolved air flotation (DAF) unit and an automatically operated, cyclic activated sludge (CASS) biological grade is capable of continuously meeting the discharge requirements specified in EU regulations.
The increasing costs of industrial water use, the need to further reduce discharged wastewater /processed crude ratio together with readily available, good quality treated water urged the Refinery to launch a new water reuse project. The objective was: first partially, and in the very long run completely, suppressing water takeout from the Danube by solely relying on internal resources.
The drivers for change – new legislation (IPPC)
An important element of modern environment protection is the application of integrated approach in environmental permitting
(Integrated Pollution and Prevention Control – IPPC). It means that loads and pollution of the various environmental elements shall be examined as one complex unit, with respect to the raw material and energy consumption, and the quantity of the created wastes as well.
For this purpose, the European Committee has prepared the 96/61/EK Directive on Integrated Pollution Prevention and Control (IPPC). This directive was adopted in the Hungarian legislation by the Government Decree 193/2001. (X.30.) on Detailed Regulations of the Integrated Environmental Permit Procedure. The purpose of the IPPC Directive is the creation of a unified system for permitting procedures of the activities that significantly affect the environment. As a result of this, the pollution should be prevented in the first place, but if it is not possible, its environmental impact can be reduced as much as possible.
Reduction of the pollution of the environment and keeping it at the lowest possible level shall be ensured by the concept of Best Available Techniques – BAT. The BAT intends to keep the balance of the various environmental effects and their expenses. It means that the BAT can be different at each plant due to the differences of expenses and benefits.
A precondition of the application of the BAT based permission procedure is up to date knowledge of the environmental performance of the operating installations, and the latest solutions.
In order to ensure this, the European Committee prepared the so called BAT Reference Docu-ments that serve as guidance for uniform permitting procedure for the authorities of the individual member countries. The attachment of Government Decree 193/2001.(X.19.) refers to these as the documents that describe the aspects to follow during the definition of the best available technique. The competent authorities shall consider these aspects when defining the requirements of the content of the application for the permission.
The Duna Refinery, as a company that belongs under the effect of 193/2001. (X. 19.) Decree (the national IPPC decree) has got its integrated environmental permit from the competent authorities in Sept 2006.
It was an important precondition for getting the IPPC permit that all of the processes applied in
MOL Scientific Magazine
126
1MOL GROUP
2008/3Workshop
the Duna Refinery should comply with the BAT recommendations.
The most relevant requirements for water management are, as follows:
• multi-stagewastewatertreatmentsystem(physical and chemical oil and solids separation, biological oxidation);
This value for Duna Refinery is about 1.38 (2007), at present, differing considerably from the benchmark widely accepted in EU refineries.The non-compliance could be penalized by local, environmental authorities.
The drivers for change – Sustainable development strategy of MOL
MOL Group’s Sustainable Development strategy was announced in February 2007 and the first Sustainability report of the company has been issued.
The three main pillars of the activities supporting sustainable development are social, economical and environmental ones.
Main element of the latter is reducing environmental footprint of MOL by using more renewable raw materials and energy sources, by more efficient use of fossil energy carriers and natural resources, as water.
Optimization of the water, wastewater and sewage systems in the frames of an Integrated Water System is more and more common.
In most of the refineries, we can find some examples of repeated usage of process waters and methods for reduction of water consumption:
(1) Application of water-ring vacuum pumps instead of steam ejectors.
(2) Replacement of once-through coolers by ones using recirculated cooling water (closed water cooling systems).
(3) Excessive use of air coolers instead of water cooled ones.
(4) Numerous pure condensates are produced in a refinery from the steam that previously did not get in contact with the products. These condensates are
applicable for direct recirculation as boiler feed water which results in reduction of expenses.
(5) Recirculation of the stripped sour water as wash water in the desalting process of crude oil is the first step of every WSI process. Sour water is produced in hydrogenation reactions or when wash water and/or steam gets in contact with a hydrocarbon product containing hydrogen sulfide (H2S) and ammonia (NH3). Most of the H2S and NH3 content is removed by the sour water stripper and the stripped sour water is applicable as wash water in the electrical desalters which are considered as major water consuming unit in refineries (5-10 % of the crude processed)
(6) A significant quantity of wastewater is produced by the Crude Distillation Units (CDU) and the Fluid Catalytic Cracker units (FCC). In case of a distillation unit, the produced wastewater is about 2-3 % of the processed crude oil, which is produced as steam condensate. This water does not require stripping, so it can be fed directly to the desalter as wash water. If there is an FCC unit in the refinery, then it also produces a significant quantity of wastewater – about 5-10 % of the feed. This quantity can be reduced to 2-4 % if the wash water is used in a series (cascade) system.
(7) Blow-down from the boilers and recirculating cooling systems and the rain water can also be used in the desalters as wash water – depending on their salt concentration.
(8) The wastewaters of the refinery shall be separated appropriately, and collected separately for the most effective handling and recycling. The typical segregation scheme of a mineral oil refinery consists of a “clean” water channel, an oily wastewater channel and a channel for the heavily contaminated wastewater.
(9) Preparation of a study for the optimization of water usage, with the methodology of Water pinch is highly recommended.
In order to design the integrated system, first we must specify the raw water demand of the individual plants, and the quantity of the produced wastewater, and also the losses of the water cycles. Based on these data, the water balance of the entire refinery can be calculated.
(10) Using the treated (purified) water as
127
Workshop2008/3
make-up water of cooling systems, as boiler feed water, washing water, and as make-up water of fire water systems.
In an ideal case it is possible that the biologically treated wastewater can be used directly as industrial water or cooling water. Practically, some combination of pretreatment methods are needed, especially for the production of boiler feed water.
Lack of technology is not a barrier any more to the more economical use of water; development of membrane technologies, and significant reduction of their price allow production of drinking water, or even waters with high purity used by the electronic industry, from waters coming from any source (including municipal and industrial wastewaters).
In the followings those technologies are listed with the combination of which theoretically all individual wastewater recycling problem could be solved.
There are traditional methods known and applied for long among these (e.g. water softening by ion exchange, various non-membrane based filter methods).
The membrane based processes, that have proven their operability in the past decade and are applied in a wider and wider range, belong to a different group (micro and ultra filters, nanofilters, and reverse osmosis, and their latest versions that are still under development and that do not have long term references (reverse electro-dialysis, multi-function membranes, etc.)
Full recirculation (ZLD = Zero Liquid discharge) cannot be solved in most of the cases without some concentration, crystallization, vacuum distillation, or evaporation. The application of these steps is necessary only in case of extreme environmental conditions for recycling of water of refineries.
Technologies for making service water from wastewater
A ) I N D U S T R I A L W A T E R F R O M R A W W A T E R
Most of the refineries satisfy their raw water demand from surface waters that contain suspended solids in various quantities from organic and inorganic sources, in colloid state,
or rougher disperse systems. Their quantity often changes drastically (for example as a result of rains or tide), and also changes seriously seasonally.
After settling the non-colloidal contaminants at the location of water intake, and sterilizing it, the pre-treated water usually can be used to satisfy the needs of industrial water consumers, and as fire water source.
The finer contaminants that cannot be removed by simple settling are removed by traditional filtering from the pre-treated industrial water.
Any material is applicable as filtering agent that is available in big quantities, cheap and has the appropriate porosity (in most cases it is sand, gravel or other crushed stone, crushed anthracite, agricultural by-products, or their combinations), that resists the physical load caused by the periodical back wash or fluid bed application.
The structure of the filter equipment can be several types according to the specific task or local conditions: fast or slow flow, pressurized or gravitational, with periodical or continuous operation.
The pores of the filters can be plugged after a while, their pressure difference increases, which is eliminated by periodical backwashing, but it results in significant water losses.
The fine particles of colloid contaminants and some coloring substances can get through the pores of the filters. Because of this, and to improve the performance of the filters, the sizes of particles to be filtered are increased by addition of coagulating and flocculating agents, whose range covers materials from the inorganic metallic salts (which is less economical because of the big quantity of the produced slurry) to the most modern organic polymers.
The treated industrial water leaving the filters is usually applicable after sterilization to make up the blown down water of the recirculating cooling water loops.
The quality of water shall fulfill the requirements of the corrosion-free and scaling-free operation of the recirculating cooling systems operating with a specific concentration factor and chemical treatment method.
MOL Scientific Magazine
128
1MOL GROUP
2008/3Workshop
The lowest limit of the particle withholding capa-bi lity of the traditional filter media is about 1 micrometer. This is the range of the suspended particles that still can be distinguished visually or by optical microscopes. They can separate fine dusts, pigment particles, emulsions and some microorganisms.
The membrane filter technologies were developed to satisfy stricter requirements than these, where the size of the separated particles was extended to molecular and further to ionic dimensions by application of micro-porous and partially permeable membranes.
Microfiltration – MFMicrofilters are able to withhold the particles that are much smaller than pores of the traditional filter methods (min. 0.05 micrometer). It means they can retain most of the bacteria and a part of the macro-molecules, but cannot fully separate colloidal materials.
In this case the filtering media is a specific organic polymer with very even pore dimensions, whose material is chosen according to the chemical exposure.
Structure of the membrane filter can be several kinds: spirally wounded type, tubular, hollow fiber, these are usually produced as modules with different permeation capabilities/capacities.
The modules can be operated by top feed (some bars of overpressure is enough for the micro-filters), but the modern types usually apply immersed and vacuum operated units that are less sensitive to sediments and clogging.
Membrane filters are also prepared from ceramic materials for extreme environments, especially for hot and low pH applications. These are usually flat planes because of the rigidity of the base material.
Ultrafiltration – UFThe ultra filters whose form is identical to the micro-filters, only their pore diameter is different, are operating in the 0.0015 – 0.2 micrometer particle size range, and they withhold the colloid size insoluble contaminations, and also the bacteria and viruses. The water treated by ultra-filtration does not require further sterilization for industrial purposes. Ultra-filtration can also remove the dissolved compounds with min. 1000 molecular mass, therefore significantly reducing the COD/BOD/TOC value of the treated water.
The ultra-filtration technology is mainly used today in connection with Membrane Bioreactors whose great benefit is the compact size, and secondary settler is not necessary to separate the activated sludge. Additionally, the quality of the treated water does not depend on the actual settling speed of the water.
Their performance by a unit volume is many times more than that of the traditional activated sludge biological purifiers because of the high sludge density.
Another benefit is that their performance hardly depends on the variations of the wastewater to be treated.
The water after the membrane bioreactor treatment is usually applicable directly (without further purification and chlorination) for usage in the cooling water circuits.
Another common application is as a pretreatment unit of equipment operating with the reverse osmosis principle in order to protect RO membranes that are extremely sensitive to clogging, if the purpose is production of boiler feed water.
Nanofiltration– NFThe nanofilters are able to remove even the dissolved molecules from the treated water (down to 200 molecular mass). Due to their extremely small pore diameters, the nanofilters are an intermediate solution towards the partially permeable membranes; their operational pressure is much higher than the ultra-filters pressure.
Due to their high energy consumption, their application is justified only in case of special circumstances (for example in the electronic industry).
B ) B O I L E R F E E D W A T E R F R O M I N D U S T R I A L W A T E R
The quality requirements for the boiler feed water are very strict, especially in case of high pressure boilers. The boiler feed water shall be free of every colloid and suspended materials. It shall not contain hydrocarbon contamination which may cause frothing and initiates hard scale deposits.
The calcium and magnesium contents shall be kept at a low value in order to prevent scaling.
129
Workshop2008/3
Silica content shall also be reduced as much as possible in order to prevent the hard deposits formed with the Ca and Mg compounds which are difficult to remove.
The scale and other sediments reduce heat transfer, and also require expensive chemical cleaning quite often, but they can also cause corrosion or cracking of the boiler tubes.
It is also useful to keep the dissolved salt content of the boiler feed water (characterized by the specific conductivity) at a low value in order to reduce the quantity of the blow-downs and to increase the efficiency of the boiler unit.
For water supply of boilers with low and medium pressures, it is enough to remove the suspended and colloid contaminants, and the scale formers – by the demineralization of water.
An almost perfect demineralization is a requirement for the boilers with high pressure, especially used for energetic purposes.
These requirements were approached until the recent years by a combination of chemical treatments (lime water softening, coagulation, flocculation, and filtration) and ion exchangers (zeolite or anion and cation exchanger resins).
Their greatest disadvantage is the complex technology with many stages, a big space requirement for the equipment, the relatively high chemical consumption and the produced solid and liquid waste.
Therefore, today almost exclusively the reverse osmosis method is used for production of boiler feed water, but also new, innovative processes are becoming more and more popular.
Reverse osmosis – ROThe reverse osmosis technology originally was developed for demineralization of sea-water, and its utilization in this field has a history dating back to several decades.
Its general usage was prevented for long time by the high price and the relatively high energy requirement of the process, but now it overgrew the traditional technologies in the field of boiler feed water preparation.
The reverse osmosis is the reversed process of the natural osmosis by an applied pressure. The osmosis phenomenon is the natural flow of a solvent through a partially permeable
membrane, from the direction of the thinner solution to the more concentrated one. The driving force is the osmosis pressure, which depends on the type of the solvent and the dissolved material, and also the concentration.
If overpressure is applied to the more concentrated side then the flow direction of the natural osmosis turns back.
During the reverse osmosis, the treated water is led to a partially permeable membrane at a higher pressure (10 – 50 bar) and the water molecules pass through it, giving a pure permeate, while most of the dissolved ions (90 -99%) remain in the concentrate.
The concentrate produced by the reverse osmosis in average is 25 % of the treated water. The concentrate (neglecting the salt content) is relatively pure water, therefore if it does not exceed the limits specified for total dissolved solids (TDS), it can be discharged to the recipient.
Further good quality water can be produced by enrichment of the concentrate by another RO equipment with a lower capacity. In the systems whose purpose is to achieve full prevention of wastewater discharge, in the so called “Zero Liquid Discharge” (ZLD) systems, the concentrate is evaporated / crystallized and handled as a solid waste.
The equipments operating based on the reverse osmosis principle, are usually in modular ar-range ment, regular cleaning of the membranes is solved by an automatic controlling system, and their operation is free of problems in case of appropriate design.
However, it can be a problem if the preparation of the water fed to the RO equipment is not appropriate quality. The material of most of the RO membranes is sensitive to oxidative effects (e.g. free chlorine contents) and to the extreme pH circumstances.
Additionally the fouling type deposits may reduce the efficiency of the membranes, which is caused by the inorganic salts with low solubility (Ca carbonate, sulfate, Ba and Sr sulfate and the reactive silicon compounds). It is useful to prevent their effect by the best possible removal of the salts forming this hardness, and appropriate demineralization of the water. In less critical cases, acid treatment, or addition of chelating agents can be enough.
MOL Scientific Magazine
130
1MOL GROUP
2008/3Workshop
Other components of the RO feed water can also cause problems (clogging, increased pressure difference, too frequent cleaning). These finely distributed, suspended materials (colloids, microorganisms, elementary sulfur etc.) cause clogging of the membranes in a short time if the pretreatment of the water does not remove these materials perfectly.
In case of waters with varying suspended solids content that are microbiologically contaminated, the most reliable solution is application of ultra filtration as a pretreatment stage.
Whether water with a specific pretreatment can be used as feed for a reverse osmosis unit or not, can be best judged by the SDI value (Silt Density Index) besides knowing the usual water chemistry parameters. This value is calculated from the ratio of the filtration times of repeated filtrations of 500 cm3 water under standard circumstances (0,45 microns filter, 30 psi pressure) and its ideal value is < 3.
In case of special water quality requirements, the production of ultra pure water required by the pharmaceutical industry and the microelectronic industry, and even in case of some high pressure boilers (such as nuclear power plants) the quality produced by reverse osmosis is not enough.
Therefore an additional ion exchanger stage is installed after the RO unit, what is followed by an adsorbing unit with activated carbon or by a gas separator membrane, if removal of gases is also a requirement (carbon-dioxide, oxygen).
The already explained disadvantages of the traditional ion exchangers (big space requirement, chemical agent requirement of the regeneration, etc.) can be eliminated by the following de-mineralizing methods based on ion exchanger membrane.
Electrodeionization – EDIElectrodialysis reversal – EDRBy these methods, not only the dissolved salts but also other harmful components can be removed from the treated water that can be ionized in an electronic field (carbon-dioxide, ammonia, silica and boric compounds) very effectively.
The treated water flows in narrow channels between membranes prepared from ion exchanger resin, where the various ions travel towards the appropriate electrode driven by a
DC voltage, and it results in treated water with high purity.
A benefit of the demineralizer methods with the ion exchanger principle is that they do not require chemicals for their regeneration – it can be solved by the periodical exchange of the DC polarity. The material of the modern ion exchanger membranes is less sensitive to the chlorine contents, and also to the suspended contaminants, metal oxide and silica contents as well. The long life of the membranes and their small space demand are also advantages.
Some decades ago, those experiments which aimed at the satisfaction of water demand of some settlements located at arid regions by purification and recycling of the communal wastewater, were seen as highly extreme but this experiences have almost revolutionized the water management all over the world, by now.
Existence and future of large cities depend on the poor drinking water sources in their entire regions; in other instances, industrial development of some regions can be prevented by the lack of industrial water in the necessary quantity and quality.
Expenses of providing fresh water and dispo-sing wastewater increase rapidly; the emission requirements are more and more strict.
Rational recycling of the communal and industrial wastewater provides us with several indirect benefits besides the direct financial profit and the accompanied competition advantages:
• duetorecyclingofthewater,thesurfacereservoirs can produce water longer and with better quality;
• theunusedfreshwaterreleasesreservesfor production of drinking water, whose shortage causes political stress in many region;
• theexcessofappropriatelytreatedwastewater is applicable for agricultural (irrigation) and urban (park sprinkling, dust remover watering, car washing, etc.) purposes, besides its industrial usage;
• thewaterrecyclingprojectsincreasethe public acceptance of the involved industrial installations;
131
Workshop2008/3
The mineral oil refineries and the petrochemical complexes belong to the most water demanding installations.
Although the specific fresh water consumption, and the wastewater discharged calculated for a unit of processed crude oil has been reduced significantly in the previous 20 years (it is also proven by the regular surveys of the CONCAWE in case of the European refineries), the further reduction of these relative values is important not only for environmental but also from financial aspect. Let us refer here to the ever increasing Environmental Burden Fee, and the increasing expenses of water intake and water treatment.
Duna Refinery, as most of the refineries has performed all of the obvious water saving possibilities in the last two decades.
Measures Taken So Far To Reduce Water Consumption
• Continuouslyincreasingthecycleof concentration of the cooling circuits (achievement of 2. 5 (3.5 - 4) concentration factor for large (small) recycling systems)
• Eliminationofthelosseswithinproductionplants and the network losses of cooling circuits (prevention of mixing between different water qualities)
• Upgradingthetwolargest(Recycling-1and Recycling-2) cooling systems by intensifying the cooling towers (packing/cartridge replacement, water distribution system, automatic make-up water dosage, sludge removal)
• Implementingindividual,closedrecirculating cooling system for AV3 Crude distillation unit instead of using Danube water in the summer season as once through cooling.
• Reconstructionofthemake-upwatertreatment plant, reduction of in-plant losses by reusing the effluent filter backwash waters.
As a result of the above measures, the water consumption rate of the Refinery fell from the 1,800 m3/h value to 1,250 m3/h.
In 2002 the specific water consumption of the refinery was 2.6 – 2.8 m3/t processed crude) and as a consequence of this, the specific
waste water discharge was also well above the de sired level of 0.5 – 0.6 m3/t which is characteristic to refineries with tight, economical water management.
The water consumption and hence, the waste-water production have been gradually reduced in the Duna Refinery as it is seen on Figure 1.
Now, the specific wastewater discharge is around 1.4 – 1.6 m3/t but Hungarian environ-men tal regulation (harmonized with the EU regu-lations) requires 1.0 m3/t ratio for pet roleum processing plants.
Above this level penalty, the so called “dilution fine” has to be paid and of course, paying the Environmental Burden Fee which is proportional to the quantity of discharged pollutants (irres-pec tive to the fact that their concentration is below the permitted discharged limits) is also an obligation.
The implementation of the project titled “Upgrading water management in Duna Refinery” was successfully accomplished in 2005.
Due to the refurbishment of old sewer system and API type oil separators, to the installation of new surge capacities, dissolved air flotation units, equalization basin, and an up-to-date activated sludge biological treatment unit the quality of the discharged wastewater meets the most stringent requirements. (See: Figure 2.-3.)
Beside sustainable development considerations and the expected financial benefit from reduced water treatment costs, those written above were the main reasons of launching the water reuse project in 2006.
Figure 1. Wastewater discharge of Duna Refinery [Mm3/year]
MOL Scientific Magazine
132
1MOL GROUP
2008/3Workshop
Wastewater reuse project in the Duna Refinery
Before starting this ambitious project several tests and studies were made for the elaboration of the optimal technical scope.
In 2006 a project preparation study was made with the joint effort of Ds Development, Refining and HSE experts based on the in-house knowledge gained during the water management upgrading activities of the past few decades.
The study revealed that while water recycling/reuse is almost a routine task in case of municipal and some industrial wastewaters, in case of petroleum processing some refinery specific problems have to deal with.
The most important ones: • theeffectofthosespecialcontaminants
(sulfide, cyanide, phenols, aromatics, etc.) which are not always taken into account by the designers, who usually handle normal water treatment operations during design of membrane processes;
• Inacomplexrefineryconsistingofseveralinterconnecting units, the water quality can change suddenly when some plants are shut down or restart, this can be enhanced by the effect of the changing rainwater quantity. An appropriate puffer capacity is necessary to eliminate these effects.
• Alimitoftherecycledproportionofthewater quantity can be the dissolved salt content (TDS) in case of cooling towers, and also in case of emitted wastewater (eco-toxicological effect) together with the problem of the accumulation of non-biodegradable compounds.
VITUKI Innosystem Ltd.. as an external consultant also helped the scope definition by the preparation of a feasibility study covering the above mentioned industry specific tasks:
• evaluationandhandlingoftheriskscaused by non-normal operations,
• technicalpossibilitiesforhandlingpeakloads in case of intensive showers,
• identificationofcriticalpollutingsourcesand reducing their effect,
• Proposalsfortheapplicationsofon-linepollution (toxicity, sulfide, etc.) monitoring and warning system for protection of activated sludge,
• recommendationsfortheoptimaltechnicalsolutions for wastewater reuse with limiting factors (salt concentration, inert COD, special pollutants) taken into account,
• computersimulationoftheoperationofthe Biological Stage with increased load
Figure 2. quality of wastewater discharged to the Danube
Figure 3. quality of the effluent from Biological treatment unit (CASS)
Table1. quality requirements for discharges into the recipient (Danube)
Table 2. quality of treated wastewater discharged to Danube (2007)
133
Workshop2008/3
(i.e. unifying process and non-process sewers)
• diagnosinghighcapacitycoolingwatersystems for optimal operation
Technical scope of the wastewater reuse project in Duna Refinery
Putting all the available information together and with a budget calculated on the base of non-obligatory quotations requested from reputable water treatment companies from all over the world the individual project proposal (IPP) of the project has been prepared, submitted and was finally accepted in June 2007.
The technical scope of this project proposal was the following:
1) Recycling of 500 m3/hour wastewater from the Lower WWTU
At lower WWTU: mechanical treatment (filtering), disinfection, pipeline tied to the industrial water mains 1. and 2., volume and quality control.
In the Hydrogen Production plants’ de-ionized water units (DWU)
Collection and drainage of concentrate; Assuring quality by additional ultrafiltration unit.
2) Construction of a min. 30000 m3 capacity spill diversion capacity
Options: - using polishing lagoon No. II. partially separated from polishing lagoon
No. I. Return line to the WWTU Biological stage3) Segregation of the two main discharge
line leading to the lagoons 1: Treated water from the Biological Unit 2: Storm water and havaria water New penstocks with penstock chamber4) Creation of remote control possibilities
for motor driven valves and penstocks, throughout the wastewater treatment system
5) Pollution monitoring and indicator system for early warning of WWTU operators (toxicity, sulfide, conductivity analyzers, automatic samplers)
6) Upgrading instrumental measurement of discharged wastewater volume
7) Extension of the electrical system at Lower WWTU
8) Revamp of the raw water treatment unit (replacement of pumps, application of frequency controllers)
To the Invitation for Tender (IfT) based on the accepted concept of the IPP only two competitive bids have arrived.The evaluation team deemed the tender unsuccessful because the offered solutions were too complicated, composed of several stages with high manpower, chemical and energy needs. The CAPEX investment and the forecasted OPEX needs were much higher then previously calculated.
The prices offered for the segregation of the two sewer lines and the construction of the 30000 m3 capacity spill diversion basin at the Lower WWTU were irrationally high taking into account that many elements of the existing system could have been used for the new construction.
The project team tried to find more cost effective solutions for the decreasing of the investment costs but the availability and operational safety have always remained in focus.
Before issuing the new IfT the technical scope has been optimized and the main differences from the previous one are the followings:• Recyclingof(500m3/h of) the biologically
treated wastewater (process and non-process wastewaters combined) from the CASS effluent in the UPPER Wastewater Treatment Plant
It has become possible because in the time between the two tenders the previously segregated process and non-process wastewater streams were combined and treated in the Biological Treatment unit.
The discharged wastewater quality improved to such an extent that the additional cleaning effect of the two 100 000 m3 capacity polishing lagoons were no longer needed.
Additional element of the new concept is a 100 m3 surge tank in the Upper WWTU for equalizing CASS effluent quality which is fluctuant due to the cyclic operation of the Biological treatment unt.
• Bythetimeofissuingthenewtenderthe future service water needs of new developments were more precisely determined (Boiler Farm, Hydrocrack complex).
Therefore, the technical scope of the new tender was extended with some modifications needed for the future recycling of 800 m3/h treated wastewater in modular design. These modifications could be implemented later with much higher expenses.
MOL Scientific Magazine
134
1MOL GROUP
2008/3Workshop
MAKE-UP W
ATER UNIT
NOTATION
RIVER DANUBE
MUW
- Make-Up W
ater
recirculated water
process waste water
pre-treated and treated waste water
BASINSTOW
ERS
�lters
employees
process waste water
non-process waste water
sidestreamevaporation
Lanoon No1
Lagoon No2
non-pocess streamprocess streamsand
settling
API basinAPI basin
sand settling
COOLINGSETTLING
TANK FARM
�lters�lterssettlig and
�otation
settling MUW
for technology prosesses
raw industrial water (RIW)outlet, m
ake-up water (MUW
): 625 (215-1200) m
3/h
MUW
for recirculation systems
345 m3/h
pumping station
process water
drinking water:30 m3/h
ground water~ 10 m
3/h
water content of the crude~ 7 m
3/h
non-processprocess
INLET: 660 m3/h
unit block No59pum
ping station for process and non-process waste water
MUW
for Demin W
ater Units (DWU)
DWU's
boiler feed water
PROCESS UNITS
non-process water
pumping station
measured RIW
use:220 m3/h
drinking water - comm
unal waste water
boiler feed water
not measured PIW
use: 360 m3/h
TOTAL RECIRCULATED WATER: 21.920 m
3/h
275 (115-536) m3/h
23 m3/h
~200 m3/h
BiologicalTreatm
ent Plant(DAF and CASS)
RAW - Raw Industriam
Water
non-process waste water
main pipe No1
main pipe No3
main pipe No2
future: recirculation of the treated waste water
recirculated water: 0-500 m3/h
�ltration and desinfection
drain in 2007: 1110 (854-1443) m3/h, 9.743.805 m
3/yearRIW
inlet in 2007: 1240 (960-1620) m3/h (10.840.000 m
3/year)after the start of the boiler unit: (2008.01.01.): 1250 (963-1625) m
3/h, 10.950.000 m3/year
from 2011: 1.450-1.500 (1117-1950) m
3/h, 13.140.000 m3/year
RO concentrate to the River Dunába (150-200 m3/h)
INDUSTRIAL W
ATER FROM DERT
after the start of the boiler unit: 1450 (1120-1885) m3/h (~ 12.702.000 m
3/year)fom
2011: 1910 (1470-2483) m3/h (~ 16.731.600 m
3/year)
steram No3
stream No1
steram No2
steram No4
RAW INDUSTRIAL
WATER UNIT
Waste W
ater Treatm
entPlant
Figure 4. Process flow diagram of water management system in DR
With the above modifications the expected CAPEX needs have remained within the original budget of the project so, submitting of a new IPP is not necessary.
The new facilities constructed in the frames of the wastewater reuse project together with the
existing ones are illustrated on Figure 4 in green. According to the Business Plan of MOL Refining the project will be executed in 2009.
Revised by: István Keresztényi, Ph.D
135
Workshop2008/3
Abstract
Until now Logistics has placed two orders for Solomon studies at the Solomon Associaties Ltd. in order to make their operational efficiency comparable with international practices.The studies described our positions in several areas of the international practices. The key benchmarking areas include:• Totalcashexpenditure• Manageablenonvolumeexpenses–
MNVE• Maintenanceandsupervision
spending• Reliability• StaffThe studies have provided compari-sons with international practices in the above areas. Our article describes the logistical units that were involved into the studies, and briefly mentions our position in the international arena from the viewpoint of a number of parameters.Without being exhaustive it depicts the most important findings of the studies. Our results regarding Manageable Non Volume Expense and Manitenance are also shown.Finally, the summary informs you about the actions that we initiated after processing the results of the studies.
Összefoglalás
A Logisztika két Solomon tanulmányt rendelt meg a Solomon Associaties Ltd.-tôl, annak érdekében, hogy mûkö-désének hatékonyságát a nemzetközi gyakorlattal összehasonlíthatóvá tegye.Ezen tanulmányok több területen jellemezték a nemzetközi gyakorlatban elfoglalt helyünket. Az összehasonlítás kulcsfontosságú területei:• Azösszescashráfordítások• Menedzselhetônemmennyiség
arányos ráfordítások - MNVE• Karbantartásiésfelügyeletikiadások• Megbízhatóság• SzemélyzetA tanulmányok a fenti területekre adtak összehasonlításokat a nem-zetközi gyakorlattal. A cikkben ismertetjük azokat a lo-gisztikai egységeket, melyek a vizs-gálatba be lettek vonva és röviden említést teszünk a nemzetközileg elfoglalt helyünkrôl néhány paraméter figyelembe vételével.A teljesség igénye nélkül ismertetjük a tanulmányok legfontosabb meg-állapításait. Bemutatjuk a Manageable Non Vo-lume Expense és a Manitenance-re vonatkozó eredményeket.Végül az összegzés során ismer-tet jük azon akciókat, melyeket a vizsgálat eredményeit feldolgozva kezdeményeztünk.
1. Preliminaries
An evaluation of the efficiency of R&M Logistics has been performed based on international benchmark data for the years 2004 and 2006 by Solomon Associates Ltd.
István Gergely (53)Mechanical engineer DS Logistics MaintenanceMaintenance chief engineer MOL PlcEmail:[email protected]
Maintenance related conclusions of two consecutive Solomon studies at logistics
MOL Scientific Magazine
136
1MOL GROUP
2008/3Workshop
Surveys by Solomon Associates Ltd covered the following logistics units:
• FriendshipIIcrudeoilpipeline(2004and2006) (HU-C or F)
• Hungarianproductpipeline(2004and2006) (HU-P or H)
Note: Bracketed figures are the year(s) in which the facility was surveyed and the letter codes used in this article.
To ensure a reliable comparison, Solomon Associates Ltd developed a method that allows comparability of surveyed units despite differing features and parameters. To this a complex, non-linear correction they used:
In addition, a complex non-linear adjustment method was used:
These divisors enable comparison between diverse systems regardless of differences in scale, complexity, or configuration (e.g. Manageable Non-volume related Expense - MNVE per unit of EPC/ETC).They provide the basis for much of the analysis. Key comparative areas
• TheproductpipelinesysteminHungaryputs up a good performance in terms of costs of maintenance, and intelligent pigging of Manageable Non-volume Related Expenditures.
• TheproductpipelinesysteminSlovakia, however, shows considerable overspending in terms of maintenance and surveillance in y2004.
• ThesameistrueofFriendshipIIcrudeoilpipeline, as well.
• MOLGrouppipelinesystemshavehighreliability and very low measuring losses compared to others surveyed.
• AllMOLGrouppipelinesshowoverspending compared to the first quarter in terms of maintenance materials.
• AllMOLGrouppipelinesandterminalsshow overspending compared to the first quarter in terms of non-maintenance staff.
• AllMOLGroupLogisticsoverspendingcan be experienced by the working hours terminals, but personal-featured outgivings are competitive conversely because of the lower wage-level.
• AllMOLGroupterminalsshowsignificantoverspending in terms of personal expenses in nearly all areas, but particularly in operation, maintenance, and administration.
• InMOLGrouppipelines,piggingisnotused for crack detection.
Equivalent Pipeline Capacity (EPC)
Equivalent Terminal Capacity (ETC)
Authority: Comparative Performance Analysis for Oil Pipelines and Terminals (Operating year 2006) Author: Solomon Associaties Ltd.
Figure 1.
Figure 2.
137
Workshop2008/3
3. Analysis of Operating Expenses
Solomon Associates Ltd’s surveys comprise diverse comparisons with international practice. For the purpose of this article, however, the focus is on operation-related elements of Manage able Non-volume Related Expenditures (MNVE).
Elements of Manageable Non-volume Related Expenditure (MNVE):
• Salariesandbenefits,maintenance,surveillance, vehicles, equipment rentals, other contract services
Survey results are presented alternately for both pipelines and terminals.
The presentation of details is preceded by the figures below showing the position of pipelines and terminals in the international arena based on benchmark data.
A ) P I P E L I N E S
The borderline between red and yellow represents the average value. It is clearly seen that, except for complexity, our pipelines rank below the average of those surveyed.
B) TERMINALS
With the exception of Szajol, the terminals were all below the average.Survey results should be viewed in the context that the logistics facilities surveyed are not considered to be large ones compared to those the benchmark is based on. It is pre-showing the higher per-unit costs.
It should be noted that Manageable Non-volume Related Expenditures are just a part of the overall operating expenditure, and therefore all statements herein are only relevant to the MNRE and not true of volume-related expenses.
Year 2004 Survey
Year 2006 Survey
Figure 3.
Figure 4.
Authority: Comparative Performance Analysis for Oil Pipelines and Terminals (Operating year 2004 and 2006) Author: Solomon Associaties Ltd.
Figure 5.
Year 2004 Survey
Year 2006 Survey
Figure 6.
Authority: Comparative Performance Analysis for Oil Pipelines and Terminals (Operating year 2004 and 2006) Author: Solomon Associaties Ltd.
MOL Scientific Magazine
138
1MOL GROUP
2008/3Workshop
4. Manageable Non Volume Expenses
A ) P I P E L I N E S
It can be seen that maintenance costs for Friendship II crudeoil pipeline were higher than the international average and this trend did not change over the two years past. At the same time, an analysis of this higher maintenance expenditure shows that a significant increase was due to OPEX-like individual projects. More specifically, the increase resulted from fault clearance based on findings of intelligent pigging operations and replacements at faulted facility crossings, what is – as indicating in the study he was also – “unusual high cost items”. In general terms, despite maintenance costs being internationally excessive, all other cost components are below the international average.
In summary, Friendship II crudeoil pipeline was operated at Manageable Non Volume Expenses higher than the international average.
The Hungarian product pipeline system was operated at overall costs lower than the international average. While maintenance costs were clearly lower, expenditure on operating staff was higher, the latter being due to a low level of automation.
Year 2004 Survey
Year 2006 Survey
Year 2004 Survey
Figure 7.
Figure 8.
Authority: Comparative Performance Analysis for Oil Pipelines and Terminals (Operating year 2004 and 2006) Author: Solomon Associaties Ltd.
Figure 9.
Year 2006 Survey
Figure 10.
Authority: Comparative Performance Analysis for Oil Pipelines and Terminals (Operating year 2004 and 2006) Author: Solomon Associaties Ltd.
Year 2004 Survey
Figure 11.
139
Workshop2008/3
In 2004, the Slovakian product pipeline system was operated at expenses higher than the international average, but this trend was reversed by 2006. A review of maintenance activities lead to significant savings as it revealed the inclusion of many non-maintenance components in Slovakian maintenance costs. Thus removed from maintenance expenses, such cost components were taken out of the scope of the benchmark survey. Although some efficiency improvement actions were also taken to reduce maintenance costs, the bulk of the change was due to the fact that such components were taken out of the survey and carried over under different cost items.
B ) T E R M I N A L S
Year 2006 Survey
Figure 12.
Authority: Comparative Performance Analysis for Oil Pipelines and Terminals (Operating year 2004 and 2006) Author: Solomon Associaties Ltd.
Figure 13.
Year 2004 Survey
Year 2004 Survey
Figure 14.
Authority: Comparative Performance Analysis for Oil Pipelines and Terminals (Operating year 2004) Author: Solomon Associaties Ltd.
Figure 15.
Year 2006 Survey
Year 2006 Survey
Figure 16.
Authority: Comparative Performance Analysis for Oil Pipelines and Terminals (Operating year 2006) Author: Solomon Associaties Ltd.
MOL Scientific Magazine
140
1MOL GROUP
2008/3Workshop
Pécs and Kapusany and Székesfehérvár were operated at overall expenses higher than the international average. At the same time, maintenance expenditure was lower. Expenditure on operating staff considerably exceeded the average, which is due to a lower level of automation. Szajol fulfilled well alone, what the single had examined "a bigger establishment, as we had indicated it earlier already.
5. Maintenance costs
Presented below are the changes in mainte-nance cost components in comparison to international figures.
Pipelines and terminals are shown one after the other too. For pipelines, 2004 and 2006 results are presented side by side. Such form of presentation is not possible for terminals, as the terminals surveyed were not the same.
Figure 17.
Year 2004 Survey
Year 2006 Survey
Figure 18.
Authority: Comparative Performance Analysis for Oil Pipelines and Terminals (Operating year 2004 and 2006) Author: Solomon Associaties Ltd.
Figure 19.
Year 2004 Survey
Year 2006 Survey
Figure 20.
Authority: Comparative Performance Analysis for Oil Pipelines and Terminals (Operating year 2004 and 2006) Author: Solomon Associaties Ltd.
Figure 21.
Year 2004 Survey
141
Workshop2008/3
A review of maintenance costs shows primarily that the number of working hours spent on maintenance work was above the average, with wage and benefits costs being well below it.
The proportion of maintenance materials costs is the highest for Friendship II, Pécs terminal putting up quite a good performance in 2004, and Székesfehérvár terminal in 2006.
From the total maintenance costs point of view, all surveyed units except for Friendship II performed better than the international average, where unusually high outgivings characterised year. This is indicative of a nearly optimum use of maintenance resources.
6. Summary
Benchmark surveys are not an end in themselves, and are worth nothing if results are not processed and used to improve efficiency and take process improvement actions.It is a matter of course that R&M Logistics has processed the results and, on that basis, defined required actions together with deadlines and responsibilities.
Year 2006 Survey
Figure 22.
Authority: Comparative Performance Analysis for Oil Pipelines and Terminals (Operating year 2004 and 2006) Author: Solomon Associaties Ltd.
Figure 23.
Year 2004 Survey
Year 2004 Survey
Figure 20.
Authority: Comparative Performance Analysis for Oil Pipelines and Terminals (Operating year 2004) Author: Solomon Associaties Ltd.
Figure 25.
Year 2006 Survey
Year 2006 Survey
Figure 26.
Authority: Comparative Performance Analysis for Oil Pipelines and Terminals (Operating year 2006) Author: Solomon Associaties Ltd.
MOL Scientific Magazine
142
1MOL GROUP
2008/3Workshop
Actions include but not limited to the following:
A ) P I P E L I N E S• Preparecasestudywithassistance
from external consultant (OLAJTERV) to identify opportunities to reduce expenditure on operating activities for the Hungarian pipeline system as well as the related organisation
• Preparecasestudywithassistancefrom external consultant (OLAJTERV) to identify opportunities to reduce expenditure on operating activities for the Slovakian pipeline system, as well as the related organisation
• Putinplaceatrialautomatedproductreceiving system at Csepel terminal
• Prepareinternalcasestudytoidentifyopportunities to reduce expenditure on maintenance staff and materials for crudeoil pipeline systems in Hungary and pipeline systems in Slovakia.
• Forthetimebeing,suchprojectswillcompete for resources in the contingency category, based on CF return
B ) T E R M I N A L S• Prepareinternalcasestudytoidentify
opportunities to reduce expenditure on operating activities
• Prepareinternalcasestudytoidentifyopportunities to reduce expenditure on administrative activities
• PrepareforextensionofMOLplc’spractice to Slovnaft terminals;
• Conductathoroughreviewofmaintenance practices in Slovakia, including time spent on maintenance work and materials used. Implement necessary improvements
• IncludeautomationprojectsinpipelinesCAPEX plan. For the time being, such projects will compete for resources in the contingency category, based on CF return
• Prepareinternalcasestudytoidentifyopportunities to reduce expenditure on non-maintenance employees as well as on maintenance activities in Fényeslitke
References
[1] Comparative Performance Analysis for Oil Pipelines and Terminals (Operating year 2004) Author: Solomon Associaties Ltd.
[2] Comparative Performance Analysis for Oil Pipelines and Terminals (Operating year 2006) Author: Solomon Associaties Ltd.
Revised by: Réka Kartal
143
After a long fight with his illness tolerated with high level of patience, László Kántor site manager of MOL Plc. Duna Refinery (retired in 2007) left us – a painfully early departure. His four-decade long professional career was fully associated with the Hungarian crude oil processing, and within that, with Százhalombat-ta, where he held higher and higher positions for the benefit of the domestic oil refining sector. He started his studies in 1964 at the present Pannon University (PU) as a full-time student and holder of a fellowship of the Duna Crude Oil Refining Co., at that time under construction and today is known as MOL Plc. Duna Refinery., In 1968 he joined the company. He spent four years in the dispatcher service, and thus could become familiar with the total operations of the refinery. In 1972 he was appointed as the manager of the oil distillation Plant 1., then in 1975 as the aromatic plant producing benzene-tolene-xylene and maleic acid anhydride. Within that he participated in the development and management of the new aromatics plant producing ortho-xylene and maleic acid anhydride. Then he worked as senior technologist and participated in various engineering, designing, commissioning, operational control, modernisation and pilot operation projects. He was also involved, inter alia, in complex utilisation and re-cycling of
refinery residues and process gases. Between 1985 and 1992 he was the manager of a plant group including several crude oil distillation units. In 1992 he was appointed as head of production department, then in 1994 as the chief engineer of the company. Between 2004 and middle of 2007 (when he went into retirement) he was the manager of the Refining Unit of Hungary. In this position he was rather engaged in coordination role, looking for inter-relations and conciliatory actions than purely professional issues. He had a major role in the development and introduction of the refinery information system. In addition to this day-to-day job, he earned a specialist and engineer-economist diploma through postgraduate training, in addition to the diploma of chemical sciences. He was member of the Veszprém Committee of the Hungarian Academy of Sciences. He was also a member of the team that developed several technical innovations and ten patents widely applied in the industry. His name is also recorded as an eminent expert in “mineral oil technology and petrochemistry” and “technology engineering”. He was several times member of the team awarded with prizes 1-3 in national professional competitions. He held several decorations and awards, including the MOL Oeuvre Prize in 2005, the Béla Péceli Award of the Chamber of Hungarian Engineers and also in 2007 the Ignác Pfeifer Award of the Hungarian Chemical Engineers Society. We lost an excellent man and eminent manager. He actively participated in bringing up young talents as successors, he was ready and pleased to pass on and transfer his knowledge and experiences onto the younger generation. At the request of PU and BME (Budapest University of Technology and Economics) he agreed to work as a consultant or member of the professional jury regarding the thesis and diploma works of many young graduated. He was widely known and recognised as demanding precisity and high-level performance in work. It is indeed fair to say that he knew the Duna Refinery probably the best. A large crowd of his family members, friends and colleagues bid the last farewell and paid respect to him at the Százhalombatta cemetery at the beginning of November. We will keep and cherish his memory.