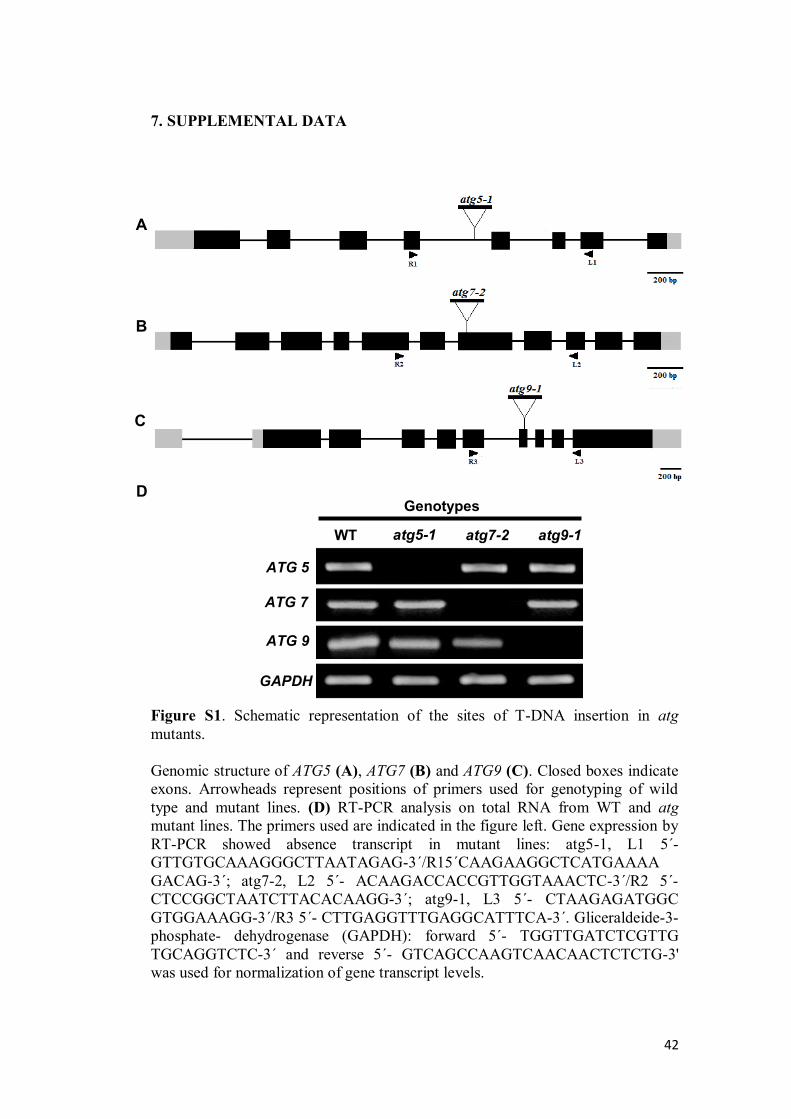
JESSICA ALINE SOUSA BARROS MOLECULAR AND METABOLIC RESPONSES ASSOCIATED WITH THE LACK OF AUTOPHAGY FOLLOWING ENERGY DEPRIVATION IN Arabidopsis thaliana Dissertation presented to the Universidade Federal de Viçosa, as part of the requirements of the Plant Physiology Graduate Program for obtention of the degree of Master Scientiae. VIÇOSA MINAS GERAIS - BRAZIL 2016
Transcript
JESSICA ALINE SOUSA BARROS
MOLECULAR AND METABOLIC RESPONSES ASSOCIATED
WITH THE LACK OF AUTOPHAGY FOLLOWING ENERGY
DEPRIVATION IN Arabidopsis thaliana
Dissertation presented to the
Universidade Federal de Viçosa, as
part of the requirements of the Plant
Physiology Graduate Program for
obtention of the degree of Master
Scientiae.
VIÇOSA
MINAS GERAIS - BRAZIL
2016
Ficha catalográfica preparada pela Biblioteca Central daUniversidade Federal de Viçosa - Câmpus Viçosa
T
Barros, Jessica Aline Sousa, 1991-B277m2016
Molecular and metabolic responses associated withthe lack of autophagy following energy deprivation inArabidopsis thaliana / Jessica Aline Sousa Barros. -Viçosa, MG, 2016.
v, 47f. : il. (algumas color.) ; 29 cm.
Orientador : Wagner Luiz Araújo.Dissertação (mestrado) - Universidade Federal de
Viçosa.Inclui bibliografia.
1. Metabolismo vegetal. 2. Metabolismo celular.3. Fisiologia vegetal. 4. Arabidopsis thaliana. 5. Mortecelular. I. Universidade Federal de Viçosa.Departamento de Biologia Vegetal. Programa de Pós-graduação em Fisiologia Vegetal. II. Título.
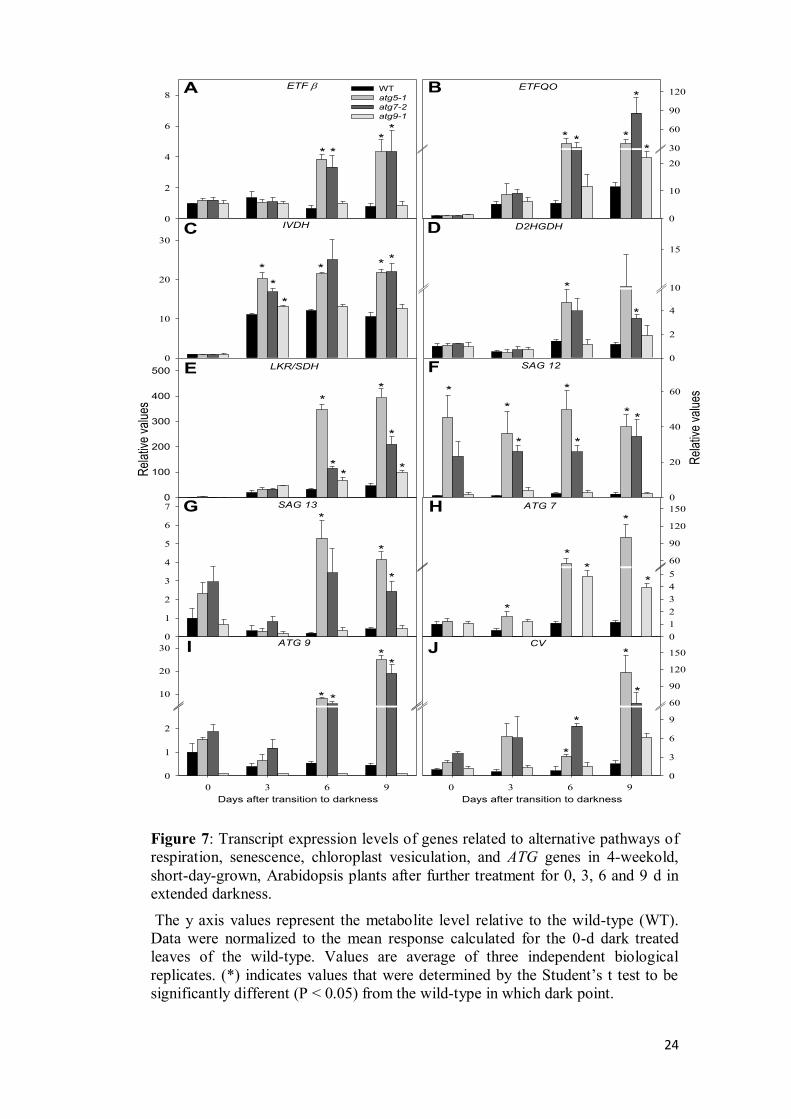
(ETF), and electron-transfer flavoprotein:ubiquinone oxidoreductase (ETFQO)
(Ishizaki et al., 2005, 2006; Araújo et al., 2010). Thus, firstly, we demonstrated
that in general the transcript levels of IVDH, ETFQO, ETFß and D2HGDH were
clearly induced in atg5-1 and atg7-2 in comparison to the levels observed in wild-
type plants while in atg9-1 mutants a mild induction was observed when
compared with the others atg mutants under extended-dark treatment (Figure 7).
More specifically, ETFß was only up regulated in atg5-1 and atg7-2 plants after 6
and 9 day of darkness with no changes observed in both wild-type and atg9-1
mutants plants (Figure 7A). In addition, ETFQO was up regulated following dark
treatment in all genotypes but more expressively in atg mutants after 6 d of
darkness (Figure 7B). Also, there was an early induction of IVDH transcripts in
both wild-type and atg mutants after 3 d of darkness (Figure 7C). Such strong
23
induction of IVDH reaching increments higher than 20-fold after 3 d of dark
transition reinforces its pivotal role in amino acids degradation (Araújo et al.,
2010; Peng et al., 2015). Given that Lysine catabolism can occur by either
D2HGDH or LKR/SDH (Engqvist et al., 2009, 2011, Galili, 2011; Kirma et al,
2012) we next decided to investigate the changes in the expression of those genes.
Similarly to the observed for the ETFß the expression of D2HGDH was only up
regulated in atg5-1 and atg7-2 plants after 6 and 9 day of darkness with no
changes in the other genotypes used here (Figure 7D). Interestingly, the
expression of LKR/SDH was strongly induced in all genotypes following dark
treatment with higher induction being observed in atg5-1 and atg7-2 after 6 and 9
d of darkness (Figure 7E). Our data also demonstrated a higher induction of
LKR/SDH (about 200-fold) than of D2HGDH (10-fold, Figure 7). Thus, it seems
tempting to speculate that Lysine degradation occurs preferably by LKR/SDH
pathway following extended dark conditions.
3.6 The lack of autophagy induces senescence and chloroplast degradation
events
Given that several senescence parameters are also induced in response to
darkness, we next investigated the expression of the commonly known
senescence-associated genes SAG12 and SAG13 during dark induced senescence.
Interestingly, although no changes in the transcript levels of both SAG12 and
SAG13 were observed in both wild-type and atg9-1 mutants plants following dark
treatment, the transcripts levels of SAG12 and SAG13 were highly induced in
atg5-1 and atg7-2 mutants in all times points analyzed (Figure 7F and 7G). Taken
together with chlorophyll content and Fv/Fm values, these results are in good
agreement with an early-senescence associated phenotype observed in those
genotypes.
24
ETF
0
2
4
6
8WT
atg5-1
atg7-2
atg9-1
ETFQO
0 3 6 9
0
10
20
30
60
90
120
D2HGDH
0
2
4
10
15
IVDH
0
10
20
30
* **
** * *
*
*
*
*
*
* * *
*
*
CV
Days after transition to darkness
0 3 6 9
0
3
6
9
60
90
120
150
SAG 12
Rel
ativ
e va
lues
0
20
40
60
ATG 7
0
1
2
3
4
5
60
90
120
150
ATG 9
Days after transition to darkness
0 3 6 9
0
1
2
10
20
30
*
*
*
*
*
**
**
*
*
*
*
*
*
*
SAG 13
0
1
2
3
4
5
6
7
*
*
*
* *
**
LKR/SDH
0
100
200
300
400
500
*
*
*
**
*
A B
C D
E F
G H
I J
Rel
ativ
e va
lues
Figure 7: Transcript expression levels of genes related to alternative pathways of
respiration, senescence, chloroplast vesiculation, and ATG genes in 4-weekold,
short-day-grown, Arabidopsis plants after further treatment for 0, 3, 6 and 9 d in
extended darkness.
The y axis values represent the metabolite level relative to the wild-type (WT).
Data were normalized to the mean response calculated for the 0-d dark treated
leaves of the wild-type. Values are average of three independent biological
replicates. (*) indicates values that were determined by the Student’s t test to be significantly different (P < 0.05) from the wild-type in which dark point.
25
To examine the changes associated with autophagy following dark
conditions, we next measured transcript levels of ATG7 and ATG9 genes. No
expression of ATG7 and ATG9 was observed in atg7-2 and atg9-1, respectively
(Figure 7H and I). It was additionally observed accumulation of ATG7 transcripts
in atg5-1 and atg9-1 mutants, whereas accumulation of ATG9 transcripts in atg5-1
and atg7-2 mutants was also similarly observed. In accordance, the increased of
autophagy transcripts in atg mutants during carbon starvation has been
extensively reported (Thompson et al., 2005; Rose et al., 2006; Phillips at al.,
2008), suggesting that expression of transcripts related with different steps of
autophagic process is upregulated by autophagic defect. In contrast, no induction
of those ATG genes was observed in wild-type plants during dark induced
senescence (Figure 7H and I).
Degradation of chloroplasts is assumedly one hallmark of both natural and
stress-induced plant senescence (Ishida et al., 2014), and autophagy is an
established cellular pathway involved in targeting chloroplast proteins for
degradation (Ishida et al., 2008; Wang et al., 2013; Ishida et al., 2014). Recently,
an autophagy-independent pathway for chloroplast degradation, the chloroplast
vesiculation (CV) which is associated with thylakoid and stroma proteins
degradation, was unequivocally demonstrated (Wang and Blumwald, 2014). Thus,
we further investigated the expression of CV gene during our experimental
conditions. Interestingly, it was observed an expressive higher induction of CV
gene expression in atg5-1 and atg7-2 mutants under dark induced senescence (110
and 60-fold after 9 days of darkness, respectively), while the transcripts levels
remained virtually constant in wild-type plants with relatively minor induction in
atg9-1 mutants (Figure 7J).
26
4. DISCUSSION
During the last decade we have witnessed a growing body of evidence
showing the function of autophagy in nutrient recycling under energy-limited
conditions (Thompson et al., 2005; Phillips et al., 2008; Chung et al., 2010; Izumi
et al., 2010). Thus, although the connection between autophagy, protein
degradation and amino acid availability during energetic limitation has been
recently demonstrated (Izumi et al., 2013; Avin-Wittenberg et al., 2015) our
current understanding of the precise metabolic process involved in energy supply
following carbon starvation remains fragmented. Here, by using a range of
biochemical and molecular tools coupled with the use of T-DNA insertional lines
we provided further evidence of the importance of autophagy in governing a
highly exquisite metabolic reprogramming allowing the supply of energy during
both carbon starvation and developmental stages of plant life cycle.
By using previous characterized autophagy deficient mutants we first
provide further evidence that this process impacts both vegetative and
reproductive development. Growth parameters evaluated by rosette area, fresh and
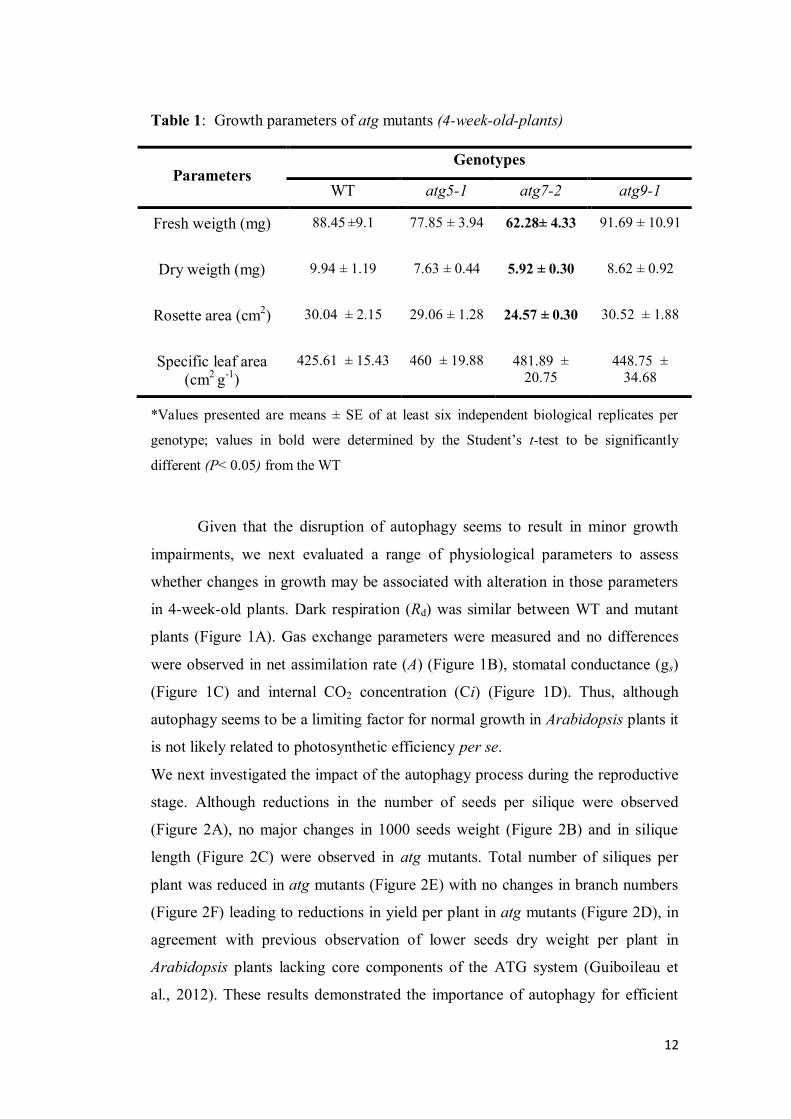
dry weight were smaller in atg7-2 mutant (Table 1). This growth impairment did
not seem to be associated with alterations in photosynthetic or dark respiration
rates that were not affected in atg mutant but it rather seems to be intriguingly
associated with metabolic effects. In good agreement, growth inhibition has also
been observed in atg mutants grown under both short day conditions and mineral-
rich medium without sucrose, providing a mechanism where autophagic process
operates in nighttime energy availability and sustain growth (Izumi et al., 2013).
Regarding the importance of autophagy during the reproductive stage, it was
observed that the lack of autophagic process culminates with a negative impact in
seed production (Figure 2D). Thus, atg mutants have reduced number of seeds per
silique and therefore atg5-1 shows the lower seed yield followed by atg7-2 and
atg9-1 (Figure 2). Remarkably, lower seed yield in conjunction with deficiency of
nitrogen remobilization has been previously demonstrated in atg mutants (Avila-
Ospina et al, 2014). The results obtained here are in good agreement with the
pivotal importance of amino acid catabolism to the seed energy status (Galili and
Amir, 2013). Furthermore, the blockage of leucine catabolism in 3-methylcrotonyl
27
CoA carboxylase (MCCAse) loss-of-function plants diminished both seed
germination and seed yield in Arabidopsis thaliana (Ding et al., 2012). Thus, it
seems highly tempting to suggest that the impaired reproductive growth
phenotype observed in atg mutants can be at least partly associated with
impairment of protein degradation that compromises remobilization processes and
amino acid metabolism. Furthermore, our results strongly suggest that autophagy
is necessary for efficient seed production under optimal conditions. Functional
relationship between energetic metabolism, seed production, and autophagy itself
will need to be further investigated in future studies.
Despite the function of autophagy during plant developmental processes,
our main goal here was to enhance our understanding of the metabolic implication
of autophagy following carbon starvation and its impact on energetic pathways.
The first evidence for the importance of autophagy function was the early onset of
dark-induced senescence observed in atg mutants accompanied by chlorophyll
and photosynthetic competence losses under extended darkness (Figure 3).
Interestingly atg7-2 and atg5-1 mutants exhibit a stronger phenotype than atg9-1
mutant, which seems to be associated with the degree of autophagy impairment in
each mutant line. Arabidopsis mutants atg7-2 and atg5-1 were previously
characterized by full inhibition of autophagy while atg9-1 presented only a
reduction of autophagic bodies occurrence (Thompson et al., 2005; Shin et al.,
2014). In agreement with the phenotype observed, senescence-associated genes
such as SAG12 and SAG13 were up regulated in atg mutants during dark
treatment, with no changes being observed in wild-type plants (Figure 7). It
should be noted that SAG12 appears to be closely linked to natural senescence and
chlorosis whilst a range of stress are unable to induce it (Noh and Amasino, 1999;
Grbić, 2003). Considering that we used 4-week-old plants and that wild-type
plants started to show few signs of senescence from 12 d of darkness onwards, it
is reasonable to assume that this mild status of induced senescence experimented
for wild-type plants was not sufficient to induce SAG12 and SAG13 transcripts. In
good agreement younger darkened plants also presented lower expression levels
of SAG12 and SAG13 when compared to older leaves (Weaver and Amasino,
2001), characterizing an age-mediated response of those transcripts. It is
28
important to mention that SAG12 and SAG13 expression has also been shown to
be partly dependent on the Salicylic acid (SA) pathway (Morris et al., 2000; Zhao
et al., 2016) and that autophagy negatively regulates SA signaling and
accumulation (Yoshimoto et al., 2009). That said, the up regulation of SAGs
transcripts can be at least partially associated with the accumulation of SA that is
usually observed in atg mutants. In agreement with our results, Yoshimoto et al
(2009) noticed that atg5 mutants accumulate SA and the senescence marker gene
SAG12 is expressed before showing any visible senescence phenotype. The
induction at transcriptional level of autophagic process has been observed in
response to nutrient starvation (Thompson et al., 2005; Rose et al., 2006; Osuna et
al., 2007), however, the abundance of these transcripts appears to be differentially
regulated by extended darkness (Rose et al., 2006; Philips et al., 2008; Chung et
al., 2010). Despite a higher induction of ATG9 and ATG7 genes verified in atg
mutants under dark treatment, the levels remained virtually constant in wild-type
plants (Figure 7H-I). In fact, it has been reported that ATG genes involved in
different steps of autophagic process may show distinct pattern of expression
under energy deprivation (Thompson et al., 2005; Rose et al., 2006; Phillips et al.,
2008). In this scenario, further gene expression analysis of other ATG genes are
required to ascertain whether the whole pathway of autophagy is induced
following carbon starvation and which ATG genes are more strictly associated in
this response in wild-type.
Hypersensitivity to carbon limited conditions is a classical response of atg
mutants in plants (for review see Li and Vierstra, 2012; Liu and Bassham, 2012;
Avila-Ospina et al., 2014); however, little is currently known about the metabolic
reprogramming that underlies this intriguingly behavior. Here, we used dark
extended conditions as our model systems for studying the association between
autophagy and alternative pathways of respiration. Thus far, although the
metabolic responses of autophagy have only being obtained using nitrogen or
carbon starvation associated with starch impairments (Izumi et al., 2013;
Guiboileau et al., 2013; Masclaux-Daubresse et al., 2014) the closest link to
alternative pathways of respirations remains far from clear. Thus, analysis of
primary metabolites showed a strong decrease of sugars and starch within the first
29
3 d of darkness, indicating that carbohydrates are completely consumed into the
first days of dark-extended treatment (Figure 4A-D). Interestingly, a subset of
organic acids exhibited a biphasic behavior during prolonged exposure to
darkness in atg mutants. This was particularly noticeable for some TCA cycle
intermediates, including fumarate, malate, citrate, and oxoglutarate, which
accumulated after 6 d of dark treatment despite decreasing during the first 3 d
(Figure 4 and 5). Remarkably, the impairment in starch degradation observed in
atg mutants following extended darkness resulted in minor levels of sugars
(Figure 4D). These results alongside with the fact that autophagy has previously
been associated with leaf starch degradation at the end of the night (Wang et al.
2013), strongly suggests that autophagy also plays a major role in starch
degradation during prolonged carbon-limited periods. Moreover, the changes
observed in TCA cycle intermediates are in good agreement with previously
results obtained with mutants for the ETF/ETFQO pathway and its alternative
associated dehydrogenases under dark-induced senescence (Ishizaki et al., 2005;
Ishizaki et al., 2006; Araujo et al., 2010), suggesting that impairments in
respiratory metabolism are also present in atg mutants. This fact notwithstanding
the organization and flux of organic acid metabolism in plants is highly dependent
on the metabolic and physiological demands of the cell (Sweetlove et. al, 2010).
Thus, it is reasonable to suggest that these changes can be consequence of an
impairment of TCA cycle or reduction of biosynthetic reactions (Ishizaki et al.,
2006; Araújo et al., 2010). Increased levels of aspartate were also observed in atg
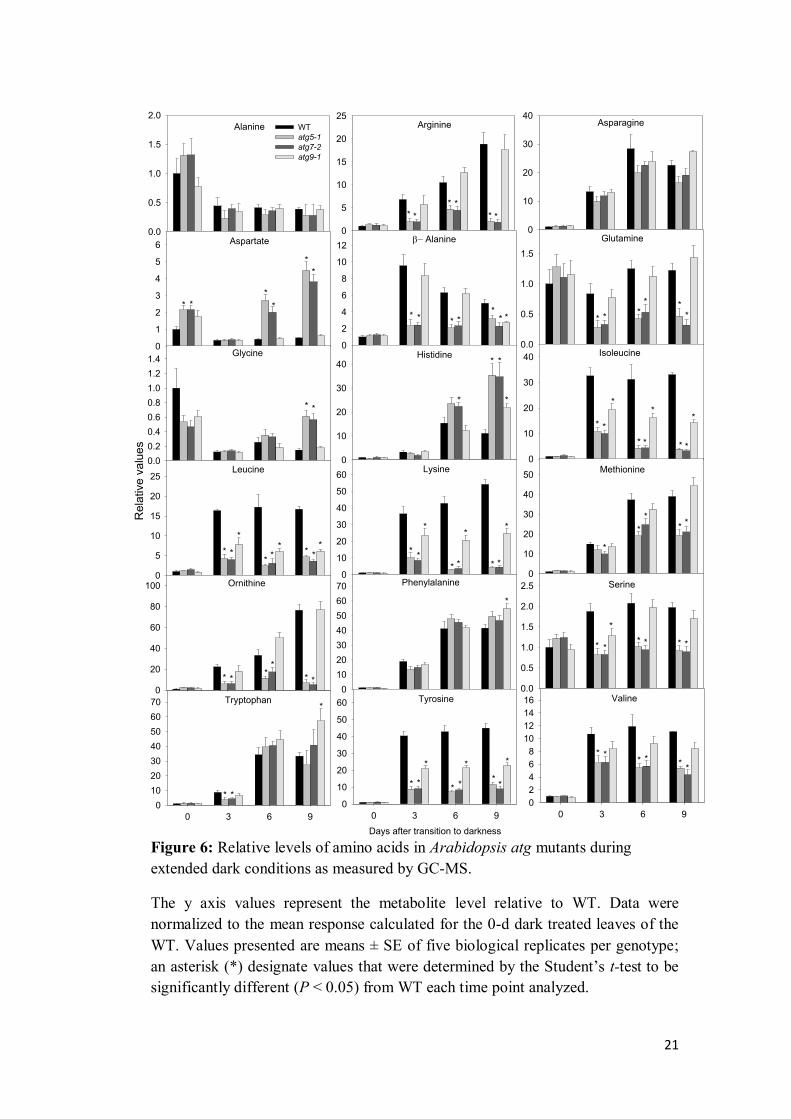
mutants after 3 d of darkness (Figure 6). It is well known that plants usually adjust
their metabolism suppressing genes of biosynthetic enzymes of amino acids to
conserve energy under limited conditions (Baena-Gonzalez and Sheen, 2008;
Bunik and Fernie, 2009; Sulpice et al., 2009). Moreover, aspartate is involved in
the biosynthesis of lysine, threonine, methionine, and isoleucine (Azevedo et al.,
2006). Thus, aspartate accumulation may indicate a decrease in pathways of
amino acids synthesis (see Kirma et al., 2012), reinforcing the motion of a general
state of down regulation in biosynthetic pathways in atg mutants following
darkness conditions.
30
During carbon starvation proteins are degraded and the complete oxidation
of their amino acids produces energy required to fuel metabolic demands
(Hildebrandt et al., 2015). Our results demonstrated the concomitantly reduction
of protein levels coupled with increased of total amino acid content during
extended darkness (Figure 4), exactly as observed in other studies involving
amino acids metabolism under other stress conditions (Dietrich et al., 2011; Pires
et al., 2015). Although this general metabolic response was observed for all
genotypes used here, it was observed that atg mutants presented a significantly
less pronounced reduction in protein content in accordance with the fundamental
role of autophagy process in maintenance of protein breakdown (Araújo et al.,
2011; Michaeli et al., 2016). By contrast, the content of free amino acids
increased much more in atg mutants under prolonged darkness. In accordance, an
over-accumulation of total amino acids was also observed in atg mutants under
nitrogen starvation (Masclaux-Daubresse et al., 2014). Usually, higher levels of
amino acid have been associated with proteolysis events during several stress
conditions (Usadel et al., 2008; Obata and Fernie et al., 2012). However, pool
sizes of free amino acids not only depend on the relative rate of amino acid
anabolism or catabolism, but also rely on protein degradation and biosynthesis
(Obata and Fernie, 2012; Hildebrandt et al., 2015). In this scenario, our metabolite
profiling analysis provided an overview of the impact of extended darkness on
distinct amino acids. Interestingly, the levels of the majority of the amino acids
generally increased within the first 3d of darkness, albeit to a lesser extent in atg
mutants (Figure 6). The reduced relative levels of free amino acids found in atg
mutants compared with wild-type levels, particularly of those associated with
electron donors to the TCA cycle and mitochondrial electron transport chain
under carbon starvation as observed previously (Araújo et al., 2010), are likely
result of altered mitochondrial function under carbon starvation. Similar results
have been previously observed in Arabidopsis seedling following carbon
starvation (Avin-Wittenberg et al., 2015). Furthermore, these results also suggests
that the higher content of total amino acids observed in atg mutants result from
levels of aspartate, histidine, phenylalanine and tryptophan that substantially
increased during prolonged darkness.
31
Since BCAA, aromatic amino acids, and lysine have been substantially
characterized as substrates to energy provision through alternative pathways of
respiration (Ishizaki et al., 2005, 2006; Araújo et al., 2010), we paid particular
attention to the response of those amino acids (Figure 6). Our findings
demonstrated that following dark treatment increases in those amino acids were
partially compromised in atg mutants in comparison with wild-type plants (Figure
6). It has been previous demonstrated that BCAA are able to sustain respiration
during carbon starvation both by feeding electrons directly to the mitochondrial
electron chain and by providing TCA cycle intermediates following their
degradation (Araújo et al., 2011). Thus, it seems reasonable to suggest that
functional autophagy is required to allow the provision of energetic substrates
during carbon starvation. This finding is further supported by the significantly
transcript induction of genes involved with alternative respiration (ETFβ, ETFQO,
IVDH, D2HGDH) and with lysine catabolism (LKR/SDH) in atg mutants
following extended darkness (Figure 6). The up-regulation of alternative pathways
indicates higher amino acids oxidation resulting in reduced levels of amino acids
as observed in atg mutants. Support to this claim comes also from another study
with carbon starved seedling of atg mutants (Avin-Wittenberg et al., 2015)
showing that an enhancement of carbon flow is directed through the TCA cycle in
those mutants. However, considering the hypersensitivity response of atg mutants
to prolonged darkness, the catabolism of these amino acids seems not to be
sufficient to maintain proper metabolism during carbon starvation. Taken
together, the results presented here indicates that proper function of autophagy is
responsible, at least in some extent, for the release of these amino acids in
response to carbon starvation. Thus, despite the up regulation of alternatives
pathways of respiration, the levels of amino acids that can provide energy is
substantially reduced in atg mutants. Although the molecular mechanisms
involved in the regulation of amino acid metabolism are largely unknown
(Hildebrandt et al, 2015), the elucidation of the mechanism behind such interplay
between autophagy and the catabolism of protein and amino acids remains as
important areas of research that should be addressed in future.
32
In agreement of up-regulation of of several genes related with the
ETF/EFTQO in atg mutants (Figure 7), it has been previously demonstrated that
the genes associated with the ETF/ETFQO pathway are clearly induced in wild-
type plants following water stress (Pires et al., 2016). Altogether these results
indicate a good co-expression amongst the genes of this pathway, as previously
observed, particularly under stress conditions (Araújo et al., 2011). Moreover, we
also found an intense up regulation of CV gene in atg mutants following carbon
starvation (Figure 7). Accordingly, the degradation of chloroplasts is assumedly a
hallmark of both natural and stress-induced plant senescence, and furthermore the
role of autophagy in this process is well known (Ishida et al., 2008; Liu and
Bassham, 2012; Izumi et al., 2015; Xie et al., 2015). However, an autophagic-
independent process of chloroplast degradation associated with the CV pathway
has been recently demonstrated (Wang and Blumwald, 2014). Interestingly, our
results suggest that CV is highly induced in the absence of autophagy contributing
with the early senescence phenotype observed in atg mutants. It is worth to
mention that the disruption of CV has been associated with increased chloroplast
stability delaying induced senescence and enhancing tolerance to abiotic stress
whereas overexpression caused premature leaf senescence in A. thaliana (Wang
and Blumwald, 2014). Thus, it seems tempting to suggest that this autophagy
independent process of chloroplast degradation can have a substantially different
function during conditions in which photosynthesis and chloroplast activity is not
required such as dark-induced senescence. Following this assumption CV and
autophagy pathways might interact to ensure chloroplast degradation during
energy limited conditions. In summary, although our results provide only
circumstantial evidence, they clearly highlight compensatory mechanisms where
the chloroplast vesiculation pathway is induced during catabolic events in which
autophagy is disrupted. However, the mechanisms underlying the possible
interaction between the processes of autophagy and CV dependent degradation
during carbon starvation are mostly unknown and clearly deserve further
investigation.
33
Figure 8: Schematic model showing the association of catabolic process involved
in macromolecules degradation leading to electron donation to the ETF/ETFQO
pathway during dark-induced senescence in WT plants (A) and atg mutants (B).
Carbon starvation conditions promoted by extended darkness are associated with
macromolecules degradation including protein via several catabolic pathways
(e.g. autophagy) releasing amino acids to be oxidized. The electrons generated are
transferred to the respiratory chain through the ubiquinol pool via the
ETF/ETFQO system, promoting plant survival. In atg mutants there is a
compromised amino acid supply, particularly BCAA and lysine, previously
recognized to be able to feed electrons to the ETF/ETFQO system.
Simultaneously, there is a higher induction of genes associated with the
ETF/ETFQO pathways and the autophagy independent for chloroplast
degradation, the CV, which leads to an inefficient energy provision leading to a
hypersensitivity response to energetic limitations in atg mutants.
34
5. CONCLUSION
In this study we presented compelling evidence that autophagy has an
important role in sustain energetic requirements in either developmental stages or
during carbon deprivation conditions in A. thaliana. Although the impairment of
growth observed is not related with changes in both photosynthesis and
respiration, it is noteworthy that reduction in seed yield in atg mutants strongly
reinforces the significant contribution of autophagy to metabolic process affecting
plant developmental fitness. Furthermore, during prolonged darkness conditions
impairments of protein degradation and amino acid release experienced by
autophagy mutants culminates with a more critical status of energy deprivation
and resulted in a hypersensitive phenotype in A. thaliana. This assumption is
further supported by relatively minor increases in the levels of several amino acids
which can be used as alternative substrates to mitochondrial respiration. However,
despite the higher up regulation of genes related to alternative pathways of
respiration, the supply of amino acids seems not to be enough for maintenance of
energetic metabolism in atg mutants. Collectively, this energetic depletion may
favor an induction of other catabolic pathways including the degradation of
chloroplastidic proteins that is independent of autophagy such as the CV. Taken
together, the phenotypic, metabolic and transcriptional results presented here
coupled with the previously recognized connections between autophagy,
alternative pathways of respiration, and chloroplast recycle (Izumi et al., 2010;
Araujo, 2011; Izumi, et al., 2013; Xie et al., 2015) highlights the complexity and
specificity of plant metabolism in response to carbon limitation and suggest a
complex interplay involved in plant respiration and autophagy regulation.
Dissecting these mechanisms is clearly required to fully understand the key
components underlying the implications of autophagy on energetic processes in
plant metabolism. From a biotechnological perspective, understanding these
mechanisms may facilitate strategies for crop improvement towards enhanced
stress tolerance. Functional genomics coupled with omics tools hold considerable
promise for understanding these highly regulated processes.
35
6. REFERENCES
Araújo WL, Ishizaki K, Nunes-Nesi A, Larson TR, Tohge T, Krahnert I, Witt S, Obata T, Schauer N, Graham IA, Leaver CJ, Fernie AR (2010)
Identification of the 2-hydroxyglutarate and isovaleryl-CoA dehydrogenases
as alternative electron donors linking lysine catabolism to the electron
transport chain of Arabidopsis mitochondria. Plant Cell 22: 1549-1563.
Araújo WL, Tohge T, Ishizaki K, Leaver CJ, Fernie AR (2011) Protein
degradation - an alternative respiratory substrate for stressed plants. Trends
in Plant Science 16: 489–498.
Arnon DI (1949) Copper enzymes in isolated chloroplasts. Polyphenoloxidase in
Beta vulgaris. Plant physiology 24:1-
Arvidsson S, Kwasniewski M, Riano-Pachon DM, Mueller-Roeber B (2008)
QuantPrime-a flexible tool for reliable high-throughput primer design for
quantitative PCR. BMC Bioinformatics 9:465.
Avila-Ospina L, Moison M, Yoshimoto K, Masclaux-Daubresse C (2014)
Autophagy, plant senescence and nutrient recycling. Journal of Experimental
Botany 65:3799–3811.
Avin-Wittenberg T, Bajdzienko K, Wittenberg G, Alseekh S, Tohge T, Bock R, Giavilasco P, Fernie AR (2015) Global analysis of the role of autophagy
in cellular metabolism and energy homeostasis in Arabidopsis seedlings
under carbon starvation. The Plant Cell 27: 306–22.
Azevedo RA, Lancien M, Lea PJ (2006) The aspartic acid metabolic pathway,
an exciting and essential pathway in plants. Amino Acids 30:143–162
Baena-González E, Rolland F, Thevelein JM, Sheen J (2007) A central
integrator of transcription networks in plant stress and energy signalling.
Nature 448: 938–942.
Baena-González E, Sheen J (2008) Convergent energy and stress signaling.
Trends Plant Science 13: 474–482.
Bassham, DC (2009). Function and regulation of macroautophagy in plants.
Biochimical Biophysica Acta 1793: 1397–1403.
Buchanan-Wollaston V, Page T, Harrison E, Breeze E, Lim PO, Nam HG,
Lin JF, Wu SH, Swidzinski J, Ishizaki K, Leaver CJ (2005) Comparative
transcriptome analysis reveals significant differences in gene expression and
signalling pathways between developmental and dark/starvation induced
senescence in Arabidopsis. Plant Journal 42: 567–585.
Bunik VI, Fernie AR (2009) Metabolic control exerted by the 2-oxoglutarate
dehydrogenase reaction: a cross-kingdom comparison of the crossroad
between energy production and nitrogen assimilation. Biochemical Journal