51
Molecular Imaging: Biomarkers for Oncology Steven M. Larson, M.D Nuclear Medicine Svc, Department of Radiology MSKCC, NY NY

Molecular Imaging: Biomarkers
for Oncology
Steven M. Larson, M.D
Nuclear Medicine Svc, Department of Radiology
MSKCC, NY NY

Molecular Imaging in
Oncology
Imaging the key molecules or
molecular based events that are
fundamental to the malignant state

Biomarkers
• Biomarkers are biologic indicators of disease or therapeutic effects, which can be measured through dynamic imaging tests, as well as tests on blood, tissue and other biologic samples.
• (Oncology Biomarker Qualification Initiative (OBQI ), a joint enterprise of US FDA, NCI and CMS)

Why Now, Why Biomarkers?
• The search for biomarkers as endpoints of clinical trials to help reduce the growing cost of obtaining new drug approvals.
• Dissatisfaction with the classical anatomic based imaging methods for assessing treatment response assess such as WHO criteria, or RECIST;
• For Imaging, PET/CT and FDG in oncology, and the major role of FDG, as a measure of glycolysis, in cancer management

Oncology Biomarker Qualification
Initiative (OBQI)
• “Biomarkers are indicators of disease or
therapeutic effects, which can be measured
through dynamic imaging tests, as well as tests
on blood, tissue and other biologic samples.”
• NCI,FDA, CMS memorandum of understanding
• Cooperate closely with industry
• http://www.fda.gov/oc/mous/domestic/FDA-NCI-
CMS.html

Potential Benefit of Biomarkers in
Clinical Trials
• Determine if patient’s tumor is likely to respond at all to specific treatments
• Assess after 1 or 2 treatments if a tumor is dying, even if it is not shrinking in size.
• Determine which patients are at high risk for their patient recurring after surgery
• Efficiently evaluate whether an experimental therapy is effective for tumor treatment

The 1997 FDAMA Act and key
FDA approvals made possible
PET FDG Reimbursement in
oncology and cardiology
Spurred major technologic development over the last decade, including PET/CT and many new
molecular imaging agents

PET/CT in Cancer Care:
Combines 2 high resolution
diagnostic imaging methods
Positron Emission Tomography (PET)Biochemistry and Function
Computerized Tomography (CT)
Anatomy and Structure

Discovery ST
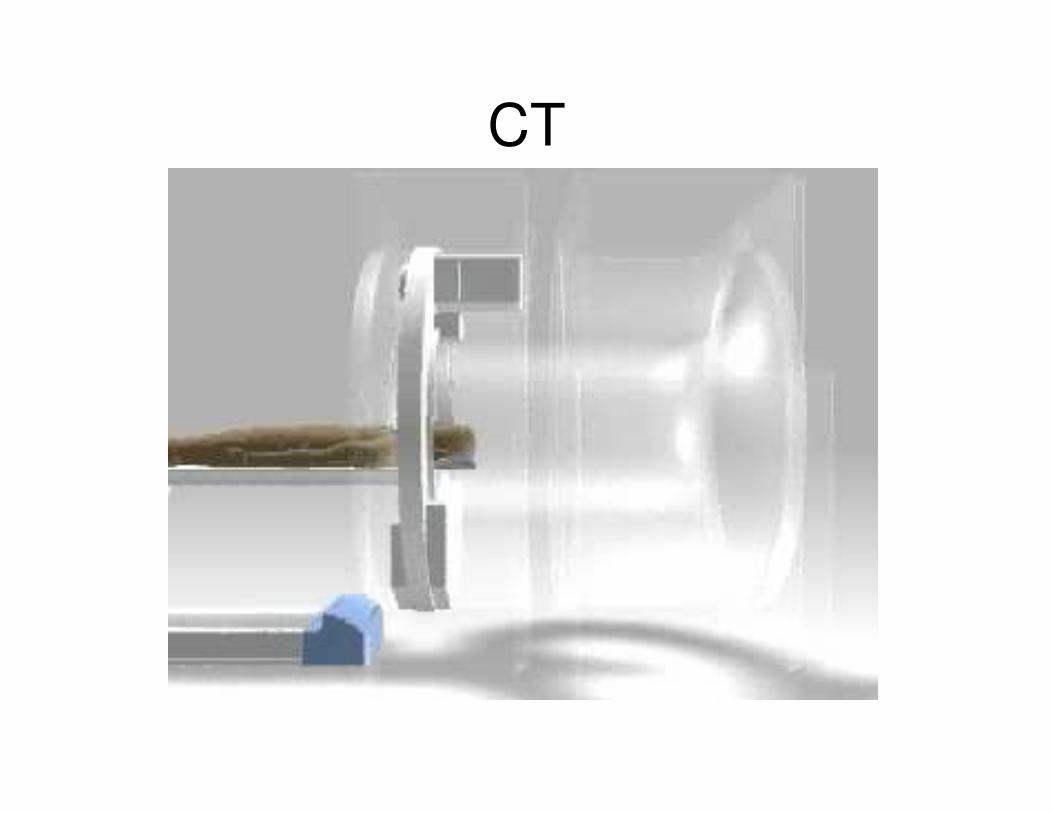
CT

PET-CT

PET FDG as Biomarker
Larson SM and Schwartz LH: 18F-FDG PET as a candidate for "qualified biomarker": functional assessment of treatment response in oncology.J Nucl Med. 2006 Jun;47(6):901-3.

Current Candidate Biomarker
• 2-Flouro-2-D-deoxy glucose
– [18F]FDG is a positron emission tomography
(PET) drug used in diagnostic imaging. On
March 10, 2000, FDA announced [18F]FDG
to be safe and effective for certain indications
when produced under conditions specified in
approved applications (see Federal Register,
Vol. 65, No. 48, 12999-13010).

Current Candidate Biomarker
• 2-Flouro-2-D-deoxy glucose– [18F]FDG is indicated in positron emission tomography (PET)
imaging for (1) assessment of abnormal glucose metabolism to assist in the evaluation of malignancy in patients with known orsuspected abnormalities found by other testing modalities, or inpatients with an existing diagnosis of cancer; (2) patients withcoronary artery disease and left ventricular dysfunction, when used together with myocardial perfusion imaging, for the identification of left ventricular myocardium with residual glucose metabolism and reversible loss of systolic function; and (3) patients for the identification of regions of abnormal glucose metabolism associated with foci of epileptic seizures.

Imaging Treatment Response:
tyrosine kinase inhibitors
18F-FDG in GIST tumors treated with Glivec, an bcr/abl,c-
kit,PDGFR kinase inhibitor

686140Feb 26, 2001
GI Stromal Tumor (Pre-therapy with STI-571)

686140June 7, 2001 (CT May 4, 2001)
GI Stromal Tumor (Post-therapy STI-571)

SUV
Activity per unit volume
Injected Activity/Body Wt*
*also, lean body mass, BSA, etc

PET imaging and Tumor Response
920 citations in medline*
• Breast Cancer
• NSCLC
• Lymphoma
• Esophageal
• Gastric
• Head and Neck
• Brain Tumor
• Etc.
* Dec 3, 2004

PET/CT Function/Structure

Exploratory IND
Phase 0 testing

Exploratory IND*
• Determine whether a mechanism of action defined in experimental systems can also be observed in humans (a binding property of inhibition of an enzyme)
• Provide important information on PK
• Select the most promising compound from a group of candidates designed to interact with a particular therapeutic target in humans based on PK or PD properties.
*Guidance for Industry, Investigators and Reviewers.. Jan 2006
USFDA URL http://www.fda.gov/cder/guidance/7086fnl.pdf

Exploratory IND
• Studies can be performed at “Microdose” levels, ie <1/100th of a pharmacologic dose, or <100 µgms, for biologicals, <30 nM
• Toxicity studies in animals should be 100X the dose in humans administered on a BSA basis – observe for 14 days, weight, chem, heme
– Necropsy @ 2 days for histopathology

HSP 90 : a target for chemo
Critical Chaperone Function
e.g. Her 2, AR, AKT

Ansamycins bind to the ADP\ATP switch site in Hsp90
O
NH
Me OMeMe
OMe
O
Me
MeO
OHO
O
NH2
H3CO
Geldanamycin (GM)
NH
Me OMeMe
OMe
O
Me
O
MeO
OHO
O
NH2
HN
17-AAG

Patient 30617AAG/Herceptin Phase 117AAG/Herceptin Phase 1
HER2+ Breast cancer with active sites of disease including the lung and bone. Previously
treated with 3 different trastuzumab-containing combinations, progressing on bevacizumab
plus trastuzumab prior to enrollment on the trial. Confirmed PR by RECIST.
5 April 2005 1 June 2005
Modi et al., Abstract 501, ASCO 2006
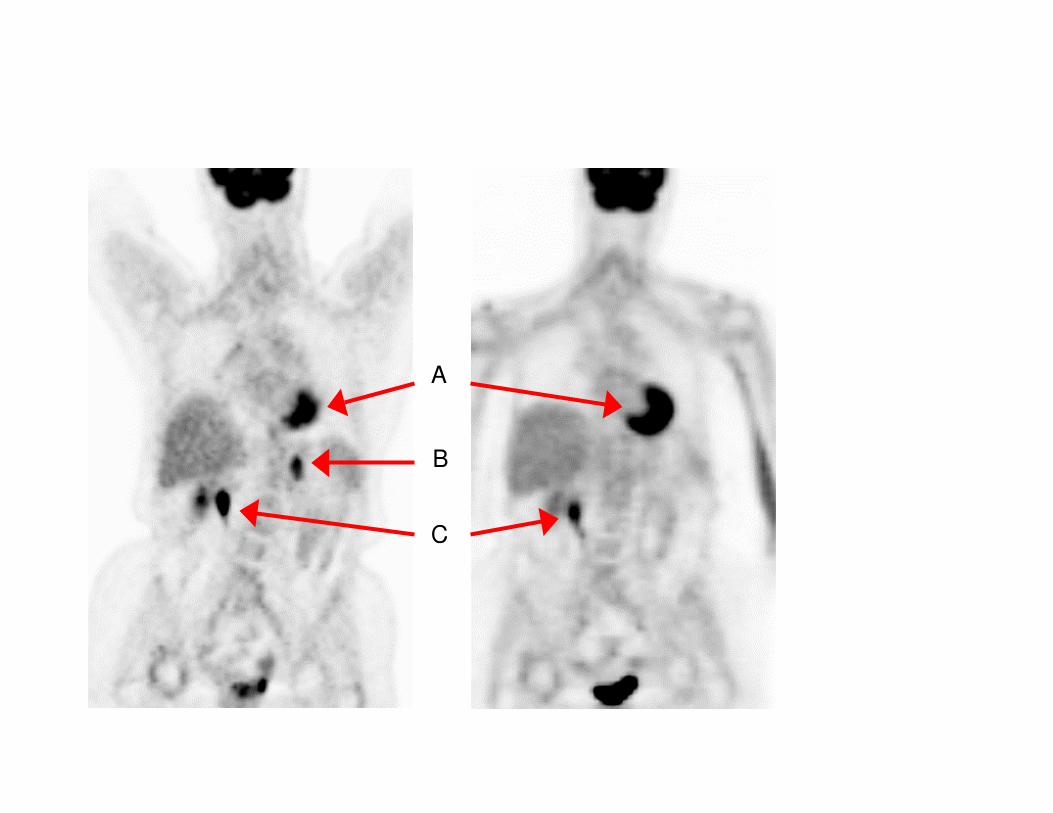
Metastatic Breast Cancer
12/28/04 3/17/05
A
B
CA – heart
B – left adrenal
metastasis
C – right
kidney
Solit, Rosen et al

Herceptin as a Phase 0 Imaging
Example.
Phase 0 Trials in Oncology Drug
Development
Steven M. Larson, M.D
Nuclear Medicine Svc, Department of Radiology
MSKCC, NY NY

Pharmacodynanmics
Targeted Therapies: Inhibition of signal transduction

68Ga (Fab’2) Herceptin
Imaging Biomarker for Her 2 receptor expression in vivo


Imaging Her-2 Expression
• Ansamycins, which target HSP-90, induce Her-2 Degradation
• 15-20% response in Breast Ca with anti-her2 monoclonal antibody, Herceptin

Imaging her-2 expression in
vivo68Ga-(Fab’2) herceptin
Virtual Immunohistology (VIH):
Non-invasive imaging of tumor antigen expression in the living
organism
Smith-Jones et al: Nat Biotech.. 2004 Jun;22(6):701-6.

Targeted Radiopharmaceutical
Therapy
• Antibody Forms
– Intact Antibody
– Fab’2
– Fab
– sFv
– Diabody (sFv)2
– MinibodyIntact Ab
150 kDa
F(ab’)2
120 kDa
Minibody
(scFv -CH3)2
80 kDa
VLVH
CH3
scFv
28 kDa
VL VH
Diabody
(scFv )2
55 kDa
VL VH
CH2
CH1
VLVH
Ck
CH3
Courtesy Anna Wu, City of Hope Med Ctr
Intact Ab
150 kDa
F(ab’)2
120 kDa
Minibody
(scFv -CH3)2
80 kDa
VLVH
CH3
Minibody
(scFv -CH3)2
80 kDa
VLVH
CH3
scFv
28 kDa
VL VH
scFv
28 kDa
VL VH
Diabody
(scFv )2
55 kDa
VL VH
Diabody
(scFv )2
55 kDa
VL VH
CH2
CH1
VLVH
Ck
CH3
Courtesy Anna Wu, City of Hope Med Ctr
Intact Ab
150 kDa
F(ab’)2
120 kDa
Minibody
(scFv -CH3)2
80 kDa
VLVH
CH3
scFv
28 kDa
VL VH
Diabody
(scFv )2
55 kDa
VL VH
CH2
CH1
VLVH
Ck
CH3
Courtesy Anna Wu, City of Hope Med Ctr
Intact Ab
150 kDa
F(ab’)2
120 kDa
Minibody
(scFv -CH3)2
80 kDa
VLVH
CH3
Minibody
(scFv -CH3)2
80 kDa
VLVH
CH3
scFv
28 kDa
VL VH
scFv
28 kDa
VL VH
Diabody
(scFv )2
55 kDa
VL VH
Diabody
(scFv )2
55 kDa
VL VH
CH2
CH1
VLVH
Ck
CH3
Courtesy Anna Wu, City of Hope Med Ctr

Quantitation of Antigen In-vivo
with β+ labeled antibodies
∆Uptake = ∆[Ag]68Ga-(Fab’)2
anti-p185HER2 (humanized 4DT:
Herceptin)

Pre
Treatment
T=0 hours
MicroPET images obtained 3 hours post injection with 68Ga-
F(ab)2-Herceptin in a mouse with a BT 474 breast tumor
Post 17 AAG
Treatment
T=24 hours

0 5 10 15 20 25
0.03
0.04
0.05
0.06
0.07
0.08
0.09
0.10
0.111
2
A
BControls
17AAG
Treated
Mic
roP
ET
Up
tak
e (
ac
tiv
ity/u
Ci in
j)
Time (hours)
Gallium-68 herceptin imaging
of her-2

Western Blot Analysis of HER2 Protein Expression by Tumors Recovered from Control Animals or Animals
Treated with 17AAG.

0 20 40 60 80 100
0
100000
200000
Saturation Binding of DOTA-Herceptin to BT474 cells
7/31/02 Group 2: 500 nM NSC 17AAG 18 hours
Data: Data4_E
Model: saturation
Bmax 236000 ±5000
Kd 6.33 ±0.43
67G
a-D
OT
A-H
erc
ep
tin
Bo
un
d (
sit
es
/ce
ll)
DOTA-Herceptin (nM)
0 20 40 60 80 100
0
200000
400000
600000
800000
1000000
1200000Saturation Binding of DOTA-Herceptin to BT474 cells
Control cells
Data: Data4_E
Model: saturation
Bmax 1165000 ±94000
Kd 6.55 ±1.52
67G
a-D
OT
A-H
erc
ep
tin
Bo
un
d (
sit
es
/ce
ll)
DOTA-Herceptin (nM)
control 500 nM 17AAG0
200000
400000
600000
800000
1000000
1200000
1400000
Sit
es
/ce
ll
Effect of 17AAG on HER2 Protein expression by BT474 Breast Cancer Line
Kd unchanged
Bmax reduced by 80%

0 1 2 3 4 5 6 7 8
0
10
20
30
40
50
60
70
80
90
100
110
120
130
140
150
160
170
180
190
200
Treated
Group
Control
Group
17
AAG
Tumor Uptake of 68
Ga-DOTA-F(ab')2-herceptin following
2 x 100 mg/kg 17AAG 18 and 6 hours Before Scan at Day 1T
um
or
Up
take
(n
orm
aliz
ed
)
Time (Days)
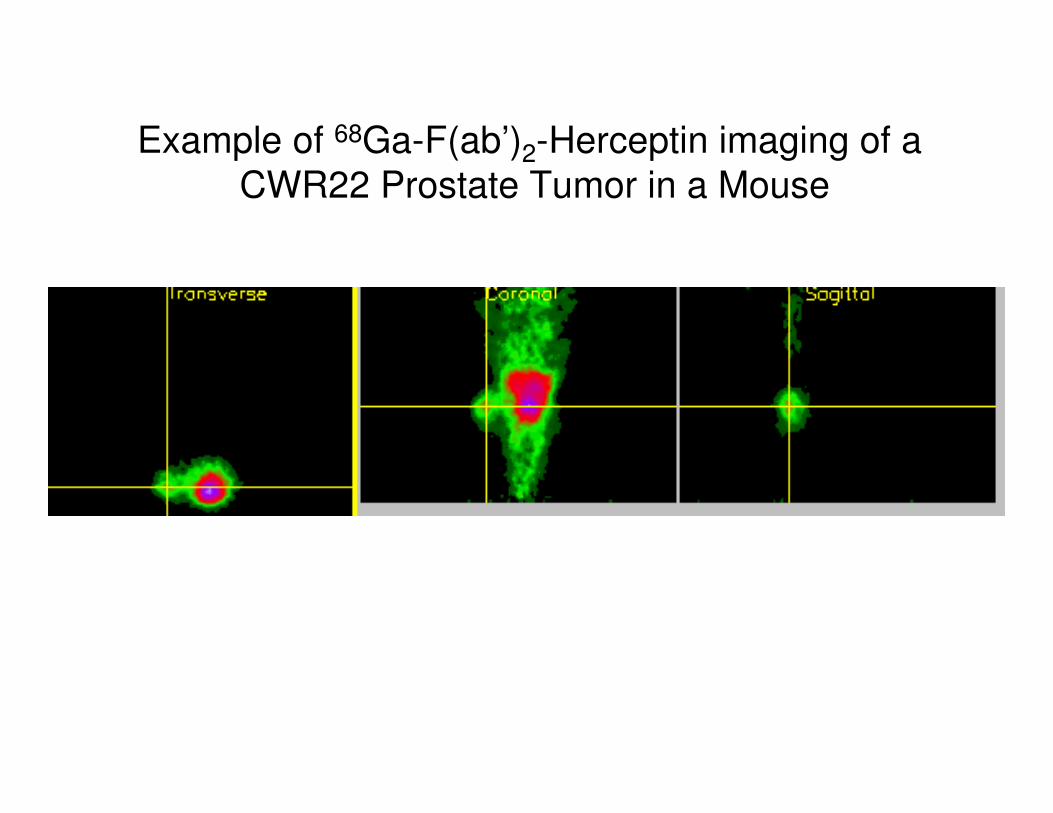
Example of 68Ga-F(ab’)2-Herceptin imaging of a
CWR22 Prostate Tumor in a Mouse

0 1 2 3 4 5 6
0
20
40
60
80
100
No
rma
liz
ed
an
d B
ac
kg
rou
nd
Co
rre
cte
d T
um
or
Up
tak
e (
%)
Time (days)
ROI Analysis of 68Ga-F(ab’)2-Herceptin Uptake in a
CWR22 Prostate Tumor After 17 AAG Treatment.
Formation half-life 1.35 days

Peter Smith-Jones, Ph.D.
Radiochemist

Pt. # 1. Her 2 + Breast Cancer, metastatic to skull
PET: Her 2+
BreastCT: Temporal lytic lesion
Her 2 imaging: IRB #06-090 Akhurst et al.
TT T

Tumor Response in Skull

Pt. # 5. Her 2 + Breast Cancer, metastatic to liver
Her 2 imaging: IRB #06-090 Akhurst et al.
T
FDG
68Ga Herscan

Nuclear Pharmacies
Nuclear pharmacy is a specialty area of pharmacy practice dedicated to the
compounding and dispensing of radioactive materials for use in nuclear medicine

Nuclear Pharmacies
• Cardinal Health
• Mallincrodt
• PET-NET
• Eastern Isotopes (IBA Molecular)
• A national network of licensed pharmacies
– USFDA
– US Pharmacopeia
– NRC
– State Boards of Pharmacy

Proposed Regulatory Path for
Approval Imaging Biomarkers
• 1997 FDAMA emphasized USP as a basis for radiopharmaceutical formulation by pharmacist under physician order.– Specific tested formulations in humans– Extensive testing, safety data and QC available
– cGMP or equivalent facilities
• Recommendation, like FDG, that USP radiotracers be reviewed by USFDA for safety and effectiveness as a biomarker for key metabolism or the presence of key biomolecules, associated with malignancy or relevant pathology

Molecular Imaging Agents as
Potential Biomarkers• Glycolysis
– 18FDG
• Hormone Receptor Expression– 18F-flourodihydrotestosterone 18FDHT (AR)
– 18F-Flouroestraqdiol 18FES (ER)
• Proliferation Markers. – 18F-L-Thymidine 18FLT
– 124II-Iodo-deoxy-uridine (IUDR)
• Amino acid transporter– 18FACBC
– 11C-methionine
• Viral and Gene Expression Imaging– 124I-Flouroiodoarabinosyluridine (FIAU)
• Hypoxia and aberrant hif-1 alpha expression– 18FMISO
– 124I-cG250 (CA IX)
• Growth factor expression– Her 2, 68Ga-Fab’2 Herceptin*
• Transporters– 124I –NaI (NIS)
• Drugs– 18F-disatinib

HO
S
HOH
HH
HH
N
NH
O
O
I
HO
O
HOH
HH
HH
N
NH
O
O
I
HO
O
HOH
HH
HH
N
NH
O
O
H3C
HO
O
HF
HH
HH
N
NH
O
O
H3C
HO
O
HOH
FH
HH
N
NH
O
O
H3C
HO
O
FOH
HH
HH
N
NH
O
O
Br
HO
O
HOH
HH
HH
N
NH
O
O
Br
HO
S
HOH
HH
HH
N
NH
O
O
H3C
HO
O
HOH
FH
HH
N
NH
O
O
Br
AR
Mel-28 xenografts treated/untreated with PD901
0
0.2
0.4
0.6
0.8
1
1.2
1.4
1.6
1.8
0 5 12 19 26 33 44
Days post tumor inoculation
Sta
nd
ard
ize
d U
pta
ke
Va
lue FLT
FDG
CT
FDH
T
HER-2
68Ga-(Fab’2)
herceptin
Virtual
Immunohistolog
y (VIH):
Smith-Jones et
al: Nat Biotech..
2004
Jun;22(6):701
PET: Her 2+
Breast
CT: Temporal
lysis


