University of South Carolina Scholar Commons Faculty Publications Chemical Engineering, Department of 1-1-1997 Molecular-level modeling of the viscoelasticity of crosslinked polymers: Effect of time and temperature Philip P. Simon University of South Carolina - Columbia Harry J. Ploehn University of South Carolina - Columbia, [email protected]Follow this and additional works at: hp://scholarcommons.sc.edu/eche_facpub Part of the Chemical Engineering Commons is Article is brought to you for free and open access by the Chemical Engineering, Department of at Scholar Commons. It has been accepted for inclusion in Faculty Publications by an authorized administrator of Scholar Commons. For more information, please contact [email protected]. Publication Info Journal of Rheology, 1997, pages 641-670. Copyright 1997 American Institute of Physics. is article may be downloaded for personal use only. Any other use requires prior permission of the author and the American Institute of Physics. e following article appeared in (citation of published article) and may be found at hp://dx.doi.org/10.1122/1.550828. DOI:10.1122/1.550828
Transcript
University of South CarolinaScholar Commons
Faculty Publications Chemical Engineering, Department of
1-1-1997
Molecular-level modeling of the viscoelasticity ofcrosslinked polymers: Effect of time andtemperaturePhilip P. SimonUniversity of South Carolina - Columbia
Harry J. PloehnUniversity of South Carolina - Columbia, [email protected]
Follow this and additional works at: http://scholarcommons.sc.edu/eche_facpubPart of the Chemical Engineering Commons
This Article is brought to you for free and open access by the Chemical Engineering, Department of at Scholar Commons. It has been accepted forinclusion in Faculty Publications by an authorized administrator of Scholar Commons. For more information, please [email protected].
Publication InfoJournal of Rheology, 1997, pages 641-670. Copyright 1997 American Institute of Physics. This article may be downloaded for personal useonly. Any other use requires prior permission of the author and the American Institute of Physics.The following article appeared in (citation of published article) and may be found at http://dx.doi.org/10.1122/1.550828.DOI:10.1122/1.550828
Crosslinked polymers, such as epoxy resins, serve in structures subjected to time-dependent mechanical loading with potentially large variations in temperature and plas-ticizer concentration. Designing optimal materials for specific applications requires anunderstanding of the effects of time, temperature, and plasticizer on the viscoelasticmoduli of crosslinked polymers. In this paper, we postulate a molecular-level mechanismfor the viscoelasticity of fully crosslinked polymers and construct a model that rational-izes the effects of time and temperature on observed uniaxial elongation moduli spanningthe glassy and rubbery regimes. The effect of plasticizer content will be treated in asubsequent publication.
Crosslinked polymers behave like linearly elastic materials under some conditions@Adams and Miller~1977!; Pomies and Carlsson~1994!; Tsotsis and Weitsman~1990!#,but also display significant viscoelastic responses over large temperature ranges and timescales@Miyaseet al. ~1993a!; Miyaseet al. ~1993b!; Crossmanet al. ~1978!; Brinson andKnauss~1991!#. At low temperatures and short times, crosslinked polymers exhibit aglassy response, which may include ab or d transition due to relaxations associated withlocal vibrational and rotational motion. At high temperatures and long time scales, they
display rubbery behavior. Thea transition, or glass transition, separates the glassy andrubbery regimes. Crosslinked polymers do not display a terminal zone at high tempera-tures and long time scales wherein the relaxation modulus decreases to zero.
A number of rigorous molecular models exist for uncrosslinked polymer solutions@Rouse~1953!# and polymer melts@Doi and Edwards~1986!#. These models postulatethat applied deformations alter polymer chain conformations, thus, creating entropicforces manifested as stress in the material. Random thermal motions of the chains~e.g.,reptation! may dissipate some of the strain energy and relax the forces over time. How-ever, the reptation model@Doi and Edwards~1986!# cannot treat fully crosslinked poly-mers because it postulates relaxation by axial diffusion of chain ends out of their en-tanglement tubes. Adaptations of these models for crosslinked polymers@Tsenoglou~1986!# attribute the viscoelasticity to dangling chains resulting from incompletecrosslinking. Earlier, Kirkwood~1946! and Mooney~1959! developed Brownian relax-ation models to describe the viscoelasticity of fully crosslinked polymers. None of theaforementioned models account for van der Waals forces, which dominate the glassyregime; thus, they can only describe the viscoelastic response around the rubbery regime.We are unaware of any molecular models that can describe the whole time–temperaturespectrum of crosslinked polymer mechanical behavior.
Phenomenological spring and dashpot models comprise the only methodology cur-rently available for rationalizing the viscoelastic moduli of crosslinked polymers span-ning the glassy and rubbery regimes. Although these models successfully correlate data,they have a number of deficiencies. First, their parameters lack physical significance.Because the relaxation times are chosen arbitrarily, different parameter sets may producegood fits of a given experimental data set. More importantly, the equations only accountfor time dependence, thus, requiring data taken at constant temperature and plasticisercontent.
Measurements of polymer dynamic properties typically employ either isothermal fre-quency sweeps~isotherms! or isochronal temperature sweeps~isochrones!. Isothermscannot capture all of the material’s viscoelastic behavior in a single experiment becauseof practical limits on deformation frequency. Time–temperature superpositioning~TTS!has been used successfully to predict viscoelastic properties outside of the accessiblerange of time and temperature. However, the accuracy, as well as the validity of TTS, hasbeen questioned@Plazek~1968!#.
On the other hand, isochronal measurements are useful because they reveal all of thesalient features of material viscoelastic behavior~glassy and rubbery regimes, varioustransitions! in a single experiment spanning an accessible range of temperatures. Further-more, no subjective manipulation of the data is required. Unfortunately, there are noequations from either molecular or phenomenological models that can rationalize isoch-rones with moduli spanning two orders of magnitude over a modest range of tempera-tures.
The primary difficulty in modeling polymer behavior over large domains of time andtemperature is in incorporating various forces and mechanisms within a consistent theo-retical framework. van der Waals forces responsible for glassy behavior act over atomiclength scales. Multiatom bond rotations must be described to account forb relaxations.Macromolecular reconfiguration, described using bead–spring or reptation models, mustbe invoked to predict the rubbery modulus. The widely varying length scales of thesephenomena represent a considerable challenge to efforts to formulate a comprehensivemodel.
The model presented in this paper attempts to include all of the aforementionedmechanisms within a molecular context. In this model, a crosslinked polymer chain is
642 SIMON AND PLOEHN
constrained at its ends by immobile crosslinks and along its contour by anentanglementtubeformed by neighboring chains. Neighboring chains limit the lateral motion of the testchain. At certain locations, this constraint may be strong enough to eliminate all lateralmotion, thus, permitting only axial chain motion. These locations, calledentanglementjunctions, divide the tube into subtubes and the chain into shorter strands. Although thechain is immobilized at the crosslinked end points, the constituent strands may redistrib-ute their lengths among the subtubes through reptation in response to the forces actingupon them.
The mathematical formulation consists of a time-dependent momentum balance on arepresentative crosslinked chain subjected to cohesive, entropic, and frictional forces. Bydrawing on linear elasticity theory, the model incorporates the intermolecular cohesiveforce by introducing the concept ofmechanical volume~a pressure-induced dilatation!,which enables a description of both the magnitude of the cohesive force as well as theunderlying mechanism for theb relaxation. The model accounts for the temperaturedependence of interchain frictional forces using the concept of thermal free volume~thermally induced dilatation!. Ideally, a single equation of state~EOS! should provideboth the mechanical and thermal-free volumes. Since we lack a suitable EOS spanningthe glassy and rubbery regimes, we treat the mechanical and thermal-free volumes asindependent quantities. Nevertheless, the need for these two types of free-volume pointsto the interrelationship between the polymer’s thermodynamic state and its dynamicresponse, as well as to the fundamental distinction between the dilatational and viscoelas-tic glass transitions.
The model equations, solved in either the time or frequency domain, can be used tocalculate isothermal frequency sweeps as well as isochronal temperature sweeps. Formathematical convenience, we use a transform technique to analyze exclusively the fre-quency domain response.
II. GLASS TRANSITION MODEL FOR CROSSLINKED POLYMERS
A. Molecular view
Several types of forces act on polymer chains in a glass, rubber, or melt. The hard-coreBorn repulsion prevents overlap of molecules. The van der Waals attractive force bindsthe chains into a cohesive bulk. An applied deformation alters the distribution of inter-molecular separations and, thus, the magnitude and direction of the forces acting on eachchain. The work done in applying the deformation represents potential energy stored asstrain energy. The random thermal motions of a chain, in cooperation with the motions ofneighboring chains, restore the equilibrium distribution of intermolecular separations andchain end-to-end distances, relax the forces exerted on chains, and dissipate stored strainenergy.
The present model treats these various molecular phenomena in different ways. Weuse the entanglement tube concept@Doi and Edwards~1986!# to describe the repulsiveforces that constrain the lateral motion of chains. An applied deformation distorts theentanglement tube, alters the distribution of separation distances between parts of theenclosed chain and its neighbors, and, thus, changes the mutual van der Waals attractiveforces. The resultant of these forces, which we call the cohesive force, can be quantifiedusing the concept of ‘‘mechanical volume.’’ Mechanical volume represents space withinthe entanglement tube in excess of the equilibrium space occupied by the chain in theundeformed state at constant temperature. The applied deformation also creates a non-equilibrium distribution of chain conformations. The entropic force is an effective ther-modynamic force that biases the thermal motion of chains so as to restore the equilibrium
643VISCOELASTICITY OF CROSSLINKED POLYMERS
distribution of conformations. The relative motion of neighboring chains also creates africtional force that dissipates stored strain energy as heat.
We view the crosslinked polymer as a network of flexible chains, each crosslinked tothe network at its ends. In the high-temperature limit, thermal energy dominates allintermolecular interactions, and so the chains are effectively unconstrained by neighbors.In this state, the phantom chain models in the classical theory of rubber elasticity@Jamesand Guth~1943!; Flory ~1953!# describe the polymer behavior. At lower temperatures,chain interactions produce entanglements, leading to viscoelasticity and glassy behavior.
We postulate two kinds of entanglements: the entanglement tube and the entanglementjunction @Fig. 1~a!#. Neighboring chains impose topological constraints that restrict theconfigurations available to a given chain. Recent rubber elasticity [email protected]., Gaylord~1979!# represent such entanglements by restricting the volume available to a chain tothat of an entanglement tube. The chain may assume all possible configurations withinthe confines of its entanglement tube. The tube is a mean-field representation of theconfining effect of repulsive intermolecular interactions@Doi and Edwards~1986!#.
The cross section of the entanglement tube varies along the length of the chain as afunction of the interactions with the neighboring chains. Locations with stronger interac-tions between the chain and its neighbors correspond to smaller tube cross-sectionalareas. Locations where the cross section of the tube is comparable to the cross section ofthe chain are called entanglement junctions. Entanglement junctions have several impor-tant characteristics. First, they act like crosslinks insofar as they prohibit chain motion inlateral directions. Junctions divide the chain into strands and the tube into subtubes.Entanglement junctions differ from crosslinks because they permit the chain to slideaxially through them, allowing redistribution of the strands among subtubes. This axialmotion differs from the conventional concept of reptation because it occurs in response tostochastic~Brownian! as well as nonstochastic forces. The axial motion of the chainthrough entanglement junctions converts stored strain energy to thermal energy; we treatthis as a dissipative frictional force acting on the strands at the entanglement junctions.
Consider a crosslinked chain constrained in an entanglement tube with an end-to-endvectorrc @Fig. 1~a!#, divided by entanglement junctions intoi strands and subtubes withorientationr i . The end-to-end vector of the entire chain,rc , can be expressed as the sum
rc 5 (i 5 1
N
r i ~1!
of the end-to-end vectors of all strands. The number of strandsN in any given chain andthe end-to-end strand orientation vectors (r i ) are random variables with some distributionof values. The distribution may change over time because chain motion alters the loca-tions of the entanglement junctions along the length of the chain.
Application of an external bulk strain perturbs the subtubes’ equilibrium shapes andchanges the local forces acting on the strands. Each subtube’s deformation depends on itsorientation relative to the applied strain@Simon ~1995!#. Therefore, the forces on thestrands in two noncollinear consecutive subtubes will differ. The force imbalance at theentanglement junction between two noncollinear subtubes causes the chain to slide fromone subtube to the next. The reallocation of the strands among adjoining subtubes relaxesthe forces on the strands and creates a time-dependent viscoelastic response. Conserva-tion of the linear momentum of all strands governs the relationship between the appliedstrain and the resultant stress~the product of force per strand and the number of strandsper unit area! in the material.
644 SIMON AND PLOEHN
B. Conservation of linear momentum
We regard the chain as a flexible, inextensible continuous space curve that originatesand terminates at crosslinks and passes throughN 2 1 entanglement junctions. The con-trol volume consists of the volumeV occupied by the portion of the chain within theentanglement junction. Applying the conservation of linear momentum for this controlvolume gives
FIG. 1. Schematic representation of a typical polymer chain contained within an entanglement tube and dividedinto strands by entanglement junctions. The dashed arrows are the end-to-end vectors of the subtubes containingeach strand.~a! General representation.~b! Two-tube approximation.
645VISCOELASTICITY OF CROSSLINKED POLYMERS
EV
rDu
DtdV 5 ( F, ~2!
whereD/Dt denotes the material derivative@Slattery ~1981!#, u is the velocity of thechain segment inV, and(F denotes the sum of all forces acting on the segment. For achain segment of uniform densityr moving with a uniform velocityu, Eq. ~2! reduces to
mDu
Dt5 ( F, ~3!
wherem 5 rV is the mass of the chain segment within the control volume. Usingdimensional analysis with specific force expressions~to be introduced below!, we canshow that the left-hand side of Eq.~3! can be neglected without any significant loss ofaccuracy~Appendix A!, leaving
( F 5 0. ~4!
Specification of various forces, described below, make Eq.~4! a first-order ordinarydifferential equation governing the time dependence of chain motion through the en-tanglement junction.
We assume that strands are subjected to three types of forces. Expansion of a subtubeincreases the mean separation of the strand from neighboring chains; van der Waalsattraction creates a cohesive force that pulls chain segments into the subtube to decreasethe mean separation back towards the equilibrium value. Perturbation of the end-to-enddistance of the strand generates a restoring elastic~entropic! force that also redistributeschain segments among the strands. A dissipative frictional force resists the motion of thechain through entanglement junctions. All of these forces will be described in more detailin the next section.
As a first approximation, we restrict our attention to a ‘‘two-tube’’ picture@Fig. 1~b!#,which assumes only a single entanglement junction per chain and reduces the problem tothat of a single relaxation-time process. Next, we ignore the distribution in subtubeorientations and select a single configuration consisting of one subtubeTa oriented co-axially with the applied elongation, and the other subtubeTt oriented transversely to it.This configuration permits a simple model for the cohesive force and produces the largestpossible force differential across the single entanglement junction. Consequently, thetwo-tube approximation leads to the shortest relaxation time in the response. Overall, thisapproximation may preclude quantitatively accurate predictions but preserves the correctqualitative features observed in experimental data.
In this analysis, we will only consider deformations corresponding to uniaxial elon-gation. Two factors motivate this choice. First, the molecular consequences of uniaxialelongation are easier to visualize than those of shear deformation. Second, uniaxial elon-gation simplifies our treatment of the entropic forces created by strand deformation. Forsimplicity, we also assume that the positions of crosslinked end points and entanglementjunctions move affinely with the applied deformation.
III. FORCE MODELS
This section introduces expressions for the cohesive force, the entropic force, and thetemperature-dependent frictional force acting on a representative chain. These forces,balanced in Eq.~4!, are responsible for the observed features of the glassy and rubbery
646 SIMON AND PLOEHN
regimes and the glass transition. In order to extend the model to predict theb transition,the next section introduces an expression for the time-dependent Poisson’s ratio.
A. The cohesive force and mechanical volume
Application of an external bulk strain changes the average intermolecular separation inthe material. Uniaxial extension increases the intermolecular distances in the axial direc-tion. The cohesive force represents the net van der Waals attraction that acts on a strandto restore the equilibrium value of the average intermolecular separation. Weiner~1983!gives a rigorous statistical mechanical derivation of the cohesive force for simple mol-ecules arranged in a lattice. No analogous derivation exists for polymers. Instead, wedevelop a heuristic model that relates the cohesive force to phenomenological quantitiesfrom linear elasticity theory.
Specifically, the bulk modulus quantifies the cohesive force associated with changes inthe average intermolecular distances due to dilatation. In the case of uniaxial elongationin the direction of a unit vectorei , the only nonzero stress component that exists at everypoint in the material is
s11 5 3Ke~122n!, ~5!
whereK is the bulk modulus,e is the uniaxial strain, andn is Poisson’s ratio. Wepostulate that the cohesive forceFc that acts on a chain segment at an entanglementjunction is
Fc 5s11
nei 5
3Ke~122n!
nei , ~6!
wheren is the number of axial subtubes or strands per unit area. Since the Poisson’s ratioof the bulk material corresponds to the ratio of strains in different directions, we use thebulk value to describe the deformation of the axial subtube. Thus, in Eq.~6!, e andn arethe uniaxial deformation and the local Poisson’s ratio, respectively, associated with agiven subtube. Equation~6! and the definition ofn imply that the magnitude of thecohesive force per junction for this deformation,
uFcu 53Ke~122n!
n5
3K
n
DV
V, ~7!
is proportional to the local dilatationDV/V a force constant equal to 3K/n. By analogywith thermal-free volume induced by temperature changes, we call the deformation-induced dilatational volume,DV, themechanical volume. The mechanical volumeDV inthe axial subtube provides the driving force for reptation of the chain into subtubeTa .
Uniaxial elongation has different effects on strands and subtubes oriented coaxial andtransverse to the elongation. Elongation of the axial subtubeTa creates mechanical vol-ume within Ta and an axial cohesive force that promotes reptation of the chain fromTt through the entanglement junction intoTa . Elongation of the transverse subtubeTtcreates mechanical volume inTt , but the associated cohesive force acts transverse to thestrand and has zero resultant due to symmetry. Equation~4!, therefore, includes a cohe-sive force term only for the part of the chain inTa .
Two relaxation mechanisms can reduce the mechanical volume and the correspondingdriving force for chain reptation. First, molecular motion of neighboring chains maydecrease the intermolecular separation and relax some of the initial strain in the subtubes.Rapid side-chain and backbone bond rotations lead tob relaxations@Arridge ~1975!#
647VISCOELASTICITY OF CROSSLINKED POLYMERS
observed at low temperatures or short time scales. The next section will explain ourphenomenological approach that incorporates theb relaxation and other secondary relax-ations in our model.
Second, chain reptation intoTa , decreases the average intermolecular separation be-tween the strand and the tube walls and, consequently, reduces the mechanical volumeand the corresponding cohesive force. We assume that the decrease in mechanical vol-ume is proportional to the volume of the chain reptating into the subtube. Letn0 be theequilibrium tube volume per unit length of chain andl 0 be the initial length of strand intubeTa . The equilibrium volumeV0 of the tubeTa is approximatelyn0l 0 . In time tfrom the application of the strain, a length of chainx(t) enters the subtubeTa . Thus, themechanical volume decreases byn0x(t) and
DV~t! 5 V0e@122n~t!#2n0x~t! ~8!
represents the variation of the total mechanical volume with time. The mechanical vol-ume fraction relative to the original volume is then
DV~t!
V05 e@122n~t!#2
x~t!
l0. ~9!
Substituting Eq.~9! into Eq. ~7! gives the magnitude of the cohesive force
Fc~ t ! 53K
n H e@122n~ t !#2x~ t !
l 0J , ~10!
as a function of the reptation lengthx(t), the time-invariant glassy bulk modulusK, andthe time-dependent Poisson’s ration(t).
The measured Poisson’s ratio of polymers depends on the time scale of the measure-ment @Ferry ~1980!; Rigby ~1967!#. Reported values for the Poisson’s ratio of polymersrange from 0.3 for glassy polymers to 0.5 for rubber. Although the variation appears to besmall, the value has a significant influence on the calculation of other moduli because@1 2 2n(t)# varies by orders of magnitude for small changes inn(t) when it is close to0.5. We, therefore, treat the Poisson’s ratio as a time-dependent parameter. This providesa convenient way to include the physics associated with glassy relaxations, including theb transition created by rapid, local molecular motion.
B. Entropic force
As a representative chain reptates through the entanglement junctions along its con-tour, the contour lengths of the constituent strands change. Variations in strand contourlength between the fixed end-to-end distances separating junctions creates entropic forcesin the strands. We employ rubber elasticity theory to derive an appropriate expression forthe entropic force.
There are a number of molecular models for rubber elasticity. The Wall–Flory model@Hill ~1986!# and the James and Guth~1943! phantom chain model assume that chains areunimpeded by the presence of surrounding chains. The constrained junction model@Er-man and Flory~1978!#, the multitube model@Gaylord ~1979!#, the slip-link model@Ballet al. ~1981!#, and hoop model@Adolf ~1988!# account for the entanglement effect ofneighboring polymer chains. The entanglement tubes in the present model are related toconcepts from multitube models, while the entanglement junctions are related to the sliplinks and hoops from previous models. However,the exact mechanism by which sliplinks, hoops, or entanglement junctions impose topological constraints on the total chain
648 SIMON AND PLOEHN
is irrelevant to computing the entropic force because we are solely concerned with thechain conformations between two junctions.
Although the multitube model would be appropriate for strands in entanglement tubes,we essentially ignore the presence of the entanglement tubes by employing the simplerWall–Flory model to derive the entropic force. At high temperatures and long times, theentropic force dominates the response; the constraints imposed by the entanglement tubeare secondary, since the neighboring chains also undergo significant thermal motion. Thisjustifies the use of the Wall–Flory model and equilibrium statistical mechanics to derivea force to be used in a dynamic model.
Entropic force expressions available in the literature usually compute the entropychange for extending the chain end-to-end distance by a factora. These expressions areindependent of the actual contour length of the chain. However, we are interested in theentropy change associated with altering the contour length of the chains while holding theend points at fixed positions. Suppose that a strand of lengthl 0 between two entangle-ment junctions is subjected to an extensiona. Holding the end point positions fixed,chain reptation may change the strand length tol , corresponding to a new effectivea8.We adapt the Wall–Flory model~see Appendix B! to compute the entropy change forthis process.
We define the entropic forceFls ~in magnitude! such thatFl
sdl equals the change infree energy to alter the length of all strands in the body bydl at fixed end-to-end distancer [ ^ur i u&. The internal energy and the free energy are
dU 5 TdS2PdV1Flsdl, ~11!
and
dA 5 2SdT2PdV1Flsdl, ~12!
whereFls is a function of the applied elongation and the contour length defined through
Fls
5 S]A]l D
T,V,r
5 S]U]l D
T,V,r
2TS]S]l D
T,V,r
. ~13!
The two terms on the right-hand side of Eq.~13! are contributions from intermolecularinteractions and the strand configurational entropy. Under the assumptions of rubberelasticity, the former are much smaller than the latter. Therefore, we have
Fls ' 2TS]S
]l DT,V,r
~14!
as an approximate expression for the entropic force.In Appendix B, we develop an expression for (]S/] l )T,V,r based on Wall’s theory
@Hill ~1986!#. This expression and Eq.~14! give
Fls
5 2kT
l0F12 Sa22 1
aD2x~t!
l0Sa22 1
4aDG, ~15!
wherea 5 1 1 e is the elongation resulting from the strain applied at the end points.Equation~15! represents a retractive~negative in magnitude! force upon increasing thestrand end-to-end distance due to increasinga or decreasingx(t) through the movement
649VISCOELASTICITY OF CROSSLINKED POLYMERS
of the chain. Later, we will adapt this expression to describe the entropic force actingthrough strands in both axial and transverse tubes.
C. Frictional force
We assume that the frictional force,Fn(u), exerted on the chain is linearly propor-tional to the velocity of the chain passing through the junction. The magnitude of theforce,
Fn@u~ t !# 5 2zu~ t ! 5 2zdx~ t !
dt, ~16!
includes a negative sign to indicate that the force acts on the chain segment in thedirection opposite to that of its motion. The frictional coefficientz is identical to thehydrodynamic friction coefficient found in both the Rouse model and the reptation model@Doi and Edwards~1986!#. Ferry ~1980! describesz as ‘‘the average force per monomerunit required for a chain segment to push its way through its local surroundings at unitvelocity.’’
Ferry ~1980! lists experimental values forz at different temperatures. These data showthatz depends strongly on temperature@Larson~1988!#. However, we do not know of anymechanistic or molecular-level models that propose or employ a relationship betweenzand T. We employ a phenomenological expression based on the scaling relationshipbetween the shift factoraT and z @Ferry ~1980!#, the Williams–Landel–Ferry~WLF!equation relatingaT , andT, and the free-volume interpretation of the WLF equationusing the Doolittle expression@Doolittle ~1951!#. Combining these concepts yields
z 5 z0 expS bfnD, ~17!
where f n is the free-volume fraction within the entanglement junction, andz0 andb areempirical parameters. The magnitude and temperature dependence off n must now bespecified.
The WLF model usually evaluatesf n by fitting the WLF equation to experimentalaT data. Although the resultant value, typically about 0.025 at the dilatationalTg , isessentially identical for different polymers, it cannot be readily interpreted in terms ofother established free-volume concepts@Haward ~1973!#. The expansion free-volumefraction, related to the excess volume in the material above its 0 K volume, has a valueof about 0.13. Because dilatometry provides a precise physical interpretation of freevolume, we choose to interpretf n in terms of the expansion free-volume fraction. Thisinterpretation establishes a vital relationship between dynamic properties~specifically,z!and the thermodynamic state of the material~via the specific volume!.
The temperature dependence of the expansion free-volume fractionf n may be ob-tained directly from dilatometric measurements. All of the qualitative features of theviscoelastic behavior predicted by the model, presented in the next section, can be ob-tained by using a simple linear relationship between the free-volume fraction and tem-perature
fn 5 fn01agT, ~18!
whereag is the thermal expansion coefficient of the expansion free volume andf n0 is thefree-volume fraction at 0 K. We employ a more accurate representation of dilatometricdata
650 SIMON AND PLOEHN
fn 5 fn01agT1~ar2ag!~T2Tdg!H~T2Tdg!, ~19!
that includes a dilatational glass transition at a temperatureTdg above which the thermalexpansion coefficient increases to a rubbery valuea r ; H( • ) is the Heaviside step func-tion.
IV. TRANSITIONS IN THE GLASSY STATE
Local molecular motions, such as vibrations and rotations of side groups, dissipatemechanical energy@Arridge ~1975!#. This dissipation can be observed as a loss tangentpeak in dynamic mechanical spectra known as theb transition. Because the moleculararchitecture of side groups controls the magnitude and characteristic time/temperature oftheb transition and other secondary transitions, our coarse-grained model of the polymeras a smooth, flexible chain cannot describe this phenomenon.
We, therefore, use a phenomenological approach that builds upon our concept ofmechanical volume to incorporate the effects of local molecular motions manifested asglassy relaxations typified by theb transition. As discussed earlier, applied strain deformsthe entanglement subtubes and creates local dilatation, or mechanical volume. Becausethe dilatation acts against attractive van der Waals forces, the creation of mechanicalvolume may be viewed as the storage of mechanical energy. Local dilatation storesmechanical energy in the stretching or bending of bonds of the neighboring chains com-prising the subtube.
The thermal motions of neighboring chains lead to configurations that reduce theirstrain energy and decrease the local mechanical volume. Because the applied strain fixesthe axial elongation of the subtube, the decrease in volume occurs through lateral~Pois-son! contraction in the transverse stress-free direction. Thus, the glassy relaxation corre-sponds to a change in the local Poisson’s ratio associated with the subtube.
To account for the glassy relaxation of the neighboring chains of the subtube, Eq.~10!incorporates a local, time-dependent Poisson’s ration(t). We assume that the local sidegroup rotations of neighboring chains occur much more quickly than the reptation of thestrand inside the subtube. In mathematical terms,n(t) does not depend onx(t). In Eq.~10!, x(t) is zero on the time scale of the glassy relaxations, andn(t) decays to someultimate valuen` before reptation begins. The independence of glassy state relaxationsand glass transitions in isochronal temperature sweeps provide experimental support forthis assumption.
The present objective is to specifyn(t). Configurational barriers to the local rotationalmotion of side groups on neighboring chains suggest that we treat the lateral Poissoncontraction and concomitant reduction of the mechanical volume as a temperature-dependent rate process. The mechanical volumeDV @Eq. ~7!# cannot be completely filledby the configurational relaxation of neighboring chains as evidenced by observed valuesof the Poisson’s ratio between 0.3 and 0.4 for glassy polymers. LetDV` represent theportion ofDV remaining after the glassy relaxations. We postulate that the driving forcefor the local side group rotations of neighboring chains is proportional to the differencebetween the current and ultimate values ofDV. A rate equation for the reduction ofmechanical volume by local side group rotations can be written as
dDV~t!
dt5 2Bc~T!@DV~t!2DV`#, ~20!
where the rate constantBc(T) represents a temperature-dependent inverse relaxation-time constant of the process. Dividing byV0 gives an equivalent expression,
651VISCOELASTICITY OF CROSSLINKED POLYMERS
dfm~t!
dt5 2Bc~T!@fm~t!2fm
`#, ~21!
in terms of the mechanical volume fractionfm(t) [ DV(t)/V0 and its limiting valuefm
` . Because the reptation lengthx(t) of the chain is essentially zero on the time scaleof this relaxation, Eq.~21! is independent ofx(t) and can be solved separately to give
fm~t! 5 fm`
1~fm0
2fm`!exp@2Bc~T!t#, ~22!
after using the initial condition given byfm(0) [ fm0 .
As discussed earlier, the change in the mechanical volume can be expressed in termsof the local Poisson’s ratio of the subtube. Settingx(t) to zero in Eq.~9!,
fm~t! 5DV~t!
V05 e@122n~t!#, ~23!
relates the local Poisson’s ratio tofm(t) with
fm0
5DV~0!
V05 e~122n0!, ~24!
initially, and
fm` 5
DV~`!
V05 e~122n`!, ~25!
after completion of all glassy relaxations. Here,n0 is the instantaneousPoisson ratioobserved over a time scale faster than some or all of the molecular relaxations in neigh-boring chains. We can setn0 5 0 if we account for all glassy relaxations. The otherPoisson ratio,n` , is that measured on a time scale slower than side group relaxations ofneighboring chains, corresponding to a value measured at a temperature near the glasstransition. Presuming that most experimental measurements of the Poisson ratio satisfythis condition, we assume thatn` takes a value in the range from 0.35 to 0.40.
We describe the temperature dependence ofBc(T) using an Arrhenius form
Bc~T! 5 Bc0 expS2DHc
RT D, ~26!
where DHc is the activation energy for the reorientation of neighboring chain sidegroups. In an amorphous solid, chain configurations vary from place to place and, thus,create a distribution inDHc . Because side group rotations occur at different rates atdifferent locations in the material, we should employ a volume-averaged mechanicalvolume fraction. Iffm(DHc ,t), described by Eqs.~22! and~26!, is the local mechanicalvolume fraction associated with regions having an activation energy ofDHc , then
fm~DHc ,t!P~DHc!dHc ~27!
is the average mechanical volume fraction in material relaxing with activation energiesbetweenDHc andDHc 1 dHc . P(DHc)dHc is the fraction of the material that hasregions where the activation energy for chain relaxations is betweenDHc and DHc1 dHc . Integrating over all values of the activation energy yields the average mechanicalvolume fraction in the material
652 SIMON AND PLOEHN
fm~t! 5 E0
`fm~DHc ,t!P~DHc!dHc , ~28!
as a function of time.We now relate the average mechanical volume fraction to the time-dependent Pois-
son’s ratio in Eq.~23!. Substitution offm(DHc ,t) from Eq.~22!, fm0 from Eq.~24!, and
fm` from Eq. ~25! into Eq. ~28! gives a time–temperature dependent Poisson’s ratio
n~t! 5 n`2~n`2n0!E0
`exp@2Bc~T!t#P~DHc!dHc , ~29!
whereBc(T) is given by Eq.~26!.Equation ~29! can be used in Eq.~10! to express the effect of the relaxation of
neighboring chain side groups on the cohesive force. To evaluate this integral, we need toknow the distributionP(DHc) of molecular relaxations having activation energyDHc .This information may be obtained through molecular dynamics modeling or spectro-scopic measurements. A suitable molecular dynamics model must provide the distribu-tion of intramolecular energies for an isolated polymer chain as well as account for thespread of the energy distribution associated with cooperative movement of neighboringchains in all the possible local environments. No such model is currently available.Alternately,P(DHc) could be extracted from spectroscopic measurements. Broad peaksobserved in the infrared spectra of most amorphous solids are a consequence of energydispersion due to minute variations in hinderances to molecular relaxations. The effect ofdifferent postulated functional forms ofP(DHc) on the material response will be ex-plored in the results section.
By settingn(t) 5 n` , we can restrict the model to predict only features associatedwith the glass transition. Inclusion of a time–temperature dependent Poisson’s ratio ex-tends the practical range of the model by as much as 200 K belowTg . This introducesthe need for a distribution function for the relaxation activation energy and two newparameters,n0 ~here, set to 0! andBc0 , to be fit by experimental data.
V. DYNAMIC MODULUS
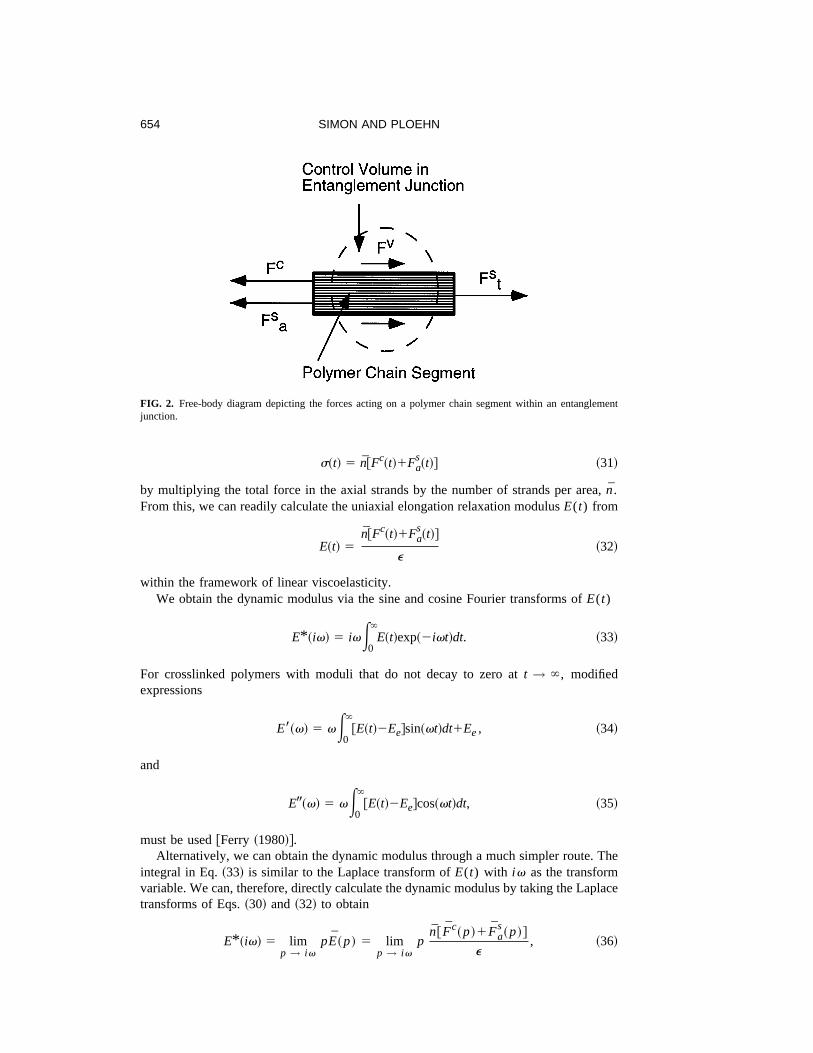
Based on the free-body diagram shown in Fig. 2, Eq.~4! reduces to
Fc1Fas1Ft
s1Fn 5 0, ~30!
wherea andt denote axial and transverse directions as specified by the two-tube model.These forces depend onx(t), the strand length that has translated fromTt into Ta .Equation~30! is a function ofx(t) through the cohesive forceFc @Eq. ~10!# and theentropic forcesFa
s andFts . To keep the magnitudes ofFa
s andFts consistent with the
presumed directions of all of the forces at the junctions, we requireFas
5 2Fls andFt
s
5 Fls with Fl
s defined by Eq.~15!. In calculatingFts , we havea ' 1 andx(t) , 0.
Equation~30! is also a function ofdx(t)/dt through the frictional force termFn @Eq.~16!#. In principle, the differential equation can be solved using initial conditionsx(0)5 0.The elongational stress can be computed from the forces acting across a hypothetical
dividing plane having a unit normal in the axial~elongational! direction. Substitution ofthe functional form forx(t) into Eqs.~10! and ~15! yields the forcesFc andFa
s in theaxial strands. The elongational stress can be written as
653VISCOELASTICITY OF CROSSLINKED POLYMERS
s~t! 5 n@Fc~t!1Fas~t!# ~31!
by multiplying the total force in the axial strands by the number of strands per area,n.From this, we can readily calculate the uniaxial elongation relaxation modulusE(t) from
E~t! 5n@Fc~t!1Fa
s~t!#
e~32!
within the framework of linear viscoelasticity.We obtain the dynamic modulus via the sine and cosine Fourier transforms ofE(t)
E* ~iv! 5 ivE0
`E~t!exp~2ivt!dt. ~33!
For crosslinked polymers with moduli that do not decay to zero att → `, modifiedexpressions
E8~v! 5 vE0
`@E~t!2Ee#sin~vt!dt1Ee, ~34!
and
E9~v! 5 vE0
`@E~t!2Ee#cos~vt!dt, ~35!
must be used@Ferry ~1980!#.Alternatively, we can obtain the dynamic modulus through a much simpler route. The
integral in Eq.~33! is similar to the Laplace transform ofE(t) with iv as the transformvariable. We can, therefore, directly calculate the dynamic modulus by taking the Laplacetransforms of Eqs.~30! and ~32! to obtain
E* ~iv! 5 limp → iv
pE~p! 5 limp → iv
pn@ Fc~p!1Fa
s~p!#
e, ~36!
FIG. 2. Free-body diagram depicting the forces acting on a polymer chain segment within an entanglementjunction.
654 SIMON AND PLOEHN
in terms of the transform variablep 5 iv. This procedure, described in more detailelsewhere@Simon ~1995!#, drastically simplifies the solution process. First, the differen-tial equation becomes an algebraic equation in the Laplace domain. Second, we avoid theintegrations described above to obtain the dynamic moduli. The procedure reduces cal-culation time as well as computation errors associated with numerical differentiation andintegration.
The uniaxial elongation modulus can be used in conjunction with the bulk modulus tocalculate other time-dependent moduli, such as shear moduli, using the elastic–viscoelastic correspondence principle@Schapery~1967!#. This is possible because thebulk modulus is not a strong function of the time scale of the applied deformation. Itvaries roughly by a factor of 2 from the glassy to rubbery regimes, a small changecompared to the two orders of magnitude observed in other moduli. We can calculate thecomplex shear modulusG* from
1
G*5
3
E*2
1
3K, ~37!
provided that we treat the bulk modulus as a constant.
VI. RESULTS AND DISCUSSION
The model outlined in the previous section can be used to calculate the dynamicelongational and shear moduli of crosslinked polymers as functions of temperature andfrequency of applied deformation. In this section, we present results for shear modulus interms of its real and imaginary parts~storage and loss moduli!. First, we discuss some ofthe qualitative features of this model with those of previous models. Next, we show thatthe calculated moduli display all of the important features observed in experimental datafrom temperature and frequency sweep measurements and discuss determination ofmodel parameters and the sensitivity of predictions to parameter value choices. Finally,we present direct comparisons of calculated shear moduli with published experimentaldata for crosslinked epoxy resins.
A. Comparison with previous theories
The model presented here attributes the viscoelasticity of crosslinked polymers to theredistribution of the contour lengths of polymer chains within their entanglement tubes asa result of forces created by an applied deformation. Stationary entanglement junctionsdivide each chain into strands and the tube into subtubes. Time and temperature depen-dence arise from the frictional forces that oppose the sliding of chains through junctions.This model has features similar to those introduced by previous models.
Entanglement junctions resemble slip links@Ball et al. ~1981!# because they constrainchain fluctuations. However, the junctions here are stationary constraints, like the hoopsin the hoop model@Adolf ~1988!#. Like all rubber elasticity models, we have a fit param-eter,n, that relates to the degree of crosslinking or the number of crosslinks. The slip-linkmodel and the hoop model also specify the number of slip links or hoops per crosslinkedchain. Our two-tube model inherently assumes a single entanglement junction percrosslinked chain. Unlike previous models, the present model employs entanglementjunctions as well as entanglement tubes.
The entanglement tube concept appears in the Doi–Edwards~1986! reptation model aswell as Gaylord’s~1979! rubbery elasticity model. However, our model requires thatvarious portions of the crosslinked chain reside in separate tubes. Thus, the chain strandin the subtube corresponds to a complete crosslinked chain in the Gaylord tube. Chain
655VISCOELASTICITY OF CROSSLINKED POLYMERS
strands reptate through the tube as do uncrosslinked chains. However, the chains neverleave the tube, but simply redistribute their contour length among subtubes.
The present model resembles Mooney’s model~1959! in this regard because it doesnot require the existence of an imperfectly crosslinked network as do models based onclassical reptation [email protected]., Tsenoglou~1986!#. However, the Mooney model postu-lates a different mechanism for stress relaxation using the Rouse bead–spring submol-ecule. To compare the present model with that of Mooney, we should view a chain strandwithin an entanglement tube as a spring in the Mooney submolecule, and the position ofan entanglement junction as that of a bead. The relaxation mechanism in our model arisesfrom the changing length of the strands within subtubes, corresponding to changing thespring constant of the Rouse submolecule in the Mooney model. The Mooney modelmaintains the spring constant unchanged but assumes that the stress relaxation resultsfrom the diffusive motion of the beads within the matrix.
The true situation probably represents a combination of the two mechanisms: en-tanglement junctions should move as chain configurations evolve. Under these condi-tions, the entanglement tubes constraining the chains will also evolve. This would greatlycomplicate the development of the cohesive force. Despite its artificiality, our assumptionthat entanglement junctions deform affinely with the matrix provides the considerablesimplification necessary for us to initiate our analysis.
B. Qualitative behavior
Figure 3 shows model predictions of storage (G8) and loss (G9) shear moduli asfunctions of temperature at constant frequency of applied elongational deformation. Ingeneral,G8 has high values at low temperatures, as expected for a glass. With increasingtemperature,G8 decreases gradually before dropping by two orders of magnitude at theglass transition. At high temperature,G8 stabilizes at a rubbery plateau value. The lossmodulus displays a broad peak at low temperature, representing theb transition, as wellas a sharp peak at the glass transition. As the frequency of the applied deformationdecreases, the temperatures of the glass transition andb transition shift to lower values.All of these observations correspond to features observed in experimental data fromisochronal temperature sweep measurements.
The model can readily generate predictions of the frequency dependence of shearmoduli at fixed values of temperature. Figure 4 shows typicalG8 andG9 results for theparameters given in Tables I~a!–I~d!. When the applied oscillatory deformation has ahigh frequency, the time scale of the deformation is much smaller than all time scales ofmolecular motion, soG8 displays high values characteristic of a glass. With decreasingfrequency, the deformation time scale becomes comparable to certain kinds of molecularmotion, soG8 gradually decreases andG9 displays ab-transition peak. The time scale ofpolymer chain translation becomes comparable to the deformation time scale at the glasstransition. Finally, at low frequency, molecular motion occurs more quickly than theapplied deformation, so we observe a rubbery plateau inG8 and a vanishingG9.
Of course, experimental time constraints preclude observation of the moduli over thecomplete frequency spectrum. We are typically limited to a window of frequencies de-limited by the vertical lines in Fig. 4. Focusing on theG8 curves in this frequencywindow, with increasing temperature, the curves shift downward through the glassyregime, change shape through the glass transition, and reach a rubbery plateau limit athigh temperature. The same qualitative features are observed in experimentalG8 datafrom isothermal frequency sweep measurements.
Because the model yields predictions over the entire frequency range of interest, we
656 SIMON AND PLOEHN
do not need to shift frequency sweeps at different temperatures over the time axis toconstruct a master curve~TTS!. In addition, this model offers interesting possibilities forstudying the validity and accuracy of TTS as applied to experimental data.
C. Parameterization
The tube–junction model presented here contains eight parameters listed in TablesI~a!, and I~d!. Of these, the four in Table I~a!, ~K, l 0 , n` , andn0! may be obtained fromseparate experiments. The four in Table I~d! ~nm , b, z0 , andBc0! may be evaluated bytuning the material response so that it matches the measured dynamic mechanical data.Data from a single isochronal temperature sweep experiment are most convenient andsufficient for this purpose. We describe the evaluation of these parameters in detail in thesubsequent subsections.
The model also requires two material property functions, one to describe the tempera-ture dependence of the free-volume fractionf n(T) and the other to describe the activationenergy probability distributionP(DHc) of glassy relaxations. The first function may beobtained from thermodynamic models or experimental dilatational data. The second func-tion may be obtained from spectroscopic measurements or molecular dynamics calcula-tions. Lacking such data, we have used some simple functional forms to represent this
FIG. 3. Typical model predictions forG8 ~a! andG9 ~b! as functions of temperature at various fixed frequen-cies of oscillatory elongation~parameters in Table I!.
657VISCOELASTICITY OF CROSSLINKED POLYMERS
data. We describe below the choice of the functional forms, as well as the additionalparameters associated with these functions.
1. Material parameters
The four parameters in Table I~a! may be determined through a variety of independentmeasurements. The bulk modulusK varies by no more than a factor of 2 for mostpolymeric materials; we have selected a typical value. Knowledge of the molecularweight between crosslinks determines the strand lengthl 0 . The molecular weight be-tween crosslinks divided by the molecular weight per monomer equals the number ofmonomers between crosslinks. Multiplication of this value by the estimated contourlength per monomer, divided by the number of strands per chain~two in the two-tubemodel! givesl 0 . The value of the Poisson ratio depends on temperature or the time scaleof the measurement. For glassy polymers at temperatures above theb transition, n5 n` has values between 0.35 and 0.40. This parameter can be readily measured; wehave employed a typical value of 0.4. We setn0 5 0 in all cases, presuming thatP(DHc) spans the full activation energy spectrum.
FIG. 4. Typical model predictions forG8 ~a! andG9 ~b! as functions of frequency of oscillatory elongation atvarious fixed temperatures~parameters in Table I!. The vertical lines delineate the typical window of experi-mentally accessible frequencies.
658 SIMON AND PLOEHN
2. Temperature dependence of free volume fraction
The temperature dependence of the free-volume fraction may be obtained from athermodynamic equation of state or dilatational measurements. Theories describing thevariation of the local free volume are subjects of current [email protected]., Cohen and Grest~1984!#. We approximated the dilatational data given by Guptaet al. ~1985! with Eq.~19!, a linear temperature dependence for the free-volume fraction in the glassy andrubbery thermodynamic states separated by a distinct dilatational glass transition. Thefour parameters used in Eq.~19! are listed in Table I~b! and are taken from Guptaet al.~1985!. The value of the free-volume fraction at 0 K,f n0 , is assumed to be zero. Thedilatometric glass transition does not directly cause the viscoelastic glass transition, al-though the two are indirectly related; we will explore this subject further in anotherpublication.
3. Activation energy probability distribution function
The form of the activation energy distribution functionP(DHc) affects the shape ofthe modulus profiles in the glassy region. Figures 5, 6, and 7 show three different distri-bution functions and the corresponding moduli profiles. The peaks in the distributionfunction correspond tob or d relaxations. Figure 5 shows that a normal distribution ofDHc centered around theb-relaxation value yields a response unlike that observed inmost polymer solids. The absence of molecular relaxation processes at higher and lower
TABLE I. ~a! Material parameters obtained from experimental measurements.~b! Free volume parameters forEq. ~19!. ~c! Parameters forP(DHc), Eq. ~38!. ~d! Parameters fitted from a selected isochrone.
Parameter Symbol Value
~a!Bulk modulus K 3.33109 PaStrand length l0 1.8531029 ma
Glassy Poisson ratio n` 0.4Instantaneous Poisson ratio n0 0
~b!Dilatometric glass transition temperature Tdg 398 Ka
Thermal expansion coefficient belowTdg ag 1.9531024 cm3/~cm3 °C!a
Thermal expansion coefficient aboveTdg ar 5.7031024 cm3/~cm3 °C)a
Free volume fraction at 0 K f v0 0
~c!Mean activation energy ofb transition normal distribution mHc
63 kJ/mola
Standard deviation of normal distribution sHc6.0 kJ/mol
Exponential decay constant H* 40 kJ/mol
~d!Entropic forceMolar number of strands per area nm 1.2031024 mol/m2
aDenotes values taken from the work of Guptaet al. ~1985!.
659VISCOELASTICITY OF CROSSLINKED POLYMERS
activation energies creates a deep minimum inG9 and a corresponding sharp step inG8. Inclusion of a wider range of molecular relaxation processes, Fig. 6, shows that abroad spectrum of activation energies produces aG9 profile that is qualitatively similar tothat observed for most crosslinked polymers. This is consistent with the expectation thatmolecular relaxations in solid polymers occur through the cooperative motion of neigh-boring chains. Figure 7 shows that an additional peak inP(DHc) produces a correspond-ing peak inG9. In the context of this model, the activation energy distribution alonecontrols the shape of the transition profiles observed in the glassy regime.
It may be possible to estimateP(DHc) by fitting the model to data from spectroscopicexperiments or a detailed molecular dynamics model. Since we lack such data, we havechosen a reasonable analytical function forP(DHc) and have optimized the function’sparameters in order to match the response in the glassy region. To account for theb-relaxation peak, we assume thatP(DHc) has a normal distribution with an activationenergy peakmHc 5 63 kJ/mol@given by Guptaet al. ~1985!# and a standard deviation,sHc , equal to 6.0 kJ/mol. The broader spectrum of molecular relaxations are assumed tohave the form of an exponentially decaying distribution with decay constantH* . Weused
FIG. 5. ~a! NormalizedP(DHc) given by a normal distribution centered on the relaxation energy of thebtransition.~b! Corresponding model predictions ofG8 andG9.
660 SIMON AND PLOEHN
P~DHc! 5exp~2DHc /H* !1exp@2~DHc2mHc!
2/2sHc2 #
H*1A2psHc
, ~38!
with H* 5 40 kJ/mol. Again, these parameters only influence the features of the glassyregion. Table I~c! lists the parameters used in Eq.~38!.
4. Force parameters
The four parameters in Table I~d! appear in the definitions of the cohesive, frictional,and entropic forces developed in the previous section and must be adjusted by fitting themodel to a single experimental isochrone. Below, we outline a convenient procedure forchoosing values for these parameters and describe the sensitivity of the results to chosenvalues.
The entropic force contains one parameter, the molar number of strands per unitcross-sectional areanm [ n/NA , that controls the magnitude ofG8 in the rubbery pla-teau. Figure 8 shows the effect of varyingnm values on the predicted material response.Increasing values ofnm shift theG8 rubbery plateau to higher values and increase the
FIG. 6. NormalizedP(DHc) given by a normal distribution centered on the relaxation energy of thebtransition plus a background uniform distribution of activation energies.~b! Corresponding model predictions ofG8 andG9.
661VISCOELASTICITY OF CROSSLINKED POLYMERS
viscoelasticTg , consistent with experimental observations@Pogany~1970!#. The vis-coelastic response becomes independent ofnm at temperatures just belowTg . Thus, ameasured value ofG8 in the rubbery plateau at a known temperature can be used to setthe value ofnm , as is done in rubber elasticity models to determine the degree ofcrosslinking.
The frictional force introduces two parameters,b and z0 , in Eq. ~17! relating thefrictional coefficient to the thermal free volume. Figure 9~a! shows the effect of varyingvalues ofb on the predicted material response. Because it appears in the exponential inEq. ~17!, larger values ofb increase significantly the frictional coefficient and, thus, shiftthe glass transition to higher temperature. More importantly, larger values ofb reduce theslope of the storage modulus across the glass transition. This effect can also be seen inthe slight decrease of the loss modulus peak with increasingb. The value ofb has noeffect on the rubberyG8 or any features of the response below the glass transitiontemperature. We choose the value ofb by attempting to match the predicted and experi-mental slopes ofG8 in the glass transition.
Figure 9~b! shows the effect of varying values ofz0 on the predicted material re-
FIG. 7. NormalizedP(DHc) given by an exponentially decaying background distribution of activation ener-gies plus two distinct normal distributions centered at 30 and 63 kJ/mol.~b! Corresponding model predictionsof G8 andG9.
662 SIMON AND PLOEHN
sponse. Sincez0 appears as a prefactor in Eq.~17!, larger values ofz0 increase thefriction coefficient and, thus, shift the glass transition to higher temperatures. The valueof z0 has little effect on the loss modulus peak and, likeb, has no effect on the rubberyG8. We can, therefore, determine the value ofz0 by matching the predicted and experi-mental values of the temperature of theG9 peak at the glass transition.
Larger values ofBc0 increase the rate constant for relaxation of side groups on neigh-boring chains, thus, decreasing the temperature of theb transition~Fig. 10!. We chooseBc0 by matching the calculated and experimental values of the temperature of theb-transition peak. As discussed previously, the activation energy distribution functionP(DHc) determines the other features of the response in the glassy region.
D. Comparison with experimental data
The previous section outlines a systematic procedure for choosing values for themodel’s parameters. In Figs. 11 and 12, we compare model predictions with experimentaldata for cured epoxy resins measured by Guptaet al. ~1985!. Tables I~a!–I~d! give theoptimized set of model parameters for this comparison. The form ofP(DHc), given byEq. ~38!, is similar to that shown in Fig. 7~a!, but with only one peak.
Theoretical predictions and experimental data forG8(T) andG9(T) are shown in Fig.11. The chosen value ofBc0 locates the peak of theb relaxation at the correct tempera-ture. The values of the frictional parametersz0 andb correctly locate theG9 peak andthe slope ofG8 at the glass transition. However, the model does not represent accuratelythe peak height ofG9 at the glass transition.
Comparison of calculated and experimentalG8(v) data from isothermal frequencysweep measurements@Guptaet al. ~1985!# in Fig. 12 further illustrate this point. Thiscomparison employs no additional adjustable parameters. At both low and high tempera-tures, the model predictsG8 values close to the experimental data. We observe a signifi-cant deviation in the glass transition regime: the transition occurs over a shorter fre-quency span than in the experimental data. We attribute this deviation to the assumptionof a single relaxation process inherent in the model’s treatment of the simplified two-tube
FIG. 8. Effect of varying values ofnm onG8 ~solid curves! andG9 ~dotted curves! through the glass transitionand rubbery plateau. The arrows indicate the direction of increasingnm .
663VISCOELASTICITY OF CROSSLINKED POLYMERS
configuration. The corresponding loss peak~not shown! is also larger than the corre-sponding experimental values. This may also explain the large loss peak in the isochrone~Fig. 11!. Better prediction of material properties in the glass transition region may beobtained by incorporating a distribution of tube arrangements in a more sophisticatedmodel.
VII. CONCLUSIONS
In this paper, we have proposed a molecular-level description of the dynamic responseof crosslinked polymers to applied uniaxial deformations. The theoretical model consistsof a momentum balance on a representative segment of the polymer network as well asphenomenological descriptions of the forces acting on the segment. The cohesive forceaccounts for the long-range van der Waals attraction between molecules; the entropicforce describes the thermodynamic effects that influence chain dimensions; and the fric-tional force captures the profound effect of temperature on relative chain motion. Ifimproved force models are developed in the future, these can be used within the generalframework constructed here.
The model equations can be solved in the frequency domain to calculate the dynamicmoduli for applied oscillatory uniaxial elongation. Results in the form of isochronal
FIG. 9. Effect of varying values ofb ~a! andz0 ~b! onG8 ~solid curves! andG9 ~dotted curves! at tempera-tures around the glass transition. The arrows indicate the direction of increasing parameter values.
664 SIMON AND PLOEHN
temperature sweeps and isothermal frequency sweeps can be readily calculated. Themodel is the first, to our knowledge, that can describe the complete temperature andfrequency dependence of dynamic moduli, thus, predicting the features of bothb andglass transitions.
We have described a systematic procedure for evaluating all of the model parametersthrough independent experimental measurements. The four adjustable parameters in thethree force expressions can be determined through the use of modulus data from a singleisochronal temperature sweep. We used this procedure to determine parameter values fora cured epoxy resin@Guptaet al. ~1985!#. In this case, the model predicts dynamic shearmoduli that agree qualitatively with experimental data. We also find quantitative agree-ment between theory and experiment for temperatures and frequencies outside of theglass transition region.
Although the model predicts the correct features of the dynamic moduli in the glasstransition, the numerical values of the moduli are not accurate. This discrepancy may bedue to approximations inherent in the two-tube form of the model: in reality, each seg-ment of the polymer network may be contained in more than two subtubes, each havingan arbitrary alignment relative to the imposed deformation. Quantitative accuracy in theglass transition zone can be improved by accounting for the distribution of subtubeorientations.
The viscoelastic glass transition predicted by this model is a purely relaxational phe-nomenon that arises because different forces dominate in various parts of the dynamicmechanical spectrum. The viscoelastic glass transition, as described here, does not re-quire the existance of a dilatational glass transition. However, the dilatational glass tran-sition affects the quantitative features of the dynamic response.
In its present form, we can use the model to explore other issues related to polymerviscoelasticity. For example, the model can be used to examine the validity of time–temperature superpositioning by comparing the ‘‘complete’’ response~model predictionsof dynamic moduli calculated over many decades of frequency! with experimental master
FIG. 10. Effect of varying values ofBc0 onG8 ~solid curves! andG9 ~dotted curves!. The arrows indicate thedirection of increasing parameter values.
665VISCOELASTICITY OF CROSSLINKED POLYMERS
curves as well as ‘‘artificial’’ master curves constructed from calculated frequencysweeps for a limited frequency domain at different temperatures.
We believe that the combination of the molecular-level picture and the mathematicalmodel presented here provide an interesting and useful theoretical platform for under-standing polymer viscoelasticity across the complete spectrum of time and temperature.
ACKNOWLEDGMENTS
The authors wish to thank the U.S. National Science Foundation for financial supportprovided through Grant No. CTS-9258137 and the Offshore Technology Research CenterGrant No. CDR-8721512, and the U.S. Department of Energy for support providedthrough Grant No. DE-FC02-91ER75666.
APPENDIX A: DIMENSIONAL ANALYSIS
We can use dimensional analysis to show that the inertial term in the momentumbalance, Eq.~3!, can be neglected. Using the initial strand lengthl 0 and introducing acharacteristic timet0 , we define dimensionless translated strand length and time asx*5 x/ l 0 andt* 5 t/t0 . Substitution of these definitions into the left-hand side of Eq.~3!
FIG. 11. Comparison of model predictions forG8(T) ~a! andG9(T) ~b! atv 5 10 rad/s with correspondingexperimental data measured by Guptaet al. ~1985!. The model employs Eq.~38! for P(DHc) and parametervalues in Table I.
666 SIMON AND PLOEHN
identifies the characteristic inertial force shown in Table II. Similar characteristic groups,also shown in Table II, may be identified for the cohesive and entropic forces acting onchain segments.
Using the values in Table I, as well as some additional parameter estimates, we canevaluate the magnitudes of these forces in the glassy and rubbery regimes. We choosem 5 10225 kg, e 5 1024, n 5 0.2, andT 5 475 K. At this temperature, Fig. 4 sug-gests that glassy behavior would be observed forv above about 104 rad/s or t0' 1024 s. Under these conditions, the values in Table II show that the inertial force hasa much smaller magnitude than the dominant cohesive force and can, therefore, be ne-glected. The frictional force~not computed! would have a similar magnitude. Higherfrequency would decreaset0 and increase the characteristic inertial force relative to thecohesive force. However, the inertial force in Table II represents an upper limit since itrepresents the inertia of an entire strand rather than just the portion in the entanglementjunction.
FIG. 12. Comparison of model predictions forG8(v) at various temperatures~full curves! with correspondingexperimental data~filled circles with dotted curves! measured by Guptaet al. ~1985!. The model employs Eq.~38! for P(DHc) and parameter values in Table I.
TABLE II. Order-of-magnitude estimates of forces in Eq.~3!.
Force Equation Characteristic group Value att0 5 1024 s Value att0 5 0.1 s
Inertial ~3! ml0
t02
1.9310226 N 1.9310232 N
Cohesive ~10! 3K
ne~122n!
1.4310214 N ' O(10220) N
Entropic ~15! kT
2l0Sa22 1
aD 5.3310216 N 5.3310216 N
667VISCOELASTICITY OF CROSSLINKED POLYMERS
At the same temperature, Fig. 4 implies that rubbery behavior would be observed forv below about 10 rad/s ort0 ' 0.1 s. We expect that the cohesive force has a magnitudecomparable to the entropic force, although we cannot estimate the exact value since Eq.~10! depends on a finite length of strand translation. The inertial force is clearly smallcompared to the entropic force and can be neglected under these conditions.
Under some conditions, the inertial term in Eq.~3! may not be negligible. Retainingthis term increases the order of the differential equation to be solved, but otherwiseintroduces no mathematical difficulties. We have performed calculations in which wehave retained the inertial term and have found that it has little effect on either thequalitative or quantitative features of the results. We have, therefore, neglected this termfor computational expedience.
APPENDIX B: STATISTICAL THEORY FOR THE ENTROPIC FORCE
Consider a set~I! of N chains, each with lengthl 0 , crosslinked, and in their unper-turbed equilibrium state~stateA!. Their end-to-end distances have the most probabledistribution. Upon deformation of the network~stateD!, the end points of the chains arestretched affinely by some extensionax ,ay ,az relative to stateA. In order to calculatethe entropy change due to change in the chain lengths and the corresponding effectivechange in the applied extensions, we need to consider another set~II ! of chains of lengthsl that have the same distribution of end-to-end distances as in stateD. Set II chains mustbe deformed from their most probable distribution in order to occupy the distribution instateD. However, it is not necessarily possible to specify a macroscopic deformation inthree variablesax8 ,ay8 ,az8 that will meet this condition. In order to make furtherprogress, we restrict our analysis to the special case of the uniaxial elongation andintroduce some simplifying assumptions.
First, we assume that the elongation in the mean-square end-to-end distance approxi-mates the elongation in the mean square of its axial~sayx! component, represented by
^r2&
^r02&
'^x2&
^x02&
5 a2, ~B1!
where^r 2& and^x2& are the mean square of the end-to-end distance and itsx component,respectively, and subscript~0! denotes the unperturbed state. Second, we assume that it issufficient for^x2& in the two sets to be equal and, thereby, relax the requirement on thedistribution imposed earlier. We can apply Eq.~B1! to the two sets to get
^x0I2 &
^x0II2 &
5 S a8
a D 2, ~B2!
where subscripts~I! and ~II ! represent the two chain sets. The unperturbed mean-squareend-to-end distance is proportional to the contour length of the chain@Flory ~1953!# sothat
^r0I2 &
^r 0II2 &
5l 0
l. ~B3!
Equations~B1!, ~B2!, and~B3! give
l0
l5 Sa8
a D2, ~B4!
668 SIMON AND PLOEHN
which relates the extensiona applied to the chain ends of set I to the effective extensionapplied to the chain ends of set II in terms of their contour lengths.
The entropy of chain set II@Hill ~1986!#,
DS5kN
2 S32a8222
a8D, ~B5!
relative to its unperturbed state can be related to the conditions in set I through
DS5kN
2S32a2
l0
l22
aA l
l 0D ~B6!
by substituting from Eq.~B4! for a8. The force defined by Eq.~14!
Fls ' 2TS]S
]l DT,V,r
5 2kTN
2 Sa2l0
l22
1
aAl 0lD , ~B7!
is a function of both the applied elongationa and the current length of the chainl (t). Thenew lengthl (t) is related to the chain displacementx(t) through
l~t! 5 l01x~t!. ~B8!
For small values ofx(t), we can use the linearized form given by Eq.~15!.
References
Adams, D. F. and A. K. Miller, ‘‘Hygrothermal Microstresses in a Unidirectional Composite Exhibiting Inelas-tic Material Behavior,’’ J. Compos. Mater.11, 285–299~1977!.
Adolf, D. ‘‘Junction Fluctuations in Confined Chain Models of Rubber Elasticity,’’ Macromolecules21, 2249–2253 ~1988!.
Arridge, R. G. C.,Mechanics of Polymers~Oxford University Press, London, 1975!.Ball, R. C., M. Doi, S. F. Edwards, and M. Warner, ‘‘Elasticity of Entangled Networks,’’ Polymer22, 1010–
1018 ~1981!.Brinson, L. C. and W. G. Knauss, ‘‘Thermorheologically Complex Behavior of Multi-Phase Viscoelastic
Materials,’’ J. Mech. Phys. Solids39, 859–880~1991!.Cohen, M. L. and G. S. Grest, ‘‘The Nature of the Glass Transition,’’ J. Non-Cryst. Solids61, 749–760~1984!.Crossman, F. W., R. E. Mauri, and W. J. Warren, ‘‘Moisture-Altered Viscoelastic Response of Graphite/Epoxy
Composites,’’ inAdvanced Composite Materials–Environmental Effects, ASTM STP 658, edited by J. R.Vinson ~American Society for Testing and Materials, Philadelphia, PA, 1978!, pp. 205–220.
Doi, M. and S. F. Edwards,The Theory of Polymer Dynamics~Oxford University Press, Oxford, 1986!.Doolittle, A. K., ‘‘Studies in Newtonian Flow. II. The Dependence of the Viscosity of Liquids on Free-Space,’’
J. Appl. Phys.22, 1471–1475~1951!.Erman, B. and P. J. Flory, ‘‘Theory of Elasticity of Polymer Networks. II. The Effect of Geometric Constraints
on Junctions,’’ J. Chem. Phys.68, 5363–5369~1978!.Ferry, J. D.,Viscoelastic Properties of Polymers~Wiley, New York, 1980!, pp. 332 and 445.Flory, P. J.,Principles of Polymer Chemistry~Cornell University Press, Ithaca, NY, 1953!.Gaylord, R. J., ‘‘Entanglement and Excluded Volume Effects in Rubber Elasticity,’’ Polym. Eng. Sci.19,
263–266~1979!.Gupta, V. B., L. T. Drzal, C. Y.-C. Lee, and M. J. Rich, ‘‘The Effects of Stoichiometry and Structure on the
Dynamic Torsional Properties of a Cured Epoxy Resin System,’’ J. Macromol. Sci. Phys. B23, 435–466~1985!.
Haward, R. N., ‘‘Introduction–The Nature of Polymer Glasses, Their Packing Density and Mechanical Behav-ior,’’ in The Physics of Glassy Polymers, edited by R. N. Haward~Wiley, New York, 1973!.
Hill, T. L., An Introduction to Statistical Thermodynamics~Dover, New York, 1986!.James, H. M. and E. Guth, ‘‘Theory of the Elastic Properties of Rubber,’’ J. Chem. Phys.11, 455–481~1943!.
669VISCOELASTICITY OF CROSSLINKED POLYMERS
Kirkwood, J. G., ‘‘Elastic Loss and Relaxation Times in Crosslinked Polymers,’’ J. Chem. Phys.14, 51–56~1946!.
Larson, R. G.,Constitutive Equations for Polymer Melts and Solutions~Butterworths, Boston, MA, 1988!, p.53.
Miyase, A., A. W.-L. Chen, P. H. Geil, and S. S. Wang, ‘‘Anelastic Deformation of a Thermoplastic-MatrixFiber Composite at Elevated Temperature; Part II: Time–Temperature Dependent Matrix Behavior,’’ J.Compos. Mater.27, 886–907~1993a!.
Miyase, A., S. S. Wang, A. W.-L. Chen, and P. H. Geil, ‘‘Anelastic Deformation of a Thermoplastic-MatrixFiber Composite at Elevated Temperature; Part III: Structure and Thermomechanical Properties of AS4/PACM-12 Composite,’’ J. Compos. Mater.27, 908–920~1993b!.
Mooney, M., ‘‘A Diffusion Theory of the Visco-Elasticity of Rubbery Polymers in Finite Elastic Strain,’’ J.Polym. Sci.34, 599–626~1959!.
Plazek, D. J., ‘‘Magnetic Bearing Torsional Creep Apparatus,’’ J. Polym. Sci. A26, 621–638~1968!.Pogany, G. A., ‘‘Thea Relaxation in Epoxy Resins,’’ Eur. Polym. J.6, 343–353~1970!.Pomies, F. and L. A. Carlsson, ‘‘Analysis of Modulus and Strength of Dry and Wet Thermoset and Thermo-
plastic Composites Loaded in Transverse Tension,’’ J. Compos. Mater.28, 22–35~1994!.Rigby, Z., ‘‘The Value of Poisson’s Ratio of Viscoelastic Materials,’’ Appl. Polym. Symp.5, 1–8 ~1967!.Rouse, P. E., ‘‘A Theory of the Linear Viscoelastic Properties of Dilute Solutions of Coiling Polymers,’’ J.
Chem. Phys.21, 1272–1280~1953!.Schapery, R. A., ‘‘Stress Analysis of Viscoelastic Composite Materials,’’ J. Compos. Mater.1, 228–267
~1967!.Simon, P. P., ‘‘Modeling the Water-Modified Microstructure and Viscoelasticity of Epoxy Resins and Their
Composites,’’ Ph.D. dissertation, Texas A&M University, College Station, Texas, 1995.Slattery, J. C.,Momentum, Energy, and Mass Transfer in Continua~Krieger, New York, 1981!.Tsenoglou, Christos, ‘‘Viscoelasticity of Rubber Networks with Dangling Chains,’’ Polym. Prepr. Am. Chem.
Soc. Div. Polym. Chem.27, 290–291~1986!.Tsotsis, T. K. and Y. Weitsman, ‘‘Energy Release Rates for Cracks Caused by Moisture Absorption in
Graphite/Epoxy Composites,’’ J. Compos. Mater.24, 483–496~1990!.Weiner, J. H.Statistical Mechanics of Elasticity~Wiley, New York, 1983!.