100
Technical Manual no.9 A Practical Guide to Principles and Procedures Molecular Markers for Tropical Trees

Technical Manual no.9
A Practical Guide to Principles and Procedures
Molecular Markers for Tropical Trees


Molecular Markers for Tropical Trees
by
Alice Muchugi
Caroline Kadu
Roeland Kindt
Hillary Kipruto
Samuel Lemurt
Kennedy Olale
Priscilla Nyadoi
Ian Dawson
Ramni Jamnadass
A Practical Guide to Principles and Procedures
Edited by: Ian Dawson and Ramni Jamnadass

ii
Correct citation: Muchugi A, Kadu C, Kindt R, Kipruto H, Lemurt S, Olale K, Nyadoi P, Dawson I and Jamnadass R (2008) Molecular Markers for Tropical Trees, A Practical Guide to Principles and Procedures. ICRAF Technical Manual no. 9. Dawson I and Jamnadass R. eds. Nairobi: World Agroforestry Centre.
Titles from the Technical Manual series synthesise the outcomes and practical implications of agroforestry research activities and projects that are ready for scaling up. Other publication series from the World Agroforestry Centre include: Agroforestry Perspectives, Occasional Papers and Working Papers.
© 2008 World Agroforestry Centre ICRAF Technical Manual no. 9
World Agroforestry CentreUnited Nations Avenue, Gigiri,P. O. Box 30677-00100, Nairobi, KenyaTel: (+254 20) 722 4000Fax: (+254 20) 722 4001 Email: [email protected]
ISBN: 978-92-9059-225-9
Editors: Ian Dawson and Ramni JamnadassCover photos: Jan Beniest and Tony Simons, © World Agroforestry CentreDesign and Layout: Kris Vanhoutte
Suggestions for additions and revisions for subsequent editions of this guide are wel-come. Please write to: The molecular laboratory, World Agroforestry Centre, P.O. Box 30677 - 00100, Nairobi, Kenya; email: [email protected]
Research with a variety of biological materials and chemicals presents potential haz-ards of exposure that need to be carefully considered. Please carry out all procedures described in this manual in accordance with the local codes of safe practice. The World Agroforestry Centre and the authors assume no liability for any damage, injury or ex-pense that may be incurred or suffered, resulting from the application of the techniques and/or the use of chemicals mentioned in this manual.
This publication may be quoted or reproduced without charge, provided the source is acknowledged.

iii
ACKNOWLEDGEMENTS v
INTRODUCTION - WHY A GUIDE, AND FOR WHOM? 1Purpose and audience 1
What this guide does, and does not, cover 2
How this guide is structured 3
PART I: KEY ISSUES TO CONSIDER BEFORE ENTERING THE LABORATORY 51.1 Understanding population genetics: the basics 5
The principles of population genetics 5
1.2 Understanding population genetics: how molecular markers can help 8
The power of molecular markers 9
How molecular methods can be applied particularly to tropical trees 10
The limitations of molecular methods 11
1.3 Don’t start from scratch: what has already been done? 13
1.4 Field collection: properly structuring sampling 13
1.5 Issues of integration: how will results be applied to management? 16
What’s the problem? 16
What’s the solution? 17
PART II: CHARACTERISTICS OF MOLECULAR METHODS AND PRACTICAL PROCEDURES 19
2.1 Preserving DNA during field collection 20
PROTOCOL 1 - Preserving leaf material using self-indicating silica gel 21
2.2 DNA extraction 22
Specific extraction protocols 22
PROTOCOL 2 - Basic CTAB DNA extraction method 24
PROTOCOL 3 - Basic SDS DNA extraction method 26
2.3 The basis of polymerase chain reaction (PCR) 30
Steps in PCR 31
Equipment for PCR 33
Contents

iv
2.4 Different PCR techniques: their characteristics, with advantages
and disadvantages of each 34
Amplified fragment length polymorphisms (AFLPs) 37
Random amplified polymorphic DNAs (RAPDs) 39
Inter simple sequence repeats (ISSRs) 41
Simple sequence repeats (SSRs) 42
Cleaved amplified polymorphic sequences (CAPS) 44
Choosing the right technique for you 46
2.5 Starting with screening: identifying polymorphism efficiently 53
2.6 Specific PCR protocols: practical procedures 54
PCR components 55
PROTOCOL 4 - Amplified fragment length polymorphism (AFLP) analysis 57
PROTOCOL 5 - Random amplified polymorphic DNA (RAPD) analysis 62
PROTOCOL 6 - Inter simple sequence repeat (ISSR) analysis 64
PROTOCOL 7 - Simple sequence repeat (SSR) analysis 66
PROTOCOL 8 - Cleaved amplified polymorphic sequence (CAPS) analysis 68
2.7 Visualising DNA 70
PROTOCOL 9 - Agarose gel electrophoresis and ethidium bromide staining 70
PROTOCOL 10 - Polyacrylamide gel electrophoresis 73
PROTOCOL 11 - Silver staining 76
PART III: DEALING WITH DATA 79 3.1 Scoring and storing 79
3.2 Common approaches used in analysis 81
Measures commonly applied to both dominant and codominant data sets 82
APPENDIX 1. Glossary of terms 85
APPENDIX 2. Making stock and other commonly used solutions 87
Contents

v
The development of this guide was inspired by a survey of molecular laboratories in low-income countries in the tropics, conducted by the World Agroforestry Centre in 2006. We are grateful to the various donor agencies that have contributed to the development of this manual and to related research at the World Agroforestry Centre: the System-wide Genetic Resources Programme (SGRP), the World Bank, the European Union and the Programme for Cooperation with International Institutes (SII), Education and Development Division of the Netherlands' Ministry of Foreign Affairs.
Special thanks to Joanne Russell of SCRI (UK) for reviewing the structure and content of this guide.
Acknowledgements

1
Introduction • Why a guide, and for whom?Introduction
Why a guide, and for whom?
Purpose and audienceIn the last decade, there has been an enormous increase worldwide in the use of molecular marker methods to assess genetic variation in trees. These approaches can provide significant insights into the defining features of different taxa and this information may be used to define appropriate management strategies for species. However, laboratory techniques are generally expensive, and costs must be weighed carefully against the utility of the information revealed. This is especially important when the total funds available for study of any particular species are limited, as is generally the case for tropical trees because there are so many taxa to research.
A survey of the literature indicates that the implementation of practical, more optimal management strategies based on results from molecular marker research is very limited to date for tropical trees. In order to explore why this is the case, in 2006 the World Agroforestry Centre undertook a survey of molecular laboratories in low-income countries in the tropics. This survey looked at the kinds of molecular marker studies that were being carried out on tree species, and the problems faced by scientists in this research. Lack of knowledge on the different procedures available for molecular genetic studies was an important constraint to efficient use. In addition, laboratories identified an absence of guidance on how best to apply methods specifically to tropical trees, in meaningful and cost-efficient ways. The content of this guide has been developed to help meet these requirements. Although other publications are available that describe molecular marker techniques, none deal with the specific context needed for effective research on tropical trees.
This guide is designed for two main audiences. First, it should be useful for technicians, students and other laboratory researchers that are interested in exploring the practical applications of
Molecular marker methods can provide significant insights into the biology of tree species. They are, however, relatively expensive and their careful application is therefore required. This guide seeks to promote the proper use of these techniques.

2
Introduction • Why a guide, and for whom?
molecular marker techniques for tree management. It is designed especially for those laboratory researchers who find themselves isolated from their peers and who, therefore, find it difficult to share and learn from the experiences of others. Second, this guide is designed for all those – managers and scientists working across disciplines – who need to understand more about what molecular marker research involves. This understanding is essential in order that molecular assessments can be integrated with other types of study and thereby become more effective and efficient.
What this guide does, and does not, coverThis guide deals with molecular marker techniques that are based on the polymerase chain reaction (PCR). It does not cover other methods that are sometimes used to assess molecular genetic variation, such as isozymes. Isozyme analysis was once commonly applied to tropical trees, but is now rarely used because of significant limitations in sampling and analysis. For example, isozymes generally rely on being able to access fresh plant material, and this can be difficult to obtain. In addition, isozymes reveal only limited genetic variation – in the number of loci and allelic richness revealed – when compared with the best PCR-based approaches.
This guide is concerned only with those PCR-based methods that are likely to be available to laboratories operating in low-income countries. As a result, it does not cover some of the advanced procedures now used in high technology, well-funded facilities. It does, however, provide ‘pointers’ for those seeking information on these more advanced methods. As these techniques continue to develop, they are likely to decrease in cost and increase in availability.
This guide is concerned only with ‘population genetic’ applications of molecular markers. It does not consider other ‘biotech’ approaches where the same methods can be applied, for example during marker-assisted selection. Such techniques are commonly applied to important agricultural crops, but their use on tropical
This guide describes molecular marker techniques based on the polymerase chain reaction. It also describes the wider issues that must be considered if laboratory studies are to impact practically on the management of tropical trees.

3
Introduction • Why a guide, and for whom?
trees has been limited to date to a few widely planted industrial species. Most tropical trees are only in the very early stages of the domestication process, where a basic understanding of biology is of more concern than an engagement in sophisticated breeding.
As well as describing different molecular marker technologies, this guide also explains some of the wider issues that must be considered if laboratory studies are to genuinely impact practically on the management of tropical trees. Laboratory workers often fail to properly address points such as integration and wide participation in research, but consideration of issues such as these are essential for deployment and adoption.
How this guide is structuredThis guide is divided into three sections. Part 1 describes some of the key issues that should be considered before starting any laboratory study. Covered in this section are the basics of population genetics and what molecular marker techniques can, and cannot, tell us. Also covered here is the need for proper field collection design. In addition, consideration is given to how to think strategically right at the start of a project, in order that laboratory studies can be properly integrated into other work.
Part 2 relates the characteristics of different PCR-based methods for assessing genetic variation, the advantages and disadvantages of each technique, and the different laboratory protocols for each approach. Part 2 is the main body of this guide. However, we encourage all users to read Parts 1 and 3 before engaging in the methods described in Part 2.
Part 3 considers how to deal with molecular data once it has been produced. Included here are issues such as the proper storage and handling of data, and some basics on analysis. A more detailed presentation of data analysis methods is the subject of another World Agroforestry Centre publication, and appropriate reference to this second guide is given.
Part 1 of this guide describes the issues that should be considered before beginning molecular studies.
Part 2 relates the characteristics and practical procedures of different molecular methods.
Part 3 describes how to handle molecular data once it has been obtained.

5
Introduction • Why a guide, and for whom?Part 1Key issues to consider before entering the laboratory
Students and other researchers sometimes rush to enter the laboratory when they would be better advised to step back and first consider some of the theoretical and practical issues
that lie behind molecular genetic studies. These issues include whether molecular approaches are really the best way to address a particular question, whether sufficient resources are available to do so effectively, and if the right kind of material is available for testing. By pausing to consider these points, the effectiveness of laboratory studies can be greatly improved. In this section, we consider some of the key issues.
1.1. Understanding population genetics: the basics Behind any molecular marker study has to be a basic un-derstanding of population genetics. This means understand-ing the processes that are involved in determining genetic structure within and among populations, and the implica-tions of this structure for optimising management interven-tions. This understanding enables decisions to be made on whether molecular techniques are suitable for addressing the question in hand (within the context of the resources available for the work), what characteristics are required from a molecular method during laboratory and data analy-sis, and how trees need to be sampled in the field.
The principles of population geneticsPopulation genetics is about assessing genetic variation and the way it is structured within and among populations of a species. Studies of population genetic structure involve the analysis of allelic diversities and genotype frequencies in sampled populations. Study assumes that alleles are
Before beginning laboratory research it is important to consider whether molecular approaches are the best way to test a particular hypothesis, whether sufficient resources are available to address the question in hand, and if the material needed for testing can be easily obtained.
To design a molecular marker study properly, a basic understanding of population genetics is required.
6
Part 1 • Key issues to consider before entering the laboratory
inherited following the standard Mendelian rules that are applied in genetics. Once structure has been characterised, the next step is to try and understand variation in the ‘biological’ context of the various forces shaping diversity, such as mutation, migration, recombination, selection and drift, each of which is described below (see Appendix 1 for further definition of terms). Through this understanding, better ways to use and conserve species can be devised.
MutationA mutation is a permanent structural alteration in DNA caused, e.g., by errors in DNA replication or radiation. At a local level, a single nucleotide in a DNA sequence may change. At a higher level, parts of chromosomes may be moved around, duplicated or deleted. Mutation is the ulti-mate source of genetic variation, resulting in the develop-ment of new alleles. Mutation generally occurs only rarely, although it is more frequent in certain regions, e.g., at short simple sequence repeats in the genome (SSRs), something that is exploited in marker analysis (see Part 2 of this guide). Mutation can have no effect on function, may be deleteri-ous, or can occasionally be favourable and thereby improve an organism’s chances of survival. If a mutation at a locus is favourable, then frequencies of the beneficial allele will increase from generation to generation in a population, and this allele may also then migrate to other stands (see more below).
MigrationMigration is the movement of individuals, or any form of transfer of genetic material, from one population to an-other. Migration (or gene flow) can occur through natural means – the natural dispersal of seed and pollen – or can be assisted through human movement, e.g., by farmers plant-ing tree seed collected from one area in another location. Important factors that determine the rate of migration in-clude the abundance of natural dispersal agents, the distance that dispersal agents can move, the extent to which humans have fragmented the landscape in which a taxon is found,
The study of population genetics is about assessing genetic variation and the way it is structured in an organism, and then using this information to understand the biology of a species and management options.
7
Part 1 • Key issues to consider before entering the laboratory
and the level of human cultivation of a species. By increasing genetic variability, migration may improve the adaptability of a population to environmental changes such as global warm-ing. By ‘blending’ populations, migration also helps to pre-vent their divergence. The effects of migration, however, can also be negative. For example, by allowing introduced culti-vated populations to ‘pollute’ neighbouring natural stands, co-adapted gene complexes contained in the latter will be displaced. Human movement of germplasm may result in the hybridisation of cultivated populations with natural stands of the same species and/or with other related taxa (e.g., other species in the same genus).
RecombinationRecombination is the process of generating new mixtures of diversity by exchanging parts of DNA molecules. It does not in itself create new variation, but generates novel combina-tions of existing diversity by ‘shuffling’ loci in different ways. Recombination can occur within as well as between genes, and is part of the process of sexual reproduction.
SelectionSelection occurs when genetic changes such as mutations result in differences in fitness in an organism. If a change is favourable for fitness, then the organism is more likely to survive and reproduce, passing that change on. Conversely, if a change is deleterious, it is less likely to be inherited. Selection is both a natural process – depending on the spe-cific natural environment in which an organism grows – and something resulting from human action. In the latter case, domestication over several millennia for some tree species has led to selection of those individuals that have the char-acteristics – e.g., large fruit, a straight trunk – that humans desire. As a result, cultivated trees occasionally look quite different from their natural counterparts. Other – more general, more recent and often unconscious – human selec-tion pressures include factors such as pollution, logging, for-est fragmentation, climate change, grazing, and soil erosion. Human selection may decrease diversity in stands, which has

8
Part 1 • Key issues to consider before entering the laboratory
long-term negative consequences for fitness because of like-ly inbreeding depression (see more below). On the other hand, human selection may preferentially sample heterozy-gote conditions and thereby increase variation and improve overall fitness.
DriftDrift refers to changes in allele frequencies that occur by chance, as a result of random or ‘stochastic’ sampling proc-esses during regeneration. When populations are small, genetic drift can result in large losses in diversity and sig-nificant changes in genetic structure. Low frequency alleles especially are likely to be lost from populations, leaving loci in fixed (homozygous, non-polymorphic) states. An example where drift is likely is in tree planting programmes where seed is collected for wide distribution from only a small number of mother trees. The extent to which drift occurs does not depend only on the census size of a population, but on factors such as the breeding system of the species in question, which determines ‘effective’ population size.
1.2. Understanding population genetics: how molecular markers can helpGenetic variation can be quantified in tree species in a number of different ways. Phenotypic measurements can be taken and further information can be obtained by asking the people that use trees about the characteristics they observe and value. Such observations can, however, only describe a small portion of the underlying genetic variation present in a particular tree species. In addition, measurements are not easily understandable in the context of the biological proc-esses involved in shaping genetic structure. Furthermore, morphological markers are sensitive to the specific envi-ronment in which individual trees grow. This environment may vary greatly even within single stands of natural or farm trees, making fair comparison of the genetic (heritable) part of variation difficult, unless expensive controlled field trials are used.
Genetic variation can be quantified through phenotypic measurements. However, these only describe a small proportion of the variation present in a species, are difficult to relate to many biological processes and are sensitive to environmental factors.
9
Part 1 • Key issues to consider before entering the laboratory
Molecular markers are able to provide detailed information on how genetic variation is structured in natural, managed and cultivated tree stands.
The power of molecular markersMolecular markers are able to provide detailed information on how genetic diversity is structured within and among tree stands. Molecular markers are numerous in number – which means they can give high resolution – and can be found in nuclear, mitochondrial and chloroplast DNA. Because these genomes are inherited in different ways, markers to each can reveal different things about tree populations. In fact, mi-tochondrial and chloroplast genomes are normally inherited through the maternal parent only. Unlike nuclear DNA, they are thus able to reveal ‘seed-specific’ markers.
Molecular markers can be used to study natural, managed and cultivated tree stands, and can measure the extent that individuals and populations are connected to each other. They are able to establish the breeding systems of popu-lations, can determine relationships among different taxa, are able to assess hybridisation and other interactions be-tween species, and can help determine human impacts on tree stands, e.g., through forest fragmentation, selection and cultivation. In theory, knowledge in all of these areas can be used to devise better management strategies for tree spe-cies within natural and human landscapes.
At the simplest level, by assessing whether or not variation is geographically structured among stands, it should be pos-sible to devise better strategies for sampling populations in domestication/improvement programmes. In addition, such testing should help identify genetically different stands that may be targets for conservation. Furthermore, since most tree species are out-crossing, they can suffer from inbreed-ing depression if genetic variation is low. Molecular mark-ers can therefore be used to identify highly diverse natural stands that are suitable for cultivation because they are likely to avoid inbreeding. The negative consequences of inbreed-ing have been extensively documented in trees, and include limited fruit set, reduced overall seed yield, lower seed ger-mination rates, reduced seedling survival, losses in vigour

10
Part 1 • Key issues to consider before entering the laboratory
and poor growth form. As well as preventing inbreeding depression, high levels of genetic variation in populations provide an adaptive capacity to respond to pressures such as changes in pest and disease prevalence, the varying re-quirements of users, and an altering global climate.
More subtly, through working out the reproductive biology of tree species, it should be possible to use molecular mark-ers to better take into account the behaviours of pollina-tors and seed dispersers when devising management strate-gies. Through a combination of field and laboratory work, it should be possible to determine appropriate densities and configurations for tree planting on farms, identify relevant niches for cultivation, find ways to manage pollinators that maximise productivity (e.g., to maximise fruit yields), and design suitable corridors for linking forest fragments.
Assessing patterns of genetic variation also provides infor-mation on the long-term changes that have occurred in the landscape in which a tree species is found. Any unexpected ‘disjunctions’ in genetic structure may relate to past varia-tions in climate that have led to repeated expansions and contractions of different vegetation types. Molecular mark-ers may assist in the identification of forest refugia – partic-ularly diverse regions that have survived past contractions in forest cover – that are especially worthy of conservation. Such information is also relevant for predicting how tree species will respond to current changes in climate through human-induced global warming, allowing management strat-egies to be developed that minimise impacts on natural for-ests and agroforestry ecosystems.
How molecular methods can be applied particularly to tropical treesWith a few exceptions – most of which are important tim-ber species – the genetic structure of tropical trees has re-ceived limited research attention. For most species, there-fore, how genetic diversity is distributed within geographical space is unclear. Furthermore, how the distribution of this
11
Part 1 • Key issues to consider before entering the laboratory
variation depends on the breeding system of a species, and on processes such as climate change, floral evolution, forest management and cultivation, is largely unknown. This lack of understanding is a disincentive to use, because it makes it difficult or impossible to choose between the different options that are available for management of a particular species, only some of which options will prove to be sus-tainable.
Particular features of trees, such as longevity, long genera-tion interval and large size, impact in unique ways on ge-netic structure. Extrapolations for management based on other flora are, therefore, difficult. There are, then, particular opportunities to apply recently developed molecular tech-niques to quantify genetic diversity in tropical trees. This is especially the case when the cost of alternative methods to assess variation, such as field trials, are considered. The unique features of trees – especially their large size – make the costs of field trials high.
In the last few years, agroforestry has been more fully rec-ognised as a land-use practice that can contribute to both biodiversity conservation and livelihood development, and this has lead to greater interest in understanding the genetic variation of trees within these systems. This is especially so as the roles of intraspecific diversity in underpinning wider ecosystem functions have become evident. This interest needs to be underpinned by increased genetic research on farm populations of tree species.
The limitations of molecular methodsAlthough molecular marker techniques are often able to re-veal much polymorphism, there are limitations to how data can be used. Molecular approaches generally reveal mark-ers that are phenotypically neutral – that is, the variation observed is not directly linked to known function, or to the adaptive capacity or productivity of individuals. Neutrality is an important advantage in many population genetic applica-tions, because possible selection biases that would prevent a
Little information is available on how genetic variation is structured in tropical trees. There are, therefore, particular opportunities to apply modern molecular methods to quantify diversity.

12
Part 1 • Key issues to consider before entering the laboratory
full understanding of species biology are avoided. Neutrality, however, also has a down side, because practical field man-agers are often most interested in understanding expressed differences in function, growth and other aspects of physical performance that are present within and among tree popu-lations. In such circumstances, whether molecular markers are genuinely able to provide additional useful data in a cost-effective way is something that must be considered on a case-by-case basis. When engaging in any molecular marker study, there is no substitute for continuing to assess the field ecology and phenotypic variation of the same species, ide-ally using the same populations being tested in the labora-tory. Later on, both field and laboratory observations can be combined together to develop more refined management plans than either approach could alone provide.
A second limitation to how molecular data can be used is in-herent in the varying characteristics of the different marker systems available. Some marker systems provide dominant markers, while others provide codominant ones. Some sys-tems can provide information at very many loci, while oth-ers are able to provide data at only a few. The latter systems may, however, be able to describe very large numbers of alleles at the particular individual loci assessed. What these differences mean is that no single laboratory technique is a ‘catch all’ able to provide all the answers in molecular ge-netic studies. Each approach has different limitations, and these must be considered carefully before devising a labora-tory programme, in terms of the underlying objectives of research and the funds available to undertake it.
Often, it is the less costly laboratory techniques that provide the lowest quality of information. When only such methods are available, it is important to consider whether the result-ing data will exceed the ‘threshold level’ by which they can be applied usefully to field management. In other words, the tradeoff between ‘cost’ and ‘quality’ is something that must be carefully considered. These issues – of technique, infor-mation content and possible application – are considered further in Part 2 of this guide.
Although molecular marker techniques can reveal detailed patterns of genetic variation, there are limitations to how data can be used.

13
Part 1 • Key issues to consider before entering the laboratory
1.3. Don’t start from scratch: what has already been done?Before starting any molecular marker study, it is always wise to learn from the experiences of others. It is thus important to find out what research has already been done – on the same or related species and/or in addressing similar ques-tions – by other workers. Even if, as will often be the case, work on the particular species you are interested in has not been carried out, others may have had similar experimen-tal objectives when researching other trees. Their successes and mistakes allow lessons to be learnt when developing appropriate strategies for your work.
There are several ways to look for information on previ-ous molecular studies. These include journal and abstract searches, the use of Internet search engines, and direct con-tact with institutions and scientists that are known to be interested in particular species or topics. A good place to start your search is in the National Center for Biotechnology Information (USA) database (NCBI), which is available on the Internet (at: http://www.ncbi.nlm.nih.gov/). This world-rec-ognised database is a depository for up-to-date information on all aspects of biotechnology research. The nucleotide and publication citation sub-sections contain considerable useful information on whether, where and when molecular mark-ers have been used on particular species or genera.
1.4. Field collection: properly structuring
samplingField sampling must be structured in such a way that mo-lecular analysis is able to say something meaningful about the biology of the species in question. Without a rigorous approach to sampling, the results of laboratory research will be inconclusive, or, worse, inaccurate and possibly mislead-ing. Or, to put it simply, ‘garbage in’ means ‘garbage out’. In this respect, molecular genetic studies can only ever be as good as the strategy adopted during field collection.
In order to prevent unnecessary duplication of work and adopt the right experimental strategy, it always makes sense to learn from the experiences of others.

14
Part 1 • Key issues to consider before entering the laboratory
Designing a proper sampling approach depends on the species in question, the laboratory technique that will be applied in analysis and the specific hypothesis being addressed. Furthermore, sam-pling is something of a ‘chicken and egg’ situation, in which the specifics for a taxon only become clear through laboratory analy-sis itself. In this situation, an iterative approach is best, in which initial sampling at low intensity is followed by laboratory tests and then further, more detailed, collection. At the same time, sampling has to be pragmatic, and it is often not possible to fully meet ideal conditions. For example, the costs involved in sampling may mean that only one collection trip is possible. In this situation, sampling must be as good as possible based on the limited knowledge that is available.
Despite the dependence of sampling methods on the specifics of a given species and situation, some general guidance is available from what limited information is known to date about genetic structure in tropical trees. This information can provide ‘boundary conditions’ to sampling, in terms of the numbers of individuals and populations that should be collected. If it is clear that these condi-tions cannot be met, molecular markers may not be a cost-effec-tive approach for research.
In general, molecular studies to date suggest that: (i) most tropi-cal tree species contain relatively high levels of variation in natu-ral populations when compared to other plant groups, (ii) some limited local structure exists within wild stands; and (iii) relatively little variation partitions between natural populations as a func-tion of geographic distance, although there is more partitioning in tropical than temperate trees. One reason for limited molecular differentiation between stands may be the frequently continuous or semi-continuous distributions of tree species within their na-tive ranges, which allow for genetic exchange. Furthermore, the predominantly out-breeding nature of most trees appears to pre-vent the build-up of genetic structure by reducing related matings at a local level. The simple fact that most trees are large also tends to limit local differentiation, by promoting long distance pollen and seed movement.
Molecular studies are only effective when a good field sampling strategy is adopted prior to laboratory analysis. Developing a suitable sampling method requires that, as much as is possible, prior knowledge on genetic structure in tropical trees is properly applied.

15
Part 1 • Key issues to consider before entering the laboratory
Since differentiation among natural populations is generally be-lieved to be low, extensive sampling of each of only a few widely spaced wild stands can be a relatively effective technique for cap-turing the underlying genetic diversity in a tree species. Ideally, 30 or more individuals should be sampled per population, with (if possible) a minimum of 100 m between sampled trees in a stand. It should be remembered, however, that such a sampling approach does not necessarily capture adaptive diversity that is useful for field management purposes. Adaptive variation among populations may be considerably higher than overall genetic variation is, and it is more likely to be structured along ecological gradients that do not always relate to the geographical distance between stands.
Considering managed and cultivated tree stands, most of the very limited evidence available to date suggests that human activity has generally not resulted in large losses in genetic diversity. This may be because of the longevity of trees species, which means that diversity is lost very slowly. In addition, in many areas intensive human management of forest has occurred only recently. There are, however, exceptions to this situation, e.g., in cultivated species that have been trans-located by humans to new regions, and in trees that have been planted by people for millennia. In these cases, bottlenecks in regeneration can result in a narrowing of genetic diversity in planted material. Even in these examples, however, the genetic base of cultivated stands generally appears to remain rela-tively high.
Since diversity losses in cultivated stands generally appear to be low, if molecular studies are specifically designed to assess genetic bottlenecks, then large numbers of individuals need to be sampled from populations in order to have a chance of detection. Ideally, in this situation 50 or more individuals should be sampled from a stand. In addition, suitable ‘control’ stands, where bottlenecks are not expected (e.g., wild populations), must be collected. Unless controls are included, the magnitude of any bottlenecks will be unclear.
16
Part 1 • Key issues to consider before entering the laboratory
1.5. Issues of integration: how will results be applied to management?Despite the value theoretically of molecular markers for developing better management strategies for tropical trees, the actual application of laboratory results has been disap-pointingly low to date. In fact, very little work has yet to be described in terms of real outcomes for the practical man-agement of species at field, market and policy levels.
What’s the problem?One of the key reasons for current limited practical ap-plication is the lack of consideration given by laboratory researchers to the much wider multidisciplinary context within which molecular genetic variation studies need to be placed for management purposes. This problem is not unique for trees, but is a feature common to biotechnology-based research on many plant species (Dawson and Jaenicke, 2006). A lack of proper integration is made worse by the centralised nature of much laboratory work, which means that there is a danger that research objectives become dis-connected from the actual practical needs of the people that use and manage tree species. In fact, much molecular marker research on tropical trees is undertaken in coun-tries and regions other than where a species actually grows and needs to be managed. Taking Africa as an example, most molecular marker work conducted to date on trees native to the continent has been undertaken in laboratories in Europe and North America. Concerns internationally may be very different from those locally, and this difference in emphasis is an important justification for the promotion of laboratory research directly in low-income countries.
Compared to other biotechnology-based applications such as genetic modification and micropropagation (see Dawson and Jaenicke 2006 for an overview of these techniques), lack of integration with other disciplines seems to be a particu-lar problem for molecular marker studies. As countries and
Despite their potential, molecular markers have not yet been widely used to optimise actual management practices for tropical trees. There are, however, ways to improve this disappointing situation, such as through improved partnerships with other disciplines.

17
Part 1 • Key issues to consider before entering the laboratory
institutions have made efforts to become more involved in ‘modern’ methods of research, basic molecular marker approaches have appeared to represent a less costly and hence ‘soft option’ when compared to other more ‘hi-tech’ biotechnology applications. The relative ease of access to molecular marker methods appears, however, to have re-sulted in insufficient critical attention being given to their proper application. For tropical trees, of particular concern is occasionally extensive research that has been undertaken on species for which no domestication or significant man-agement programme is currently underway, envisaged, or even possible, and where the application of data to practical issues will thus always be very limited.
What’s the solution?Establishing proper partnerships between the various stake-holders involved will ensure better integration of molecular marker studies with other research. It follows that, in the formulation of any particular project, consideration should be given at an early stage to the integration between mo-lecular studies and other activities. Improved partnerships are needed between laboratory researchers, forest ecolo-gists, agronomists, social scientists, policy experts and those actually responsible for implementing management plans – be they government services, non-governmental organisa-tions or local communities – at a field level. Examples where partnerships result in improved management should be pro-moted as best practice to the scientific community. To iden-tify these examples, projects need to monitor the benefits of laboratory characterisation in the context of actual de-ployment of new management options. The indicators used for monitoring should be common across projects, so that objective comparisons can be made. Indicators need to be few in number and simple to measure.
To better apply molecular techniques, improved partnerships are needed between laboratory researchers, forest ecologists, agronomists, social scientists, policy experts and those actually responsible for implementing management plans on the ground.

18
Part 1 • Key issues to consider before entering the laboratory
Key referencesDawson IK, Jaenicke H (2006) Underutilised Plant Species: The Role of Biotechnology.
International Centre for Underutilised Crops Position Paper No. 1. International Centre for Underutilised Crops (ICUC), Colombo, Sri Lanka. Available through ICUC’s website: http://www.icuc-iwmi.org/
de Vicente MC, Fulton T (2003) Using Molecular Marker Technology in Studies on Plant Genetic Diversity. International Plant Genetic Resources Institute (now Bioversity International), Rome, Italy and Institute for Genetic Diversity, Ithaca, New York, USA. Available at: http://www.bioversityinternational.org/Publications/Molecular_Markers_Volume_1_en/index.asp
de Vicente MC, López C, Fulton T (2003) Genetic Diversity Analysis with Molecular Marker Data. International Plant Genetic Resources Institute (now Bioversity International), Rome, Italy and Institute for Genetic Diversity, Ithaca, New York, USA. Available at: http://www.bioversityinternational.org/Publications/Molecular_Markers_Volume_2_en/index.asp
19
Part 2 • Characteristics of molecular methods and practical proceduresPart 2Characteristics of molecular methods and practical
procedures
This guide is concerned with molecular marker methods based on the polymerase chain reaction (PCR). The first practical step in undertaking PCR is to extract DNA
from the organism in question. After this, a variety of different techniques can be used to screen for and quantify variation. Different techniques are appropriate in different circumstances, and polymorphisms can be visualised in different ways. In this section of the guide, we consider the different ways that DNA can be preserved during field collection and protocols for extraction in the laboratory. Further, we consider the basic principles of PCR and the different features of the various techniques. We then discuss approaches for initial screening for polymorphism in the laboratory. Finally, we describe the specific protocols for different PCR methods and the ways to visualise polymorphisms. Before using the practical protocols in this section of the guide, we ask all readers to become familiar with Parts 1 and 3 first.
Polymerase chain reaction (PCR), a technique developed in the 1980s, allows the selective in vitro amplification of DNA and is the usual approach now used for molecular marker studies. The elements involved in PCR are described here.
A note on protocols
Specific protocols are shown in shaded boxes (such as this one). Various protocols
show some repetition in content, but to allow techniques to be followed easily
by users of this guide – without cross-referencing between boxes – we normally
provide full descriptions in each case.
20
Part 2 • Characteristics of molecular methods and practical procedures
2.1. Preserving DNA during field collectionIt is self-evident that molecular studies can only be successful when the plant material collected in the field – be it leaves, flowers, pollen, seeds or other tree parts – yields DNA of suitable quality for analysis. Just how good DNA needs to be for successful analysis depends on the molecular marker approach being used (see later in this section). Unless DNA can be extracted immediately after field sampling, proper collection means preserving samples to prevent their degra-dation. For seed, this means collecting when mature and en-suring that viability is maintained through suitable process-ing and storage, so that plants can be raised later on.
Most molecular studies rely on DNA extracted from leaves, and a number of methods have been suggested for their field preservation. The best method is to freeze material quickly after collection and then keep it frozen until the time it is needed for DNA extraction. It is rare, though, that freez-ing facilities are available during field collection, especially if working in remote areas. In such circumstances, the easiest and most common method used to preserve leaf material is to dry with self-indicating silica gel (see PROTOCOL 1).
Although the silica gel method has been used successfully for a range of trees, it is not always effective. For some species, leaf material degrades significantly during silica drying, often indicated by a change in colour to brown or black, making it difficult to extract good quality DNA. When collecting a new species, the value of the silica gel approach for preservation should be tested before it is widely applied. This will involve preliminary DNA extractions and PCR test runs.
A variety of other methods have also been used to collect leaf material. DNA can be extracted from herbarium speci-mens collected in a herbarium press in the normal way, al-though if hot air is used to dry samples this will likely result in DNA degradation. In some cases, DNA useful for marker studies has been extracted from very old herbarium speci-mens. Generally, however, the low quality of the DNA pro-vided by old specimens means that only certain PCR-based
Molecular studies can only be successful when the plant material sampled in the field is able to yield suitable quality DNA in the laboratory.
21
Part 1 • Key issues to consider before entering the laboratory
methods (see later in this section) are effective in revealing genetic variation.
Various liquid fixatives and buffers may also be used to pre-serve leaf samples. Some of these solutions are commercially available from a variety of different suppliers. Any method that uses liquid can be inconvenient in the field, but such protocols are worth considering if it is difficult to preserve material in other ways. As with the silica method, the utility of any par-ticular technique should be tested in the laboratory. Ideally, several protocols should be tested and the best chosen for further sampling.
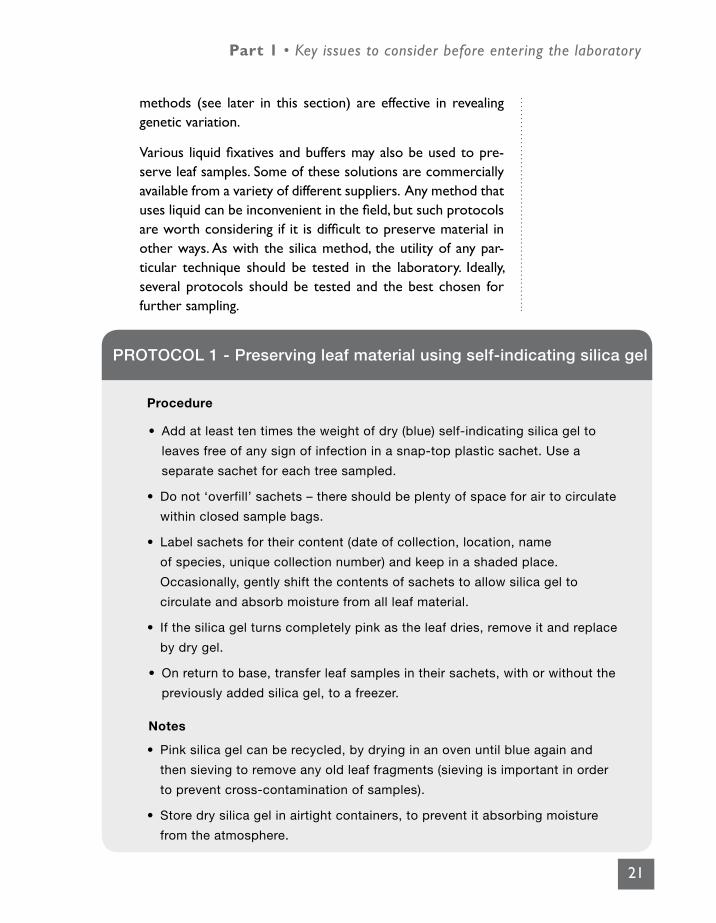
Procedure
• Add at least ten times the weight of dry (blue) self-indicating silica gel to
leaves free of any sign of infection in a snap-top plastic sachet. Use a
separate sachet for each tree sampled.
• Do not ‘overfill’ sachets – there should be plenty of space for air to circulate
within closed sample bags.
• Label sachets for their content (date of collection, location, name
of species, unique collection number) and keep in a shaded place.
Occasionally, gently shift the contents of sachets to allow silica gel to
circulate and absorb moisture from all leaf material.
• If the silica gel turns completely pink as the leaf dries, remove it and replace
by dry gel.
• On return to base, transfer leaf samples in their sachets, with or without the
previously added silica gel, to a freezer.
Notes
• Pink silica gel can be recycled, by drying in an oven until blue again and
then sieving to remove any old leaf fragments (sieving is important in order
to prevent cross-contamination of samples).
• Store dry silica gel in airtight containers, to prevent it absorbing moisture
from the atmosphere.
PROTOCOL 1 - Preserving leaf material using self-indicating silica gel

22
Part 2 • Characteristics of molecular methods and practical procedures
2.2. DNA extractionIn our experience, the inability to extract good quality DNA from specimens is an important limiting factor in molecular marker studies on tropical trees. Since different trees show great variations in their biochemistry, it is impossible to de-fine a single DNA extraction technique that is successful for all species. Rather, different taxa, sometimes even within the same genus, respond differently to the various DNA extraction methods that are available. Extraction is com-plicated by the presence in some species of highly viscous polysaccharides that render the handling of samples difficult, and the co-isolation of polyphenols and other secondary compounds that cause damage to DNA, and/or inhibit the enzymes used in marker analysis.
Although generalisations are difficult, certain extraction techniques have been shown to be more successful than others. The starting point when working on a new species is to begin with simple methods. If these approaches are inef-fective, then other, more complex, methods will need to be considered. Developing a successful method for a particu-lar species may mean considerable experimentation, testing the effects of various adjustments to published protocols. To experiment in this way, researchers need to understand the various functions of the different chemicals commonly used during DNA extraction. This involves detailed reading of protocol descriptions. If no extraction method proves successful for material collected in a certain way (e.g., as silica-dried leaf samples), then others methods by which to collect leaf – or other plant material – will need to be found. If it is only possible to extract poor quality DNA from a tree, then the type of PCR technique that can be applied to analysis will be limited (see more below).
Specific extraction protocolsMost DNA extraction protocols have the same general fea-tures. The sample is crushed, proteins, carbohydrates and
Tree species show great variations in their biochemistry, meaning that they respond differently to different DNA extraction methods.
23
Part 2 • Characteristics of molecular methods and practical procedures
other compounds are removed and the DNA precipitated. DNA is then re-suspended in buffer. Two common and rela-tively simple methods of extraction that we have found to be generally effective for trees are based on the use of the detergents hexadecyltrimethylammonium bromide (CTAB) (see PROTOCOL 2) and sodium dodecyl sulfate (SDS) (see PROTOCOL 3). These methods can be used for DNA ‘mini-preparations’, which provide adequate quantities of starting material for most PCR-based studies. During extraction, it is important that good laboratory practice is followed. This means cleaning surfaces after extractions have been under-taken, so that no cross-contamination of samples can occur when it comes to carrying out PCR. This is especially impor-tant when using ‘non-specific’ primers during PCR analysis, since such primers will certainly amplify any contaminant DNA (see more below).
Scientists at the World Agroforestry Centre have complied a list of over 30 extraction methods that may be useful for trees. These protocols can be obtained by contacting the laboratory (see contact details at the beginning of this guide).
Most DNA extraction protocols have the same general features, and involve crushing of the sample, removal of contaminants and precipitation of DNA.

24
Part 2 • Characteristics of molecular methods and practical procedures
PROTOCOL 2 - Basic CTAB DNA extraction method
Required reagents
2 X CTAB extraction buffer (warmed to 65°C)
Chloroform-isoamyl alcohol (24:1)
Isopropanol (keep in freezer)
70% ethanol
1X TE buffer
2 X CTAB extraction buffer has the following composition:
2% CTAB, 1.4 M NaCl, 100 mM Tris-HCl, 20 mM EDTA,
0.2% 2-mercaptoethanol. To make, mix the following components and
adjust the volume to 1 litre with distilled water:
20 g CTAB
280 ml 5 M NaCl stock solution
100 ml 1 M Tris-HCl (pH 8.0) stock solution
40 ml 0.5 M EDTA (pH 8.0) stock solution
Then dispense into 500 ml or smaller aliquots and sterilise by autoclaving.
To use, aliquot an appropriate volume into a clean tube and then add 20 µl
of 2-mercaptoethanol per 10 ml solution. Do not add the
2-mercaptoethanol to the mixture before autoclaving, only afterwards.
Warm the buffer to 65°C (in a water bath) before use.
See notes box for further details on the procedure described below (on
A, B, C, etc.). See Appendix 2 for information on how to make stock and
other common solutions.
Procedure (A)
1. Place a small amount of leaf material (~ 1 cm2 fresh leaf, or about half
this amount of dried leaf) in a sterile 1.5 ml micro-centrifuge tube and
add a small volume of liquid nitrogen. (B, C)
2. Grind to a fine powder with a sterile plastic micro-pestle. (D)
25
Part 2 • Characteristics of molecular methods and practical procedures
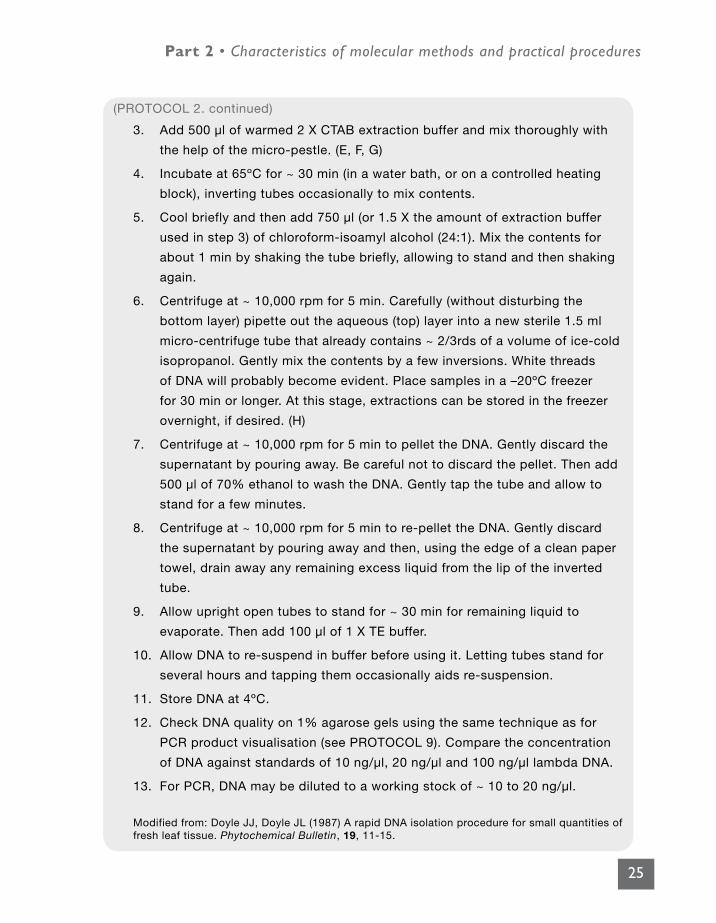
3. Add 500 µl of warmed 2 X CTAB extraction buffer and mix thoroughly with
the help of the micro-pestle. (E, F, G)
4. Incubate at 65oC for ~ 30 min (in a water bath, or on a controlled heating
block), inverting tubes occasionally to mix contents.
5. Cool briefly and then add 750 µl (or 1.5 X the amount of extraction buffer
used in step 3) of chloroform-isoamyl alcohol (24:1). Mix the contents for
about 1 min by shaking the tube briefly, allowing to stand and then shaking
again.
6. Centrifuge at ~ 10,000 rpm for 5 min. Carefully (without disturbing the
bottom layer) pipette out the aqueous (top) layer into a new sterile 1.5 ml
micro-centrifuge tube that already contains ~ 2/3rds of a volume of ice-cold
isopropanol. Gently mix the contents by a few inversions. White threads
of DNA will probably become evident. Place samples in a –20oC freezer
for 30 min or longer. At this stage, extractions can be stored in the freezer
overnight, if desired. (H)
7. Centrifuge at ~ 10,000 rpm for 5 min to pellet the DNA. Gently discard the
supernatant by pouring away. Be careful not to discard the pellet. Then add
500 µl of 70% ethanol to wash the DNA. Gently tap the tube and allow to
stand for a few minutes.
8. Centrifuge at ~ 10,000 rpm for 5 min to re-pellet the DNA. Gently discard
the supernatant by pouring away and then, using the edge of a clean paper
towel, drain away any remaining excess liquid from the lip of the inverted
tube.
9. Allow upright open tubes to stand for ~ 30 min for remaining liquid to
evaporate. Then add 100 µl of 1 X TE buffer.
10. Allow DNA to re-suspend in buffer before using it. Letting tubes stand for
several hours and tapping them occasionally aids re-suspension.
11. Store DNA at 4oC.
12. Check DNA quality on 1% agarose gels using the same technique as for
PCR product visualisation (see PROTOCOL 9). Compare the concentration
of DNA against standards of 10 ng/µl, 20 ng/µl and 100 ng/µl lambda DNA.
13. For PCR, DNA may be diluted to a working stock of ~ 10 to 20 ng/µl.
Modified from: Doyle JJ, Doyle JL (1987) A rapid DNA isolation procedure for small quantities of fresh leaf tissue. Phytochemical Bulletin, 19, 11-15.
(PROTOCOL 2. continued)
26
Part 2 • Characteristics of molecular methods and practical procedures
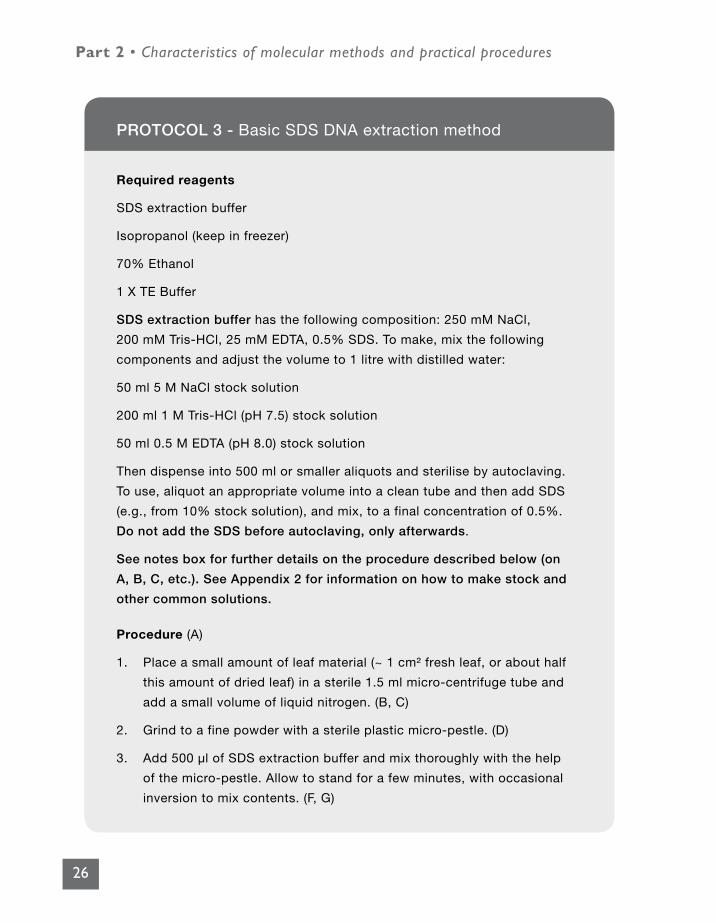
PROTOCOL 3 - Basic SDS DNA extraction method
Required reagents
SDS extraction buffer
Isopropanol (keep in freezer)
70% Ethanol
1 X TE Buffer
SDS extraction buffer has the following composition: 250 mM NaCl,
200 mM Tris-HCl, 25 mM EDTA, 0.5% SDS. To make, mix the following
components and adjust the volume to 1 litre with distilled water:
50 ml 5 M NaCl stock solution
200 ml 1 M Tris-HCl (pH 7.5) stock solution
50 ml 0.5 M EDTA (pH 8.0) stock solution
Then dispense into 500 ml or smaller aliquots and sterilise by autoclaving.
To use, aliquot an appropriate volume into a clean tube and then add SDS
(e.g., from 10% stock solution), and mix, to a final concentration of 0.5%.
Do not add the SDS before autoclaving, only afterwards.
See notes box for further details on the procedure described below (on
A, B, C, etc.). See Appendix 2 for information on how to make stock and
other common solutions.
Procedure (A)
1. Place a small amount of leaf material (~ 1 cm2 fresh leaf, or about half
this amount of dried leaf) in a sterile 1.5 ml micro-centrifuge tube and
add a small volume of liquid nitrogen. (B, C)
2. Grind to a fine powder with a sterile plastic micro-pestle. (D)
3. Add 500 µl of SDS extraction buffer and mix thoroughly with the help
of the micro-pestle. Allow to stand for a few minutes, with occasional
inversion to mix contents. (F, G)
27
Part 2 • Characteristics of molecular methods and practical procedures
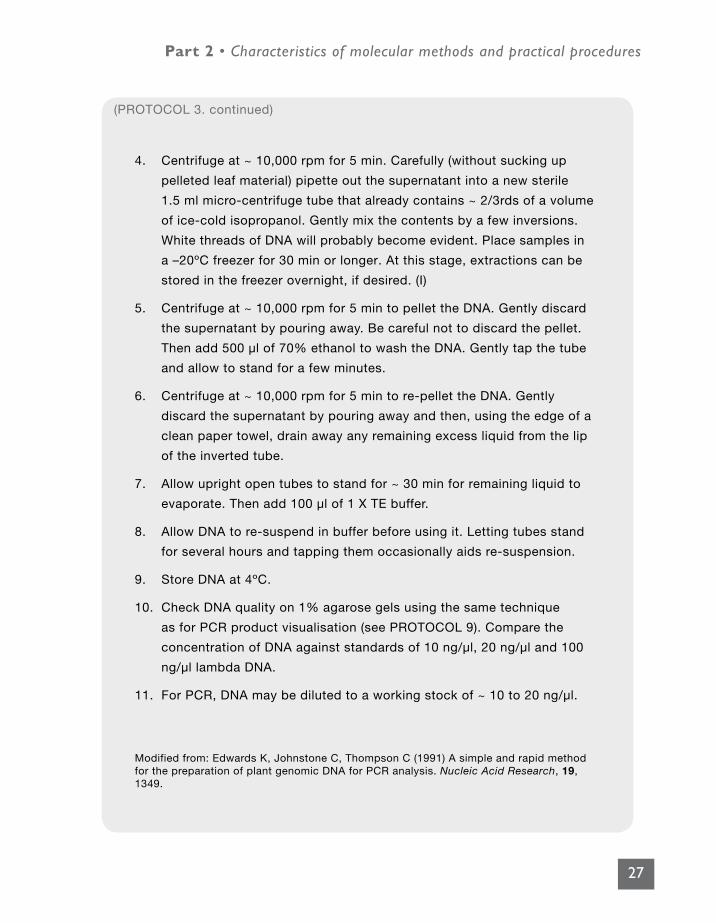
4. Centrifuge at ~ 10,000 rpm for 5 min. Carefully (without sucking up
pelleted leaf material) pipette out the supernatant into a new sterile
1.5 ml micro-centrifuge tube that already contains ~ 2/3rds of a volume
of ice-cold isopropanol. Gently mix the contents by a few inversions.
White threads of DNA will probably become evident. Place samples in
a –20oC freezer for 30 min or longer. At this stage, extractions can be
stored in the freezer overnight, if desired. (I)
5. Centrifuge at ~ 10,000 rpm for 5 min to pellet the DNA. Gently discard
the supernatant by pouring away. Be careful not to discard the pellet.
Then add 500 µl of 70% ethanol to wash the DNA. Gently tap the tube
and allow to stand for a few minutes.
6. Centrifuge at ~ 10,000 rpm for 5 min to re-pellet the DNA. Gently
discard the supernatant by pouring away and then, using the edge of a
clean paper towel, drain away any remaining excess liquid from the lip
of the inverted tube.
7. Allow upright open tubes to stand for ~ 30 min for remaining liquid to
evaporate. Then add 100 µl of 1 X TE buffer.
8. Allow DNA to re-suspend in buffer before using it. Letting tubes stand
for several hours and tapping them occasionally aids re-suspension.
9. Store DNA at 4oC.
10. Check DNA quality on 1% agarose gels using the same technique
as for PCR product visualisation (see PROTOCOL 9). Compare the
concentration of DNA against standards of 10 ng/µl, 20 ng/µl and 100
ng/µl lambda DNA.
11. For PCR, DNA may be diluted to a working stock of ~ 10 to 20 ng/µl.
Modified from: Edwards K, Johnstone C, Thompson C (1991) A simple and rapid method for the preparation of plant genomic DNA for PCR analysis. Nucleic Acid Research, 19, 1349.
(PROTOCOL 3. continued)

28
Part 2 • Characteristics of molecular methods and practical procedures
Notes on DNA extraction (refers to PROTOCOLS 2 and 3)
(A) Wear laboratory coat and gloves throughout.
(B) Adding liquid nitrogen is most easily done by very gently dipping
the micro-centrifuge tube into an open insulated flask containing the
liquefied gas. Hold the tip of the lid of the tube with gloves and take
care to ensure that the tube is inserted slowly. If done slowly, the
tube will be properly cooled before liquid nitrogen flows onto the leaf
material. If done too quickly, the liquid nitrogen will boil vigorously
inside the tube, and possibly push leaf material out. Caution is
required when using liquid nitrogen – it can cause severe burns. With
dried leaf material, the addition of liquid nitrogen to facilitate grinding
is not strictly necessary, although it is still sometimes used. Fine
sterile sand can be used to facilitate grinding when liquid nitrogen is
not available.
(C) Sometimes, researchers add a small quantity (the tip of a very small
spatula) of polyvinylpyrrolidone powder to leaf material before adding
liquid nitrogen.
(D) It is important to grind leaf material as finely as possible. This will
ensure the best possible yield of DNA.
(E) With dried leaf, some researchers use more dilute (1.5 X) CTAB
extraction buffer, on the basis that this leaf contains no water and
needs ‘re-hydrating’, unlike fresh material. In addition, with dried leaf
more extraction buffer is sometimes used, to ensure that there is a
good aqueous phase in tubes after the incubation stage (step 4) and
not just re-hydrated leaf!
(F) Micro-pestles can be reused. Clean them first with a dilute bleach
solution (place them in this immediately after use), then plenty
29
Part 2 • Characteristics of molecular methods and practical procedures
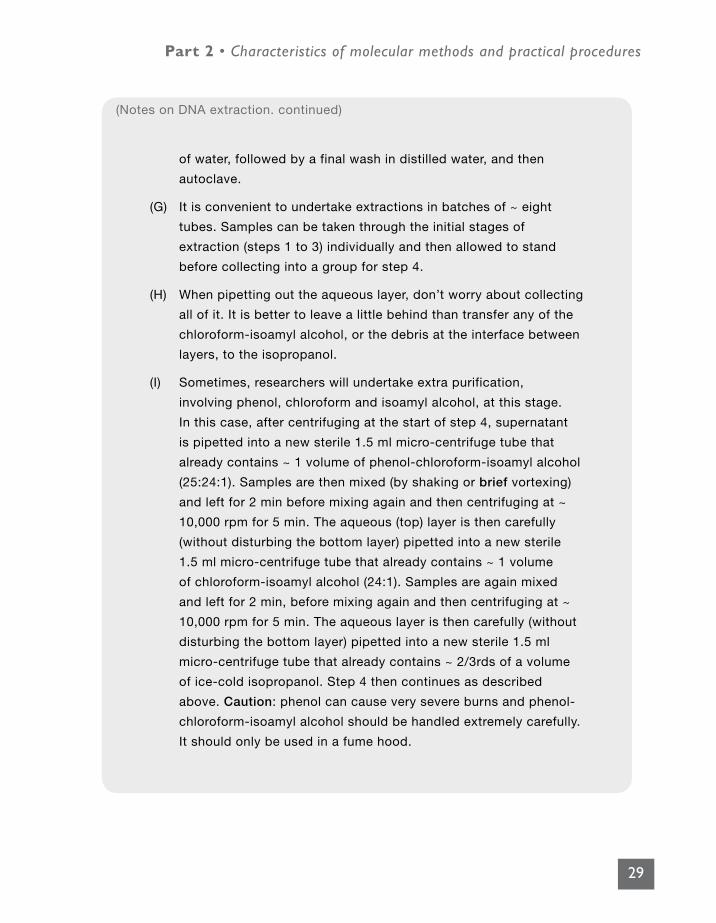
of water, followed by a final wash in distilled water, and then
autoclave.
(G) It is convenient to undertake extractions in batches of ~ eight
tubes. Samples can be taken through the initial stages of
extraction (steps 1 to 3) individually and then allowed to stand
before collecting into a group for step 4.
(H) When pipetting out the aqueous layer, don’t worry about collecting
all of it. It is better to leave a little behind than transfer any of the
chloroform-isoamyl alcohol, or the debris at the interface between
layers, to the isopropanol.
(I) Sometimes, researchers will undertake extra purification,
involving phenol, chloroform and isoamyl alcohol, at this stage.
In this case, after centrifuging at the start of step 4, supernatant
is pipetted into a new sterile 1.5 ml micro-centrifuge tube that
already contains ~ 1 volume of phenol-chloroform-isoamyl alcohol
(25:24:1). Samples are then mixed (by shaking or brief vortexing)
and left for 2 min before mixing again and then centrifuging at ~
10,000 rpm for 5 min. The aqueous (top) layer is then carefully
(without disturbing the bottom layer) pipetted into a new sterile
1.5 ml micro-centrifuge tube that already contains ~ 1 volume
of chloroform-isoamyl alcohol (24:1). Samples are again mixed
and left for 2 min, before mixing again and then centrifuging at ~
10,000 rpm for 5 min. The aqueous layer is then carefully (without
disturbing the bottom layer) pipetted into a new sterile 1.5 ml
micro-centrifuge tube that already contains ~ 2/3rds of a volume
of ice-cold isopropanol. Step 4 then continues as described
above. Caution: phenol can cause very severe burns and phenol-
chloroform-isoamyl alcohol should be handled extremely carefully.
It should only be used in a fume hood.
(Notes on DNA extraction. continued)
30
Part 2 • Characteristics of molecular methods and practical procedures
PCR is very simple in principle. The real technical innovation has been the isolation of heat stable DNA polymerases that can survive the high temperatures involved in the procedure.
2.3. The basis of polymerase chain reaction (PCR)PCR is a procedure that allows particular DNA sequences in an organism to be greatly enriched. Amplification of tar-get sequences occurs to such an extent that product can be directly visualised when run on agarose, acrylamide, or other separation matrices that, by the application of an elec-tric current, separate DNA products based on their size. Differences between individuals at target sequences are as-sessed through determining the presence or absence of a product of a particular size in the separation matrix.
The basis of the PCR approach is very simple and involves the binding of short sections of DNA – known as oligonu-cleotides – to ‘template’ DNA, followed by DNA polymer-ase-catalysed DNA synthesis ‘primed’ by these oligonucle-otides (otherwise known as primers), using deoxyribonu-cleotide triphosphates (dATP, dCTP, dGTP and dTTP, the building blocks of DNA, collectively known as dNTPs) as substrates. DNA amplification occurs by three basic steps, which together form a cycle that is repeated many times, as described below. The basic equipment needed to carry out PCR is also related below.
The real technical innovation that has allowed the wide ap-plication of PCR came when heat stable DNA polymerases – such as Taq polymerase – were identified. PCR involves heating samples to temperatures of more than 90oC, at which point most enzymes quickly and irreversibly become inactive. Early application of PCR therefore involved adding fresh polymerase for each new round of amplification. Taq polymerase, however, is derived from the heat-loving hot spring bacterium Thermus aquaticus, and can survive signifi-cant incubation at high temperatures and has an optimum temperature for DNA synthesis of 70 to 75oC. Since this en-zyme remains active through the repeated cycles required by the PCR technique, its use has allowed automation of the process on thermal cycling machines.

31
Part 2 • Characteristics of molecular methods and practical procedures
Steps in PCR
Step 1. DenaturationDouble-stranded helices of DNA are separated into single strands by heating to ~ 94°C for ~ 1 minute, in order to make them ‘accessible’ to primer binding. In the first round of amplification, extra time may be given to that used in sub-sequent repetitions, in order to ensure all double-stranded DNA is from the start properly separated (in the first round of amplification, DNA strands can be very long and tan-gled).
Step 2. AnnealingShort oligonucleotides (primers) that are complimentary to target sequences in template DNA are allowed to anneal to single-stranded sequences, reforming double-stranded sequences in these short regions. Generally, two ‘sequence-specific’ primers, forward and reverse, are used to bind to specific DNA sequences that are close to each other, in order that the particular sequence between them can be amplified subsequently. By using two primers of ~ 20 bases each, highly specific amplification is assured, as the chances of two such sequences occurring close together at random in the genome are very low. Annealing involves reducing the reaction temperature from that used for denaturing dou-ble-stranded DNA to ~ 50 to 55oC, for ~ 1 minute, before proceeding to the extension phase. The optimum tempera-ture for annealing is generally calculated specifically for each primer pair, using computer algorithms that look at the par-ticular sequences and lengths of the primers involved. If the temperature used is too high, primers will not be able to bind to DNA, while if it is too low they may anneal non-specifically (‘mismatch’ between primer and template). In the first case, no amplification will occur, while in the sec-ond case reactions will contain extra, unintended products. The lengths of primers can be adjusted so that, within a pair, they are expected to anneal optimally at around the same temperature. Before commencing on any large-scale study, some optimisation of annealing temperature is often
PCR relies on repeated cycling through three basic steps: denaturation of double-stranded DNA, annealing of primer to single-stranded target sequences and DNA polymerase-catalysed primer extension using deoxyribonucleotides as substrates.

32
Part 2 • Characteristics of molecular methods and practical procedures
required through initial testing on representative DNA sam-ples at 2oC temperature intervals. In some PCR applications (such as RAPDs, see below), only a single short and ‘arbi-trary’ primer (as little as 10 bases long) is used, and anneal-ing temperature is reduced to as low as ~ 36oC.
Step 3. ExtensionDNA polymerase catalyses the step-by-step addition of dNTPs to the 3’ end of primers, matching (or ‘pairing’) bases to be complementary to the single-stranded DNA template. Extension involves increasing the reaction temperature from that used for annealing to ~ 72oC, the optimum temperature for enzymes such as Taq polymerase to function. At this tem-perature, the rate of primer extension by Taq polymerase is ~ 50 to 100 nucleotides per second. The time allocated for DNA synthesis depends on the length of the sequence to be amplified, but is generally between 30 seconds and two min-utes (even for very short sequences, a time of less than 30 seconds would not normally be used). The result after the extension stage is to have reformed double-stranded DNA specifically and only around the target region. In the final cy-cle of a reaction, a longer extension time is sometimes used (up to 5 minutes), to ensure that all extension is properly finished (all ‘protruding ends’ are filled).
Repeating steps 1 to 3: cyclingThe three basic steps above are repeated a number of times, in order to carry out the exponential amplification of DNA. Whereas in the first round of amplification only the organ-ism’s original DNA is amplified, in subsequent rounds more and more of the target DNA amplified has been newly syn-thesised during PCR itself (in the 2nd round of amplification, 50% of target DNA has already been amplified, in the 3rd round 75%, in the 4th round 87.5%, etc.). In this way, cycling results in copies of copies, copies of copies of copies, and so on. Since cycling is repeated many times, almost all the DNA at the end of the reaction is copied sequence of the tar-get region. The number of cycles used depends on the PCR
33
Part 2 • Characteristics of molecular methods and practical procedures
technique in question, but generally ranges between 30 and 45. For example, the RAPD detection method is less sensi-tive than that generally used for SSRs, and more PCR cycles are therefore used for the former technique (see more on individual techniques below). In reality, the efficiency of am-plification falls with the number of cycles applied, so that the law of ‘diminishing returns’ comes into effect.
Equipment for PCRThe following represent the basic equipment needed to carry out PCR:
General laboratory equipmentAll of the equipment needed to run a basic laboratory: a weigh balance, a hot plate stirrer, a platform shaker, a heat block, a microwave, a pH meter, a water bath, a fridge, a freezer, micropipettes, an autoclave, a fume hood (if deal-ing with volatile/dangerous chemicals), ice buckets, beakers, flasks, measuring cylinders, etc.
A thermal cycling machine for the amplification of DNAFor population genetic studies, large numbers of samples need to be tested. Therefore, the thermal cycling machine used should have a reasonable number of wells. Standard machines, which have 96 wells (i.e., can take 96 individual PCRs), are ideal.
Equipment for the visualisation of DNAThe gel electrophoresis equipment needed to separate DNA, such as gel rigs and power supplies. Also the equip-ment to see results, such as a UV trans-illuminator for ethidium bromide stained agarose gels, or a light box for acrylamide gels. Also the means to record results, such as a camera and dark room, or camera box, for ethidium bro-mide stained agarose gels.
To carry out PCR, a range of general laboratory equipment, a thermal cycling machine and ways to visualise DNA are all required.

34
Part 2 • Characteristics of molecular methods and practical procedures
2.4. Different PCR techniques: their characteristics, with advantages and disadvantages of eachThere are a large number of different PCR-based techniques that can be used to detect genetic variation, which reveal markers that have different properties. Some techniques re-veal dominant markers, others codominant ones. In the first case, only one allele at a locus is visible, while in the sec-ond case, when considering a diploid, both are. Techniques vary in the number of loci they can reveal at any one time. Some approaches can reveal many loci simultaneously, while others can only show variation at one locus at a time. This depends on whether the primers used in PCR are specific, semi-specific or arbitrary in their binding to DNA.
The level of specificity of primer binding is a major factor in controlling the ‘quality’ of the data revealed by a tech-nique. Furthermore, the specificity of primer binding is a factor in determining how good initial DNA quality needs to be for analysis to be successful. More specific primers generally need less good DNA as starting material. Specific primers may therefore be used on species and specimens from which DNA is more difficult to extract. Using specific primers may allow sampling under more challenging field conditions, where good DNA preservation is difficult.
Differences between techniques mean that information must be analysed and interpreted in different ways. This means that certain techniques are better for addressing particular ques-tions than others are. By extension, some techniques are inappropriate for addressing particular hypotheses. Often, different techniques may be used to address the same ques-tion, but the ways in which sampling is undertaken, and the approaches by which data are analysed, need to different. For example, everything else being equal, using dominant markers to assess gene frequencies in populations means that sample sizes must be at least 2 times larger for accurate estimates than if using codominant techniques.
There are many different PCR-based techniques that can be used to detect genetic variation. Each approach varies in the properties of the markers that are revealed.

35
Part 2 • Characteristics of molecular methods and practical procedures
The cost of different molecular marker methods also varies. The level of equipment needed for each is different, as is the level of technical expertise needed by laboratory workers, meaning that different levels of training are required. The cost of a given technique may depend on the level of work already done on a particular species. For some techniques – such as SSRs and CAPS (see below) – starting from scratch may be relatively more costly than for other methods.
What all of the above means is that there is no ‘ideal’ marker system (see box below) that can be defined for all molecu-lar genetic studies. In this guide, we restrict our attention to five different techniques that have been shown to have some application in low-income laboratories. These are: am-plified fragment length polymorphisms (AFLPs), random am-plified polymorphic DNAs (RAPDs), inter simple sequence repeats (ISSRs), simple sequence repeats (SSRs); and cleaved amplified polymorphic sequences (CAPS). Below, we give an overview of the basis of each of these different approaches and give one or two examples of application to tropical trees. We also provide some information on the advantages and disadvantages of each method. Through this, we hope to help users determine which technique is best for them, when addressing a particular question in their given circum-stances.
For further information on the methods below and on more advanced techniques that are not described here, please re-fer to the references given at the end of this section of the manual. In particular, Spooner et al. (2005) discuss recent developments based on expressed sequence tagged sites, single nucleotide polymorphism detection, pyrosequencing, DNA chip technology and association genetics. Dawson and Jaenicke (2006) give an introduction to applications such as genomics and synteny, and to the relevance of such ap-proaches for less-studied species like (most) tropical trees. It is possible that some of these procedures and applications may become more accessible as technology advances and costs decline.

36
Part 2 • Characteristics of molecular methods and practical procedures
Characteristics of an ideal molecular marker system
The properties of an ideal marker system would include the following:
• Should be able to use DNA of all qualities, including very degraded
and old samples.
• Reveals markers that are codominant, distinguishing between
homozygotes and heterozygotes.
• Reveals many distinct loci at the same time, thereby reducing the
costs involved in (multiple rounds of) detection.
• Reveals markers evenly distributed throughout the genome, thereby
providing a ‘representative’ indication of overall diversity.
• Is cheap, with use thus not limited to well-resourced laboratories.
• Is technically simple.
• Reveals markers that are highly reproducible. Repeated use – at
different times and in different laboratories – produces the same
results.
• Reveals markers that are easy to score. The different allelic states at
a locus – and which alleles belong to which locus – are clear.
• Reveals the right level of variation – neither insufficiently low nor too
high – to address the question at hand.
• Is not restricted in application by commercial or intellectual property
considerations.
In reality, no single marker system is available that reaches our concept
of the ideal.

37
Part 2 • Characteristics of molecular methods and practical procedures
Amplified fragment length polymorphisms (AFLPs)AFLPs are DNA fragments, normally between 80 and 500 base pairs (bp) in length, that are obtained by digesting DNA using restriction enzymes (enzymes that cut DNA at par-ticular sequences), then ligating oligonucleotide adapters to digested products and finally amplifying these sequences by PCR. The PCR primers used are ‘semi-specific’, consist-ing of a ‘core’ adaptor sequence, a restriction enzyme spe-cific sequence, and a ‘tail’ of one to five other nucleotides. The higher the number of other nucleotides in the ‘tail’, the lower the number of bands obtained in PCR. Two rounds of amplification (‘pre-selective’ and ‘selective’) are normally carried out, the second round using more specific primers (more other nucleotides added to the ‘tail’) than the first.
AFLP banding profiles are the result of variation in restric-tion sites and in intervening regions. The AFLP technique generates products from many sites in the genome, per-haps revealing 50 to 100 fragments in an individual reaction. Generally, products are separated on polyacrylamide gels. They are then visualised using radioactive, fluorescent, silver staining or other methods. Bands are scored as presence or absence in individuals. When it comes to data analysis, AFLPs are generally assumed to have their origin in nuclear DNA. However, they may more rarely originate from or-ganellar DNA.
AFLPs are DNA fragments obtained by digesting DNA using restriction enzymes, ligating oligonucleotide adapters to digested products and amplifying these sequences by PCR.
38
Part 2 • Characteristics of molecular methods and practical procedures
Example applications of AFLPs
Reference: Russell JR, Weber JC, Booth A, Powell W, Sotelo-Montes C, Dawson IK (1999) Genetic variation of Calycophyllum spruceanum in the Peruvian Amazon Basin, revealed by amplified fragment length polymorphism (AFLP) analysis. Molecular Ecology, 8, 199-204.
Russell et al. used AFLPs to assess genetic variation within and among nine
populations of the riverine timber tree Calycophyllum spruceanum sampled
along river tributaries in the Peruvian Amazon Basin. Most variation occurred
among individuals within populations, although variation between stands was
highly significant according to an Analysis of Molecular Variance (AMOVA;
see Part 3 of this guide). Similarity among stands depended partly, although
not entirely, on geographic proximity. Despite hypotheses suggesting it’s
importance, no firm evidence was obtained for unidirectional water-mediated
seed flow (hydrochory) being a factor in determining genetic structure. This
suggested that sampling seed from where rivers meet (confluences) is of no
particular advantage for capturing diversity during genetic improvement and
conservation programmes.
Reference: Miller AJ, Schaal BA (2006) Domestication and the distribution of genetic variation in wild and cultivated populations of the Mesoamerican fruit tree Spondias purpurea L. (Anacardiaceae). Molecular Ecology, 15, 1467–1480.
Miller and Schaal used AFLPs to assess the amount and distribution of
genetic variation in clonally propagated domesticated stands, and sexually
reproducing wild populations, of the important neo-tropical fruit tree,
Spondias purpurea. Cultivated stands from three different agricultural habitats
were included: living fences, backyards, and orchards. Levels of genetic
variation within cultivated S. purpurea stands were found to be significantly
lower than those in wild populations, although the amount of diversity varied
in different agricultural habitats. The genetic structure of backyard stands
resembled that of wild populations, but living fence and orchard stands had
a third more variability distributed among populations, probably because of
relatively high levels of vegetative reproduction. Results also suggested that
S. purpurea was domesticated in two distinct regions within Mesoamerica.

39
Part 2 • Characteristics of molecular methods and practical procedures
Random amplified polymorphic DNAs (RAPDs)RAPDs are ‘anonymous’ DNA fragments amplified using sin-gle short primers, generally 10 bases long, of ‘arbitrary’ (also termed ‘random’ or non-specific) sequence. Individual prim-ers operate in both forward and reverse directions, thus am-plifying between inverted repeats of the binding sequence, if repeats are close to each other. A single primer is usually able to amplify simultaneously fragments from around 5 to 20 sites in the genome. Amplified fragments are generally separated by agarose gel electrophoresis. Polymorphism is detected as the presence or absence of products following the application of ethidium bromide or other DNA stains to gels. Polymorphisms arise primarily due to base variation at putative primer annealing sites (primer can, or cannot, bind), although length differences are also possible. When it comes to data analysis, RAPDs are generally assumed to have their origin in nuclear DNA. However, they may more rarely originate from organellar DNA.
RAPDs are DNA fragments amplified using single short primers of ‘arbitrary’ sequence.
40
Part 2 • Characteristics of molecular methods and practical procedures
Example applications of RAPDs
Reference: Jamnadass R, Hanson J, Poole J, Hanotte O, Simons TJ, Dawson IK (2005) High differentiation among populations of the woody legume Sesbania sesban in sub-Saharan Africa: implications for conservation and cultivation during germplasm introduction into agroforestry systems. Forest Ecology and Management, 210, 225-238.
Jamnadass et al. used RAPDs to assess genetic variation in and among natural
stands of the woody legume Sesbania sesban, a species important for ‘improved
fallow’ plantings in agroforestry. Differentiation among nine S. sesban populations
in sub-Saharan Africa was unusually high for a woody perennial, with all
individuals stringently assigned to specific populations in cluster analysis (see
Part 3 of this guide). Genetic distances were consistent with the presence of two
botanic varieties in the region. Large-scale human seed dispersal raises concerns
regarding the genetic management of S. sesban, and RAPD analysis suggested
that the composition of material currently being introduced from Kenya (and likely
to be introduced from Malawi) into eastern Zambia is very different from natural
local material. This may have negative consequences for the sustainability of
fallows and the integrity of wild populations.
Reference: Lowe AJ, Gillies ACM, Wilson J, Dawson IK (2000) Conservation genetics of bush mango from central/west Africa: implications from random amplified polymorphic DNA analysis. Molecular Ecology, 9, 831-841.
Lowe et al. used RAPDs to assess genetic variation in the two bush mango species
Irvingia gabonensis and I. wombolu, valuable multipurpose fruit trees from central
and west Africa that are currently being domesticated. Significant genetic integrity
was found within the two morphologically similar species, with no evidence of
hybridisation between them, even between individuals from areas of contact
where hybridisation was considered probable. Results suggested that large-scale
transplantation of either species into new habitats is not likely to lead to genetic
introgression from, or into, the other species. Therefore, cultivation of the two
species is not hindered by this consideration. Significant genetic differentiation
within both species was observed across countries, with genetic similarity on
average decreasing significantly with increasing geographic distance. This indicates
a ‘sampling by distance’ approach is useful for conservation and evaluation. ‘Hot
spots’ of genetic diversity were found, and these may be particular targets for
conservation and performance evaluation.

41
Part 2 • Characteristics of molecular methods and practical procedures
Inter simple sequence repeats (ISSRs)ISSRs are DNA fragments located between adjacent, oppo-sitely oriented, simple sequence repeats (or SSRs, see more on these below). ISSRs are amplified using ‘semi-specific’ primers. These consist of simple sequence repeat sequences with a few other nucleotides as anchors into non-repeat adjacent regions. The composition of anchoring bases can be changed in order to reveal different products. The technique exploits the abundance of SSRs in genomes, and about 10 to 60 fragments are generated simultaneously. Products are separated by gel electrophoresis and generally scored as the presence or absence of bands. ISSRs are generally assumed to have their origin in nuclear DNA. However, they may more rarely originate from organellar DNA.
ISSRs are DNA fragments amplified between adjacent simple sequence repeats.
Example application of ISSRs
Reference: Aga E, Bekele E, Bryngelsson T (2005) Inter-simple sequence repeat (ISSR) variation in forest coffee tree (Coffea arabica L.) populations from Ethiopia. Genetica, 124, 213-221.
Aga et al. used ISSRs to assess genetic variation in forest coffee trees (Coffea
arabica) from 16 populations from four regions of Ethiopia. In a phenogram
(see Part 3 of this guide), most individuals clustered on the basis of their
region of origin, but failed to cluster according to their respective populations.
The authors postulated that this was due to the presence of substantial gene
flow between adjacent populations in each region, assisted by transplantation
by man and/or by wild animals such as monkeys, which eat the berries.
Results provided information that can be used to target sites for in situ
conservation.

42
Part 2 • Characteristics of molecular methods and practical procedures
Simple sequence repeats (SSRs)SSR polymorphism is based on variation in the number of co-occurring (tandem) short repeats, generally of mono-, di-, tri- or tetra-nucleotides (e.g., [A]n, [CA]n, [AGC]n, [GACA]n), at a site. These repeat regions (otherwise known as microsatellites) have been found to be hypervariable, possibly due to DNA polymerase slippage or mispairing at repeats during the normal replication process. Normally, the more repetitions of a repeat, the more likely it is to be polymorphic. For example, a [CA]10 repeat is more likely to be polymorphic than a [CA]4 repeat. Generally, variation at a single locus only is assessed in a single PCR reaction, although samples are sometimes ‘multiplexed’ for detection purposes.
Hypervariability means that SSRs are excellent targets when looking for genetic variation. Generally, polymorphism is studied in nuclear DNA, although variation in organellar DNA is sometimes also assessed. Length polymorphisms are generally visualised by running products on polyacryla-mide gels. Radioactive, fluorescent, silver staining or other techniques are used for detection.
The initial detection of SSRs and their flanking regions, to which pairs of primers can then be designed, relies on DNA sequence information being available. Normally, this means sequencing the species in question, although ‘cross-transfer’ of primers between species is sometimes possible. In order to obtain species-specific sequence information, enriched libraries (for certain types of repeat) can be constructed from an organism, screened for SSRs, and DNA then se-quenced to reveal repeats and flanking regions. Alternatively, database searches (e.g., NCBI, see Part 1 above) may reveal SSRs and flanking sequences in an organism, although this is unlikely for less-researched species.
For organellar DNA, ‘universal’ primers are sometimes used to detect SSR variation. Universal primers are those de-signed to highly conserved sequences of DNA that remain the same across a wide range of genera and even plant fami-
SSR polymorphism is based on variation in the number of co-occurring short repeats at target sequences.
43
Part 2 • Characteristics of molecular methods and practical procedures
lies. These conserved sequences flank more variable regions where polymorphism can be detected.
Example applications of SSRs
Reference: Hollingsworth PM, Dawson IK, Goodall-Copestake WP, Richardson JE, Weber JC, Sotelo Montes C, Pennington RT (2005) Do farmers reduce genetic diversity when they domesticate tropical trees? A case study from Amazonia. Molecular Ecology, 14, 497-501.
Hollingsworth et al. used SSRs to assess genetic variation in geographically
matched planted and wild stands of the important fruit tree Inga edulis at five
sites in the Peruvian Amazon Basin. Allelic richness (the number of alleles
present) in planted stands was lower than in wild populations, supporting the
notion that human intervention in the Amazonian rain forest is impacting on
levels of population genetic diversity in tree species. However, allelic variation
in planted stands was still on average 80% of that found in natural stands,
indicating that planted populations have not experienced extreme bottlenecks
and are still good targets for circa situ conservation.
Reference: White GM, Boshier DH, Powell W (2002) Increased pollen flow counteracts fragmentation in a tropical dry forest: An example from Swietenia humilis Zuccarini. Proceedings of the National Academy of Sciences of the USA, 99, 2038-2042.
White et al. used SSR markers to quantify pollen-mediated gene flow in the
important timber tree Swietenia humilis in a highly fragmented forest mosaic
in Honduras. Longer than expected pollen flow distances of several kilometres
were sometimes detected, with isolated trees still capable of mating with
individuals from a number of surrounding forest fragments. Results showed that
some tropical tree species may be much more adaptable and resilient to habitat
destruction than previously considered, as conventional wisdom suggests
that lone trees are essentially the ‘living dead’. Remnant fragmented stands
and isolated trees of S. humilis may therefore provide a buffer to the negative
genetic consequences of habitat destruction, and may be vital to the future
long-term viability of the species.

44
Part 2 • Characteristics of molecular methods and practical procedures
Cleaved amplified polymorphic sequences (CAPS)CAPS are DNA fragments amplified using specific prim-ers, which are afterwards digested by restriction enzymes. Sequence polymorphisms result in cutting of products in different places, and these variants are revealed as length dif-ferences when running reactions on agarose gels. The CAPS approach is sometimes known as restriction fragment length polymorphism (RFLP-) PCR, and the technique bears simi-larities to the non-PCR-based older RFLP method. CAPS can be applied to organism-specific nuclear sequences, or to organellar DNA using universal primers. As with SSRs, sequencing is generally required in the former case in order to develop primer pairs. Similar to SSRs, CAPS assess varia-tion at one locus only in a particular PCR.
CAPS are DNA fragments amplified using specific primers that are then digested by restriction enzymes to reveal sequence polymorphisms.
45
Part 2 • Characteristics of molecular methods and practical procedures
Example application of CAPS
Reference: Kadu CAC, Imbuga M, Jamnadass R, Dawson IK (2006) Genetic management of indigenous fruit trees in southern Africa: a case study of Sclerocarya birrea based on nuclear and chloroplast variation. South African Journal of Botany, 72, 421-427.
Kadu et al. used CAPS revealed by universal chloroplast primers in
combination with RAPDs to assess genetic variation within and among
populations of Sclerocarya birrea, an important fruit tree that is currently
under domestication in southern Africa. Consistent with other organellar-
nuclear comparisons for tree species, a much greater proportion of
(presumably seed-transmitted) CAPS variation partitioned among stands
than for RAPDs, suggesting a rather limited role for seed compared to
pollen in mediating gene flow. AMOVA of chloroplast CAPS and RAPD
variation agreed with each other in revealing significant genetic variation
among stands in Tanzania. Tanzanian stands appear to contain a large
fraction of the overall variation present within the species in the entire
southern Africa region, suggesting this country should be a focus for
domestication and conservation. For examples of universal primers
to organellar DNA that are suitable for CAPS studies, please see the
following references:
Demesure B, Sodzi N, Petit RJ (1995) A set of universal primers for amplification of polymorphic non-coding regions of mitochondrial and chloroplast DNA in plants. Molecular Ecology, 4, 129-131.
Duminil J, Pemonge M-H, Petit RJ (2002) A set of 35 consensus primer pairs amplifying genes and introns of plant mitochondrial DNA. Molecular Ecology Notes, 2, 425–427.
Dumolin-Lapegue S, Pemonge M-H, Petit RJ (1997) An enlarged set of consensus primers for the study of organelle DNA in plants. Molecular Ecology, 6, 393-397.
Petit RJ, Brewer S, Bordacs S, Burg K, Cheddai R et al. (2002) Identification of refugia and post-glacial colonisation routes in European white oaks based on chloroplast DNA and fossil pollen evidence. Forest Ecology and Management, 156, 49-74.
Taberlet P, Gielly L, Patou G, Bouvet J (1991) Universal primers for amplification of three non-coding regions of chloroplast DNA. Plant Molecular Biology, 17, 1105-1109.

46
Part 2 • Characteristics of molecular methods and practical procedures
Choosing the right technique for youConsiderable thought is required in determining the marker technique to use in a study, depending on the hypotheses being tested and the particular circumstances of analysis. Spooner et al. (2005) summarise the comparative qualities of different marker techniques in terms of their genomic abundance (overall number of loci available), level of poly-morphism, locus-specificity (whether single or multiple loci are revealed in an individual reaction), type of expression (dominant or codominant), reproducibility, labour intensity, technical demands, operational and development costs, and amenability to automation.
De Vicente and Fulton (2003) give some idea of how to go about calculating costs of a number of techniques, while Karp et al. (1997) describe a ‘decision tree’ method for de-ciding between approaches. This decision tree first consid-ers the questions being asked and next assesses the level of polymorphism that is likely to be detected. It then considers the accessibility of primers, time constraints and, finally, the available financial and operational resources. In the below, we summarise the main strengths and weaknesses of the five different marker approaches described above. These dif-ferences are also summarised in Table 1.
AFLPsKey advantages: The primers for AFLP analysis are commercially available and no sequence data for the organism being tested are needed. This is useful when dealing with little-researched species. Each AFLP reaction can reveal a very large number of poly-morphic loci, making the approach excellent for fingerprint-ing. Loci are reasonably randomly distributed through the genome. The technique is fairly reproducible, which makes comparison between different studies and different labora-tories possible. Polymorphisms can be analysed using auto-mated methods (on sequencing machines).
Each of the above approaches has strengths and weaknesses. Careful thought is required in choosing the right technique for a particular question and set of circumstances.

47
Part 2 • Characteristics of molecular methods and practical procedures
Main disadvantages: The technique is quite technically demanding and therefore relatively expensive. Since AFLPs are (generally) scored as dominant markers, certain assumptions on heterozygosity have to be made during statistical analysis. This is a problem when dealing with highly heterozygous organisms such as trees. AFLP analysis relies on enzyme digestion of DNA and so the quality of DNA used for testing needs to be reason-ably high, otherwise some samples may not digest properly. In addition, more starting DNA is required than for other PCR-based techniques. As AFLP primers are only ‘semi-spe-cific’, they may amplify contaminating DNA in samples, and so clean plant material and good extraction and PCR prac-tice are especially required.
RAPDsKey advantages: As with AFLPs, no sequence data are needed for the organ-ism being tested. Each arbitrary primer can reveal several polymorphic loci. Furthermore, as there are a very large number of different arbitrary primers available, the tech-nique can reveal a very large number of markers. As with AFLPs, loci are distributed through the genome. The RAPD technique and the visualisation of products – on agarose gels – are both very simple methods to perform.
Main disadvantages: RAPDs tend to demonstrate low reproducibility and hence there is a need for tight experimental control of conditions. Low reproducibility makes comparison with other studies – even those conducted in the same laboratory – difficult. Due to reproducibility concerns, several respected journals no longer consider for publication any manuscripts that are based primarily on RAPD analysis. When RAPDs are being used, it is important to repeat a subset of reactions in order to check reproducibility: only consistently revealed polymorphisms should be scored. Like AFLPs, RAPD markers are (generally) dominant in nature, limiting the

48
Part 2 • Characteristics of molecular methods and practical procedures
information they can reveal on heterozygosity and requiring assumptions to be made during statistical analysis. In addition, since RAPD amplification depends on non-specific primers, similar sized products revealed in different individuals may not be homologous, especially when making comparisons between species. RAPD analysis is essentially a ‘quantitative’ procedure and the quality of DNA used needs to be good. If DNA is degraded, amplification results will look different from those on intact DNA of the same individual, with a ‘bias’ toward smaller products in the first case. Finally, because RAPD primers are ‘arbitrary’, they may, like AFLPs, amplify contaminating DNA in samples. Clean plant material and good extraction and PCR practice are therefore essential.
Main differences, RAPDs compared to AFLPs: RAPDs are less reproducible than AFLPs, and the quality of the information they provide is therefore lower. However, the laboratory procedures for RAPDs are simpler, less tech-nically demanding, and therefore less costly, than those for AFLPs. This is the reason why RAPD analysis continues to be used in population genetic studies.
ISSRsKey advantages: As with RAPDs and AFLPs, no prior sequence data is need-ed for the organism under study. Each ISSR primer can re-veal quite high numbers of polymorphic loci. As with AFLPs and RAPDs, loci are distributed through the genome. The ISSR technique is less technically demanding than AFLPs and more reproducible than RAPDs.
Main disadvantages: Although considered more reproducible than RAPDs, the ISSR technique still suffers from consistency problems. Like AFLPs and RAPDs, ISSR markers are (generally) dominant in nature, limiting the information they can reveal on hetero-zygosity. Like RAPDs, ISSR analysis is essentially a ‘quantita-
49
Part 2 • Characteristics of molecular methods and practical procedures
tive’ procedure, and the quality of DNA used for testing therefore needs to be good. Since ISSR primers are only ‘semi-specific’, they may, like AFLPs and RAPDs, amplify contaminating DNA in samples. Clean plant material and good extraction and PCR practice are therefore especially required.
Main similarities and differences, ISSRs compared to AFLPs and RAPDs: ISSRs, AFLPs and RAPDs all provide dominant markers through the genome. Although ISSRs have some advantages compared to AFLPs (being less technically demanding) and RAPDs (being more reproducible), they have not been ap-plied as widely as either of the other methods. Of the three techniques, AFLP analysis is, if resources allow, considered to be the method of choice.
SSRsKey advantages: Unlike the techniques above, nuclear SSRs are codominant markers that reveal full genotypic information. This is a great strength in detailed population studies, especially for highly heterozygous organisms such as trees. In addition, nuclear SSRs can show extremely high levels of allelic variation at in-dividual loci. It is not unusual for 20 alleles to be observed at one locus in a single population. High allelic variation makes SSRs the method of choice for studying gene flow, pater-nity and genetic bottlenecks in populations. The technique can give highly reproducible results, and polymorphisms can be analysed using automated methods (on sequencing ma-chines). Since the technique relies on specific primers, it can be used on lower quality DNA than dominant marker pro-cedures. SSR analysis is the basis of modern forensic prac-tice using very small quantities of, often, poor quality DNA. As the technique relies on specific sequences, analysis can be targeted to different genomes: nuclear, chloroplast or mi-tochondrial.

50
Part 2 • Characteristics of molecular methods and practical procedures
Main disadvantages: Species-specific primer development is relatively expensive and the construction of enriched libraries for the initial de-tection of SSRs requires technical skill. Sometimes, SSRs are too variable to be useful in comparisons, as there are insuf-ficient common reference points among tested individuals (all differences, no similarities). This has frequently led to misapplication of the approach in cross-population compari-sons. In a single reaction, the SSR technique (generally) only assesses variation at a single locus. This is unlike with domi-nant markers, which can sometimes reveal diversity at very many loci simultaneously. Whether resources are available to carry out sufficient reactions to study sufficient SSR loci to address the question at hand is therefore an important consideration.
Although in theory revealing easily interpretable codomi-nant markers, assessment of SSRs is not always straightfor-ward. First, ‘stuttering’ often occurs during amplification. This leads to product artefacts and difficulties in accurate sizing. Generally, the smaller the basic repeat, the more problematic is scoring. Second, ‘null’ alleles – in which no amplification of the intended target occurs due to a change in sequence in one of the primer binding sites – are rela-tively common. This means that what first appears to be a homozygote, with two copies of a particular allele, may in fact be a heterozygote, with one allele amplifying and the other not. ‘Null’ alleles result in biased estimates of allelic and genotypic frequencies in populations, and the under-estimation of heterozygosity. ‘Null’ alleles are more likely if using primers originally designed for another species.
CAPSKey advantages: Similar to SSRs, CAPS are codominant markers when ap-plied to nuclear DNA and thus can reveal full genotypic in-formation. Like SSRs, the CAPS technique can give highly reproducible results, and since it relies on specific primers,

51
Part 2 • Characteristics of molecular methods and practical procedures
it can be used on lower quality DNA than dominant marker procedures. As the technique is based on specific sequenc-es, analysis can be targeted to different genomes. In fact, the approach has frequently been used to assess organellar variation and to develop seed-specific markers for gene ex-change. As a large number of suitable universal primers to organellar DNA are now available, there are opportunities for application across a wide range of organisms and loci. Unlike SSRs, CAPS can be understood in a clear evolution-ary context and so markers can be applied with confidence in phylogenetic research, although direct DNA sequencing is generally now the preferred method for such studies.
Main disadvantages: Species-specific primer development is relatively expensive, although the ‘enrichment’ of sequences – as applied in SSR primer development in order to detect repeats – is not required. Frequently, CAPS show only low levels of poly-morphism, and screening products for variation with a wide range of restriction enzymes can be both tedious and expen-sive. This is especially the case for organellar DNA, where the level of base substitution within species may be very low. The method can be applied better if a particular region of an organism’s genome is already known to contain poly-morphism. Similar to SSRs and unlike the dominant mark-ers mentioned above, in a single PCR the CAPS technique only assesses variation at one locus. Whether resources are available to carry out sufficient reactions to study sufficient loci to address the question at hand is therefore an impor-tant consideration.
Main similarities and differences, CAPS compared to SSRs: SSRs and CAPS both essentially provide the same kind of information on genetic variation. For nuclear DNA, both give codominant markers at individual loci, which may be anywhere in the genome. SSRs are, however, much more polymorphic and, if resources allow, are generally the codo-minant method of choice in population genetic studies.

52
Part 2 • Characteristics of molecular methods and practical procedures
Technique AFLPs RAPDs ISSRs SSRs CAPS
Description DNA digested with two restriction enzymes, DNA adaptors fitted and products amplified using ‘semi-specific’ primers
Products amplified from total genomic DNA using non-specific (usually 10-mer) primers
Technically, a combination of RAPD and SSR methods. PCR primers are ‘semi-specific’
Specific nuclear or organellar loci amplified by primers that surround previously characterised hypervariable repeats
Specific nuclear or organellar loci amplified. PCR products digested with restriction enzymes
Advantages Very many loci can be revealed in single reactions. Can be applied to taxa for which specific sequence information is unavailable. More reproducible than RAPDs
Several loci can be revealed in single reactions. Can be applied to taxa for which specific sequence information is unavailable. Not as technically complex as AFLPs
Many loci can be revealed in single reactions. Can be applied to taxa for which specific sequence information is unavailable. More reproducible than RAPDs, less complex than AFLPs
Very high variation at individual loci. Nuclear SSRs are codominant. Possible to use lower quality DNA than for AFLPs, RAPDs or ISSRs
Many universal primers to organellar sequences are available. Nuclear CAPS are robust codominant markers. Possible to use lower quality DNA than for AFLPs, RAPDs or ISSRs
Dis-advantages
More technically complex than RAPDs or ISSRs. Loci are generally scored as product presence or absence only (dominant markers). Quality of initial DNA needs to be reasonably high
Often suffer from low reproducibility. Loci are generally scored as product presence or absence only (dominant markers). Quality of initial DNA needs to be good
Loci are generally scored as product presence or absence only (dominant markers). Quality of initial DNA needs to be good
Primer development for nuclear SSRs is expensive. Interpretation can be difficult. Individual SSR loci can show too much allelic diversity for some applications. Normally, study of each locus requires a separate PCR
Primer development for nuclear CAPS is expensive. Conserved primers to organellar regions show little variation. The technique is time-consuming. Normally, study of each locus requires a separate PCR
Normal applications
‘Fast and dirty’ species delimitations and population genetic analyses, excellent for ‘fingerprinting’ of specific types
‘Fast and dirty’ species delimitations and population genetic analyses, ‘fingerprinting’ of specific types. Generally, AFLP analysis preferred
‘Fast and dirty’ species delimitations and population genetic analyses, ‘fingerprinting’ of specific types. Generally, AFLP analysis preferred
The method of choice for detailed studies on gene flow, paternity and bottlenecks. Frequently misapplied in more general population studies
Phylogenetic studies, detailed population studies. Generally, PCR sequencing preferred for phylogenetic studies, SSRs for population studies
* We are grateful to Andy Lowe of the University of Queensland (Australia) for assistance in the development of this table.
Table 1. Properties and potential applications of five common marker techniques*

53
Part 2 • Characteristics of molecular methods and practical procedures
2.5. Starting with screening: identifying polymorphism efficientlyRegardless of the PCR technique that a researcher uses to identify polymorphism, in almost no situation would he or she take the whole of their field collection and subject it ‘blind’ to laboratory analysis. Rather, they will likely carry out preliminary analysis on a ‘test panel’ of their samples in order to identify those primers that work well in reveal-ing variation within the context of a particular study. With RAPDs, e.g., there are thousands of different primers that could be used to assess samples, but the efficiency of dif-ferent primers will vary greatly depending on the species in question. Arbitrarily using any sub-sample of primers to analyse an entire collection is therefore not efficient in this case, but identifying useful primers based on first screening against a test panel is. Generally, the test panel will consist of multiples of eight (i.e., 8, 16 or 24) individuals, as this fits well with the format of the standard 96-sample thermal cycling machine.
In order to efficiently detect polymorphism using a test panel, it must be properly constructed. Most important, it should be representative of the entire material to be ana-lysed. For example, if eight different populations are to be assessed in a study, then the test panel should contain at least one representative from each stand. If more popula-tions have been sampled than spaces are available in the test panel, then individuals included in the panel should come from a subset of well-dispersed stands (covering the range of sampling). Similarly, if a single population is to be assessed, then the test panel should be made up of individuals sam-pled throughout the stand.
As well as providing the best chance for detecting prim-ers that reveal variation, representative sampling during the construction of a test panel is important to prevent bias in screening. This point is best understood by considering an example based on screening primers against only one of
Researchers will normally undertake a ‘pre-screen’ of a few selected samples in order to detect primers that reveal high polymorphism consistently in a species. This ‘test panel’ must be constructed in a representative way, if later statistical analysis of populations is not to be biased.
54
Part 2 • Characteristics of molecular methods and practical procedures
many populations. This process will naturally enough select for those primers that reveal high variation in the particular tested stand. However, because of population differentiation, there is no guarantee that the same primers will respond equally well in revealing variation in a second stand, even though, fundamentally, the second stand is equally diverse as the first. In this case, the particular population used for the test panel will, as a result of screening bias, often appear more polymorphic than other stands. In this case, non-rep-resentative screening leads to a false picture of how diversi-ty is structured throughout a species, and poor management decisions may be the result.
2.6. Specific PCR protocols: practical proceduresThe specific protocols for each of the five techniques de-scribed in sub-section 2.4 are given below. The AFLP tech-nique is described in PROTOCOL 4, RAPDs in PROTOCOL 5, ISSRs in PROTOCOL 6, SSRs in PROTOCOL 7, and CAPS in PROTOCOL 8.
Before setting up reactions…
A note on laboratory practice
A laboratory coat and gloves should be worn throughout for all of the below
protocols.
A note on concentrations
Typical concentrations of components are given in the below protocols. The
actual volumes used will need to be adjusted if initial concentrations are
different. The amount of sterile distilled water used in reactions should be
adjusted accordingly to make the appropriate final reaction volume.
A note on pipetting losses
When making up reaction mixes that are pipetted out into multiple tubes, it is
always sensible to make slightly more (~ 5% extra) than is strictly required by
the protocol. This allows for pipetting losses.
55
Part 2 • Characteristics of molecular methods and practical procedures
PCR componentsRegardless of the protocol used, each PCR contains the same basic components of template DNA, primer(s), Taq DNA polymerase, dNTPs, reaction buffer and sterile dis-tilled water. Further information on each is given below (see also sub-section 2.3).
Template DNAThe DNA of the organism subject to research. This needs to be sufficiently intact to be amplified by the chosen PCR technique. Template DNA is normally stored at 4oC. It can also be frozen, but regular freezing and defrosting damages DNA through ‘shearing’. Once DNA has been frozen, it should only be defrosted to take working stocks for PCR, which should be stored at 4oC. Generally, around 10 ng of template DNA is adequate for a PCR.
Primer(s)The short oligonucleotide(s) that bind to DNA and allow amplification of target sequences. Primers can be 10 to 25 nucleotides in length, and should have a GC content of 40% to 60%. A primer should not show complementarity to it-self, or to the other primer (when pairs are used) in the PCR reaction. This is to stop ‘primer dimers’ and/or ‘fold-ing’ that will interfere with template amplification. Software packages on the Internet are available to design primers that avoid these problems. Primers are generally stored as 10 X stock solutions in sterile distilled water at –20oC. The concentration of primers used in PCR depends on the tech-nique in question.
Taq DNA polymeraseThe heat stable enzyme used to carry out DNA amplifica-tion. Enzyme can be purchased from any one of a number of commercial manufacturers, although some laboratories produce their own. This last option is, however, not recom-mended, as contaminants and other quality problems are
All PCR protocols contain the same basic components of template DNA, primer(s), Taq DNA polymerase, dNTPs, reaction buffer and sterile distilled water.

56
Part 2 • Characteristics of molecular methods and practical procedures
likely. Although heat stable, enzyme is generally stored at –20oC. The concentration of Taq polymerase used in reac-tions needs to be optimised for the species and technique in question, with manufacturer’s recommendations as the starting point. As Taq is generally the most expensive com-ponent of a reaction, it is important to ensure that not too much enzyme is being used. However, sufficient enzyme is needed to give good, consistent results. If use of low con-centrations leads to inconsistency, then this represents a false economy.
dNTPsEach of the four nucleotides (dATP, dCTP, dGTP and dTTP) that is required for successful PCR. Generally, each one is mixed with the others in equal amounts to form a stock solution in sterile distilled water. Stock is stored in small aliquots at –20oC and defrosted when required for setting up reactions. The concentration of each of the dNTPs in the final reaction mixture is usually 200 μM.
Reaction bufferThe different chemical components required by Taq polymer-ase in order to allow it to function properly, normally pro-vided by the enzyme manufacturer in 10 X concentration. Sometimes, certain key components for function – such as magnesium chloride (MgCl2) – are provided separately, in order that the concentration used in reactions can be var-ied. Reaction buffer (and MgCl2 solution) is normally stored at –20oC. The optimum concentration of MgCl2 required in reactions depends on the level of other chemicals – such as EDTA – that may be in DNA preparations. Too few mag-nesium ions will result in a low yield of PCR product, while too many will increase the yield of non-specific products. Generally, the recommended range in concentration for MgCl2 is 1 to 3 mM in the final reaction mix.

57
Part 2 • Characteristics of molecular methods and practical procedures
Sterile distilled waterThis makes up the ‘volume’ of a PCR, in which the other components can properly function. Sterile distilled water can be purchased or, normally, is produced in the laboratory by distilling and then autoclaving tap water.
PROTOCOL 4 - Amplified fragment length polymorphism (AFLP) analysis
Analysis generally consists of five steps: 1, restriction enzyme digestion
of DNA; 2, ligation of oligonucleotide adapters to the digested products;
3, pre-selective PCR amplification; 4, selective PCR amplification; and 5,
product detection. Sometimes steps 1 and 2 are combined, as in the below.
In the protocol given here, the restriction enzymes EcoRI and MseI are used
for analysis. These have 6- and 4- base recognition sites, respectively (i.e.,
the first is a rare cutter of DNA, the second a more frequent one). Other 6-
and 4- base enzyme combinations can also be used (e.g., PstI and MseI).
Steps 1 and 2. Restriction enzyme digestion of DNA and ligation of
oligonucleotide adapters
Make sufficient of the restriction-ligation mix according to the number of
samples to be analysed. Add components in the order shown:
Reagent For 1 reaction ~ Concentration/amount in reaction
10 X T4 ligase buffer (with ATP) 1.1 µl 1 X
0.5 M NaCl 1.1 µl 50 mM
Bovine Serum Albumin (1 mg/ml) 0.5 µl 0.05 mg/ml
MseI adapter (50 µM) 1.0 µl 5 µM
EcoRI adapter (5 µM) 1.0 µl 0.5 µM
MseI enzyme (4 U/µl) 0.25 µl 1 U
EcoRI enzyme (20 U/µl) 0.25 µl 5 U
T4 Ligase (3 U/µl) 0.3 µl 1 U
5.5 µl

58
Part 2 • Characteristics of molecular methods and practical procedures
Procedure
• Add 5.5 µl of restriction-ligation mix to a tube containing 5.5 µl of
sample DNA (containing ~ 0.5 µg of DNA), making a total reaction
volume of 11 µl.
• Mix well and centrifuge briefly.
• Incubate at 37oC for 2 hours, or overnight at room temperature.
• Then add 189 µl of TE buffer or sterile distilled water to make a final
volume of 200 µl, mix and store at -20oC.
These samples are the template for the next step of AFLP analysis.
Notes
• Before adding adapters to the restriction-ligation mix, first heat them to
95oC for 5 min, then allow to cool at room temperature for 10 min.
• When applying AFLPs to a new species, it is important to first test
that DNA can be properly digested. Start with a few samples of
DNA and digest with each restriction enzyme separately, according
to manufacturer’s instructions provided with enzymes. Run products
on 1% agarose gels using the same technique as for PCR product
visualisation (see PROTOCOL 9). Run against undigested DNA as a
reference. If digestion has been successful, a ‘smear’ of DNA should be
observed. If digestion works well for both enzymes, then the procedure
above can be carried out.
Adapter sequences
EcoRI adapter:
5’ CTC GTA GAC TGC GTA CC
5’ AAT TGG TAC GCA GTC
MseI adapter:
5’ GAC GAT GAG TCC TGA G
5’ TAC TCA GGA CTC AT
(PROTOCOL 4. continued)

59
Part 2 • Characteristics of molecular methods and practical procedures
Step 3. Pre-selective PCR amplification
Make sufficient of the pre-selective amplification mix according to the
number of samples to be analysed:
Reagent For 1 reaction Concentration/
amount in reaction
Sterile distilled water 8.1 µl -
10 X PCR reaction buffer
(with 15 mM MgCl2)
2.0 µl 1 X (1.5 mM MgCl2)
5 mM dNTP (each of four in a
single stock)
0.8 µl 200 µM each
EcoRI pre-selective amplification
primer (2.75 µM)
2.0 µl 0.275 µM
MseI pre-selective amplification
primer (2.75 µM)
2.0 µl 0.275 µM
Taq DNA polymerase (5 U/µl) 0.1 µl
15.0 µl
0.5 U
Procedure
• Add 15 µl of pre-selective amplification mix to a tube containing 5 µl of
template DNA (produced after step 2 above), making a total reaction
volume of 20 µl.
• Perform PCR amplification according to the following profile:
o Initial incubation 72oC 2 min, followed by:
o 20 cycles of 94oC 20 seconds, 56oC 30 seconds, 72oC 2 min; followed
by:
o Final incubation of 60oC for 30 min.
o A final step of 4oC can be added to hold samples overnight.
• Then add 180 µl of TE buffer to make a final volume of 200 µl, mix and
store at 4oC.
(PROTOCOL 4. continued)

60
Part 2 • Characteristics of molecular methods and practical procedures
Primer sequences
EcoRI (A) 5’ GAC TGC GTA CCA ATT CA
MseI (C) 5’ GAT GAG TCC TGA GTA AC
These primers have one additional nucleotide on their ‘tails’ (indicated in
bold).
Step 4. Selective PCR amplification
Make sufficient of the selective amplification mix according to the number
of samples to be analysed:
Reagent For 1 reaction Concentration/
amount in reaction
Sterile distilled water 8.1 µl -
10 X PCR reaction buffer
(with 15 mM MgCl2)
2.0 µl 1 X (1.5 mM MgCl2)
5 mM dNTP (each of four in a
single stock)
0.8 µl 200 µM each
EcoRI selective amplification
primer (0.5 µM)
2.0 µl 0.050 µM
MseI selective amplification primer
(2.75 µM)
2.0 µl 0.275 µM
Taq DNA polymerase (5 U/µl) 0.1 µl
15.0 µl
0.5 U
Procedure
• Add 15 µl of selective amplification mix to a tube containing 5 µl of
template DNA (produced after step 3 above), making a total reaction
volume of 20 µl.
• Perform PCR amplification according to the following profile:
o Initial denaturation 94oC 2 min, followed by:
(PROTOCOL 4. continued)

61
Part 2 • Characteristics of molecular methods and practical procedures
o 1 cycle of 94oC 20 seconds, 66oC 30 seconds, 72oC 2 min; followed by:
o 9 cycles of the same profile as above, but for each cycle the annealing
step is 1oC lower (65oC, 64oC, etc.); followed by:
o 20 cycles of 94oC 20 seconds, 56oC 30 seconds, 72oC 2 min; followed
by:
o Final incubation of 60oC for 30 min.
o A final step of 4oC can be added to hold samples overnight.
Notes
Depending on the detection method that will be used to visualise AFLPs after
reaction, product labelling may be required at this stage. If so, it is the EcoRI
primer that is used for labelling. Fluorescent or radioactive techniques may be
used and manufacturer’s protocols should be followed. If products will be run
on polyacrylamide gels and silver stained, no labelling is required.
Primer sequences
EcoRI (ACT) 5’ GAC TGC GTA CCA ATT CAC T
MseI (CAG) 5’ GAT GAG TCC TGA GTA ACA G
The primers shown have three additional nucleotides on their ‘tails’ (indicated
in bold). A range of selective primers can be used. The first base of the tail
must be the same as used in pre-selective amplifications (see step 3 above).
The second and third bases can be A, C, G, or T.
Step 5. Product detection
AFLPs are normally separated on polyacrylamide gels and detected through
radioactive, fluorescent, silver staining or other techniques. Please see
PROTOCOLS 10 and 11 for polyacrylamide gel electrophoresis and the silver
staining method, respectively.
(PROTOCOL 4. continued)

62
Part 2 • Characteristics of molecular methods and practical procedures
PROTOCOL 5 - Random amplified polymorphic DNA (RAPD) analysis
Analysis consists of two steps: 1, PCR amplification using short arbitrary
primers, in which individual oligonucleotides function in both forward and
reverse directions; and 2, product detection.
Step 1. PCR amplification
Make sufficient of the RAPD amplification mix according to the number of
samples to be analysed:
Reagent For 1 reaction Concentration/amount
in reaction
Sterile distilled water 11.0 µl -
10 X PCR reaction buffer
(without MgCl2)
2.0 µl 1 X
MgCl2 (25mM) 2.0 µl 2.5 mM
5 mM dNTP (each of four in a
single stock)
0.8 µl 200 µM each
Arbitrary primer (2 µM) 2.0 µl 0.2 µM
Taq DNA polymerase (5 U/µl) 0.2 µl
18.0 µl
1 U
Procedure
• Add 18 µl of RAPD amplification mix to a tube containing 2 µl of
template DNA (~ 10 to 20 ng of DNA), making a total reaction volume of
20 µl.
• Perform PCR amplification according to the following profile:
o Initial denaturation 94oC 2 min, followed by:
o 45 cycles of 94oC 1 min, +/-36oC 1 min, 72oC 2 min; followed by:
63
Part 2 • Characteristics of molecular methods and practical procedures
o Final extension of 72oC for 5 min.
o A final step of 4oC can be added to hold samples overnight.
Notes
• RAPD analysis is particularly sensitive to the concentration of
MgCl2 used in reactions. Concentration may need to be adjusted to
obtain the right level of amplification. Generally, if too little product
is amplified, try increasing concentration; if too much (smearing is
observed), then try decreasing the amount used.
• The annealing temperature used for primer binding can be varied
+ or – 2oC around a mid-point of 36oC.
Primer sequences
There is a very wide range of primers available commercially, each 10
bases long.
Step 2. Product detection
RAPD products are generally separated by agarose gel electrophoresis
and polymorphism detected by ethidium bromide or other DNA stains
(PROTOCOL 9).
(PROTOCOL 5. continued)
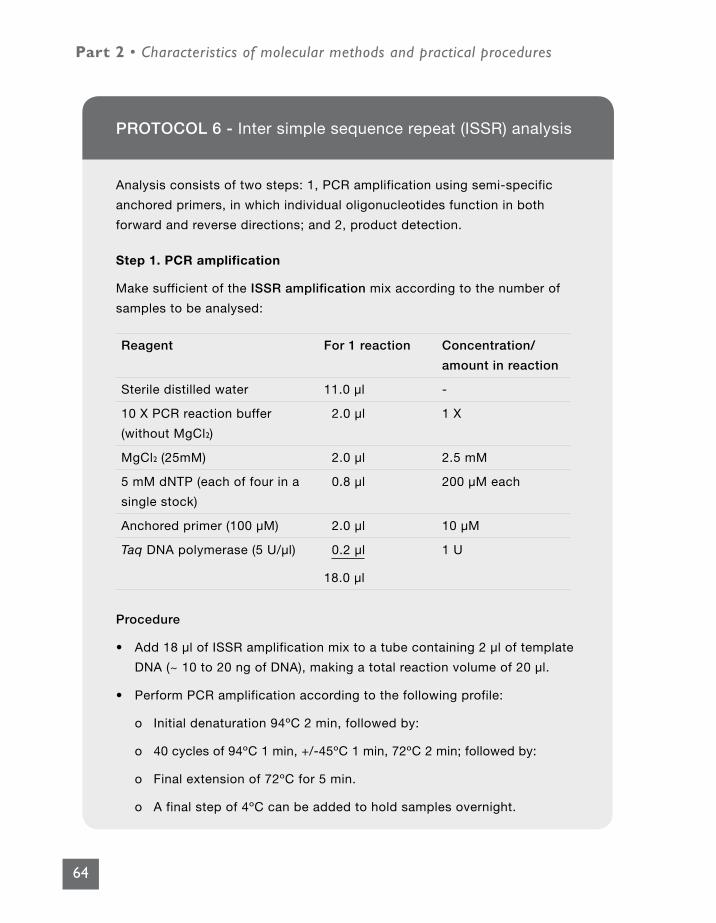
64
Part 2 • Characteristics of molecular methods and practical procedures
PROTOCOL 6 - Inter simple sequence repeat (ISSR) analysis
Analysis consists of two steps: 1, PCR amplification using semi-specific
anchored primers, in which individual oligonucleotides function in both
forward and reverse directions; and 2, product detection.
Step 1. PCR amplification
Make sufficient of the ISSR amplification mix according to the number of
samples to be analysed:
Reagent For 1 reaction Concentration/
amount in reaction
Sterile distilled water 11.0 µl -
10 X PCR reaction buffer
(without MgCl2)
2.0 µl 1 X
MgCl2 (25mM) 2.0 µl 2.5 mM
5 mM dNTP (each of four in a
single stock)
0.8 µl 200 µM each
Anchored primer (100 µM) 2.0 µl 10 µM
Taq DNA polymerase (5 U/µl) 0.2 µl
18.0 µl
1 U
Procedure
• Add 18 µl of ISSR amplification mix to a tube containing 2 µl of template
DNA (~ 10 to 20 ng of DNA), making a total reaction volume of 20 µl.
• Perform PCR amplification according to the following profile:
o Initial denaturation 94oC 2 min, followed by:
o 40 cycles of 94oC 1 min, +/-45oC 1 min, 72oC 2 min; followed by:
o Final extension of 72oC for 5 min.
o A final step of 4oC can be added to hold samples overnight.

65
Part 2 • Characteristics of molecular methods and practical procedures
Notes
The annealing temperature used for primer binding depends on the
particular sequences being used.
Primer sequences
There is a range of primers available commercially, with different SSR
repeats and different ‘anchor’ regions.
Step 2. Product detection
ISSR products are sometimes separated by agarose gel electrophoresis and
detected by ethidium bromide or other DNA stains (PROTOCOL 9). On other
occasions, products are separated on polyacrylamide gels (PROTOCOL 10)
and detected through radioactive, silver staining (PROTOCOL 11) or other
methods.
(PROTOCOL 6. continued)

66
Part 2 • Characteristics of molecular methods and practical procedures
PROTOCOL 7 - Simple sequence repeat (SSR) analysis
Once primers flanking short tandem repeats are available, analysis
consists of two steps: 1, PCR amplification by a pair of specific primers;
and 2, product detection.
Step 1. PCR amplification
Make sufficient of the SSR amplification mix according to the number of
samples to be analysed:
Reagent For 1 reaction Concentration/amount
in reaction
Sterile distilled water 11.1 µl -
10 X PCR reaction buffer (with
15 mM MgCl2)
2.0 µl 1 X (1.5 mM MgCl2)
5 mM dNTP (each of four in a
single stock)
0.8 µl 200 µM each
Forward primer (2 µM) 2.0 µl 0.2 µM
Reverse primer (2 µM) 2.0 µl 0.2 µM
Taq DNA polymerase (5 U/ml) 0.1 µl
18.0 µl
0.5 U
Procedure
• Add 18 µl of SSR amplification mix to a tube containing 2 µl of
template DNA (~ 10 to 20 ng of DNA), making a total reaction volume
of 20 µl.
• Perform PCR amplification according to the following profile:
o Initial denaturation 94oC 2 min, followed by:
o 40 cycles of 94oC 1 min, +/-55oC 1 min, 72oC 1 min; followed by:
o Final extension of 72oC for 5 min.
o A final step of 4oC can be added to hold samples overnight.

67
Part 2 • Characteristics of molecular methods and practical procedures
Notes
The annealing temperature used for primer binding depends on their
sequences – temperature should be optimised using a computer
algorithm. Generally, it will be between 50 and 55oC.
Primer sequences
Primers are normally designed specifically for the organism in question.
Sometimes, universal primers are used, e.g., for chloroplast DNA.
Step 2. Product detection
SSRs are normally scored by separation on polyacrylamide gels
(PROTOCOL 10) and bands detected through radioactive, fluorescent,
silver staining (PROTOCOL 11) or other methods. Often, small
aliquots will first be run on agarose gels that are stained with ethidium
bromide (PROTOCOL 9). This saves the time and expense of running
polyacrylamide gels if reactions have been unsuccessful. SSRs are not
normally scored on agarose gels because of insufficient resolution.
(PROTOCOL 7. continued)

68
Part 2 • Characteristics of molecular methods and practical procedures
PROTOCOL 8 - Cleaved amplified polymorphic sequence (CAPS) analysis
Once primers are available, analysis consists of three steps: 1, PCR
amplification by a pair of specific primers; 2, PCR product digestion using
restriction enzymes; and 3, product detection.
Step 1. PCR amplification
Make sufficient of the CAPS amplification mix according to the number of
samples to be analysed:
Reagent For 1 reaction Concentration/amount
in reaction
Sterile distilled water 22.2 µl -
10 X PCR reaction buffer
(with 15 mM MgCl2)
4.0 µl 1 X (1.5 mM MgCl2)
5 mM dNTP (each of four in a
single stock)
1.6 µl 200 µM each
Forward primer (2 mM) 4.0 µl 0.2 µM
Reverse primer (2 mM) 4.0 µl 0.2 µM
Taq DNA polymerase (5 U/ml) 0.2 µl
36.0 µl
1 U
Procedure
• Add 36 µl of CAPS amplification mix to a tube containing 4 µl of
template DNA (~ 20 to 40 ng of DNA), making a total reaction volume of
40 µl.
• Perform PCR amplification according to the following profile:
o Initial denaturation 94oC 2 min, followed by:
o 40 cycles of 94oC 1 min, +/-55oC 1 min, 72oC 2 min; followed by:

69
Part 2 • Characteristics of molecular methods and practical procedures
o Final extension of 72oC for 5 min.
o A final step of 4oC can be added to hold samples overnight.
Notes
• The total PCR volume for CAPS is normally greater than for other
techniques. This is because PCR product needs to be observed both
before and after restriction enzyme treatment. With experience of a
particular primer pair, volumes may be scaled down.
• The annealing temperature used for primer binding depends on their
sequences – temperature should be optimised using a computer
algorithm. Generally, it will be between 50 and 55oC.
Primer sequences
Primers are normally designed specifically for the organism in question.
Sometimes, universal primers are used, e.g., for organellar – chloroplast or
nuclear – DNA.
Step 2. Restriction enzyme digestion of PCR products
The procedure used depends on the particular enzyme being employed.
Generally, 9 µl of product should be mixed with 1 µl of 10 X restriction
enzyme buffer and 1 Unit of enzyme. Incubation is normally at 37oC for
2 hours (using a heating block), although some enzymes work best at
different temperatures (e.g., TaqI, at 65oC). The protocols for individual
enzymes and particular manufacturers should be followed.
Step 3. Product detection
CAPS are generally separated by agarose gel electrophoresis and
polymorphism detected by ethidium bromide or other DNA stains
(PROTOCOL 9). Normally, small aliquots of PCR products without restriction
enzyme treatment will also be run on gels, in order to see the ‘before
digestion’ condition. Length polymorphisms can sometimes be observed at
this stage.
(PROTOCOL 8. continued)
70
Part 2 • Characteristics of molecular methods and practical procedures
2.7. Visualising DNAThe techniques for visualising DNA by agarose gel electro-phoresis and ethidium bromide staining are described in PROTOCOL 9 below. The techniques for detecting DNA by polyacrylamide gel electrophoresis and silver staining are given in PROTOCOLS 10 and 11. As with PCR, a laboratory coat and gloves should be worn throughout for each proto-col. Several of the chemicals used to visualise DNA are dangerous to human health.
PROTOCOL 9 - Agarose gel electrophoresis and ethidium bromide staining
One percent gels are used to determine the concentration and quality of
extracted or restriction-digested DNA, while 2% gels are generally used to
detect PCR products (including CAPS).
Required chemicals
• Electrophoresis grade agarose
• 0.5 X TBE buffer (made by diluting 5 X TBE stock solution)
• 6 X agarose gel loading dye
• Ethidium bromide stock solution (10 mg/ml)
See Appendix 2 for information on how to make stock and other common
solutions.
Procedure
• Weigh out into a conical flask of suitable size an appropriate quantity of
agarose for the volume and concentration of gel required. The volume
required (anywhere between 50 and 300 ml) depends on the size of the
electrophoresis rig.
• Add 0.5 X TBE buffer to the flask, to the desired volume, and swirl the
contents.
71
Part 2 • Characteristics of molecular methods and practical procedures
• Heat in 30 second bursts in a microwave, gently swirling the flask after
each burst. For small volumes, decrease the length of time of each
burst. Caution: agarose may bubble out of the flask if heated for too
long without swirling. This can cause burns.
• When the agarose has cooled to the point at which the flask can be
held (~ 55oC, this take a few minutes), pour into a previously prepared
gel tray, to a depth of around 5 mm. Using a disposable pipette tip,
push any obvious bubbles in the gel to the side of the tray. Previous
preparation of the tray involves carefully sealing each end with tape, and
placing gel combs into their allocated positions. The number of teeth
used in the gel comb depends on how many samples need to be run
on the gel, and the volume of material that needs to be loaded in each
well (smaller teeth allow more samples to be loaded, but each well has a
lower capacity).
• Allow the gel to solidify for ~ 30 min and remove the tape from the
ends of the tray. Place just below liquid level in an electrophoresis tank
that contains 0.5 X TBE. If necessary, top up the tank with more 0.5 X
TBE, as the gel must be completely covered. Very carefully and slowly
– otherwise wells will be damaged and leak – withdraw the combs from
the gel.
• Using a micropipette, carefully load prepared samples into wells, and
include markers at the start and end of each series of wells (either a
100 bp DNA ladder or lambda DNA restricted with EcoRI and HindIII
restriction enzymes). Preparing samples involves adding to them a 1/5th
volume of 6 X agarose gel loading dye. It is normal to load between 10
and 20 µl total volume into a gel well, depending on the size of the well.
Make a note of the order in which samples have been loaded.
• Run the gel rig at 50 to 200 V. The voltage that can be used depends on
the size of the gel, with bigger gels able to run at higher voltages. As
a rule of thumb, gels can be run at a voltage of 5 X the distance in cm
between electrodes. It is important that the gel does not become too
hot, as it may melt. If in doubt, err on the side of caution and use a low
voltage.
(PROTOCOL 9. continued)

72
Part 2 • Characteristics of molecular methods and practical procedures
• When resolving PCR products, gels are normally run until the first dye
marker has travelled ~ three-quarters of the length of the gel. Samples
can, however, be run shorter (e.g., for DNA extractions) or longer (e.g., if
it is known that PCR polymorphisms are difficult to resolve) distances.
• Turn off the power, remove the gel and stain it for 45 min in a sealed
plastic container using ethidium bromide solution. Stain is made up by
adding 50 µl of stock solution to a litre of 0.5 X TBE. Caution: ethidium
bromide is a mutagen and gloves should always be worn when handling
stock and all other solutions that contain it.
• View gels on a UV trans-illuminator and record results using a camera
and dark box or dark room. Caution: UV light causes eye damage
– always wear UV protective goggles or employ other UV protective
shields when using a trans-illuminator.
Notes
• Gel loading dye gives density to samples, allowing them to be loaded
into gel wells. Loading dye also allows the progress of samples to be
visualised during electrophoresis.
• DNA migrates toward the positive electrode during electrophoresis. Make
sure the gel has been oriented in the tank in the right direction!
• The basis of ethidium bromide staining is the ability of the compound
to bind strongly to DNA by intercalating between bases. It is also
fluorescent, absorbing invisible UV light and transmitting the energy as
visible orange light.
• Ethidium bromide stain can be reused a number of times, in which
case after use it should be decanted into a large glass bottle stood in a
sink. This is better than continually pouring stain down the drain. When
disposing of stain (discard it when it no longer stains gels), make sure to
wash away with lots of water.
(PROTOCOL 9. continued)
73
Part 2 • Characteristics of molecular methods and practical procedures
PROTOCOL 10 - Polyacrylamide gel electrophoresis
When detecting PCR products, 6% polyacrylamide gel matrices are generally
used. Acrylamide gels are preferred over agarose when high resolution is
required or when only low amounts of product are available for typing.
Required chemicals
• Alconox
• Repelcote
• Bind silane
• 100% ethanol
• 6% acrylamide solution
• Tetramethylenediamine solution (TEMED)
• 10% Ammonium persulphate (APS). Make up immediately before use by
dissolving ammonium persulphate powder in distilled water.
• 1 X TBE buffer (made by diluting 5 X TBE stock solution)
• 2 X formamide gel loading dye
See Appendix 2 for information on how to make stock and other common
solutions.
Procedure
• Clean both sides of the two gel plates of the gel rig using Alconox and
warm water. Make sure that there is no old gel attached to plates. Rinse
and dry the plates, and then clean the upper (gel) surfaces of both plates
with 100% ethanol.
• In a fume hood, apply Repelcote to the upper surface of the larger gel
plate, spreading evenly using blue roll. Wipe with ethanol and allow the
plate to dry.

74
Part 2 • Characteristics of molecular methods and practical procedures
• After changing gloves (to prevent cross-contamination), in a fume hood apply
bind silane to the upper surface of the smaller gel plate, spreading evenly with
blue roll. Wipe with ethanol and allow the plate to dry.
• Sandwich the two spacers, which should be clean and dry, between gel plates,
and clip in place. The smaller gel plate should be placed on top of the larger
plate, and the thick part of the spacer should butt tightly to the top edge of the
smaller plate. Binder clips should be centred on the spacer, and ~ 4 used along
each spacer (along both sides of the gel).
• Place the plates at an angle of around 15 degrees, to facilitate pouring of the
gel solution.
• In a beaker, take 100 ml (or less: exact volume depends on the size of the gel)
of 6% acrylamide solution and add 50 µl of TEMED solution and 500 µl of 10%
APS solution. Swirl beaker contents and pour the gel along the top lip of the
smaller gel plate until it begins to ooze from the bottom of the gel plates. It is
important to move quickly once APS has been added to acrylamide, as the gel
will rapidly start to polymerise. Caution: acrylamide is toxic and gloves should
always be worn when handling it. TEMED and APS are also harmful. Make
sure that any acrylamide that leaks from the gel is captured and disposed of
properly, and that bench surfaces are cleaned afterwards.
• Immediately after pouring, place the gel plates flat and insert the comb, which
should be clean and dry. Insert the ‘straight’ edge of the comb into the gel. The
number of teeth in the gel comb used depends on how many samples need
to be run, and the volume of material to be loaded in each well. Smaller teeth
allow more samples to be loaded, but each well has a lower capacity.
• Leave the gel to polymerise for ~ 1 hour and then insert into the electrophoresis
tank. Top the upper gel tank up with 1 X TBE buffer, ensuring that there are no
leakages. Carefully remove the gel comb. Also top up the bottom gel tank with
1 X TBE.
• Connect the gel rig to the power supply and ‘pre-run’ it at ~ 60 watts (check on rig
specifications) for ~ 30 min. Using a syringe containing 1 X TBE buffer, then wash
the top surface of the gel. Gently reinsert the gel comb, but this time with the teeth
downwards. The teeth should go 1 mm into the surface of the gel (no further).
Once the comb is in place, do not remove/realign it, otherwise wells will leak.
(PROTOCOL 10. continued)
75
Part 2 • Characteristics of molecular methods and practical procedures
• Using a micropipette, carefully load prepared samples into wells, and include
markers in start and end lanes (the marker used will depend on the application
in question, but 10 bp DNA ladders or old PCR products of known size may
be used). Preparing samples involves adding to them an equal volume of 2 X
formamide gel loading dye, heating to 95oC for 3 min (to make DNA single-
stranded, which gives better product resolution), and then standing on ice. It
is normal to load between 3 and 5 µl total volume into a gel well, depending
on the size of the well. Make a note of the order in which samples have been
loaded.
• Run the gel rig at ~ 60 W (check on rig specifications) for 1 to 2 hours. The
time taken to run the gel depends on the size of the products being resolved.
Progress can be monitored by how far dye markers have travelled.
• Turn off the power, drain the top gel tank and remove the gel plates from the
rig.
• Cool the gel plates under water and then separate them, being careful not to
damage the gel, plates, comb or spacers. The gel should stick to the smaller gel
plate (the plate treated with bind silane).
• Proceed with the silver staining technique (PROTOCOL 11).
Notes
• It is very important that gel plates are cleaned properly before pouring.
Otherwise, bubbles will form that will stop samples from running correctly.
• Use Repelcote and bind silane consistently on gel plates – always use one
on the large plate, the other on the small plate. Otherwise, gel may bind to, or
come off, both plates. Laboratories normally have a convention for which plate
to use which on (it doesn’t really matter which is assigned to which, initially).
Convention may vary between laboratories, but the pattern of use should
always be the same within a laboratory. Always prepare the Repelcote plate
first.
• Gel loading dye ensures DNA remains single-stranded and allows the progress
of samples to be visualised during electrophoresis.
(PROTOCOL 10. continued)
76
Part 2 • Characteristics of molecular methods and practical procedures
PROTOCOL 11 - Silver staining
Required chemicals
• 10% acetic acid solution (made up in distilled water)
• Silver stain solution
• Silver stain developer solution
Normally, ~ 2 litres of each of these solutions is need for staining a gel.
See Appendix 2 for information on how to make stock and other common
solutions.
Procedure
• Place the plate with the gel attached (from PROTOCOL 10) in a tray
containing sufficient 10% acetic acid to cover the polyacrylamide. Leave
gently swirling on a platform shaker in a fume hood for 30 min. Care: do
not pour acetic acid or other solutions directly onto the gel, as this may
dislodge it from the plate.
• Pour off the acetic acid (which can be re-used later in this protocol) and
place the gel in a tray containing distilled water. Leave gently swirling on
a platform shaker for 15 min (or until the ‘greasiness’ has gone from the
gel). Tip the water off down the sink.
• Place the gel in a tray containing silver stain solution and leave gently
swirling on a platform shaker for 30 min. Then pour off the silver
stain (this can be re-used up to 10 times). Care: silver stain needs
to be disposed of properly, as it is toxic to some waterborne/marine
organisms. Check on standard procedure for disposal in your laboratory
location.

77
Part 2 • Characteristics of molecular methods and practical procedures
• Pour distilled water into a clean tray and place the gel in it. Swirl the
tray to help remove excess silver stain from the gel. Leave the gel in
water for a total of 10 seconds (it is critical not to extend beyond this
period – rinsing for too long can result in a weak, or no, signal).
• Quickly drain the gel and place in a tray containing silver stain
developer solution. Swirl and carefully watch for the development of
bands. When these become visible, which should take a few minutes,
stop the reaction by adding the acetic acid saved from earlier in this
protocol. Swirl until bubbling ceases, which will take a few minutes.
• Rinse the gel in water for 20 min and then stand it vertically and allow
it to dry.
• Photograph the gel as a permanent record, or record using Kodak
duplicating film (follow manufacturer’s instructions).
Notes
Waste silver can be recovered from used stain solution for recycling
or proper disposal. Collect the waste stain in a plastic container and
precipitate silver by adding ~ 0.1 g per litre of NaCl. Collect the silver
chloride precipitate by allowing it to settle by gravity. Remaining liquid
may be discarded down the sink.
(PROTOCOL 11. continued)
78
Part 2 • Characteristics of molecular methods and practical procedures
Key references
Dawson IK, Jaenicke H (2006) Underutilised Plant Species: The Role of Biotechnology. International Centre for Underutilised Crops Position Paper No. 1. International Centre for Underutilised Crops (ICUC), Colombo, Sri Lanka. Available through ICUC’s website: http://www.icuc-iwmi.org/
de Vicente MC, Fulton T (2003) Using Molecular Marker Technology in Studies on Plant Genetic Diversity. International Plant Genetic Resources Institute (now Bioversity International), Rome, Italy and Institute for Genetic Diversity, Ithaca, New York, USA. Available at: http://www.bioversityinternational.org/Publications/Molecular_Markers_Volume_1_en/index.asp
de Vicente MC, López C, Fulton T (2003) Genetic Diversity Analysis with Molecular Marker Data. International Plant Genetic Resources Institute (now Bioversity International), Rome, Italy and Institute for Genetic Diversity, Ithaca, New York, USA. Available at: http://www.bioversityinternational.org/Publications/Molecular_Markers_Volume_2_en/index.asp
Karp A, Kresovich S, Bhat KV, Ayad WG, Hodgkin T (1997) Molecular Tools in Plant Genetic Resources Conservation: a Guide to the Technologies. IPGRI Technical Bulletin No. 2. International Plant Genetic Resources Institute (now Bioversity International), Rome, Italy. Available at: http://www.bioversityinternational.org/Publications/pubfile.asp?ID_PUB=138
Spooner D, van Treuren R, de Vicente MC (2005) Molecular Markers for Genebank Management. IPGRI Technical Bulletin No. 10. International Plant Genetic Resources Institute (now Bioversity International), Rome, Italy. Available at: http://www.bioversityinternational.org/publications/pubfile.asp?ID_PUB=1082
79
Part 3 • Dealing with dataPart 3Dealing with data
Ineffective handling of data is one of the reasons why application of molecular techniques for practical management in forests and farms has been low to date. Unless molecular data can be
recorded and analysed properly, there is little point in undertaking laboratory studies. In this section of the guide, we briefly consider the ways to handle molecular data once it has been obtained. This section gives only an introduction to the topic, as a detailed presentation is given in a ‘sister’ publication to this guide (Kindt et al., 2008). This second guide should be referred to for information on the various available approaches to analysis, including the protocols and software that can be applied to different types of data. Please contact the molecular laboratory at the World Agroforestry Centre to obtain this second publication (see contact details at the beginning of this guide).
3.1. Scoring and storingThe way in which data are recorded depends on whether they are revealed by a dominant or codominant molecular marker technique. For dominant data provided by AFLPs, RAPDs and ISSRs, each locus is scored for an individual in a ‘binary’ way, as [1] or [0] (presence or absence of a prod-uct, respectively). In this case, even though two chromo-somes are present in a diploid individual, only one number is recorded for a locus. This is because it is not possible to resolve homozygote ‘present-present’ and heterozygote ‘present-absent’ states.
In the case of codominant data provided by SSRs and CAPS, each separate allele at a locus is generally given a score that relates to its length in bases, as measured against a size standard. With a diploid organism, each individual’s score at a locus will consist of two numbers, as the status of both chromosomes is detectable. For example, an individual with
After laboratory work, data must be properly scored, stored and analysed. The way data are handled depends on the marker technique used in the laboratory, but common approaches to analysis can be applied.
The best way to score data is straight into a computer spreadsheet. Spreadsheets should contain column and row labels which explain for each data point the individual being scored and the locus being analysed.
80
Part 3 • Dealing with data
the score [131, 133] at an SSR locus represents a heterozy-gote in which one chromosome has an allele with a product length of 131 bases, the other chromosome of 133 bases. Individuals homozygous for these product states would be recorded as [131, 131] and [133, 133].
Usually, the best way to deal with data is to input it straight into a computer spreadsheet package. Spreadsheets should be set up in advance by the user to contain column and row labels that explain for each data point the individual being scored – the population it comes from and a unique sam-ple identifier – and the locus being analysed (e.g., the name of the primer/primers used to reveal that polymorphism). Spreadsheet labels should correspond with those used on any photographs or other recorded images of laboratory results, to facilitate later cross checking. Use of the compu-ter package Microsoft Excel is ideal for data entry, because the ‘bolt on’ routine GENALEX helps in properly format-ting spreadsheets (see Peakall and Smouse, 2006; Kindt et al., 2008).
Spreadsheets are the basis for all subsequent analyses of results and for data storage. Once complete, a spreadsheet can be manipulated into formats appropriate for various data analysis packages. Each completed spreadsheet should be printed and stored in a safe place for future reference. A more detailed separate description of the experiment should also be printed and attached to the hard copy of the spreadsheet. This annex should give every available de-tail on the material tested in the study, both at a popula-tion and individual level. The particular information provided will depend on the study in question, but should include all the data collected during fieldwork, e.g., name of popula-tion, geographic location, the nature of any ‘nesting’ during sampling (e.g., sub-structuring within populations), a map of collection points, evidence of any human management, and, possibly, the diameter, sex and geographic coordinates of individual trees.
81
Part 3 • Dealing with data
The ‘archiving’ of data is extremely important, because it al-lows information to be returned to in the future – perhaps several years later, when the person who did the original laboratory work and data analysis has moved on – when more data, new evidence, or new ways of analysis, suggest that re-examination and/or a new interpretation of results would be useful. In order to allow comparisons among dif-ferent studies conducted at different times in a laboratory, it is important to each time use the same standardised meth-ods for recording.
3.2. Common approaches used in analysisAnalysis of data involves describing the variation revealed by a molecular technique at individual, population and other ecological or geographic levels. Furthermore, it involves cal-culating the relationships between various levels of struc-ture, and expressing these relationships in ways that are clear – numerically and, ideally, visually – to researchers and field managers. Where relevant, marker data sets need to be integrated with data series revealed by other techniques, e.g., by other molecular marker approaches, or by field trial observations.
The type of measure that can be applied during data analysis depends to some extent on whether dealing with dominant or codominant markers, as some measures are more appro-priate or only relevant for one or the other. Furthermore, dominant data can be dealt with by only certain software packages. Even within dominant and codominant categories, certain methods of analysis are more appropriate for some marker systems than others. For example, although both SSRs and CAPS provide codominant markers, statistical methods that assess gene flow through paternity analysis are only really applicable to SSRs, as having many allele states at each locus is a requirement for successful determination.
There are several software packages available for the analy-sis of molecular data. Of these, the most important include
For both dominant and codominant data, statistical methods are used to quantify genetic diversity and measure genetic differentiation between different levels of sample structure.
82
Part 3 • Dealing with data
the GENALEX ‘bolt on’ for Excel, Arlequin, PopGene and FSTAT. These packages tend to have a mix of common and unique functions. When functions are in common, which package to use is often simply a question of user preference – users will tend to use the approach they were first intro-duced to, unless there is good reason for change. GENALEX is a good starting point for newcomers because it is able to undertake basic analyses and can format data for further in-put into other software packages. It has also been developed with teaching in mind. Kindt et al. (2008) provide informa-tion on the use and availability of different packages, most of which can be downloaded from the Internet free of charge.
Measures commonly applied to both dominant and codominant data setsMeasures commonly calculated from both dominant and codominant data sets include genetic diversity and genetic differentiation (or, inversely, genetic similarity) (see below). Researchers should be familiar with these measures before beginning field sampling and laboratory work. This is be-cause this knowledge can help guide the extent of field col-lection required to address a particular question and assist in determining the most useful PCR technique. For further information on different measures, please see de Vicente et al. (2003) and Kindt et al. (2008).
Quantifying genetic diversityGenetic diversity can be quantified in terms of the rich-ness and evenness of distribution of polymorphisms within populations or other defined groups of individuals. Allele and genotype frequencies and allele numbers can be meas-ured for codominant markers, while product frequencies can be (under certain assumptions) converted to estimates of allele frequencies for dominant markers. Formal diversity estimates, such as those based on Nei’s measure, can be cal-culated from allele frequencies. Allelic/product variation can be averaged over the total number of loci analysed in a study in order to give an overall picture of diversity. Estimates can

83
Part 3 • Dealing with data
be corrected in different ways in order to account for vary-ing sample sizes among groups of individuals.
Measuring genetic differentiationSeveral methods are available for measuring genetic differ-entiation among individuals, populations and other defined sample structures. These methods are based on partition-ing variation among product, allele, and/or genotype scores at different hierarchical levels. One of the most common methods of partitioning variation is based on Wright’s F-sta-tistics. These statistics can be related directly to the breeding systems of tree species. An Analysis of Molecular Variance (AMOVA; which make use of F-related statistics) is a com-mon method for structuring genetic variation. Software de-veloped for AMOVA calculates the percentage of overall var-iation that partitions within and among tested stands, stands that may also be ‘nested’ into various structures. Through permutation tests, AMOVA also assesses the significance of the observed differences between stands/restings.
Visualising differencesCluster analysis – based on individuals or populations as ba-sal units – is a common way to visualise genetic differences. Distance (or similarity) matrices are calculated between ba-sal units based on a number of different coefficients that are relevant in different circumstances. Units are then grouped based on unweighted pair-group or other methods of clus-tering into a visual representation (a phenogram) of rela-tionships. The cluster approach works best when wishing to compare relationships between rather similar individuals or groups.
Ordination provides another set of multivariate methods that can be used to visualise genetic differences between in-dividuals or populations. In ordination approaches, a pairwise distance matrix is subjected to an analysis that expresses variation in terms of a small number of principal axes, which can then be visually presented in the form of two- or three-

84
Part 3 • Dealing with data
dimensional diagrams. Several ordination techniques – such as principal coordinate analysis and non-metric multidimen-sional scaling – are appropriate for molecular data. The ordi-nation approach works best when comparing relationships between rather different individuals or groups, and when as-sessing the possibilities for interactions between stands. For example, hybrids may well locate intermediately between aggregations of individuals from the two populations from which they were originally derived.
Key references
de Vicente MC, López C, Fulton T (2003) Genetic Diversity Analysis with Molecular Marker Data. International Plant Genetic Resources Institute (now Bioversity International), Rome, Italy and Institute for Genetic Diversity, Ithaca, New York, USA. Available at: http://www.bioversityinternational.org/Publications/Molecular_Markers_Volume_2_en/index.asp
Kindt R, Jamnadass R, Muchugi A, Kipruto HK (2008) A Guide for Studying Molecular Genetic Variation in Tropical Trees: Common Methods for Statistical Analysis of Data. Parts A (dominant data) and B (codominant data). The World Agroforestry Centre, Nairobi, Kenya.
Peakall R, Smouse PE (2006) GENALEX 6: genetic analysis in Excel. Population genetic software for teaching and research. Molecular Ecology Notes, 6, 288-295. Available at: http://www.anu.edu.au/BoZo/GenAlEx/
85
Appendix 1 • Glossary of terms Appendix 1Glossary of terms
AlleleOne of the variant forms of a gene at a particular locus on a chromosome.
BasesThe letters that spell the genetic code. In DNA, these are A (adenine), C (cytosine), G (guanine) and T (thymine).
ChloroplastAn organelle in plant cells that carries out photosynthesis, the process of converting energy from light into sugar. Chloroplasts contain their own DNA.
ChromosomesThe threadlike packages of genes and other DNA in the nucleus or organelles of a cell.
Gel electrophoresisA technique that separates DNA or other molecules in a gel matrix by using an electric current. DNA molecules of different sizes move through the gel at different rates, resulting in ‘bands’ on the gel.
GenesThe functional units of heredity passed from parents to offspring. Genes are made of DNA and many contain the information for making particular proteins.
GeneticsThe study of heredity, the passing of genes from parent to offspring, and the various processes involved.
Genetic distanceThe degree of difference between individuals or populations as measured from genetic data by various statistics.
Genetic diversityVariation in the genetic composition of individuals within or among populations.
HeterozygosityHaving more than one allele condition at a locus. That is, in a diploid individual, the alleles at a given locus on paired chromosomes are different.
HomozygosityHaving only one allele condition at a locus. That is, in a diploid individual, both alleles at a given locus on paired chromosomes are the same.
Inbreeding depressionThe process by which related matings lead to homozygosity, the loss of heterozygote superiority and the exposure of recessive deleterious mutations in an organism.
MitochondriaAn organelle that makes energy for the cell. Mitochondria contain their own DNA.

86
Appendix 1 • Glossary of terms
Molecular biologyThe study and manipulation of the structure and function of the molecules that make up living organisms.
NuclearConnected with the nucleus, the central structure in a cell that contains most of the DNA of an organism.
NucleotidesThe building blocks of DNA. A nucleotide consists of a base (see above) connected to a sugar and phosphoric acid, which allow the base to be incorporated into DNA chains.
OligonucleotidesShort single-stranded strings of nucleotides that bind to complementary strands of DNA and are used as ‘primers’ to start replication during PCR.
OrganellesDiscreet structures such as chloroplasts and mitochondria that perform particular functions inside a cell. DNA in these organelles is inherited in a different way from nuclear DNA, generally through the maternal parent only, making polymorphisms seed-specific markers. Rarely, organellar markers may be inherited through the paternal parent only, in which case they act as pollen-specific markers.
PhenotypeThe observable traits or characteristics of an organism.
Polymerase chain reaction (PCR)PCR uses thermostable enzymes (DNA polymerases) extracted from heat tolerant micro-organisms to bring about the in vitro replication of DNA. It is the basis for most of the modern molecular marker approaches that are applied to characterise genetic variation in plants and animals (see ‘replication’ below).
PolymorphismsAt the DNA level, variations in DNA sequence. Polymorphisms may result from base substitutions, insertions and deletions, or chromosomal rearrangements.
PopulationA group of individuals of a species growing in the same place. Sometimes (more formally) taken to mean a group of individuals that have the potential to randomly interbreed.
ProtocolA set of standard steps defining an experiment or procedure.
ReplicationThe process of copying DNA. In PCR, the original double-stranded DNA strand is ‘unzipped’ into single strands, primer is bound to each strand and then extended with matching bases to the ‘template’, eventually resulting in two complete sets of target DNA. During PCR, the process of unzipping, primer binding and extension is repeated many times, in order to greatly amplify DNA.

87
Appendix 2 • Making stock and other commonly used solutionsAppendix 2Making stock and other commonly used solutions
1 M Tris-HCl (pH 7.5 or 8.0) stock solution (1 litre)Dissolve 121 g of Tris base in ~ 800 ml of distilled water while stirring using a magnetic stirrer. Adjust the pH to the desired value (different pH values are used, depending on the application) by adding concentrated HCl (caution can cause extreme burns!). Allow the solution to cool to room temperature before making final adjustments to pH and volume (to 1000 ml with distilled water). Dispense into smaller volumes and sterilise by autoclaving.
0.5 M EDTA (pH 8.0) stock solution (1 litre) Add 186 g of disodium ethylenediaminetetraacetate.2H2O (EDTA) (Formula Weight = 372) to 800 ml of distilled water. Stir using a magnetic stirrer and adjust the pH to 8.0 with NaOH pellets (~ 20 g). EDTA will not dissolve fully into solution until ~ pH 8. Make final adjustments to pH and volume (to 1000 ml with distilled water). Dispense into smaller volumes and sterilise by autoclaving.
5 M NaCl stock solution (1 litre)Dissolve 292 g of NaCl in ~ 800 ml of distilled water. Make up to 1000 ml, aliquot into smaller volumes and sterilise by autoclaving.
1 X TE buffer (10 mM Tris-HCl, 1 mM EDTA) (100 ml) Mix 1 ml of 1 M Tris-HCl (pH 8.0) stock and 200 μl of 0.5 M EDTA (pH 8.0) stock and adjust to 100 ml with distilled water. Sterilise by autoclaving (unnecessary if all solutions and container used were already autoclaved).
70% ethanol (100 ml)Mix 70 ml ethanol with 30 ml of previously autoclaved distilled water.
Chloroform-isoamyl alcohol (24:1) (100 ml)In a clean dark bottle, mix 96 ml of chloroform with 4 ml of isoamyl alcohol.
Phenol-chloroform-isoamyl alcohol (25:24:1)Purchase from a manufacturer because of the danger in handling phenol.
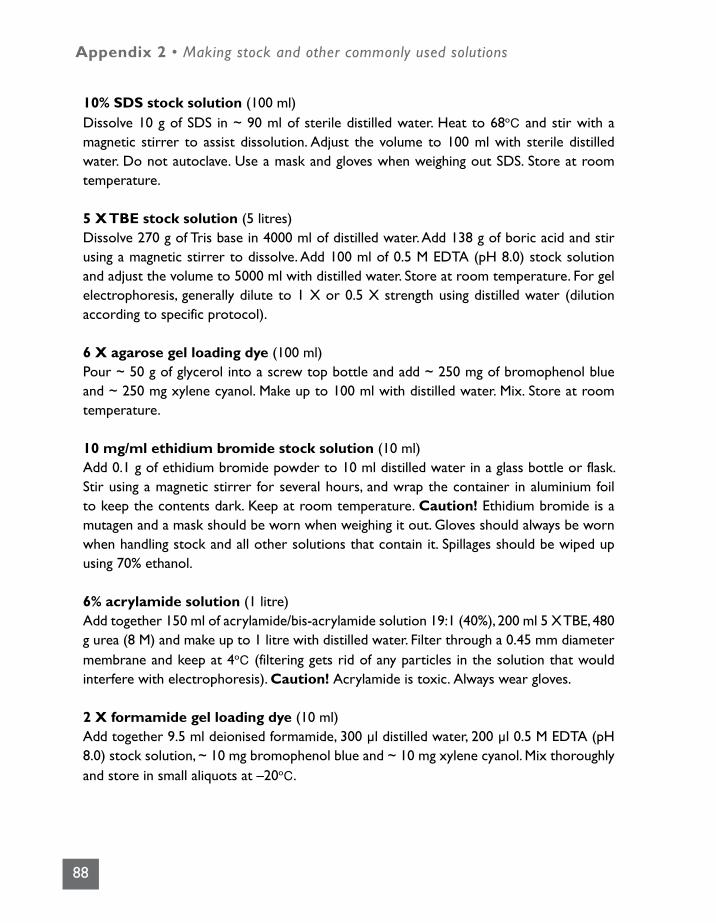
88
Appendix 2 • Making stock and other commonly used solutions
10% SDS stock solution (100 ml)Dissolve 10 g of SDS in ~ 90 ml of sterile distilled water. Heat to 68oC and stir with a magnetic stirrer to assist dissolution. Adjust the volume to 100 ml with sterile distilled water. Do not autoclave. Use a mask and gloves when weighing out SDS. Store at room temperature.
5 X TBE stock solution (5 litres)Dissolve 270 g of Tris base in 4000 ml of distilled water. Add 138 g of boric acid and stir using a magnetic stirrer to dissolve. Add 100 ml of 0.5 M EDTA (pH 8.0) stock solution and adjust the volume to 5000 ml with distilled water. Store at room temperature. For gel electrophoresis, generally dilute to 1 X or 0.5 X strength using distilled water (dilution according to specific protocol).
6 X agarose gel loading dye (100 ml)Pour ~ 50 g of glycerol into a screw top bottle and add ~ 250 mg of bromophenol blue and ~ 250 mg xylene cyanol. Make up to 100 ml with distilled water. Mix. Store at room temperature.
10 mg/ml ethidium bromide stock solution (10 ml)Add 0.1 g of ethidium bromide powder to 10 ml distilled water in a glass bottle or flask. Stir using a magnetic stirrer for several hours, and wrap the container in aluminium foil to keep the contents dark. Keep at room temperature. Caution! Ethidium bromide is a mutagen and a mask should be worn when weighing it out. Gloves should always be worn when handling stock and all other solutions that contain it. Spillages should be wiped up using 70% ethanol.
6% acrylamide solution (1 litre)Add together 150 ml of acrylamide/bis-acrylamide solution 19:1 (40%), 200 ml 5 X TBE, 480 g urea (8 M) and make up to 1 litre with distilled water. Filter through a 0.45 mm diameter membrane and keep at 4oC (filtering gets rid of any particles in the solution that would interfere with electrophoresis). Caution! Acrylamide is toxic. Always wear gloves.
2 X formamide gel loading dye (10 ml)Add together 9.5 ml deionised formamide, 300 μl distilled water, 200 μl 0.5 M EDTA (pH 8.0) stock solution, ~ 10 mg bromophenol blue and ~ 10 mg xylene cyanol. Mix thoroughly and store in small aliquots at –20oC.
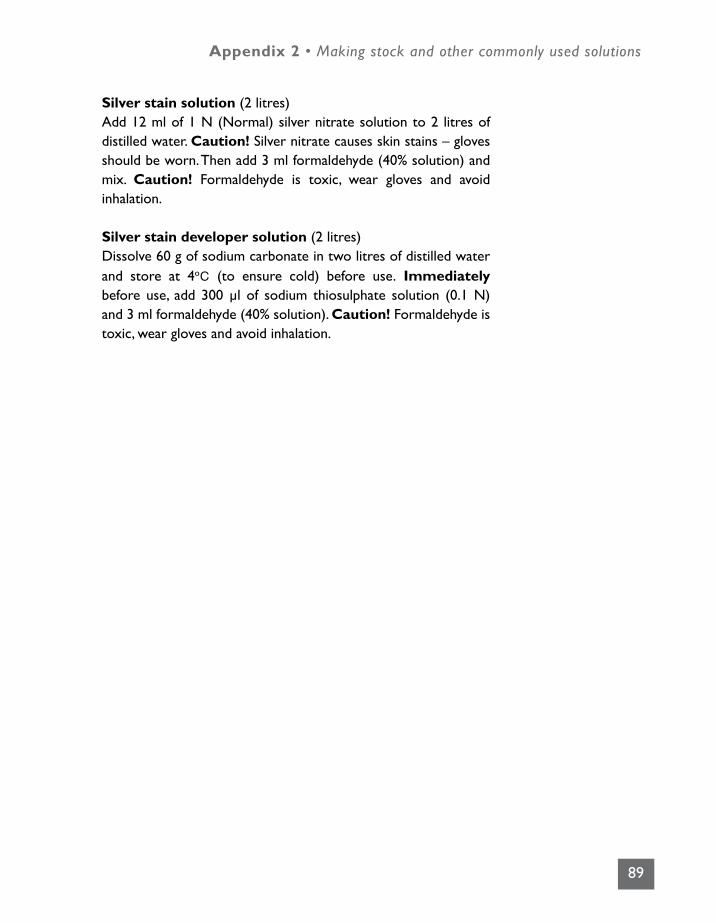
89
Appendix 2 • Making stock and other commonly used solutions
Silver stain solution (2 litres)Add 12 ml of 1 N (Normal) silver nitrate solution to 2 litres of distilled water. Caution! Silver nitrate causes skin stains – gloves should be worn. Then add 3 ml formaldehyde (40% solution) and mix. Caution! Formaldehyde is toxic, wear gloves and avoid inhalation.
Silver stain developer solution (2 litres)Dissolve 60 g of sodium carbonate in two litres of distilled water and store at 4oC (to ensure cold) before use. Immediately before use, add 300 μl of sodium thiosulphate solution (0.1 N) and 3 ml formaldehyde (40% solution). Caution! Formaldehyde is toxic, wear gloves and avoid inhalation.
Technical Manual Series
TM 1: Linking Research to Extension for Watershed Management: The Nyando
Experience.
TM 2: Bonnes pratiques de culture en pépinière forestière : Directives pratiques pour
les pépinières communautaires.
TM 3: Bonnes pratiques de culture en pépinière forestière : Directives pratiques pour
les pépinières de recherche.
TM 4:¡Plantemos madera! Manual sobre el establecimiento, manejo y
aprovechamiento de plantaciones maderables para productores de la Amazonía
peruana.
TM 5: Rainwater Harvesting Innovations in Response to Water Scarcity: The Lare
Experience.
TM 6: Useful Trees and Shrubs of Ethiopia : Identification, Propagation and
Management for 17 Agroclimatic Zones.
TM 7: Mapping the Potential of Rainwater Harvesting Technologies in Africa: A GIS
Overview on Development Domains for the Continent and Nine Selected Countries.
TM 8: Green Water Management Handbook: Rainwater Harvesting for Agricultural
Production and Ecological Sustainability.
TM 9: Molecular Markers for Tropical Trees, A Practical Guide to Principles and
Procedures.
World Agroforestry CentreUnited Nations Avenue, Gigiri, P. O. Box 30677-00100, Nairobi, KenyaTel: (+254 20) 722 4000, Fax: (+254 20) 722 4001, Email: [email protected]
About the World Agroforestry CentreThe World Agroforestry Centre is an autonomous, non-profit research organization whose vision is a rural transformation in the developing world resulting in a massive increase in the use of trees in rural landscapes by smallholder households for improved food security, nutrition, income, health, shelter, energy and environmental sustainability. The Centre generates science-based knowledge about the diverse role that trees play in agricultural landscapes, and uses its research to advance policies and practices that benefit the poor and the environment. We are one of the 15 centres of the Consultative Group on International Agricultural Research (CGIAR).
Headquartered in Nairobi, Kenya, we operate five regional offices located in Brazil, Cameroon, Indonesia, Kenya, and Malawi, and conduct research in eighteen other countries around the developing world.
We receive our funding from over 50 different governments, private foundations, international organizations and regional development banks. Our current top ten donors are Canada, the European Union, the International Fund for Agricultural Development (IFAD), Ireland, the Netherlands, Norway, Sweden, the United Kingdom, the United States of America and the World Bank.
In the last decade, there has been an enormous increase worldwide in the use of molecular marker methods to assess genetic variation in trees. These approaches can provide significant insights into the defining features of different taxa and this information may be used to define appropriate management strategies for species.
However, a survey of the literature indicates that the implementation of practical, more optimal management strategies based on results from molecular marker research is very limited to date for tropical trees. In order to explore why this is the case, the World Agroforestry Centre undertook a survey of molecular laboratories in low-income countries in the tropics. This survey looked at the kinds of molecular marker studies that were being carried out on tree species, and the problems faced by scientists in this research. Lack of knowledge about the different procedures available for molecular genetic studies was an important constraint, as well as a lack of guidance on how best to apply methods specifically to tropical trees, in meaningful and cost-efficient ways. The content of this guide has been developed to help meet these requirements. Although other publications are available that describe molecular marker techniques, none deal with the spe-cific context needed for effective research on tropical trees.
ISBN: 978-92-9059-225-9
World Agroforestry CentreUnited Nations Avenue, Gigiri, P. O. Box 30677-00100, Nairobi, KenyaTel: (+254 20) 722 4000, Fax: (+254 20) 722 4001, Email: [email protected]


