Review Article Molecular Rotational Resonance Spectroscopy Stuart Armstrong Hewlett Packard Co., Palo Alto, California 94304 (Received 18 July 1969) A number of recent review articles have summarized the application of ~VIolecular Rotational Resonance (MRR) spectroscopy to the area of molecular structure determinations and described how these applications have applied to chemistry. This article will briefly review this estab- lished area of MRR spectroscopy and describe two developments that offer the promise of ex- panding the applicability of MRR spectroscopy. The first development was the observation that some large molecules (by MRR standards) give a series of relatively intense, equally spaced bands that can be quickly recorded and assigned. The other development has been in the theory, procedures, and instrumentation required for accurate intensity measurements. These two developments, examples of each, and the implication of each for use by chemists, as well as molecular structure determinations, will be discussed. Spectrometers that are being used for studies in this established area and the two newer areas will be described in the Appendix. INDEX .F~EADINGS 1 Microwave spectroscopy ; Molecular structm'e ; ~eview Article. INTRODUCTION MRR absorptions generally result from transitions between molecular rotational energy levels. They have been recorded in the frequency range from 292- 510 000 MHz. 1 However, most MRR experiments be- ing done today are in a frequency range of about 4000-60 000 MHz. The experiments are run in the gas phase at low pressures, typically about 10 -2 Torr. The amount of sample required is a few t~mole and the molecule must have a dipole moment. The microwave spectrum of a molecule is gen- erally determined by the three principle moments of inertia. (A moment of inertia is the sums of the mass of the atomic nuclei times the square of the distance of the nuclei from some principle inertial axis.) Using rules of quantum mechanics, it is pos- sible to calculate the microwave spectrum of a mole- cule with a known molecular structure, or from an assigned microwave spectrum determine the mole- cules' molecular structure. The spectrum is very sensitive to changes in the moments of inertia. For example, exchanging a deuterium for a hydrogen atom will significantly change the MRR spectrum of a molecule. An example of the use of the isotope effect in chemistry is the work by Hironaka, Hirota, and Hi- rota. 2,8 They determined that for the deuteration of propene with D2 or D20, using either palladium or nickel as a catalyst, a difference existed in the ex- changeability of the two hydrogen atoms on the methylene group. They were able to give quantitative results for the distribution of the deuterium on all the sites in the propene molecule. The frequencies of these absorptions can be mea- sured to typically 0.01 MHz. With this accuracy, it is possible to accurately determine molecular struc- tures. At present, the structure of about 1000 mole- cules have been reported. Values for interatomic distances are typically reported to about 0.01 ~ and in some cases to 0.001 2~. Bond angles in the best cases are accurate to better than 1 ° . Some intramolecular effects cause splitting of the rotational transition. For example: if a nucleus in the molecule has a nuclear quadrupole moment, then the coupling of the nuclear spin angular momentum with the overall rotational angular momentum can split a rotational transition. An analysis of the splitting can give information about the field gradi- ent, on a relative basis, and thus some information on the electron distribution in the molecule. Hindered internal rotation also gives rise to split- tings. Most work to date has been done on methyl groups and in some cases CFa groups. Barriers to internal rotation can be determined from measured splittings. The accuracy of the determination is on the order of 1%-2%. About 100 barriers have been reported. This is one of the major contributions MRR spectroscopy has made to chemistry. From studies of the Stark effect of rotational tran- sitions, molecular dipole moments can be determined. The accuracy of the reported values is usually about 1%. ~Iore accurate values have been reported from spectrometers using special cells. Since the squares of the components are determined experimentally, it is not possible to determine the overall sign or direction of the dipole moment. Volume 23, Number 6, 1969 APPLIED SPECTROSCOPY 575
Transcript
Review Article
Molecular Rotational Resonance Spectroscopy
Stuart Armstrong
Hewlett Packard Co., Palo Alto, California 94304
(Received 18 July 1969)
A number of recent review articles have summarized the application of ~VIolecular Rotational Resonance (MRR) spectroscopy to the area of molecular structure determinations and described how these applications have applied to chemistry. This article will briefly review this estab- lished area of MRR spectroscopy and describe two developments that offer the promise of ex- panding the applicability of MRR spectroscopy. The first development was the observation that some large molecules (by MRR standards) give a series of relatively intense, equally spaced bands that can be quickly recorded and assigned. The other development has been in the theory, procedures, and instrumentation required for accurate intensity measurements. These two developments, examples of each, and the implication of each for use by chemists, as well as molecular structure determinations, will be discussed. Spectrometers that are being used for studies in this established area and the two newer areas will be described in the Appendix. INDEX .F~EADINGS 1 Microwave spectroscopy ; Molecular structm'e ; ~eview Article.
INTRODUCTION
M R R abso rp t ions g e n e r a l l y r e su l t f r om t r a n s i t i o n s between molecu la r r o t a t i o n a l ene rgy levels. They have been r e c o r d e d in the f r e q u e n c y r a n g e f rom 292- 510 000 MHz. 1 However , most M R R e x p e r i m e n t s be- ing done t o d a y a re in a f r e q u e n c y r a n g e of abou t 4000-60 000 MHz. The e x p e r i m e n t s a re r u n in the gas phase a t low pressures , t y p i c a l l y abou t 10 -2 Tor r . The a m o u n t of s ample r e q u i r e d is a few t~mole and the molecule mus t have a d ipo le moment .
The mic rowave s p e c t r u m of a molecule is gen- e r a l l y d e t e r m i n e d by the th ree p r i n c i p l e momen t s of ine r t i a . ( A m o m e n t of i n e r t i a is the sums of the mass of the a tomic nuc le i t imes the square of the d i s tance of the nuc le i f r om some p r i n c i p l e i n e r t i a l axis . ) Us ing ru les of q u a n t u m mechanics , i t is pos- sible to ca lcu la te the mic rowave s p e c t r u m of a mole- cule wi th a known molecu la r s t ruc tu re , or f rom an ass igned mic rowave s p e c t r u m d e t e r m i n e the mole- cu les ' m o l e c u l a r s t ruc tu re . The s p e c t r u m is v e r y sens i t ive to changes in the momen t s of ine r t i a . F o r example , exchang ing a d e u t e r i u m for a h y d r o g e n a tom wi l l s ign i f i can t ly change the M R R s p e c t r u m of a molecule.
A n example of the use of the i sotope effect in chemis t ry is the work b y H i r o n a k a , H i r o t a , a n d Hi - ro ta . 2,8 They d e t e r m i n e d t h a t for the d e u t e r a t i o n of p r o p e n e wi th D2 or D20, u s ing e i the r p a l l a d i u m or n icke l as a ca ta lys t , a d i f ference ex is ted in the ex- c h a n g e a b i l i t y of the two h y d r o g e n a toms on the me thy lene g roup . They were able to give q u a n t i t a t i v e resu l t s for the d i s t r i b u t i o n of the d e u t e r i u m on al l the si tes in the p r o p e n e molecule.
The f requenc ies of these abso rp t i ons can be mea- su red to t y p i c a l l y 0.01 MHz. W i t h th is accuracy , it is poss ible to a c c u r a t e l y d e t e r m i n e mo lecu la r s t ruc- tures . A t p resen t , the s t r u c t u r e of abou t 1000 mole- cules have been r epo r t ed . Va lues for i n t e r a t o m i c d i s tances a re t y p i c a l l y r e p o r t e d to abou t 0.01 ~ and in some cases to 0.001 2~. B o n d angles in the best cases a re accu ra t e to be t t e r t h a n 1 ° .
Some i n t r a m o l e c u l a r effects cause s p l i t t i n g of the r o t a t i o n a l t r ans i t i on . F o r e x a m p l e : i f a nuc leus in the molecule has a nuc l ea r q u a d r u p o l e moment , t hen the coup l ing of the n u c l e a r sp in a n g u l a r m o m e n t u m wi th the overa l l r o t a t i o n a l a n g u l a r m o m e n t u m can s p l i t a r o t a t i o n a l t r ans i t i on . A n ana lys i s of the s p l i t t i n g can give i n f o r m a t i o n abou t the field g r ad i - ent, on a r e l a t i ve basis, a n d thus some i n f o r m a t i o n on the e lec t ron d i s t r i b u t i o n in the molecule.
H i n d e r e d i n t e r n a l r o t a t i o n also gives r ise to sp l i t - t ings . Most work to da te has been done on me thy l g roups a n d in some cases CFa groups . B a r r i e r s to i n t e r n a l r o t a t i o n can be d e t e r m i n e d f rom m e a s u r e d sp l i t t ings . The a c c u r a c y of the d e t e r m i n a t i o n is on the o r d e r of 1 % - 2 % . A b o u t 100 b a r r i e r s have been r epo r t ed . This is one of the m a j o r con t r i bu t i ons M R R spec t ro scopy has m a d e to chemis t ry .
F r o m s tud ies of the S t a r k effect of r o t a t i o n a l t r a n - s i t ions, mo lecu l a r d ipo le moments can be d e t e r m i n e d . The a c c u r a c y of the r e p o r t e d va lues is u s u a l l y abou t 1%. ~Iore accu ra t e va lues have been r e p o r t e d f rom spec t rome te r s u s ing spec ia l cells. S ince the squares of the componen t s a re d e t e r m i n e d e x p e r i m e n t a l l y , i t is n o t poss ib le to d e t e r m i n e the overa l l s ign or d i r ec t ion of the d ipo le moment .
Volume 23, Number 6, 1969 APPLIED SPECTROSCOPY 575
Table I. B + C/2 for propyl halides (in MHz).
Predicted from
Assigned " B a n d assumed Molecule M R R spectra" structures
E. Hirota, J. Chem. Phys. 37, 283 (1962). bT. N. Sarachman, J. Chem. Phys. 39, 469 (1963). * T. N. Saraehman (private communications), prel iminary results. d The gauche bands were too broad to dis t inguish the two isotopes. An
average value of 2137 ± 7 was observed and the 15-MHz difference in isotopes predicted w a s a s s u m e d to be correct.
One major contribution to molecular s t ructure and chemistry by MRR spectroscopy has been the studies of conformers or rotational isomers. As each rota- tional isomer such as trans and gauche isomers, has a separate and distinct spectrum, the spect rum of each form can be analyzed giving s tructures and the di- hedral angle. In some cases informat ion on the po- tential energy as a funct ion of the rotat ion of the dihedral angle can be obtained. This information is par t icular ly impor tan t to those chemists interested in nonbonded forces.
The above summary is only a small sampling of the contributions made to chemistry by MRR spec- troscopy. Other impor tan t areas of applicat ion are centr i fugal distortion, informat ion on nuclear masses, nuclear quadrupole coupling constants, low-lying vibrat ional species and identification of some tran- sient species. The reader is refer red to the references at the end of the article for more detailed informa: tion on these applications. [See Suggested Reading.]
I. D I S C U S S I O N
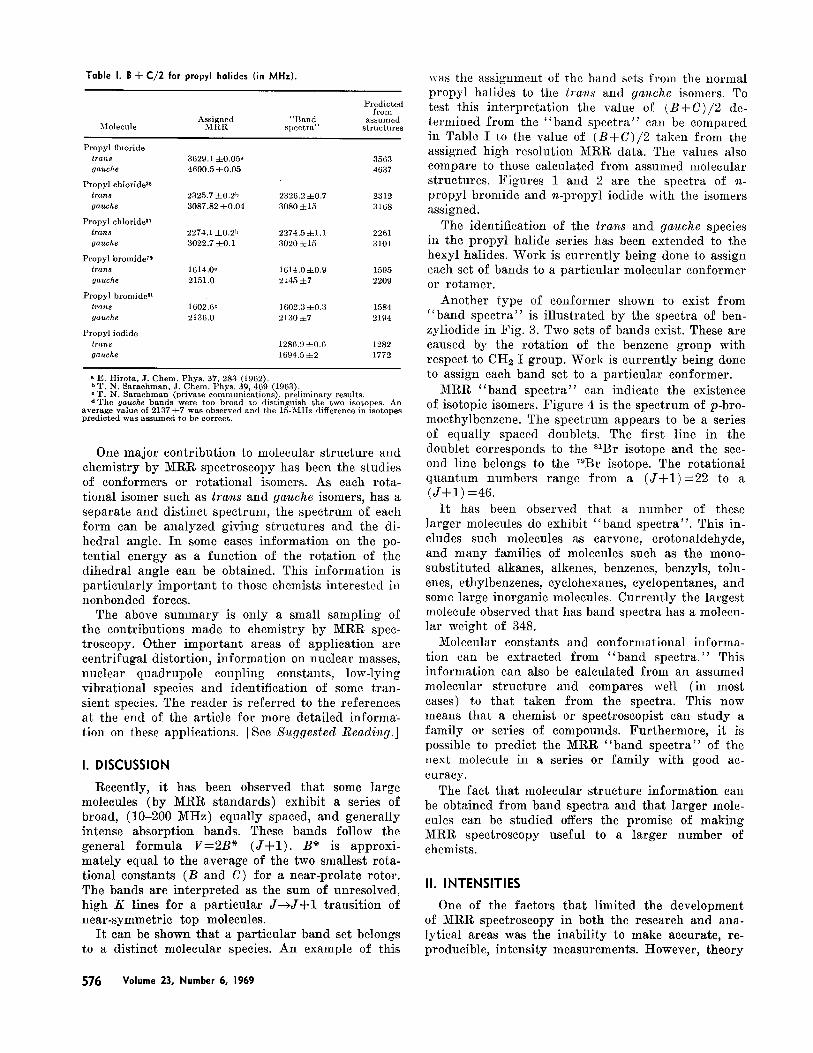
Recently, i t has been observed tha t some large molecules (by MRR standards) exhibit a series of broad, (10-200 MHz) equally spaced, and general ly intense absorption bands. These bands follow the general formula V=2B ~ ( J + l ) . B* is approxi- mate ly equal to the average of the two smallest rota- tional constants (B and C) for a near-prolate rotor. The bands are in terpre ted as the sum of unresolved, high K lines for a par t icular J.---~J+l t ransi t ion of near-symmetr ic top molecules.
I t can be shown tha t a par t icular band set belongs to a distinct molecular species. An example of this
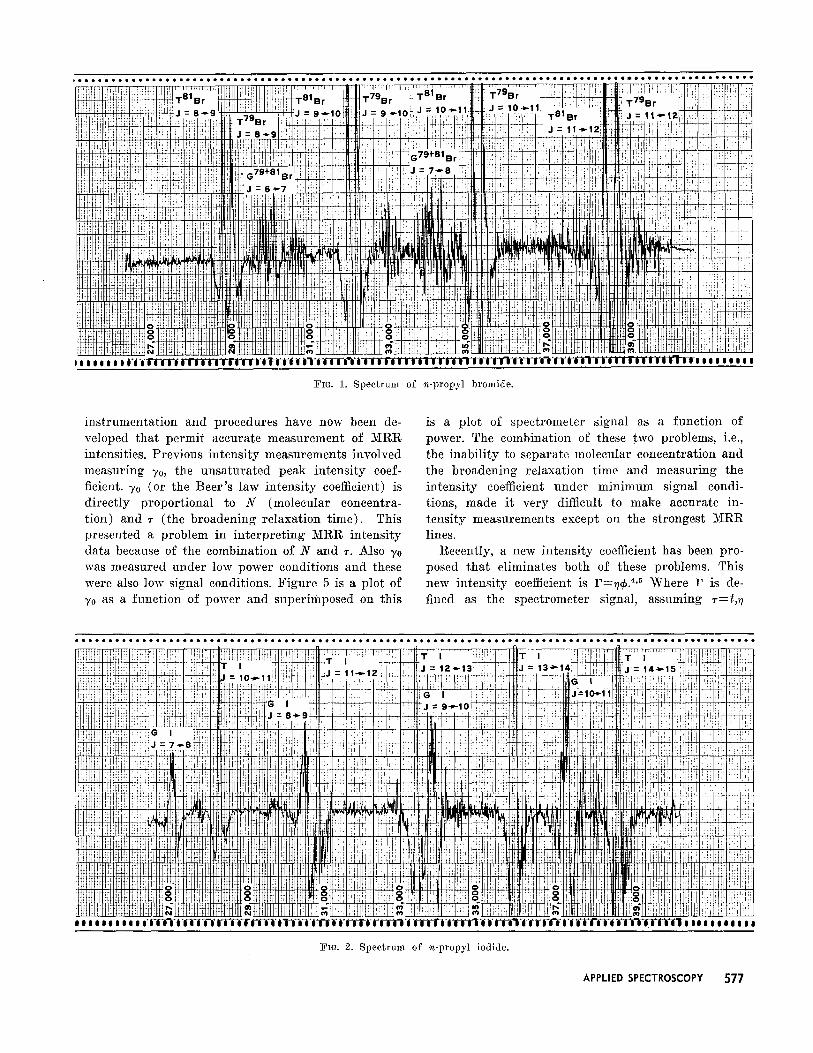
was the assignment of the band sets f rom the normal propyl halides to the trans and gauche isomers. To test this in terpre ta t ion the value of ( B + C ) / 2 de- termined f rom the " b a n d s p e c t r a " can be compared in Table I to the value of ( B + C ) / 2 taken f rom the assigned high resolution MRI~ data. The values also compare to those calculated f rom assumed molecular structures. F igures 1 and 2 are the spectra of n- propyl bromide and n-propyl iodide with the isomers assigned.
The identification of the trans and gauche species in the propyl halide series has been extended to the hexyl halides. Work is current ly being done to assign each set of bands to a par t icular molecular conformer or rotamer.
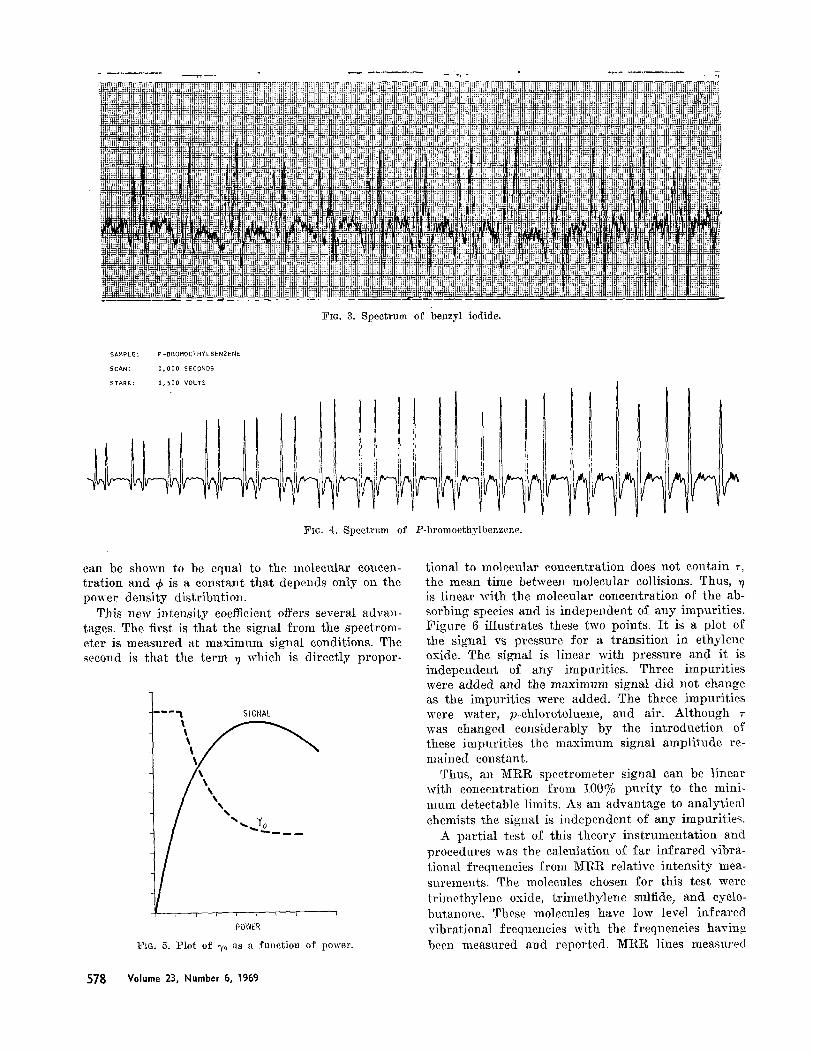
Another type of conformer shown to exist f rom " b a n d s p e c t r a " is i l lustrated by the spectra of ben- zyliodide in Fig. 3. Two sets of bands exist. These are caused by the rotat ion of the benzene group with respect to CH~ I group. Work is current ly being done to assign each band set to a par t icular conformer.
MRR " b a n d s p e c t r a " can indicate the existence of isotopic isomers. F igure 4 is the spect rum of p-bro- moethylbenzene. The spect rum appears to be a series of equally spaced doublets. The first line in the doublet corresponds to the SlBr isotope and the sec- ond line belongs to the 79Br isotope. The rotat ional quantum numbers range f rom a ( J + 1 ) = 2 2 to a ( J + l ) =46.
I t has been observed that a number of these larger molecules do exhibit " b a n d spec t ra" . This in- cludes such molecules as carvone, crotonaldehyde, and m a n y families of molecules such as the mono- substi tuted alkanes, alkenes, benzenes, benzyls, tolu- enes, ethylbenzenes, cyclohexanes, cyclopentanes, and some large inorganic molecules. Current ly the largest molecule observed that has band spectra has a molecu- lar weight of 348.
Molecular constants and conformational informa- tion can be extracted f rom " b a n d spec t ra . " This informat ion can also be calculated f rom an assumed molecular s t ructure and compares well (in most cases) to tha t taken f rom the spectra. This now means that a chemist or spectroscopist can s tudy a family or series of compounds. Fur thermore , it is possible to predict the MRR " b a n d s p e c t r a " of the next molecule in a series or family with good ac- curacy.
The fact tha t molecular s t ructure informat ion can be obtained f rom band spectra and that larger mole- cules can be studied offers the promise of making MRR spectroscopy useful to a larger number of chemists.
I I . I N T E N S I T I E S
One of the factors tha t l imited the development of MRR spectroscopy in both the research and ana- lytical areas was the inabil i ty to make accurate, re- producible, intensi ty measurements. However, theory
576 Volume 23, Number 6, 1969
. . . . . . . . ~ ' ' i l l T ~ : / I : l r . . . . . . . 7 9 ~ . . . . . ..... : ~r~ii~.~-IT Br i:', h ' T Br Br ': ; T Br I ' ' . ;',' ~ ! : i i i . . . . ~ ~ , . _ ^ . . . . . ^ ~ . - . . . ^ L J = 1 0 " , . - 1 1 H J - 10"t"11- ~ ' o { ~ T ~ t~:"~'1 I ' , ' i :
J - - o ~ J - - l i i v ~ - le i v - ~ , " - - . . . . . . . . ' ' 7 9 < : ' ' , ~ . . . . . . . T B r ~ J - 1 1 " , " 1 2 , : : ;
I I ' ! ! i ; ' i i : ' : i ' , ' , i t ! ; ; L , : l : ' . . . . ! , . : " i : i ,, ' , , l '. ' i , : ! ' ' : : , '. , ,+i~ . . . : : r+, .. . ,:. , . :. +t t.+., = s - -~ , :. ,. 11:4+11 ' : i i l+' , l : " l lU l , i i l i"q': :Iti.I1.+ ~ . . . . . . . . :.li;i [!I>.i!I'/IIiiHli . . . . . . . . , , . !iH!~+++,i . . . . . +,~ ..... if, l,, " . . . . . / ~ . . . .
ili~ii! i ~ i i i :~i~ ~ i i l i i~ fl~lt ! i i l : : i III . . / ! 1 t l t I : . l t t ~ r i , i ; ~ i : ~ : ~ , I II ' . : ; ' . : ' _ : _ _ ; L _ _ . i i !!!' iii~ ii ii+: ~ 11 :: ,...i t tf iiiil+ttlit,il,T,ttl~ iilil i ,i'! i~,i ~:~.l:l!~ ! i .,lln hl . ,~ i~l$~i , I , [ l l l . l / ~ i:.,,i,,,i!,,,,;ilti, I , i l i l i l l i l ,ttt, l l ihititl , ~!i . : :
i i ! ~ g i ~ 7~ i '~fittt t '.~tPlt~ tlfttt ~ .:!: i i.J' 'Ill ~Ptt !I:tUIl.III,tI.171!i; i ~ I~!t1:~ !:.'li'.l~tlll:lilt,tt!!ll~i i 7 : . ~ ~i:~: ; ' ~ :', , L~' r I 1 - ~ , ! t.~ . : i ~ ,dt~f,t,l~l.tt .ll, It ~ t l , h . . . . : . Lt~II ~. ,, I . . . . . :1 I f !111ll , , ,. r, I. t7 1,11,1fill . . . . ~ . . . . . . ,, 1_ .
1 . . . . i : 7 ' , i . . . . . . . . . i
.tt! i , L , I , , to ; Ht!I7 lttftttt!ttl,tlmo :~ ,l~ :~o t,~..;I :i,:.1::1:~11I~,~., ,: . , :o,! ! ! !!!!!!!!!!.,,{!!{!o. , t, l l l ,~ , ~:, :
!!!, !d! ,,, ~ l!,t~,, ,~aiGtNfitt~ IttttttLfHtlf,tlt,ll]llt~ • ,;:, ,,. IJJ,l ~ ,~ ~ i.l,, :J, I ,:[,~ I, ~; tl,,,, [,, ,,, ,,, ~t!,, ~,!Ntlt!IiII,If~IIt~..N 1,1, hti,t_l,t t1,t . . . . . . . . . . . . . i I I I I I I i l ' i i ' i ' i i i [ i l i i i i i i i i i i i i i i [ i i - I i i i i l ' l l ' i i i i i - i i i i i i i i i i i ~ i i i i i i i i ' l P l - i i i i i i i i i i i i i i i i l I I I i i I I I i I I I I I •
F I G . ] . S p e c t r u m
instrumentat ion and procedures have now been de- veloped that permit accurate measurement of MRI~ intensities. Previous intensity measurements involved measuring 7o, the unsa tura ted peak intensi ty coef- ficient. 70 (or the Beer ' s law intensi ty coefficient) is directly proport ional to N (molecular concentra- tion) and r (the broadening relaxation t ime). This presented a problem in in terpre t ing MI~I~ intensi ty data because of the combination of N and r. Also 7o was measured under low power conditions and these were also low signal conditions. F igure 5 is a plot of 7o as a function of power and superimposed on this
of n-propyl bromide.
is a plot of spectrometer signal as a function of power. The combination of these two problems, i.e., the inabili ty to separate molecular concentration and the broadening relaxation time and measuring the intensity coefficient under min imum signal condi- tions, made it very difficult to make accurate in- tensity measurements except on the strongest MRR lines.
l~ecently, a new intensi ty coefficient has been pro- posed that eliminates both of these problems. This new intensi ty coefficient is FF=~7@. ~,~ Where F is de- fined as the spectrometer signal, assuming r=t,~ 7
: i , , " ' ,~' , i i ! ' , , F , ; : , ' ; " ! - • : ' ' • I~.~_~ ' ' • , : ' : : ; , : ~! : i ! ; i : i ; : :
Ti J 7 - . . - 8 , , ~ ~ i ~ I ~ [
! i i : : i ' . ! 7 1 7 7 r i i l I N 7 !ill I l l !: : ~:: ~' ', , I P l ~ : ' t, '~ ~I , : ~ ~ [ ; r I ' ~ :
. . . . . . . . L . t . . . . . . . . . . L I tlll~l, , . . . . , . . . . . . . . . . ' l lhli~' '"::' ' " i ~ ; ~ b I l ~ r f - ~ ' " - - - ' [ " ' ' ~ + - - - - - - ~ t l, ,
i'i!t!!,!Hiiiit~Hi~..~ ll;ltitltt!.~lli, llldllliil ititlt~tliLIt ,~!: :.~ :i; :: 711"~;'1:~i:11 77::~: :., i.tl~ttl~ !i, ~ ~;:. i:: ; ! ~f t i . ~ til..t!ill[ ~;; i i ! i i~i ' : l l l i l l l~. l l '~ i ~ 717i711t7tlii 7 il ~ ilt Nil N !t!iiitf!tl !7t Nit~tttttHtttti t t t t t l ! t l t t i t ~ t ~ ,Tf ii17 ii7i !!]: !ii I,!:1~i1~tftlii, i~ ili{ !Ii !!!ttli~ltii ilii!; ~! iii! r'.:. ~ 17i;: i t ~ t~ti ~ ~' i t ' 1 i !! ! , i i i ! : i . . . . ~ :; !7. . . !. t~ il i. i ;' ,..., ~tt7 ,t,~ tl,tt,,+,ilt,~i lftdt,ttltTft, . . . . I I ~.+ ~ . ~ " " ~ " ~ ~:: : : ' " : . . . . . . . ~ ~ . . 1 1 . . . . . ~ h i . , . . . . . . . . . . . . . . . . :!t,,tttflftd,;t',ii.,t< HfNN,fNfttliI~ o , I I ~ :!, .,,...i, r.i i , , ~ :i o ' i i~ i! '~ itil W 7,17 : G :~ + 1 I c l I ' ' : I " t [ I : ' ' ; , i i :, I ~ ' : , i ', I , !: , ' :: ' ;~ t : i ,: ,7tiHIt!,ttL~< :.t,t,iIItlI.IN!f, ~ ~ . .~ ,_~ ..... ,.~.t I . I L : . , ..,....Ih..ll.. ilii . . . . t ,~, , . . . .
It.. t,fN,t.t~tt..N ,thtI~ttltfttNH ,,,Ittilltlfltilllil~ill? . . . . I I . . . . . . . . . t . I :,1 . . . . . . . . , L t.. ~ l l , : , , ....... I I l i i I l l I i ' i i I ' - i ' i ' f i ' i i - ' f i i i i " f i i i " i i i # i i i i - I i i ' i i i i i i i i ' i ' i i i i i i i i i i i ' f i i ' i i ' ~ ' i l i i i - i i ' i i i i - i i i i i i - l i i ' i i ' l ' i i I I i t l I l l t I
FIG. 2. Spectrum of n-propyl iodide.
APPLIED SPECTROSCOPY 577
FIG. 3. Spectrum of benzyl iodide.
SAMPLE: P-BROMOETHYLBENZENE
SCAN: 1,000 SECONDS
STARK: 1,500 VOLTS
FIG. 4. Spectrum of P-bromoethylbenzene.
li I
can be shown to be equal to the molecular concen- t ra t ion and ¢ is a constant tha t depends only on the power density distribution.
This new intensi ty coefficient offers several advan- tages. The first is that the signal f rom the spectrom- eter is measured at maximum signal conditions. The ~econd is tha t the term v which is direct ly propor-
- - ' ' " 1 SIGNAL
\
POWER
FIG. 5. Plot of "yo as a function of power.
tional to molecular concentrat ion does not contain r, the mean time between molecular collisions. Thus, is l inear with the molecular concentrat ion of the ab- sorbing species and is independent of any impurit ies. F igure 6 i l lustrates these two points. I t is a plot of the signal vs pressure for a t ransi t ion in ethylene oxide. The signal is l inear with pressure and it is independent of any impurities. Three impuri t ies were added and the max imum signal did not change as the impuri t ies were added. The three impuri t ies were water, p-ehlorotoluene, and air. Although r was changed considerably by the introduction of these impuri t ies the max imum signal ampli tude re- mained constant.
Thus, an MI~R spectrometer signal can be l inear with concentration f rom 100% pur i ty to the mini- mum detectable limits. As an advantage to analytical chemists the signal is independent of any impurities.
A par t ia l test of this theory ins t rumentat ion and procedures was the calculation of fa r in f ra red vibra- tional frequencies f rom MRR relative intensi ty mea- surements. The molecules chosen for this test were t r imethylene oxide, t r imethylene sulfide, and cyclo- butanone. These molecules have low level inf rared vibrat ional frequencies with the frequencies havin~' been measured and reported. MRR lines measured
578 Volume 23, Number 6, 1969
in these molecules have the same rotational quantum numbers but are in different vibrat ional energy levels. Assuming a Bol tzmann distribution and con- sidering an appropr ia te spin statistic factor, the fa r inf rared frequencies can be calculated f rom MRR intensity measurements. These are listed in Table I I and can be compared to the fa r in f ra red frequencies reported. The agreement between the two is excellent.
The use of intensities for conformational analysis was demonstrated in measuring the axial-equatorial ratio of fluroeyclohexane. The average AE value for the molecule was 259±25 cal/mole with the equatorial form being more stable.
An example of the MRR spectroscopy intensity measurements for the quant i ta t ive determinations in a mixture was presented by Dr. Rineheart of the Universi ty of Wyoming at the 1968 meeting of the American Chemical Society in San Francisco. He was able to show that he could accurately measure the concentration of methanol in mixtures to bet ter than 0.2%.
MRR spectroscopy is a potential ly useful analytical device for air-pollution studies. Fo r example: the minimum detectable limit of SOe is on the order of 20 ppb and the signal is l inear f rom this minimum detectable limit to 100% concentration. Other pol- lutants would give similar results as these are gen- erally small polar molecules which have strong MRR absorption lines. Because of the inherent specificity and narrow lines (<5 ~ H z wide) of these small molecules, purification would not be required for quanti tat ive measurement.
III. CONCLUSION
The above applications are only a small sampling of the applications of MRI~ spectroscopy to chemis- try. For more details on the problems tha t have been solved, the reader is refer red to the texts listed at the end of this article and to many of the publica- tions that have appeared in ~ournals such as Journal of Chemical Physics, Journal of the American Chemi- cal Society, and Journal of Molecular Spectroscopy,
o o>
480
440
400
360
320
280-
240-
200-
150- 120 -
80
40
0
AIR
/ p-CHLOROTOLUENE
~ / WATER
/ IO 20 30 40 .50 60 0 80 0
PRESSURE (MICRONS Hg)
FIG. 6. P l o t o r s i g n a l v s p o w e r .
Table II. Intensities.
T R I M E T H Y L E N E OXIDE
V i b r a t i o n a l In tens i ty F a r IR L e v e l s M e a s u r e m e n t
0 - 1 55 ± 7 (cm -1) 5 3 . 4 (cm -1)
1 - 2 93 ± 7 8 9 . 9
2 - 3 110 ± 7 104 .7
3 - 4 119 ± 7 118 .2
TRIME T H Y L E N E SULFIDE
V i b r a t i o n a l In tens i ty F a r IR L e v e l s M e a s u r e m e n t
0 - 1 - 1 ± 9 (cm -1) . 275 (cm -1)
0 - 2 134 ± 7 138 .5
0 - 3 146 ± 7 151.0
0 - 4 228 ± 4 2 2 6 . 7
CYCLOBUTANONE
v = l , v = 0 , E n e r g y D i f f e r e n c e
t I Summary Transition AE (dB) I
I A v e r a g e = - 1 . 4 1 ~ 0 . 3 9 dB 110-211 -1.52 i
202 -303 - 1 . 8 7 J F a r IR = - 1 . 4 4 dB
l 221 -322 - 1 . 3 2 I A v e r a g e = 3 3 . 6 ± 9 cm - I
1 220 -321 - 0 . 9 3 J F a r IR = 3 4 . 3 • 0 . 6 cm - I
to name a few. Chemists of all types are beginning to express interest in MRR spectroscopy now that many of the ins t rumentat ion and procedure problems have been solved. I t certainly appears tha t MRR spec- troscopy is on the verge of becoming the useful lab- oratory ins t rument so often forecasted by earlier researchers.
APPENDIX
Instrumentation
Measuring the frequency, line width, and the in- tensity of an MRI~ absorption line puts s t r ingent requirements on the design and construction of an MRR spectrometer. The spectrometer must have both high resolution and broadband capability. This is because small molecules typical ly have narrow lines in the order of a few MHz, whereas larger molecules have typical ly broad lines (10-200 MHz) . The energy absorbed by the molecule is generally small and thus modulation techniques are used to detect these ab- sorptions. With most MRR spectrometers as well as the t I P spectrometer, Stark modulation and phase- sensitive detection are used. This means the spec- t rometer has an inherent ly nar row bandwidth. The use of narrow bandwidths places requirements on the sources residual F M and CW stabili ty as well as the gain and noise in the entire spectrometer system. As the author is more famil iar with the t I P spec- trometer, this will be the one most generally described.
APPLIED SPECTROSCOPY 579
STARK VOLTAGE CONNECTOR ~ ' ~ "
I
~ % "~:#.J/ VACUUM PORT
\
PIG. 7. S ta rk cell.
The source used in the spectrometer is a backward wave oscillator which is phase-stabilized to provide low residual FM and good cw frequency stability. I t can be swept over any pa r t or all of a waveguide frequency band. This source is power leveled and direct f requency readout of the microwave frequency is provided. Frequency markers are placed on the recording chart as the f requency is swept. Tradit ion- ally, spectrometers have employed klystrons ra ther than backward wave oscillators as a f requency source. The advantage of using backward wave oscillators is that they can be swept over entire waveguide fre-
queney bands permi t t ing the observation of band spectra and that only four are needed to cover the four waveguide bands between 8.2 and 40 GHz.
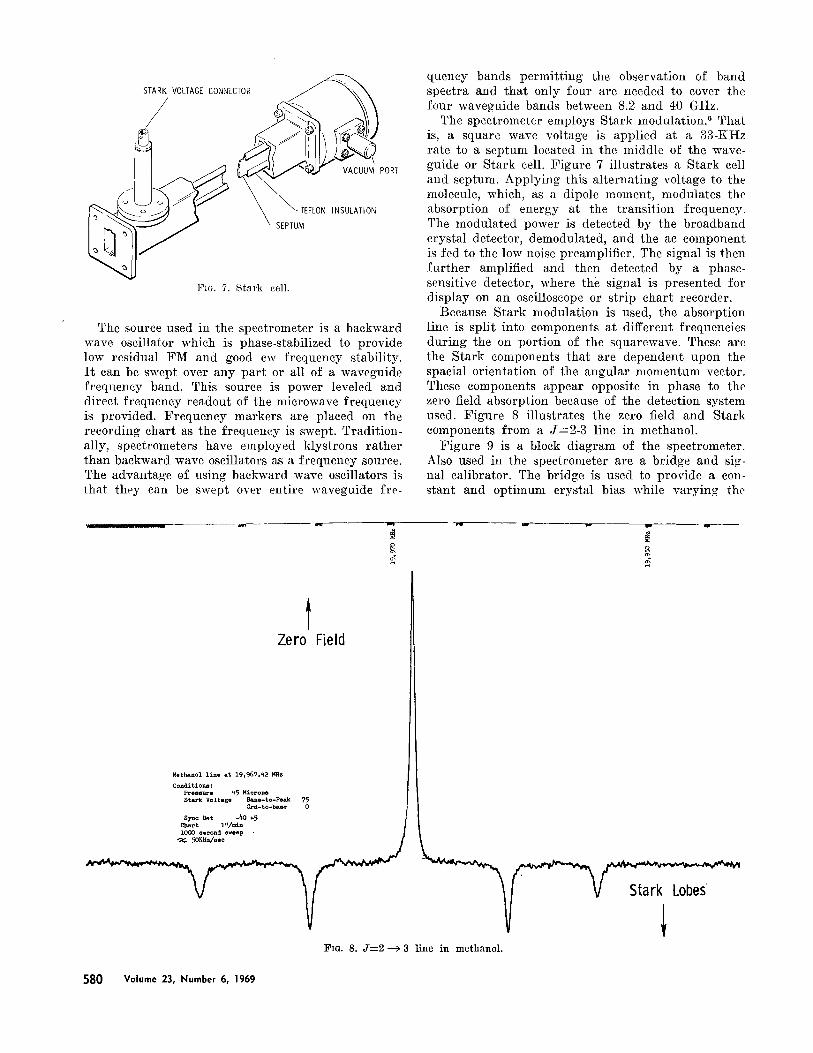
The spectrometer employs Stark modulation. 6 Tha t is, a square wave voltage is applied at a 33-KHz rate to a septum located in the middle of the wave- guide or Stark cell. F igure 7 i l lustrates a Stark cell and septum. Apply ing this a l te rnat ing voltage to the molecule, which, as a dipole moment, modulates the absorption of energy at the t ransi t ion frequency. The modulated power is detected by the broadband crystal detector, demodulated, and the ae component is fed to the low noise preamplifier. The signal is then fu r the r amplified and then detected by a phase- sensitive detector, where the signal is presented for display on an oscilloscope or str ip chart recorder.
Because Stark modulat ion is used, the absorption line is spli t into components at different frequencies dur ing the on port ion of the squarewave. These are the Stark components that are dependent upon the spat ia l orientation of the angular momentum vector. These components appear opposite in phase to the zero field absorption because of the detection system used. F igure 8 illustrates the zero field and Stark components f rom a J = 2 - 3 line in methanol.
F igure 9 is a block d iagram of the spectrometer. Also used in the spectrometer arc a bridge and sig- nal calibrator. The bridge is used to provide a con- stant and opt imum crystal bias while vary ing the
Zero
Methanol line at 19,~7.42 m s
ConditionB: F r e a s u r e 45 M i c r o n s S t a r k V o l t a g e Base-to-Peak 75
G r d - t o - b a e e O Sync Det -40 +5
Chart l"/min lO00 s e c o n d s w e e p •
~,~ 50KHz/eec
Field
FIG. 8. J = 2 ~ 3 l ine in methanol .
580 Volume 23, Number 6, 1969
FIG. 9. 3~icrowave spectrometer block diagram.
mic rowave power in to the S t a r k cell. This is used fo r i n t e n s i t y measu remen t s to d e t e r m i n e the m a x i m u m s igna l f rom the l ine.
The s igna l c a l i b r a t o r is a P I N diode t h a t modu- la tes the smal l a m o u n t of mic rowave power pa s s ing t h r o u g h the a r m at the same f r e q u e n c y as the S t a r k - m o d u l a t i o n f r equency . Us ing the phase sh i f t e r the m o d u l a t e d power is a d d e d back in the p r o p e r phase
into the S ta rk -ce l l a r m of the spec t romete r . The am- p l i tude of th is s igna l can be c a l i b r a t e d a n d p r o v i d e s a means of ob t a in ing an abso lu te c a l i b r a t i o n on the a m o u n t of power abso rbed f r o m a t r a n s i t i o n in a molecule. The s igna l c a l i b r a t o r is g e n e r a l l y swi tched ~m a f t e r a S t a r k m o d u l a t e d m e a s u r e m e n t of the l ine.
1. NBS monograph, "Microwave Spectral Tables," :No. 70, Vo]. V.
2. Y. Hironaka, K. Hirota, E. Hirota, Tetrahedron Letters 22, 2437 (1966).
3. E. tIirot% J. Chem. Phys. 37, 283 (1962). 4. /L W. /-Iarrington, J. Chem. phys. 46, 3698 (1967). 5. H. W. Harrington, J. Chem. Phys. 49, 3023 (1968). 6. R. ~. Hughes and E. B. Wilson, Jr., Phys. Rev. 71, 562
(1947).
Suggested Reading
1. T. M. Sugden and C. N. l~enney, Microwave Spectroscopy of Gases (D. Van Nostrand Co., Princeton, N. J., 1965).
2. James E. Wo]lrab, Rotational Spectra and Molecular Struc- ture (Academic Press Inc., New York, 1967).
3. A. Sehalow and C. It. Townes, Microwave Spectroscopy (McGraw-Hill Book Co., ~ew York, 1955).