Page 1
ISSN 0503-1265. Ukr. J. Phys. 2006. V. 51, N 4, pp. 339-345
MOLECULAR STRUCTURE AND ELECTROPHYSICAL PROPERTIES OF PENTACENE THIODERIVATIVES
M.P. GORISHNYI
UDC 535.343.2;535.343.3;537.311.322;537.312.5
Institute of Physics, Nat. Acad. of Sci. of Ukraine
(46, Nauky Ave., Kyiv 03028, Ukraine; e-mail: [email protected] )
Possible conformations of the thioderivatives of pentacene (Pn) have been considered. The absorption spectra of
polythiopentacene (PTPn) solutions and films have been studied. PTPn is revealed to be a mixture of Pn thioderivatives
with different numbers of S atoms. After this mixture having been condensed in vacuum onto quartz substrates, its main
components are tetrathiopentacene (TTPn) and hexathiopentacene (HTPn). The position of the maximum in the long-
wave absorption bands of Pn thioderivatives is a linear function of the number of valence electrons in S atoms, which take
part in the conjugation with the π-system of the pentacene frame of PTPn molecules. The analysis of the photocurrent
and capacitor photovoltage (CPV) spectra in the range of the first electron transitions in PTPn has shown that the
photoconductivity is of the hole type and is caused by the dissociation of excitons at the electron capture centers. The
frontal CPV is caused by the Dember photovoltage (ϕD ), and the back one by the surface-barrier photovoltage (ϕb ).
1. Introduction
The thioderivatives of linear polyacenes have been synthesized for the first time in [1, 2]. The scientific interest in
studying their properties is stimulated by the rather low electric resistance of tetrathiotetracene (TTT), as compared to
that of organic materials [3]. Later on, it has been discovered that tetraselenotetracene (TSeT) and hexathiohexacene
(HTH) possess the resistance of the same order (ρ(300 K) = 102 Ω × m) *4+.
TTT has been studied the best [5, 6]. This substance and its isostructural analog TSeT belong to strong electron donors.
On their basis, ion-radical salts with high conductivity have been synthesized; some of the latter reveal the metal
conductivity in a wide range of temperatures [7, 8]. Nevertheless, the efficiency of the conversion of light energy into
electric one, making use of TTT-based thin-film heterostructures, is low, which is caused by the low photosensitivity of
this compound [9].
Among the linear polyacenes, which have been studied, high-resistance pentacene reveals rather high photosensitivity
[10]. It forms thioderivatives with different numbers of S atoms. The photovoltaic and optical properties of the mixture of
those thioderivatives (hereafter, PTPn) have been studied in [11]. The most probable components of PTPn are TTPn and
HTPn. The nature of their long-wave absorption bands has been established in [12]. The photovoltaic properties of HTPn-
based thin-film heterostructures have been studied in [13]. HTPn served as a basis for fabricating the field transistors [14].
In work [13], the purity degree of HTPn under investigation has not been discussed, and its photovoltaic properties
have not been studied enough. This problem is challenging from the viewpoint of searching for new photosensitive
organic materials with relatively low dark electroconductivity. Thioderivatives of pentacene with different numbers of S
atoms can be characterized by different values of this parameter.
In this work, an attempt has been made to isolate the PTPn components and to study the properties of this substance
in more detail.
2. Synthesis of Pentacene Thioderivatives and Experimental Method
Pentacene thioderivatives were synthesized by Doctor L. Libera at the Supreme Polytechnic School in Chemnitz
(Germany). The mixture of pentacene and sulfur was heated up in trichlorobenzene. The solution quickly became green.
The reaction was supervised by
339
ISSN 0503-1265. Ukr. J. Phys. 2006. V. 51, N 4
Page 2
the disappearance of the colors of initial substances. The crystals formed were dried in vacuum and washed out in
alcohol. The chemical analysis of the final substance showed that the content of sulfur in it was 36.5%, i.e. an
intermediate value between those in stoichiometric TTPn (31.6%) and HTPn (41.4%). Relying on these data, the substance
obtained was identified as PTPn [12].
In the second case, the synthesis was carried out following the technique, according to which the substance obtained
was additionally purified through its recrystallization from a solution in nitrobenzene. Chemical analysis showed that the
content of sulfur in the final substance was close to that in stoichiometric HTPn.
PTPn and HTPn films were fabricated by thermal sputtering of the relevant substance in vacuum of 6×10⁻⁴
Pa onto
quartz substrates at room temperature. The film thickness was measured making use of an MII-4 microscope, while the
film thickness variation in the course of sputtering and the sputtering rate were determined by an MSV-1841 thickness
indicator.
Specimens were illuminated with a halogen incandescent lamp either directly or through an SPM-2 monochromator.
The power of the incident fixed light was measured making use of a PTH-20C thermopile, and that of the incident
modulated light by a pyrometer with sensitivities of 0.83 and 250 V/W, respectively. The resistance of surface cells in
darkness and under illumination was determined with the help of a P4053 direct current bridge. These data, after
recalculation, were used to obtain the photocurrent spectra.
The measurements of CPV was carried on in a capacitor cell, where PTPn and HTPn films were deposited onto a quartz
substrate with a conducting layer of SnO2 and isolated from a similar substrate by a transparent dielectric Teflon film 10
µm in thickness. The cell capacitance was 150 − 200 pF. The cell was illuminated with light modulated with a frequency of
72 Hz.
If the photoresponse of the capacitor cell is sinusoidal, one may examine its equivalent electric circuits (series and
parallel) in order to determine the effective input resistance and capacitance of the amplifier in the first cascade of the
installation. This is a rough approximation, but it allows one to estimate the orders of magnitude of these parameters.
The SnO2 electrodes were found quasi-Ohmic for Pn thioderivatives. In the first approximation, their resistances and
capacitances are neglected. Then, the cell is a series circuit composed of the resistance of the PTPn or HTPn layer and the
reactance of the capacitor that is formed by the free PTPn (HTPn) surface, the Teflon layer, and the SnO2 electrode. For a
560-nm PTPn film, a 200-pF capacitor, and at the 72-Hz modulation frequency, the calculated values of these parameters
for a cell are as follows: the resistance R = 50 MΩ, the reactance X = 11 MΩ, and the impedance Z = 51 MΩ. If the series
circuit is replaced by a parallel one, the parameters of the latter will be functions of the cyclic frequency ω. Their
calculated values, provided Z = const, are as follows: R(ω) = 52.5 MΩ and C (ω) = 9.3 pF. Therefore, the following relations
are valid: R(ω) ≈ R and C (ω) ї C . The obtained values of R(ω) and C (ω) were taken into account while designing the
amplifier block of the installation in order to ensure the regime of measuring the CPV.
A cathode follower with compensation of the input capacitance [15] was used as the input stage. The effective input
resistance of the installation was not lower than 1 GΩ, with the input capacitance C ≤ 1 pF. After preamplification, the
signal was registered by an UPI-1 selective phase-sensitive amplifier. The photocurrent and CPV spectra were recalculated
to the identical power of the incident light.
The absorption spectra of PTPn and HTPn solutions and films were recorded making use of a Hitachi double- beam
spectrometer, provided a spectral slit width of 2 nm and at room temperature.
3. Discussion of the Results Obtained
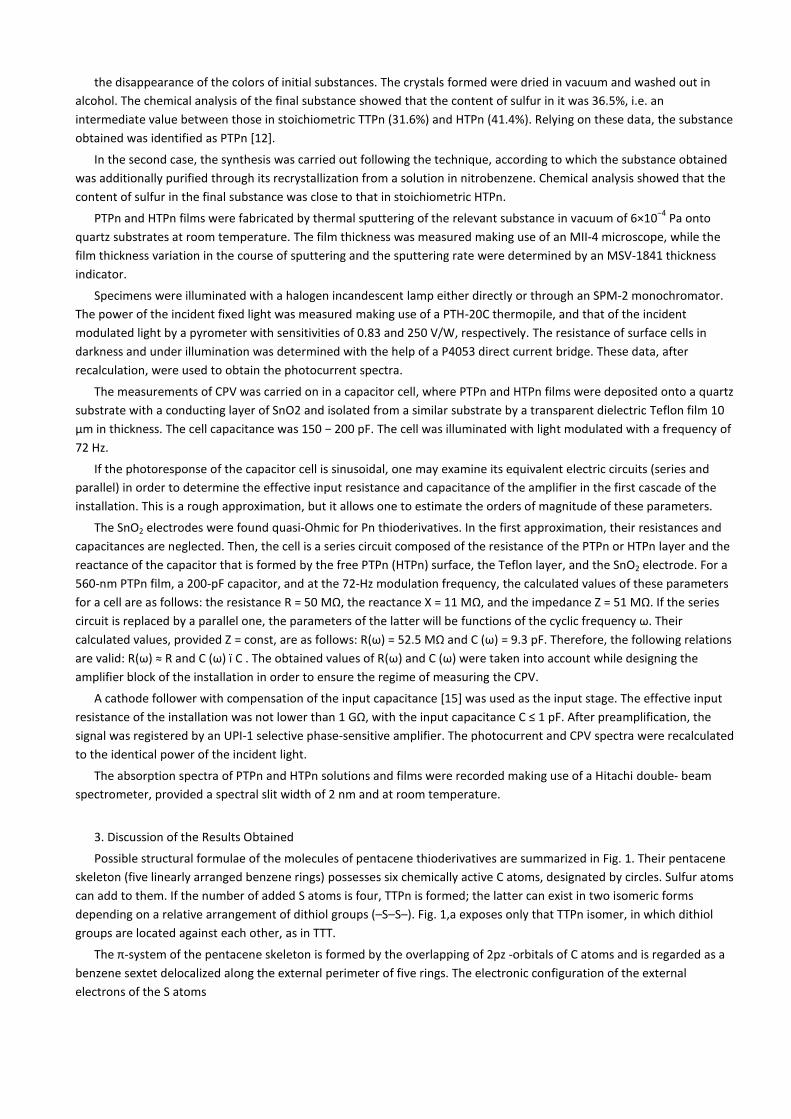
Possible structural formulae of the molecules of pentacene thioderivatives are summarized in Fig. 1. Their pentacene
skeleton (five linearly arranged benzene rings) possesses six chemically active C atoms, designated by circles. Sulfur atoms
can add to them. If the number of added S atoms is four, TTPn is formed; the latter can exist in two isomeric forms
depending on a relative arrangement of dithiol groups (–S–S–). Fig. 1,a exposes only that TTPn isomer, in which dithiol
groups are located against each other, as in TTT.
The π-system of the pentacene skeleton is formed by the overlapping of 2pz -orbitals of C atoms and is regarded as a
benzene sextet delocalized along the external perimeter of five rings. The electronic configuration of the external
electrons of the S atoms
Page 3
Fig. 1. Structural formulae of TTPn (a ) and HTPn (b and c) molecules
looks like 3S2 3P
4 . According to such a structure, ς- bonds of the dithiol groups are formed by 3px- and 3py -orbitals.
3pz -orbitals of coupled electrons are orthogonal to the pentacene skeleton plane and may overlap with 2pz-orbitals of
chemically active C atoms, so that the π- system of the TTPn molecule changes its own geometry and the number of
delocalized electrons.
After having added four S atoms, the TTPn molecule still holds two free chemically active C atoms. If S atoms form
double bonds with them (thione groups>C=S), there appears the first modification of the HTPn molecule (Fig. 1,b) which
can exist in two isomeric forms. In Fig. 1,c, another possible modification of the HTPn molecule, which has only one
isomeric form, is displayed. By its configuration, it is close to the coronene molecule and is considered more probable.
The characteristic feature of this modification is the availability of two central quadrivalent S atoms. This is possible in the
case where one of the coupled 3px - electrons moves to 3dx2 -orbital.
In addition to TTPn and HTPn, other Pn thioderivatives can be formed, e.g., dithiopentacene (DTPn) with either a
dithiol group or two thione groups, as in the case of tetracene thioderivatives [4].
The total number of 3pz -electrons in S atoms, which can participate in the conjugation with the π-system of the Pn
skeleton (the meso-size effect), amounts to 10 or 8 for all HTPn or TTPn modifications, respectively. Of those electrons,
the S atoms of each dithiol group supply two and the S atom of each thione group one electron. In DTPn molecules with a
dithiol or two thione groups, the meso-size effect is created by four or two electrons, respectively, of the S atoms.
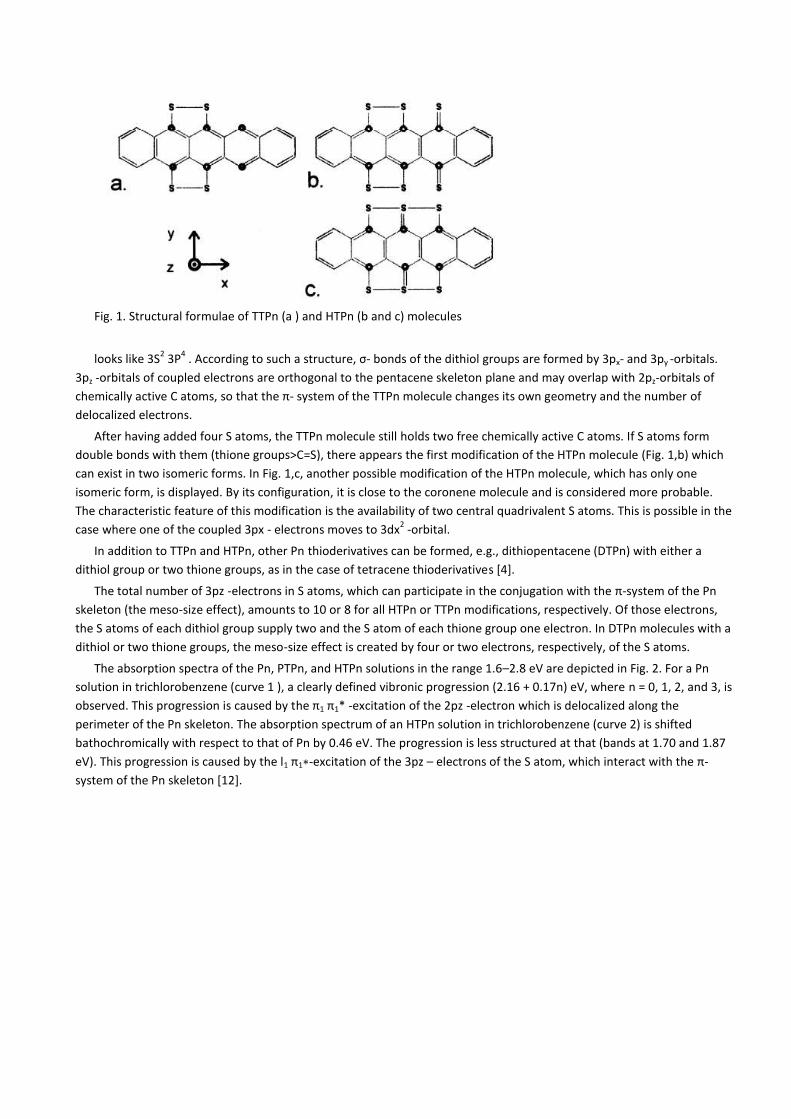
The absorption spectra of the Pn, PTPn, and HTPn solutions in the range 1.6–2.8 eV are depicted in Fig. 2. For a Pn
solution in trichlorobenzene (curve 1 ), a clearly defined vibronic progression (2.16 + 0.17n) eV, where n = 0, 1, 2, and 3, is
observed. This progression is caused by the π1 π1* -excitation of the 2pz -electron which is delocalized along the
perimeter of the Pn skeleton. The absorption spectrum of an HTPn solution in trichlorobenzene (curve 2) is shifted
bathochromically with respect to that of Pn by 0.46 eV. The progression is less structured at that (bands at 1.70 and 1.87
eV). This progression is caused by the l1 π1∗-excitation of the 3pz – electrons of the S atom, which interact with the π-
system of the Pn skeleton [12].
Page 4
Fig. 2. Absorption spectra of Pn (curve 1, C = 4.0 × 10⁻⁶
mol/l) and HTPn (curve 2, C = 1.0 × 10⁻⁵
mol/l) solutions in
trichlorobenzene; and of PTPn in benzene (curve 3, C = 5.4 ×10⁻⁶
mol/l), trichlorobenzene (curve 4, C = 1.2 × 10⁻⁵
mol/l),
and DMFA (curve 5, C = 1.4 × 10⁻⁵
mol/l)
A shoulder of 1.75-1.80 eV on the short-wave slope of the most intensive HTPn band evidences for the existence of
another band. The analysis carried out in the Gaussian approximation showed that the maximum of the latter lies at 1.77
eV, as in the case of the absorption spectrum of a PTPn solution in dimethylformamide (DMFA) (curve 5 ). By position, it
coincides with the l1 π1∗-excitation bands of TTT and TSeT molecules [16].
The analysis of the long-wave absorption of PTPn solutions in benzene (curve 3 ) and trichlorobenzene (curve 4)
carried out in the Gaussian approximation showed that the corresponding spectra consist of two bands each with maxima
at 1.70 and 1.77 eV. Since these bands are observable for all solutions listed above, they may be considered characteristic
of HTPn and TTPn, respectively. For PTPn, the relation between the peak intensities of these bands is not identical for
various
341
ISSN 0503-1265. Ukr. J. Phys. 2006. V. 51, N 4
Page 5
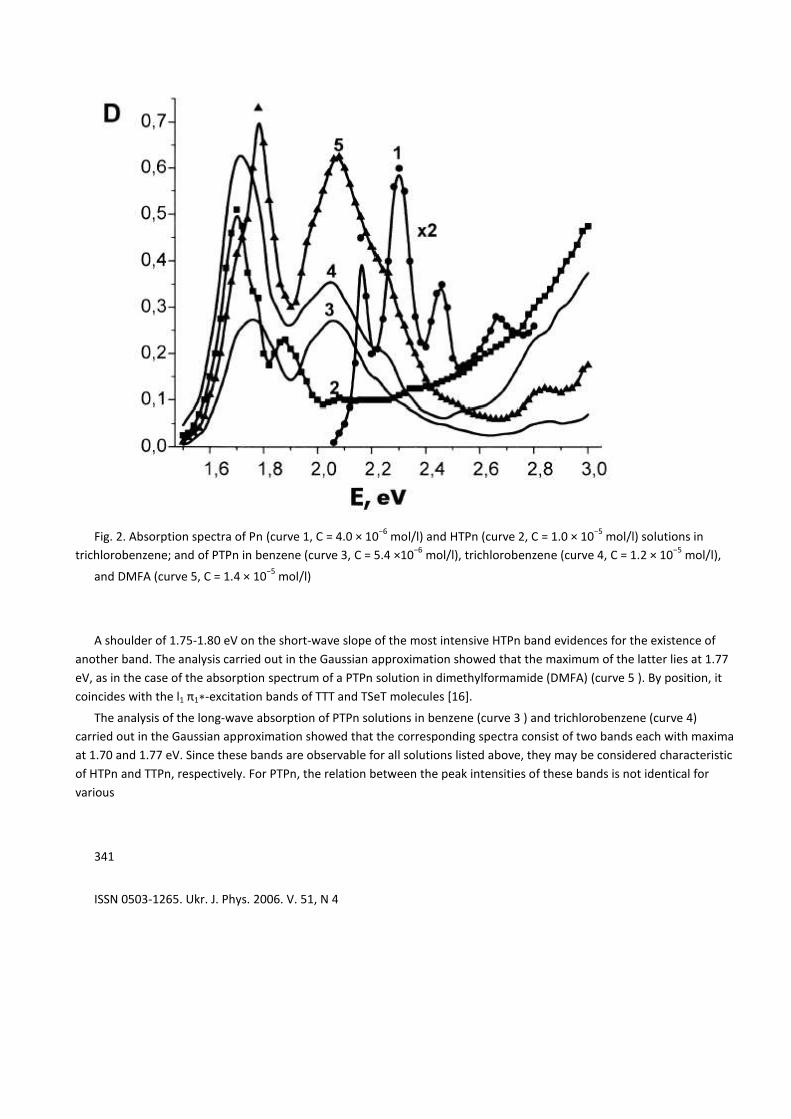
Fig. 3. Absorption spectra of HTPn (PTPn1) 100-nm films on quartz substrates (curves 1 to 4), a Pn 400-nm film (curve
5 ) [17], and a HTPn solution in trichlorobenzene (curve 6 )
solvents, which evidences for the inhomogeneity of this substance or the different solubilities of HTPn and TTPn.
Moreover, a wide band at 2.07 eV is observed in PTPn spectra, being of low intensity in HTPn ones. Pentacene cannot be
responsible for it, because the vibrating structure of this band is practically not pronounced, i.e. this band is caused by the
excitation of the external electrons of S atoms. Most probably, this is a characteristic absorption band of DTPn with two
thione groups. In this case, the bathochromic shifts of the characteristic absorption bands of HTPn, TTPn, and DTPn
molecules, being accounted for one 3pz -electron of S atoms, are identical and equal to (0.045 ± 0.001) eV. This means
that the bathochromic shift of long-wave absorption bands is described by a linear function of the number of external
electrons of S atoms which take part in the conjugation. On this basis, we may assume that the 1.94-eV band is caused by
the absorption of either DTPn with one dithiol or TTPn with four thione groups; it may also be a vibration duplicate of the
1.77- eV band of TTPn with two dithiol groups (coined as TTPn below).
Thus, the analysis of the absorption spectra of PTPn and HTPn solutions showed that, despite the synthesis scenario,
the substances synthesized are the mixtures of Pn thioderivatives, whose main components are TTPn and HTPn. Is it
possible to isolate these components? Some information can be obtained by monitoring the process of deposition of the
corresponding films onto quartz substrates.
Figure 3 exposes the absorption spectra of four HTPn films, 100 nm in thickness each, in the range 1.50 − 2.50 eV. The
films were deposited consistently after one another onto different substrates in the continuous process of sputtering
using a mask switch. In every position of the switch, only one substrate was open for sputtering, while the other three
were closed. After the first substrate having been sputtered, the second substrate was subjected to sputtering, then the
third, and at last the fourth one. The analysis of the spectrum of the first deposited film (curve 1 ) showed that the
contents of HTPn and TTPn in it, which were estimated by the peak intensities of the 1.66- and 1.77- eV bands,
respectively, were approximately identical. In the next film (curve 2 ), TTPn prevailed. The ratios between the contents of
these components in two last films (curves 3 and 4 ) were the same as in the initial one.
Page 6
Therefore, the ratio between HTPn and TTPn in the films changes in the course of sputtering. Although, before
sputtering, TTPn was only an impurity in the ultimately synthesized substance identified as HTPn (curve 6 and the right
ordinate axis), some portion of HTPn molecules of modification b (Fig. 1) turns into TTPn ones in the course of
sublimation, because they lose their thione groups. So that, in the mixture condensed on quartz substrates, the ratio
between those components is close to 1:1 or TTPn prevails. We designate this mixture as PTPn1 .
It was found that the absorption spectra of PTPn and PTPn1 films are not identical in the range 1.80 − 2.00 eV. The
PTPn spectral curve is located above, which evidences for a higher impurity concentration. After sublimation, the
intensity of the PTPn band at 2.07 eV becomes considerably lower. This means that the third component, DTPn, decays at
heating.
The bathochromic shift of the long-wave absorption bands of PTPn and PTPn1 films with respect to the spectra of the
corresponding solutions amounts to 0.04 eV. It characterizes a change of the term of dispersive interaction between the
molecules of these substances, when they become excited. In comparison with the Pn case, this change is five times
smaller. The Davydov splitting of the bands is not observed in PTPn and PTPn1 films. For Pn crystals [17] and
polycrystalline Pn films (Fig. 3, curve 5 ), the amplitude of this splitting is 0.13 eV.
There are no X-ray and electron-microscopy data for PTPn and PTPn1 films. The structure of these films can be
polycrystalline, as in TTT and TSeT ones [6, 8]. In the latter substances, provided the room temperature of a substrate,
round (0.1 − 0.15 µm) and needle-shaped (0.5 − 0.7 µm) crystallites are formed. The peculiarity of this structure is the
availability of densely packed piles
342
ISSN 0503-1265. Ukr. J. Phys. 2006. V. 51, N 4
Page 7
Fig. 4. Absorption spectra of HTPn (PTPn1 ) and Pn films. The notations are the same as in Fig. 3
of molecules, where 3p-orbitals of the S atoms of neighbor molecules are overlapped. The calculation showed that the
Davydov splitting is equal to 0.006 eV [9]. It is hard to observe this phenomenon experimentally. The contour shape of the
long-wave absorption bands of TTT and TSeT films is basically determined by the deformation of dithiol groups.
In Fig. 4, the absorption spectra of Pn and PTPn1 films in the range 2.50−5.70 eV are exhibited. According to work *18+,
the energies of the second and third singlet transitions in Pn are 3.05 and 3.32 eV, respectively. The analysis of the
absorption spectrum of the Pn film (curve 5 ) shows that these transitions are forbidden. One may assume that they are
allowed in the spectra of PTPn1 and PTPn films. The band at 2.62 eV is observed in the absorption spectra of TTT and TSeT
films. It is causedby the l1 π1∗-excitation of 3pz -electrons of S atoms [16] and is the same in the spectra of PTPn and
PTPn1 films. In the range 3.90 − 5.70 eV, the absorption bandsof PTPn, Pn, and PTPn1 are determined by the electron
transitions from lower-located occupied levels. In the PTPn and PTPn1 cases, those levels may include both lπ∗- and ππ∗-
states.
The dark resistance of PTPn1 was measured in the cells of the surface and sandwich types. The surface cells were
fabricated by the consecutive sputtering, in vacuum, of raster silver electrodes and 1-µm PTPn1 films onto quartz
substrates. The distance between the electrodes was 0.2 mm. The specific resistance obtained was 109 Ω × m. In
sandwich cells, SnO2 and silver layers served as the lower and upper electrodes, respectively.
Page 8
Fig. 5. Various spectra of PTPn films, 560 nm in thickness each: absorption (1 ); CPV (ϕ) under frontal (2 ) and back (3 )
modulated illumination; photocurrent Iph (4 ) and quantum efficiency β (5 ) under fixed illumination
The design of the cell allowed the resistance of the silver layer to be monitored. The PTPn1 layer was found to give the
main contribution to the effective resistance of the cell. The resistance of the PTPn1 layer was determined on the linear
section of the current-voltage characteristics. It comprised 1010
Ω × m, which coincides with the HTPn resistance [4]. The
resistance of PTPn films was found to be of the same order as that of PTPn1 films.
The spectra of absorption, CPV, photocurrent Iph , and quantum efficiency β at a fixed current for PTPn films 560 nm
in thickness are presented in Fig. 5. It should be emphasized that the listed spectra were measured for both PTPn and
PTPn1 . In this work, we presented the data only for PTPn. The results of their analysis are also valid for PTPn1 .
The CPV (curve 2 ) and absorption (curve 1 ) spectra correlate in the range 1.30 − 2.55 eV, when illuminating the free
surface of PTPn through the frontal SnO2 electrode and the Teflon film. In so doing, the free surface becomes charged
negatively, while the electrode, owing to electrostatic induction, positively. The illumination through the back electrode
does not change the CPV sign, but makes its peak intensities an order of magnitude lower in comparison with those for
the frontal CPV (curve 3 ). The analysis showed that the long-wave structural portion of the back CPV spectrum consists of
three bands with maxima at 1.54, 1.68, and 1.77 eV. The 1.54-eV band, by its position, coincides with that in the
photocurrent spectrum (curve 4, the
343
ISSN 0503-1265. Ukr. J. Phys. 2006. V. 51, N 4
Page 9
right ordinate axis); the latter anticorrelates with the absorption spectrum of PTPn.
The magnitude of the quantum efficiency β(E) (curve 5, the right ordinate axis) was estimated by the formula
β (E) = Iph E / eP (1 − exp (−kd)) , (1)
where Iph is the photocurrent, E the energy of photons, e = 1.6 × 10⁻¹⁹
C, P is the light flux power, k the absorption
coefficient, and d the thickness of PTPn films. Formula (1) does not take the reflection coefficient of PTPn films into
account, so that the obtained values of β(E) are the minimal possible ones.
In the range of the first singlet transition in PTPn, β(E) amounts to 10−7
electron/photon. With increase in the photon
energy, β(E) grows monotonously and becomes equal to 5 × 10⁻⁶
electron/photon at E = 2.26 eV, i.e. increases by more
than an order of magnitude. In this case, the ratio of the photo- and dark currents is equal to 1.6 in an electric field of 250
kV/m.
The dependence of the CPV amplitude on the wavelength of exciting light λ can be expressed by the equation
ϕ = Ak / (1 + kL) , (2)
where A is a constant, and the absorption coefficient k is unequivocally connected with λ [13].
The extrapolation of the dependence ϕ−1
(k−1
), which had been measured in the range of the first electron transition,
up to its intersection with the abscissa axis allowed us to estimate the diffusion length of singlet excitons L = (210 ± 50)
nm for a PTPn layer 560 nm in thickness, which agrees well with the data of work [13].
After air had been pumped out of the cell, the frontal CPV increased within the whole spectral range under study, not
violating the correlation with the absorption spectrum. In vacuum of 13.5 mPa, the increase of PTPn absorption in its
maximum (at E = 1.77 eV) amounted to 9%. At letting-to-air, the CPV diminished to the initial value level.
The CPV is considered as the algebraic sum of the bulk (Dember) photovoltage (PV) ϕD , the surface- barrier PV ϕb ,
and the surface PV ϕc emerging owing to the capture of nonequilibrium charge carriers by surface states of the donor or
acceptor type [19]. The bulk ϕD arises under the condition of bipolar diffusion, due to the difference between the
mobilities of charge carriers with different signs. In the case of unipolar photoconductivity, it is governed by the gradient
of the concentration of nonequilibrium charge carriers. The surface-barrier PV ϕb appears owing to the separation of free
charge carriers by the electric field of the space-charge region (SCR). Its sign is defined by the direction of the band
bending under equilibrium conditions.
Therefore, according to the experimental data presented above, the illuminated free surface of PTPn becomes
charged negatively. This evidences for a higher mobility of holes in the case of bipolar photoconductivity or for their
diffusion into the bulk in the case of unipolar photoconductivity. In the range of the first singlet transition in PTPn,
unipolar photoconductivity is more probable, which is confirmed by the spectral dependence β(E). The sign of the frontal
CPV testifies to the hole character of this photoconductivity which is caused by the ionization of excitons at electron
capture centers.
The overlapping of 3p-orbitals of the S atoms of neighboring molecules stimulates the appearance of linear chains in
PTPn and PTPn1 crystallites; the chains being arranged in parallel to the axes of regular molecular piles, which are
composed of translationally equivalent molecules. Probably, excitons may diffuse along these one-dimensional chains.
The sign and the amplitude of ϕD depend on the concentration gradient of nonequilibrium charge carriers, while the
sign and the amplitude of ϕb on their concentration and the drift direction in the electric field of the SCR near the PTPn
free surface. Accordingly, the spectra of ϕD and ϕb have to be close to the absorption or the photocurrent one,
respectively [20]. The frontal CPV correlates with the absorption spectrum, i.e. the main contribution is made here by ϕD
(ϕD >> ϕb ). The 1.54-eV band in the back CPV spectrum evidences for its drift character, and the CPV sign for the
antilocking band bending for holes near the back electrode. Since the back CPV is much lower by amplitude than the
frontal one and does not change its sign in the range of strong PTPn absorption, it testifies to that the bands at 1.68 and
1.77 eV are caused by ϕb (ϕb > ϕD ). Moreover, the photogeneration of holes near the back electrode is caused by the
dissociation of excitons owing to the capture of electrons onto acceptor levels with various energies.
The increase of the frontal CPV in vacuum can be explained by a reduction of the concentration of oxygen molecules,
which are electron acceptors and are adsorbed on the free PTPn surface. In this case, the antilocking band bending
decreases, and the CPV amplitude (|ϕD − ϕb |) increases.
344
ISSN 0503-1265. Ukr. J. Phys. 2006. V. 51, N 4
Page 11
4. Conclusions
Mixtures, which are called polythiopentacenes, are formed in all scenarios of the synthesis of Pn thioderivatives. After
their condensation onto quartz substrates, their main components are TTPn and HTPn, which we did not manage to
isolate in the course of sputtering.
In the spectral range 1.30 − 2.40 eV, the photoconductivity of PTPn films is of the hole type and is caused by the
dissociation of excitons owing to their collisions with electron capture centers. The frontal CPV in this range is caused by
the value of ϕD , while the back one by ϕb .
The work was fulfilled in the framework of the NASU project N 141 B/69.
1. Marshalk C. // Bull. Soc. Chim. France. 1939. 6. P. 1122.
2. Marshalk C., Stumm C. // Ibid. 1948. 15. P. 418 - 429.
3. Matsunaga Y. // J. Chem. Phys. 1965. 42, N 6. P. 2248 - 2249.
4. Goodings E.P., Mitchard D.A., Owen G. // J. Chem. Soc. Perkin Trans. I. 1972. N 11. P. 1310 - 1314.
5. Balode D.R., Silinsh E.A., Taure L.F. // Izv. AN Latv. SSR. Ser. Fiz. Tekhn. Nauk. 1978. N 1. P. 35 - 45.
6. Vertsimakha Ya.I., Gorishnyi M.P., Kurik M.V., Libera L. // Ukr. Fiz. Zh. 1981. 26, N 10. P. 1704 - 1709.
7. Perez-Albuerne E.A., Johnson H., Trevoy D.J. // J. Chem. Phys. 1971. 55, N 4. P. 1547 - 1554.
8. Shibaeva R.P. // Totals of Science and Technique. Ser. Crystallochem. / Ed. by. E.A. Gilinskaya. Moscow: VINITI,
1981 (in Russian). P. 189 - 264.
9. Gorishnyi M.P. // Abstract of Ph.D. thesis “Electronic Structure of Tetrathiotetracene and Photoelectric Properties
of Heterostructures on Its Basis”. Lviv, 1990 (in Russian).
10. Vertsimakha Ya.I. // Abstract of Ph.D. thesis “Mechanisms of Charge Carrier Photogeneration and Energy Structure
of Pentacene”. Kyiv, 1978 (in Russian).
11. Verzimacha J.I., Goriˇsnyj M.P., Kurik M.V., Libera L. // 19. Tagung “Organische Festk¨orper”. Erfurt, 1982. S. 142 -
144.
12. Gorishnyi M.P., Kurik M.V., Libera L. // Ukr. Fiz. Zh. 1987. 32, N 7. P. 1013 - 1016.
13. Lutsyk P., Vertsimakha Ya. Organic p-n type heterostructures based on the hexatiopentacene // Mol. Cryst. and
Liquid Cryst. 2005. 426. P. 265 - 276.
14. Ugawa A., Kunikiyo T., Ohta Y. et al. // MAR05 Meeting of the American Phys. Soc., 2004.
15. Meshkov A.M., Akimov I.A. // Prib. Tekhn. Eksp. 1964. N 3. P. 181 - 185.
16. Gorishnyi M.P. // Ukr. Fiz. Zh. 2002. 47, N 8. P. 711 - 714.
17. Silinsh E.A., Kurik M.V., Chapek V. Electronic Processes in Organic Molecular Crystals. Riga: Zinatne, 1988 (in
Russian).
18. Silinsh E.A., Belkind A.I., Balode D.R. et al. // Phys. status solidi (a). 1974. 25. P. 339 - 347.
19. Peka G.P., Strikha V.I. Surface and Contact Phenomena in Semiconductors. Kyiv: Lybid, 1992 (in Ukrainian).
20. Akimov I.A. // Opt. Mekh. Prom. 1966. N 5. P. 4 - 13.
Received 29.06.05. Translated from Ukrainian by O.I. Voitenko
МОЛЕКУЛЯРНА СТРУКТУРА ТА ЕЛЕКТРОФIЗИЧНI ВЛАСТИВОСТI ТIОПОХIДНИХ ПЕНТАЦЕНУ
М.П. Горiшний
Р е з ю м е
Page 12
Розглянуто можливi конфiгурацiї молекул тiопохiдних пентацену. Дослiджено спектри поглинання розчинiв i
плiвок полiтiопентацену (ПТП). Встановлено, що ПТП це сумiш тiопохiдних пентацену з рiзним числом атомiв S.
Пiсля конденсацiї цiєї сумiшi у вакуумi на кварцовi пiдкладки головними її компонентами є тетратiопентацен (ТТП) i
гексатiопентацен (ГТП). Положення максимуму довгохвильових смуг поглинання тiопохiдних пентацену описується
лiнiйною функ- цiєю числа валентних електронiв атомiв S, якi беруть участь у спряженнi iз π-системою
пентаценового каркаса молекул ПТП. Аналiз спектрiв фотоструму i конденсаторної фото-ерс (КФЕ) в областi перших
електронних переходiв ПТП показав, що фо- топровiднiсть є дiрковою i зумовлена дисоцiацiєю екситонiв на
центрах захоплення електронiв. Фронтальна КФЕ зумовле- на дифузiйною фото-ерс. Дембера ϕД , тильна
поверхнево- бар’єрною фото-ерс ϕб .
345
ISSN 0503-1265. Ukr. J. Phys. 2006. V. 51, N 4