The Center for Retirement Research at Boston College, part of a consortium that includes parallel centers at the University of Michigan and the National Bureau of Economic Research, was established in 1998 through a grant from the Social Security Administration. The Center’s mission is to produce first-class research and forge a strong link between the academic community and decision-makers in the public and private sectors around an issue of critical importance to the nation’s future. To achieve this mission, the Center sponsors a wide variety of research projects, transmits new findings to a broad audience, trains new scholars, and broadens access to valuable data sources.
Center for Retirement Research at Boston College Hovey House
Affiliated Institutions: The Brookings Institution
Syracuse University Urban Institute
1. Introduction
In the U.S., transfers from parents to their adult children while parents are still living account for 10 percent of children’s net worth (Gale and Scholz 1994). Between 1992 and 2008, 46 percent of children born to men and women ages 50 to 60 in 1992 received transfers from their parents (McGarry 2012). Families may constitute an important financial safety net during recessions but could also contribute to inter-generational transmission of disadvantage (Nishiyama 2002).
Previous studies offer substantial evidence that transfers between living parents and their adult children, unlike bequests and inheritances, are motivated in part by economic need (Cox and Way 2011; Altonji, Hayashi, and Kotlikoff 1995; McGarry and Schoeni 1995). This might mean transfers would occur more frequently during and after a recession. However, governments often respond to recessions by increasing financial assistance through programs like unemployment insurance. These public transfers may crowd out private transfers, leading to a decline in transfers during a recession relative to non-recessionary periods (Cox and Jakubson 1995; Cox and Soldo 2013). Also, transfers could be less frequent during a recession if parents suffer large economic losses and are unable to assist their children (Cox and Way 2011). When recessions have a greater impact on asset prices than on wages and employment, children could fare better than their parents (Glover et al. 2011). In that case, transfers from children to parents may become more common. Only two prior studies have examined these possibilities (Cox and Way 2011; Gottlieb, Pilkauskas, and Garfinkel
2014).
2
This paper examines changes in transfer behavior within families before and after the Great Recession in Germany and the United States. Studying transfers across a business cycle may reveal the extent to which families rely on one another as a source of financial security. Using the Great Recession as a source of unanticipated but similar macroeconomic shocks across two countries with very different social transfer programs enables us to test assertions in prior research that institutional differences lead to systematic differences in transfer behavior across countries.
The comparison between Germany and the U.S. over the recession is especially interesting because the timing and magnitude of the recession, as measured by contractions in GDP, were very similar. However, Germany experienced a much celebrated rapid return to pre-recession unemployment levels, whereas the U.S. had a slow labor market recovery. High rates of prolonged unemployment in the U.S. resulted in large extensions in unemployment benefit durations. At the same time, Germany was reducing duration of benefits for certain groups of workers and raising eligibility criteria in their unemployment insurance system which had historically been far more generous than the U.S. system. These changes may have caused a break in pre-existing patterns of financial transfers within families in each country.
Understanding the role of private transfers within families is crucial to designing effective pub-
lic programs and addressing inequality. The intent of public financial transfer p rograms, like unemployment insurance, is to redistribute income from one segment of the population to an-
other. In most cases, these transfers are “progressive”, meaning they take more from high earning households and give more to lower earning households and therefore reduce income inequality. If these public transfers crowd out private transfers between generations that would have otherwise occurred then they may have a smaller impact than anticipated.
2. The Recession in the U.S. and Germany
The Great Recession was the largest contraction in world GDP since the Great Depression. As shown in Figure 1, the timing and size of the contraction (relative to pre-recession GDP) were similar in the U.S. and Germany. Germany had one of the largest contractions in GDP of all OECD countries, but also had one of the most rapid and complete recoveries.
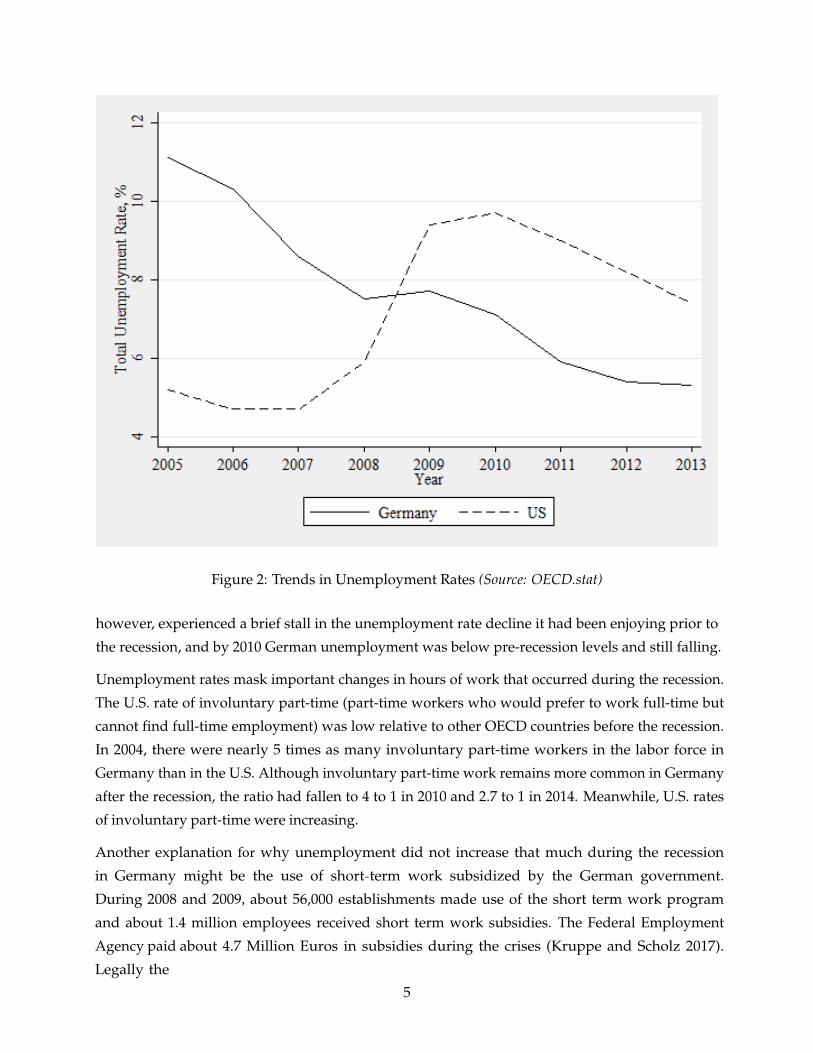
Behind the similarities in GDP trends, the two countries experienced very different labor market dynamics as can be seen in Figure 2. In 2005, Germany’s unemployment rate was approximately double the U.S. rate, but it was falling rapidly whereas the U.S. rate was stable at just under 5 percent. During the recession, the U.S. unemployment rate climbed to nearly 10 percent and had not returned to pre-recession levels by 2013 despite the recovery in GDP growth. Germany,
3
Figure 1: Comparison of GDP Growth (Source: World Bank National Accounts data)
4
Figure 2: Trends in Unemployment Rates (Source: OECD.stat)
however, experienced a brief stall in the unemployment rate decline it had been enjoying prior to the recession, and by 2010 German unemployment was below pre-recession levels and still falling.
Unemployment rates mask important changes in hours of work that occurred during the recession. The U.S. rate of involuntary part-time (part-time workers who would prefer to work full-time but cannot find full-time employment) was low relative to other OECD countries before the recession. In 2004, there were nearly 5 times as many involuntary part-time workers in the labor force in Germany than in the U.S. Although involuntary part-time work remains more common in Germany after the recession, the ratio had fallen to 4 to 1 in 2010 and 2.7 to 1 in 2014. Meanwhile, U.S. rates of involuntary part-time were increasing.
Another explanation for why unemployment did not increase that much during the recession in Germany might be the use of short-term work subsidized by the German government. During 2008 and 2009, about 56,000 establishments made use of the short term work program and about 1.4 million employees received short term work subsidies. The Federal Employment Agency paid about 4.7 Million Euros in subsidies during the crises (Kruppe and Scholz 2017). Legally the
5
employer can cut work hours up to 100%, whereas the short time allowance protects workers against wage loss. The replacement rate during the crises was 60% (67% for workers with children), which makes them comparable to the replacement rates received on unemployment benefits. The employer pays upfront but is later on reimbursed by the Federal Employment Agency. The short time allowance is typically paid up to 6 months, however, during the crises this was extended up to 24 months.
2.1 Convergence in Unemployment Insurance Generosity
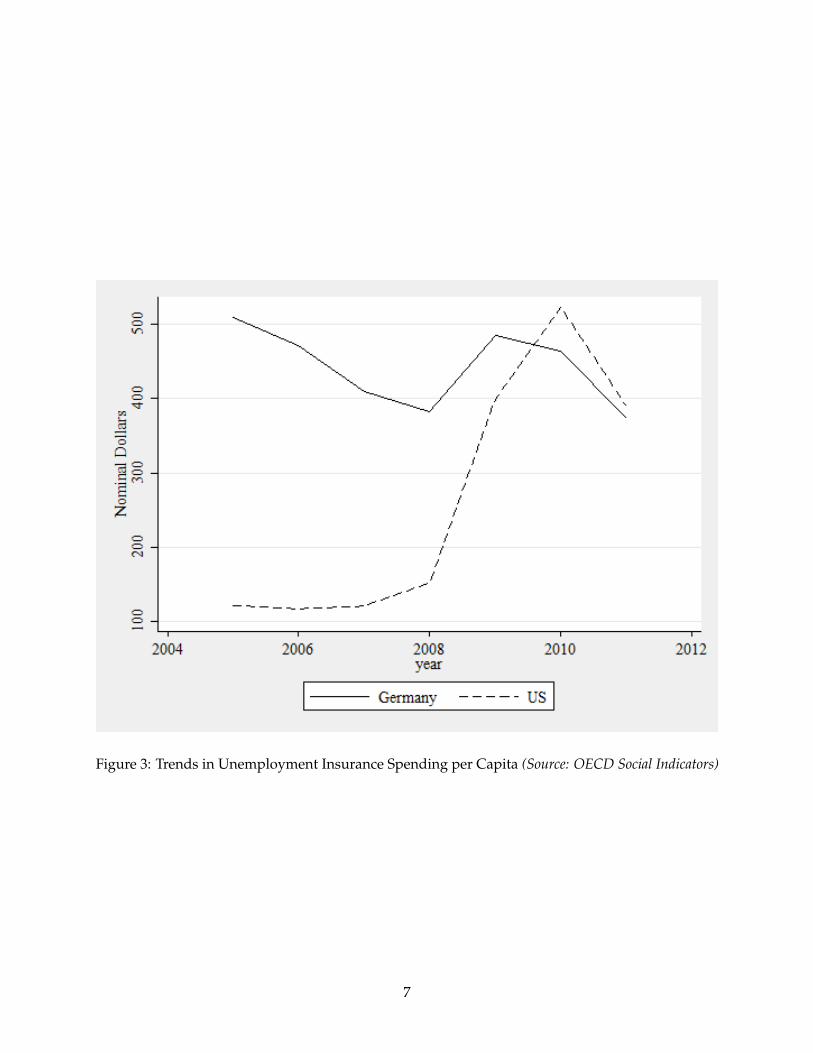
Prior to the recession, Germany’s unemployment insurance benefits were far more generous than U.S. benefits. Germany’s unemployment rate was twice that of the U.S. but Germany’s per capita unemployment insurance expenditures were nearly five times U.S. expenditures. From 2005 to 2008, Germany’s expenditures fell, as can be seen in Figure 3. Both the decline in the unemployment rate and falling expenditures in Germany are attributable to the 2005 Hartz Reform. Benefit duration in Germany differs by age. The Hartz Reform reduced the maximum duration of unemployment insurance for persons age 45 and older. For example, maximum duration fell from 26 to 15 months from 2006 to 2008 for persons age 50 to 54. Meanwhile, the U.S. increased maximum benefit durations from pre-recession levels of between 19 and 26 weeks to as much as 21 months. These changes represent major shifts in public assistance for unemployed workers in each country.
2.2 Differing Shocks to Wealth
The recessions in both countries led to very similar fluctuations in their stock markets as reflected by the Dow and DAX indices, outlined in Figure 4. In Germany however, only about 25% of households owned stocks or bonds in 2007 and there was no shock to the housing market so only 20% of German households reported financial losses (Bucher-Koenen and Ziegelmeyer 2014). For comparison, 65% of U.S. adults owned stocks or bonds in 2007 (Inc 2017). Housing prices fell by 30% from 2006 to 2009 in the U.S. and continued falling through 2011 leading to an average housing wealth shock of nearly 10% and a net worth shock of 20%, but there was substantial heterogeneity in these shocks across wealthy and poor households (Mian, Rao, and Sufi 2013).
Even absent these differences in the impact of the recession on financial and housing markets, retirees in each country likely experienced very different wealth shocks because of the structure of the public pension systems. In the U.S., Social Security payments to current retirees replace approximately 53 percent of average earnings whereas Germany’s Old Age Pension System replaces approximately 70 percent (Borsch-Supan and Wilke 2005). Not surprisingly, German retirees have historically had far less private savings than U.S. retirees.
6
Figure 3: Trends in Unemployment Insurance Spending per Capita (Source: OECD Social Indicators)
7
Figure 4: Trends in Stock Market Indices (Source: Yahoo! Finance)
8
2.3 Implications for Intergenerational Transfers
Prior to the recession, Germany’s unemployment insurance system and old age pensions were substantially more generous than their U.S. equivalents. If this these institutional differences had remained constant and if public transfer programs crowd out private transfers within families, then it would be reasonable to expect German families to make fewer transfers when children lose jobs than U.S. families, all else equal. However, it would be difficult to determine whether the patterns observed were due to other factors, like persistent differences in family norms or financial culture, or to differing institutions. Because there was a gradual convergence in unemployment insurance duration that coincided with shocks to wealth and earnings during the recession, there is variation over time and within each country that may create systematic disruptions in transfer behavior.
Similarly, retiree households that experienced greater wealth shocks because of their wealth portfo-
lios may be less able to make transfers and more likely to receive transfers from their adult children. Because there was no housing market shock in Germany and because the majority of German retirees derive all or nearly all retirement wealth from the defined benefit public pension system, most German parents should be better able to make transfers to their children than U.S. parents, all else equal.
3 Previous Studies of Intergenerational Transfers
There is an extensive literature on intergenerational transfers. This literature differentiates between transfers of money and “in kind” transfers of property, other goods, and services like caregiving time. This literature also differentiates between financial transfers made while both parties are living, known as “inter vivos” transfers, and transfers that occur only after the transferring party has died, referred to as inheritances or bequests. This study focuses on inter vivos financial transfers.
Seminal papers in the intergenerational transfers literature provide two possible motivations for private transfer behavior: altruism and exchange (Barro 1974; Becker 1974; Bernheim, Shleifer, and Summers 1985; Cox 1987). Transfers may occur for altruistic reasons if family members’ own utility depends in part on the financial well-being of other family m embers. Or, transfers could occur as part of a transaction akin to market-based exchanges of goods and services or lending contracts. Empirical studies provide evidence for both altruistic and exchanged based explanations of transfer behavior. For example, Jimenez-Martin and Prieto (2015) find transfers are not positively related to care provided by adult children as would be predicted by the exchange hypothesis, but unemployed children are more likely to receive transfers although transfers are less common in regions with high unemployment rates (2015). Conversely Vogt and Kluge (2014) show dramatic pension wealth increases received by East German parents after the fall of the Berlin Wall were
9
associated with a rise in transfers to adult children and strongly correlated with a rise in social support for adult children, which is consistent with the exchange hypothesis (2014).
The altruism vs. exchange distinction is relevant to predicting the impact of public transfers on private transfer behavior. Barro (1974) and Becker (1974) both predict public transfers will completely crowd out private transfers. This prediction is tested in comparative studies of financial transfers across countries. For example, Mudrazija (2014) uses SHARE data to study net life-cycle transfers from parents to children across European countries and find evidence of a negative correlation between public transfer program generosity and net private transfers (2014). Similarly, Brandt and Deindl (2013) use SHARE data and exploit variation across 18 European countries to examine differences in transfers from parents to children. They find a positive association between public transfers and the likelihood of any transfer but amounts transferred within families are negatively associated with public transfers (Brandt and Deindl 2013). However, known or expected probabilities of receiving a transfer from a family member may factor into the decision to apply for public transfer programs like unemployment insurance benefits (Gerardi and Tsai 2014). Without changes in welfare regimes within countries during the study period, these studies are limited in their ability to attribute cross-country differences in transfers to the welfare regime.
To address this endogeneity problem, several studies have exploited “natural experiments” in-
volving a change in welfare programs. For example, among East German parents after the fall of the Berlin wall, a dramatic increase in pensions resulted in more and larger transfers to adult children (Vogt and Kluge 2014). Schoeni (2002) uses variation in unemployment insurance benefits across states to identify the effects of unemployment benefits on transfers and finds people who receive unemployment benefits receive less money from family (2002). Jensen (2004), Lai and Orsuwan (2009), Juarez (2009), and Gerardi and Tsai (2014) also use policy changes as a source of identification and find evidence of crowd out (2004; 2009; 2009; 2014).
A separate and smaller literature has examined the impact of business cycles on intergenerational transfers. The impact of a recession on transfer behavior is theoretically ambiguous and not necessarily linked to the motivation for transfers. Under altruism, parents may provide transfers to children affected by the recession because of the direct impact their children’s hardship has on their own utility. Under exchange, children may find exchange of time or goods with parents more attractive when labor market opportunities are scarce, or parents may find lending to children more attractive when rates of return available elsewhere are lower. Similar logic applies to explain transfers from children to parents when parents are more impacted by the recession than children. In either case, families may serve as a source of financial insurance during recessions. Cox and Way (2011) investigate this possibility by studying transfers in the U.S. during the Great Recession and find unemployed persons were more likely to receive transfers than employed persons, however this relationship was weaker for those whose family were also affected by the recession (2011).
10
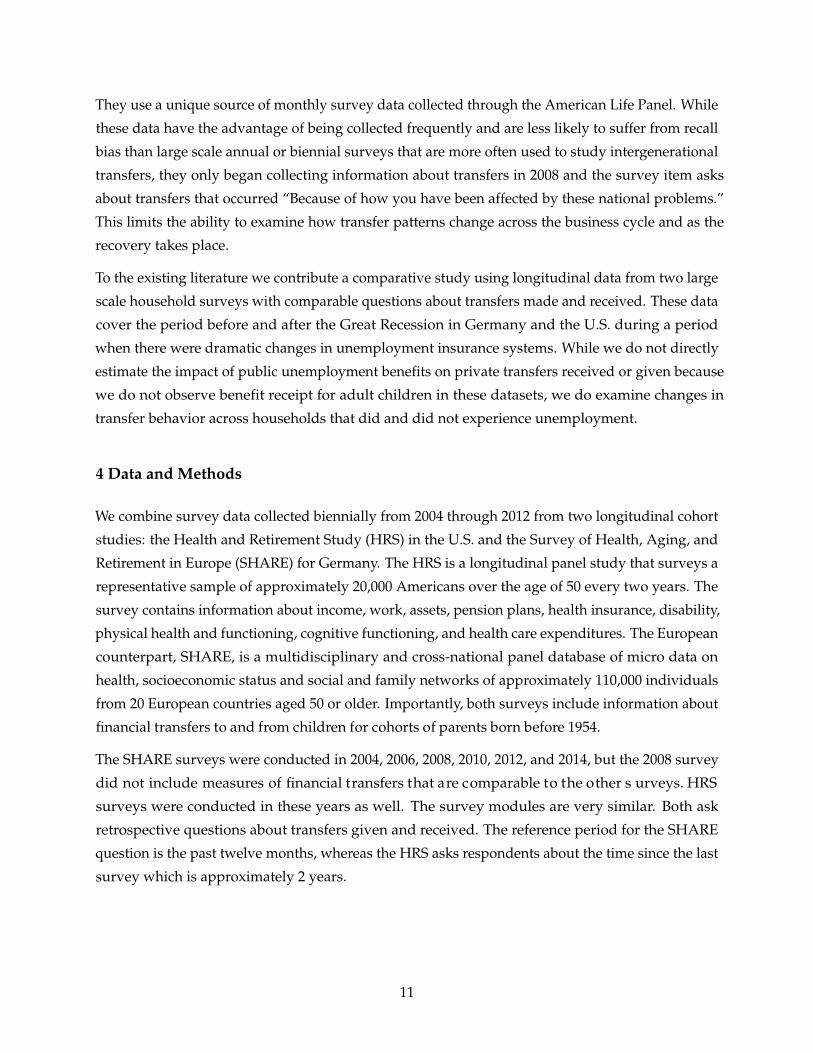
They use a unique source of monthly survey data collected through the American Life Panel. While these data have the advantage of being collected frequently and are less likely to suffer from recall bias than large scale annual or biennial surveys that are more often used to study intergenerational transfers, they only began collecting information about transfers in 2008 and the survey item asks about transfers that occurred “Because of how you have been affected by these national problems.” This limits the ability to examine how transfer patterns change across the business cycle and as the recovery takes place.
To the existing literature we contribute a comparative study using longitudinal data from two large scale household surveys with comparable questions about transfers made and received. These data cover the period before and after the Great Recession in Germany and the U.S. during a period when there were dramatic changes in unemployment insurance systems. While we do not directly estimate the impact of public unemployment benefits on private transfers received or given because we do not observe benefit receipt for adult children in these datasets, we do examine changes in transfer behavior across households that did and did not experience unemployment.
4 Data and Methods
We combine survey data collected biennially from 2004 through 2012 from two longitudinal cohort studies: the Health and Retirement Study (HRS) in the U.S. and the Survey of Health, Aging, and Retirement in Europe (SHARE) for Germany. The HRS is a longitudinal panel study that surveys a representative sample of approximately 20,000 Americans over the age of 50 every two years. The survey contains information about income, work, assets, pension plans, health insurance, disability, physical health and functioning, cognitive functioning, and health care expenditures. The European counterpart, SHARE, is a multidisciplinary and cross-national panel database of micro data on health, socioeconomic status and social and family networks of approximately 110,000 individuals from 20 European countries aged 50 or older. Importantly, both surveys include information about financial transfers to and from children for cohorts of parents born before 1954.
The SHARE surveys were conducted in 2004, 2006, 2008, 2010, 2012, and 2014, but the 2008 survey did not include measures of financial transfers that are comparable to the other s urveys. HRS surveys were conducted in these years as well. The survey modules are very similar. Both ask retrospective questions about transfers given and received. The reference period for the SHARE question is the past twelve months, whereas the HRS asks respondents about the time since the last survey which is approximately 2 years.
11
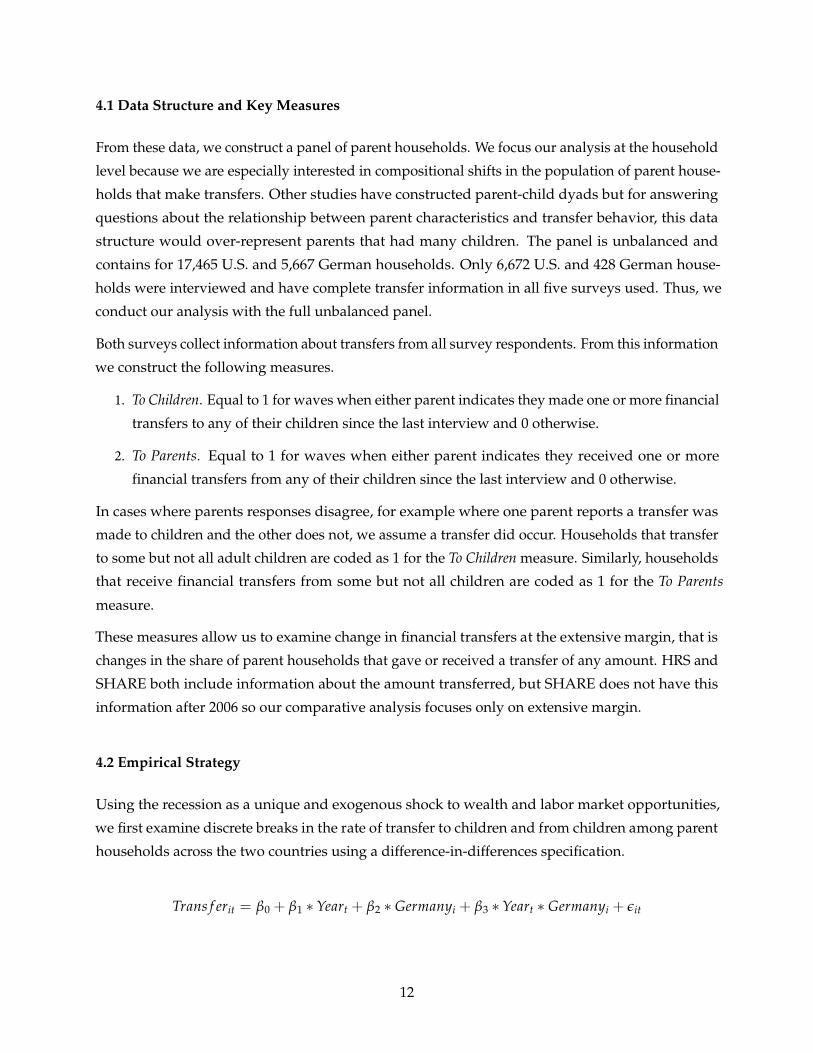
4.1 Data Structure and Key Measures
From these data, we construct a panel of parent households. We focus our analysis at the household level because we are especially interested in compositional shifts in the population of parent house-
holds that make transfers. Other studies have constructed parent-child dyads but for answering questions about the relationship between parent characteristics and transfer behavior, this data structure would over-represent parents that had many children. The panel is unbalanced and contains for 17,465 U.S. and 5,667 German households. Only 6,672 U.S. and 428 German house-
holds were interviewed and have complete transfer information in all five surveys used. Thus, we conduct our analysis with the full unbalanced panel.
Both surveys collect information about transfers from all survey respondents. From this information we construct the following measures.
1. To Children. Equal to 1 for waves when either parent indicates they made one or more financial transfers to any of their children since the last interview and 0 otherwise.
2. To Parents. Equal to 1 for waves when either parent indicates they received one or more financial transfers from any of their children since the last interview and 0 otherwise.
In cases where parents responses disagree, for example where one parent reports a transfer was made to children and the other does not, we assume a transfer did occur. Households that transfer to some but not all adult children are coded as 1 for the To Children measure. Similarly, households that receive financial transfers from some but not all children are coded as 1 for the To Parents
measure.
These measures allow us to examine change in financial transfers at the extensive margin, that is changes in the share of parent households that gave or received a transfer of any amount. HRS and SHARE both include information about the amount transferred, but SHARE does not have this information after 2006 so our comparative analysis focuses only on extensive margin.
4.2 Empirical Strategy
Using the recession as a unique and exogenous shock to wealth and labor market opportunities, we first examine discrete breaks in the rate of transfer to children and from children among parent households across the two countries using a difference-in-differences specification.
Transfer is one of the two measures of financial transfers, To Children or To Parents. It takes the value 1 if any transfer has occurred from individual i in year t. The parameter of interest is β3, which measures the percentage point change in transfer rates after the recession in Germany relative to the U.S. When the dependent variable is To Child, we expect β3 to be negative because unemployment
was higher in the U.S. for more years after the recession than in Germany. However, this may not occur if the impact of the housing market crisis and larger relative share of U.S. parents’ wealth invested in the stock market cancel out the effect of higher unemployment. For this same reason, when the dependent variable is To Parents, we expect a negative β3 because U.S. parent households
were more exposed to financial losses than German. Again, this may not occur if the relatively worse labor market for U.S. adult children counteracts this impact.
To this basic model, we add controls for parents’ educational attainment, health status, age, number of own parents who are still living, number of children (including in-laws), children’s marital status, parent’s marital status, and number of grandchildren, all denoted in vector X. We allow individual characteristics to vary by year. Because analysis is conducted at the household level, our measure of parents’ educational attainment is constructed as the maximum within the couple, and we include both the maximum and minimum health status reported by the couple. Although both surveys do contain information about children’s work status, we do not use this information because work status is likely endogenous. For example, children may opt to continue searching for a job even after unemployment benefits run out if they know they have parents’ support fall back on, or take employment earlier if not. Thus, we estimate following specification in the second step.
After examining aggregate changes in transfers after the recession across the two countries, we explore patterns among specific subgroups of the p opulation. By looking at subgroups we are interested in studying the crowding out effect vs. family as an insurance during a recession. Thus we are comparing different subgroups of economic status, wealth, and unemployment experience. We expect that groups that are economically more stable don’t change their transfer behavior during the crises whereas parents who are economically disadvantaged might not be able to transfer as much to their kids during the crises. The same applies to parents who experienced a wealth shock. We expect to see diferences in transfer behavior compared to parents who did not suffer from a wealth shock. Finally we want to address how transfer from parents to kids are different in household where kids experience unemployement. If the crowind out hypotheses hold we should see less transfers from parents to kids when their kids are not employed. The subgroup analyses are only done on the outcome transfer from parents to kids. Hence, we esstimate following model and are interested in the parameter β7, which contains the interaction term of the year the transfer
13
happened, the country, and the subgroup categories. It measures the percentage point change in transfer rates after the recession in Germany relative to the U.S. by the outlined subgroups.
All results in this paper are reported as either predicted probabilities or averages of the marginal effects after probit estimation.
5 Results
Table 1 contains summary statistics for our dependent variables and parent characteristics by country and year, whereas years 2009 and onwards are the years following the recession. The means of the transfer variables indicate transfers were more common in the U.S. before and after the recession than in Germany, whereas the numbers get closer after the recession. However because the reference period for the HRS survey question is 24 months and the reference period for the SHARE survey is 12, this could be misleading. In both countries, transfers from parents to children appear to have declined after the recession, while transfers to parents remained relatively stable and still far less common than transfers from parents. Relative to German parents, US parents appear to be less educated but this could be because differences in the educational system preclude a perfect harmonization of measures. German parent’s self reported health status is generally lower than US parents, and more German parents are married than U.S. parents. German parents have fewer children and grandchildren.
14
Tabl
e1:
Des
crip
tive
Stat
isti
csfo
rSe
lect
edV
aria
bles
Var
iabl
esU
S20
03G
erm
any
2003
US
2005
Ger
man
y20
05U
S20
09G
erm
any
2009
US
2011
Ger
man
y20
11U
S20
13G
erm
any
2013
Tran
sfer
toK
ids
0.35
30.
285
0.35
40.
303
0.34
30.
142
0.30
30.
233
0.30
70.
240
Tran
sfer
From
Kid
s0.
062
0.03
10.
059
0.02
50.
064
0.02
50.
063
0.02
60.
075
0.02
8
Fina
ncia
lLos
s0.
760
1.34
70.
621
1.06
50.
742
0.45
80.
820
1.59
40.
841
1.52
2
Less
than
Hig
hSc
hool
0.23
90.
061
0.21
50.
059
0.21
10.
067
0.20
40.
077
0.19
90.
065
Hig
hSc
hool
0.52
90.
549
0.53
60.
538
0.54
60.
512
0.54
60.
493
0.54
30.
478
Col
lege
0.23
20.
390
0.24
90.
402
0.24
40.
421
0.25
00.
429
0.25
80.
456
Max
Hea
lth
Exce
llent
0.84
20.
613
0.83
80.
611
0.85
60.
582
0.85
20.
577
0.85
30.
553
No
pare
ntgo
odhe
alth
0.13
30.
322
0.13
50.
335
0.12
10.
354
0.12
30.
355
0.11
70.
384
One
pare
ntgo
odhe
alth
0.02
60.
065
0.02
70.
053
0.02
30.
064
0.02
50.
068
0.02
90.
063
Both
pare
nts
good
heal
th0.
931
0.89
30.
935
0.87
00.
939
0.86
40.
942
0.84
80.
945
0.86
9
No
pare
ntpo
orhe
alth
0.06
10.
103
0.06
00.
115
0.05
70.
126
0.05
40.
142
0.05
10.
122
One
pare
ntpo
orhe
alth
0.00
70.
004
0.00
50.
015
0.00
50.
009
0.00
40.
010
0.00
40.
008
Both
pare
nts
poor
heal
th0.
501
0.25
00.
489
0.26
50.
547
0.33
20.
551
0.35
30.
558
0.37
4
Ow
nPa
rent
sLi
ving
0.46
60.
480
0.42
20.
451
0.47
00.
302
0.44
20.
314
0.39
10.
263
Tota
lChi
ldre
n3.
378
2.18
23.
412
2.20
93.
106
1.98
73.
172
1.95
43.
192
1.99
7
Mar
ried
Chi
ldre
n1.
944
1.08
41.
972
1.12
71.
639
0.10
11.
606
0.79
61.
574
0.68
5
Tota
lGra
ndC
hild
ren
5.56
52.
176
5.80
92.
291
5.35
42.
251
5.52
72.
325
5.42
12.
478
Pare
nts:
both
fem
ale
0.00
030.
001
0.00
10.
001
0.00
10
0.00
10.
0004
0.00
10.
0005
Pare
nts:
both
mal
e0.
001
0.12
60.
001
0.09
20.
002
0.11
30.
001
0.08
10.
001
0.06
8
Pare
nts:
oppo
site
sex
0.52
70.
657
0.54
10.
678
0.48
50.
589
0.48
70.
602
0.47
70.
587
Sing
lehh
wom
en0.
105
0.16
90.
099
0.17
40.
118
0.20
40.
116
0.20
90.
117
0.21
9
Sing
lehh
men
0.36
60.
047
0.35
80.
056
0.39
50.
094
0.39
50.
108
0.40
40.
125
Obs
erva
tion
s11
,939
1,56
610
,300
1,32
810
,219
981
10,2
532,
662
9,36
22,
053
15
5.1 Difference in Differences Results
Table 2 contains regression adjusted transfer probabilities for each country by year and the difference-in-differences estimate. From these estimates, it appears fewer households transferred money to children after the recession than before in both countries, but transfer rates did not change in one country relative to the other.
Table 2: Regression Adjusted Transfers to Children and Difference in Differences Estimate
Time.Country Estimate Standard Error pvalue Lower Bound Upper Bound
US 2003 0.381 0.005 0 0.371 0.390
Germany 2003 0.218 0.010 0 0.199 0.237
US 2005 0.376 0.005 0 0.367 0.386
Germany 2005 0.240 0.011 0 0.219 0.262
US 2009 0.350 0.005 0 0.341 0.359
Germany 2009 0.100 0.008 0 0.084 0.116
US 2011 0.307 0.004 0 0.298 0.315
Germnay 2011 0.186 0.007 0 0.172 0.200
US 2013 0.310 0.005 0 0.300 0.319
Germany 2013 0.190 0.008 0 0.174 0.206
We find t here m ay h ave b een s ome i mportant c hanges i n r elative t ransfer p robabilities i n 2011 and 2013. Figure 5 displays regression adjusted transfer rates by country and year computed after probit estimation. The estimates indicate both countries experienced a decline in transfers from 2005 to 2009 and the decline appears slightly larger in Germany. Because of the shorter reference period for the German survey respondents (12 months instead of 24) this difference may be more important than it appears. In the U.S., transfer rates fell by 3 percentage points from 2005 to 2009, which represents a 9 percent reduction in transfers within the last 24 months, and there was a 20 percent decline from 2005 to 2013. In Germany, the transfer rates fell by 7.5 percentage points from 2005 to 2009, which represents a 29 percent reduction in transfers within the last 12 months. The rate of transfer to children continued fell further the U.S. from 2009 to 2011 but rose slightly in Germany. This rise might be explained by the fact that Germany recovered faster from the recession than the US. From 2011 to 2013, rates appear stable in both countries.
Table 3 contains the results of our analysis of transfers from children to parents. We see some underlying variation that suggests the likelihood of a transfer from U.S. children to the parents may have increased in 2013 while rates among German children remained comparable to 2005 levels, as outlined in Figure 6. Important to note is that transfers from parents to kids slightly increase.
16
Figure 5: Regression Adjusted Probabilities of Transfer from Parents to Children
17
during the recession in the U.S. while they slightly decrease in Germany at the same time. But for all times transfer rates are low in both countries.
Table 3: Regression Adjusted Transfers to Parents and Difference in Differences Estimate
Time.Country Estimate Standard Error pvalue Lower Bound Upper Bound
US 2003 0.058 0.002 0 0.054 0.063
Germany 2003 0.048 0.006 0 0.036 0.060
US 2005 0.056 0.002 0 0.052 0.061
Germany 2005 0.039 0.006 0 0.027 0.051
US 2009 0.062 0.002 0 0.057 0.066
Germany 2009 0.035 0.006 0.00000 0.022 0.048
US 2011 0.060 0.002 0 0.055 0.064
Germnay 2011 0.039 0.004 0 0.030 0.047
US 2013 0.071 0.003 0 0.065 0.076
Germany 2013 0.041 0.005 0 0.031 0.051
5.2 Analysis of Transfers by Parent’s Economic Status
Literature shows that economic status is associated with transfer behavior. Our assumption is that households with lower economic status were affected more by the recession than others. In times of hardship parents might not be able to transfer as much to their kids, whereas households with higher economic status are more likely to keep transferring to their kids. Using the education information in both Share and HRS we construct a measure of economic status by harmonizing educational degrees.
Figure 7 and 8 plot difference-in-differences estimates by country for each education group derived from modifying our main specification to include a three-way interaction between each education dummy (omitting one), year, and country, and all two-way interactions. For ease of interpretation, we plot the marginal effects, which can be interpreted as estimated changes in transfer rates between years. These estimates are not very precise because we are adding many parameters to the model. We include 95% confidence intervals for the estimates that are statistically significantly different from 0. All other points have intervals that overlap 0.
18
Figure 6: Regression Adjusted Probabilities of Transfer from Children to Parents
19
For Germany we can see that the transfer behavior doesn’t really vary much across educational groups. It seems that economic status doesn’t result in different transfer behavior, as outlined in Figure 7. No matter which educational group we look at we can see that all parents reduced transfer to kids during the recession. We can see the same uprise in transfers after the recession. The trends are almost parallel. It seems that the most educated parents had the least reductions in transfers, but less than we would have expected. We find the same pattern when we look at the U.S. which is illustrated in Figure 8.
5.3 Analysis of Transfers by Wealth Lost
Another possible explanation for reducing transfer is experiencing a wealth shock. Parents who suffer from a financial loss during the recession might just not be able to transfer money to kids. Thus, we are examining transfer behavior for two different groups: parent households who were hit during the recession by a financial shock. Using the detailed information about household wealth available in the HRS and SHARE survey to construct measures of a big change in household wealth. Interestingly, we find that for Germany both households, the ones suffering from a big financial loss and the ones not experiencing a financial shock, reduce their transfer behavior during the recession, and increase transfers again after the recession.
20
Figure 7: Regression Adjusted Changes in Rates of Transfer from Parents to Children by Economic
Status
21
Figure 8: Regression Adjusted Changes in Rates of Transfer from Parents to Children by Wealth Loss
The same is applying to the U.S.. This suggests that the large reduction in transfers to children was not due to own financial hardship. However, over the entire study period, households who suffer from a financial loss always show lower transfer rates, in the U.S. and Germany.
22
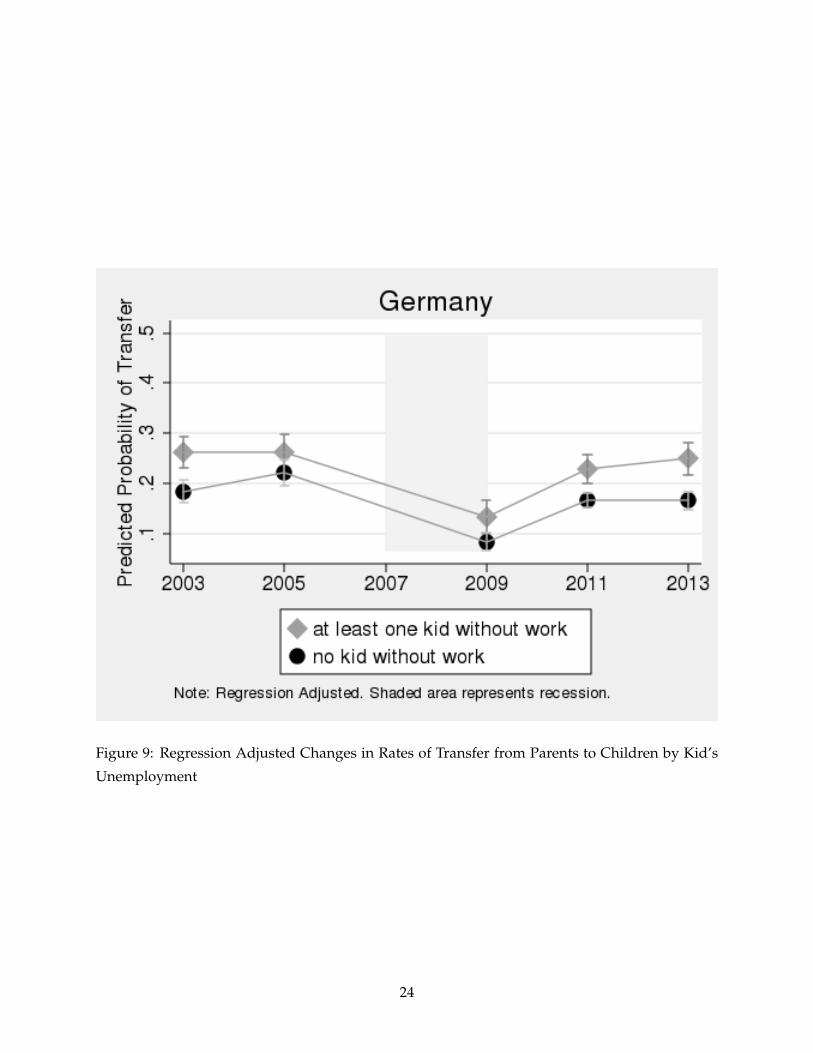
### 5.4 Analysis of Transfers by Kid’s Unemployment Another explanation for reducing transfer we want to examine is the crowding out of public assistance. We assume that if kids are unemployed and thus receive benefits parents reduce transfers to kids. Thus we should see in the data that transfers stay stable for households without kids in non-employment, whereas the other group should show a reduction in transfers. However, this is not the case. Surprisingly, we cannot confirm this hypothesis. We find that for both, households with kids in non-
employment and households with no kids in non-employment both reduce transfer during the recession. Again, we find the same pattern for the U.S. and Germany. This suggests that there is no crowding out.
6 Discussion and Conclusion
This paper examined changes in transfers within families in the U.S. and Germany after the Great Recession. Although these countries experienced similarly sized and timed contractions in GDP growth, the labor and housing market experiences were very different. Germany’s housing market did not undergo the same crash as the U.S. and Germans have lower home ownership rates so less wealth was exposed to risk. The U.S. had a very slow labor market recovery, and Germany saw little if any rise in unemployment followed by a continued decline in unemployment in the
23
Figure 9: Regression Adjusted Changes in Rates of Transfer from Parents to Children by Kid’s
Unemployment
24
Figure 10: Regression Adjusted Changes in Rates of Transfer from Parents to Children by Kid’s
Unemployment
25
years immediately following the recession. While historically Germany’s unemployment insurance system has been more generous than the U.S. system, expansions in benefit duration in the U.S. and reductions in Germany brought the two systems closer together.
6.1 Summary of Findings
Analysis of comparable surveys of financial transfers within families reveals transfers to children may be pro-cyclical. Transfers were less likely in both countries in 2009 relative to 2005, and the percentage decline was greater in Germany than in the U.S. Transfer rates continued to fall in the U.S. in 2011 and 2013 but appear to have stabilized or perhaps recovered slightly in Germany by 2011. These patterns mimic the difference in the recovery in the two countries. We cannot find any evidence for the crowding out effect, nor can we find evidence that financial hardship is related to a reduction of transfers during the crises. The results suggest that family support through a recession might come through the channel of in-kind support to children, perhaps by allowing children to move back home.
6.2 Limitations
Although the HRS and SHARE financial survey instruments are highly similar, they differ in one important way. SHARE respondents are asked to report transfers within the past 12 months. HRS respondents are instructed to report transfers since the last survey, which would be over 2 years. This difference may lead us to overstate the differences between the two countries. Studying whether any transfer occurred rather than the transfer amount may help to mitigate this limitation.
Due to a change in the 2008 SHARE survey, no transfer information was collected. Without this year we may miss important variation in transfers that occurred during the recession. We do have this information for HRS respondents and the estimate from the 2008 survey falls very close to the straight line segment connecting estimates from the 2006 and 2010 surveys, but it is impossible to know whether this would be the case for SHARE households too.
Appendix
Outlined are the difference and difference estimates for our models by subgroups.
26
Estimates by Economic Status
The two following tables contain the estimates for subgroups of different economic status for transfers from parents to kids and transfers from kids to parents. Economic status is measured by educational attainment. We harmonized German and U.S. educational credentials and have three groups to compare: parents with primary and lower education, parents with upper secondary education and parents with university degrees. This measure is constructed on the household level which means we selected the highest degree within the parent’s household. Table 4 shows transfers from parents to kids, Table 5 shows the estimates for transfers from kids to parents.
Estimates by Wealth
The two following tables contain the estimates by wealth for transfers from parents to kids and transfers from kids to parents. Our measure of wealth is constructed as an indicator denoting if a household experienced substantial wealth loss during the recession. Table 6 shows transfers from parents to kids, Table 7 shows the estimates for transfers from kids to parents.
Estimates by Kid’s Non-Employment
The two following tables contain the estimates by kid’s non-employment for transfers from parents to kids and transfers from kids to parents. This indicator is constructed using information on kids and takes the value one if at least one of the kids in the parent’s household experienced non-employment during the recession once. Table 8 shows transfers from parents to kids, Table 9 shows the estimates for transfers from kids to parents.
27
Table 4: Difference in Differences Estimate Transfers to Parents: Economic Status
Time.Country Estimate Standard Error pvalue Lower Bound Upper Bound
US 2003: primary and lower education 0.210 0.008 0 0.194 0.226
US 2003: upper secondary education 0.366 0.006 0 0.354 0.379
US 2003: college/university/post secondary 0.525 0.010 0 0.506 0.544
Vogt, Tobias C., and Fanny Kluge. 2014. “Care for Money? Mortality Improvements, Increasing
Intergenerational Transfers, and Time Devoted to the Elderly.” https://papers.ssrn.com/sol3/
papers.cfm?abstract_id=2546811.
35
36
RECENT WORKING PAPERS FROM THECENTER FOR RETIREMENT RESEARCH AT BOSTON COLLEGE
Homeownership, Social Insurance, and Old-Age Security in the United States and Europe Stipica Mudrazija and Barbara A. Butrica, October 2017
How Much Does Motherhood Cost Women in Social Security Benefits? Matthew S. Rutledge, Alice Zulkarnain, and Sara Ellen King, October 2017
How Much Does Out-of-Pocket Medical Spending Eat Away at Retirement Income? Melissa McInerney, Matthew S. Rutledge and Sara Ellen King, October 2017
Can Knowledge Empower Women to Save More for Retirement? Drew M. Anderson and J. Michael Collins, September 2017
Dementia, Help with Financial Management, and Well-Being Anek Belbase and Geoffrey T. Sanzenbacher, September 2017
The Behavioral and Consumption Effects of Social Security Changes Wenliang Hou and Geoffrey T. Sanzenbacher, September 2017
Family Transfers With Retirement-Aged Adults in the United States: Kin Availability, Wealth Differentials, Geographic Proximity, Gender, and Racial Disparities Ashton M. Verdery, Jonathan Daw, Colin Campbell, and Rachel Margolis, August 2017
Guardianship and the Representative Payee Program Anek Belbase and Geoffrey T. Sanzenbacher, August 2017
The Relative Effects of Economic and Non-Economic Factors on Taxpayers’ Preferences Between Front-Loaded and Back-Loaded Retirement Savings Plans Andrew D. Cuccia, Marcus M. Doxey, and Shane R. Stinson, July 2017
Social Security and Total Replacement Rates in Disability and Retirement Mashfiqur R. Khan, Matthew S. Rutledge, and Geoffrey T. Sanzenbacher, May 2017
An Experimental Analysis of Modifications to the Survivor Benefit Information within the Social Security Statement Jeffrey Diebold and Susan Camilleri, May 2017
Actuarial Inputs and the Valuation of Public Pension Liabilities and Contribution Requirements: A Simulation Approach Gang Chen and David S. T. Matkin, May 2017
All working papers are available on the Center for Retirement Research website (http://crr.bc.edu) and can be requested by e-mail ([email protected]) or phone (617-552-1762).