Japan International Cooperation Agency Final Report Mombasa Port Master Plan including Dongo Kundu October 2015 The Overseas Coastal Area Development Institute of Japan Oriental Consultants Global Co., Ltd. Nippon Koei Co., Ltd.
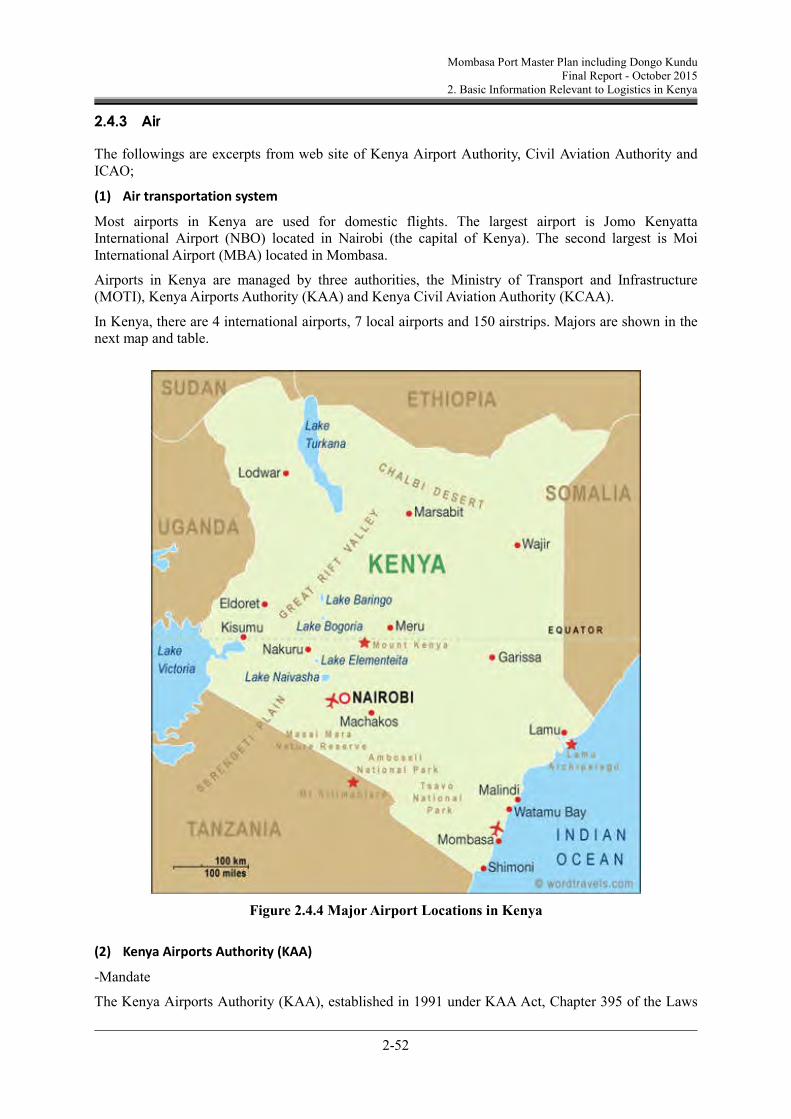
Transcript
Japan International Cooperation Agency
Final Report
Mombasa Port Master Plan
including Dongo Kundu
October 2015
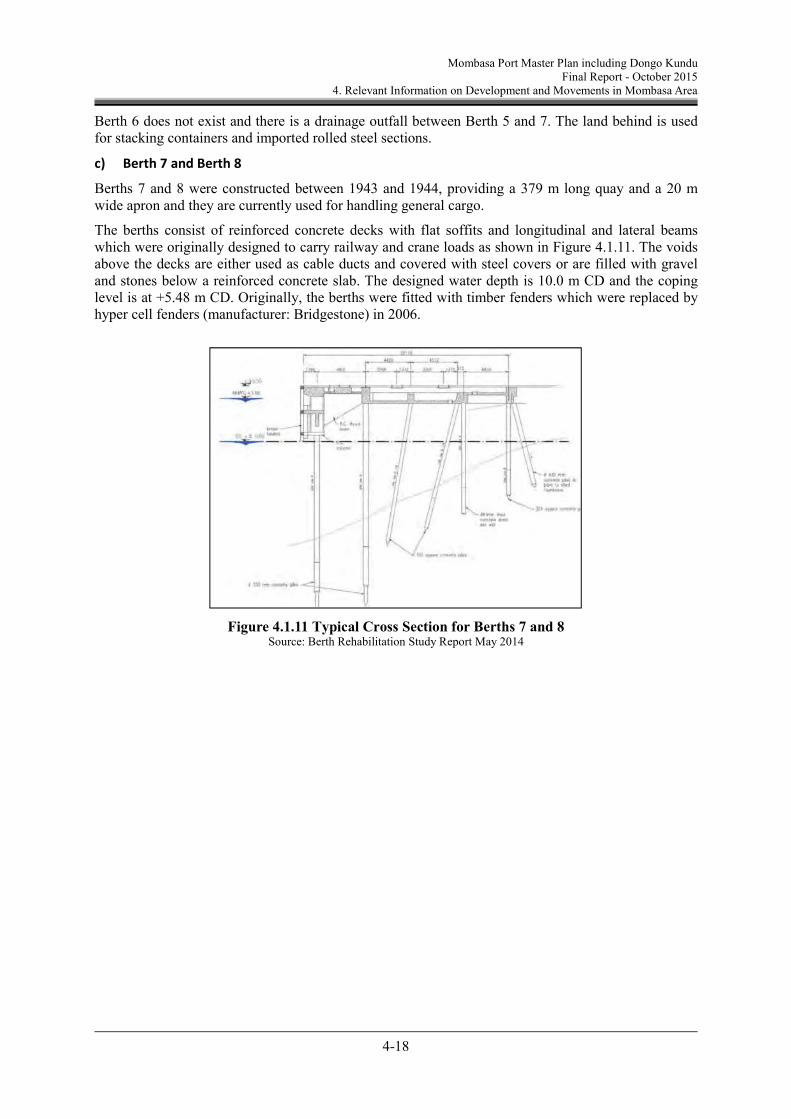
The Overseas Coastal Area Development Institute of Japan
MIED Ministry of Industrialization and Enterprise Development
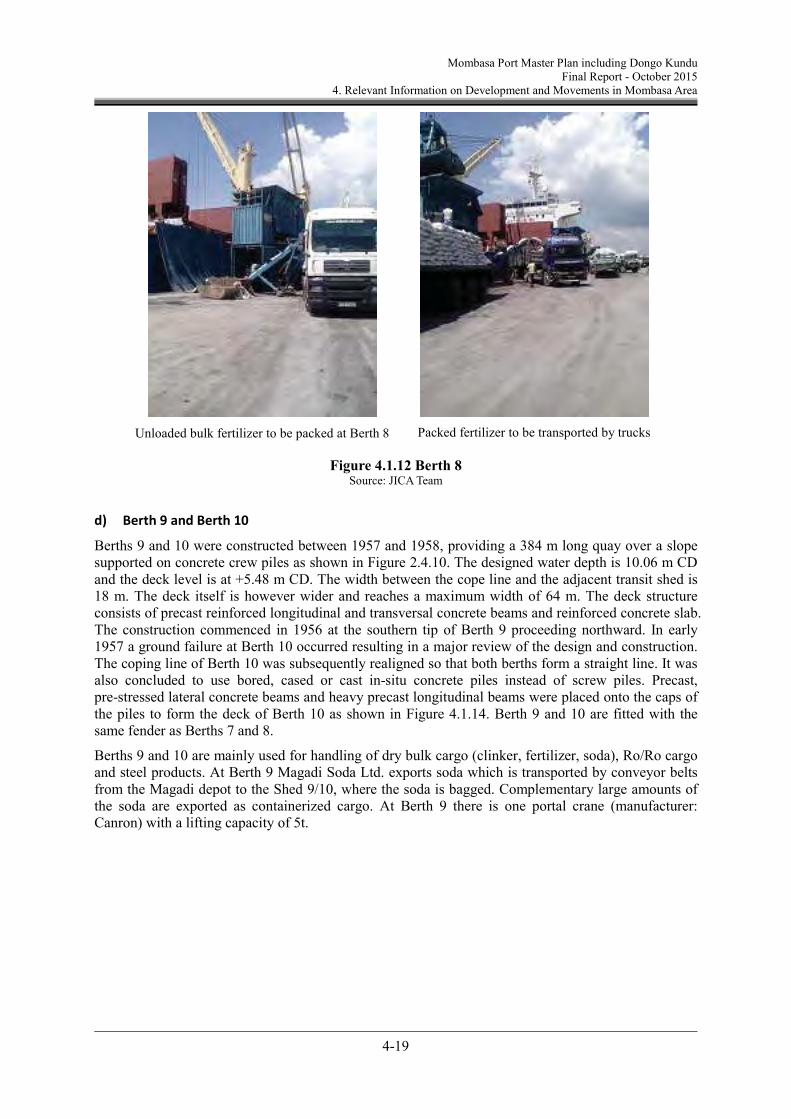
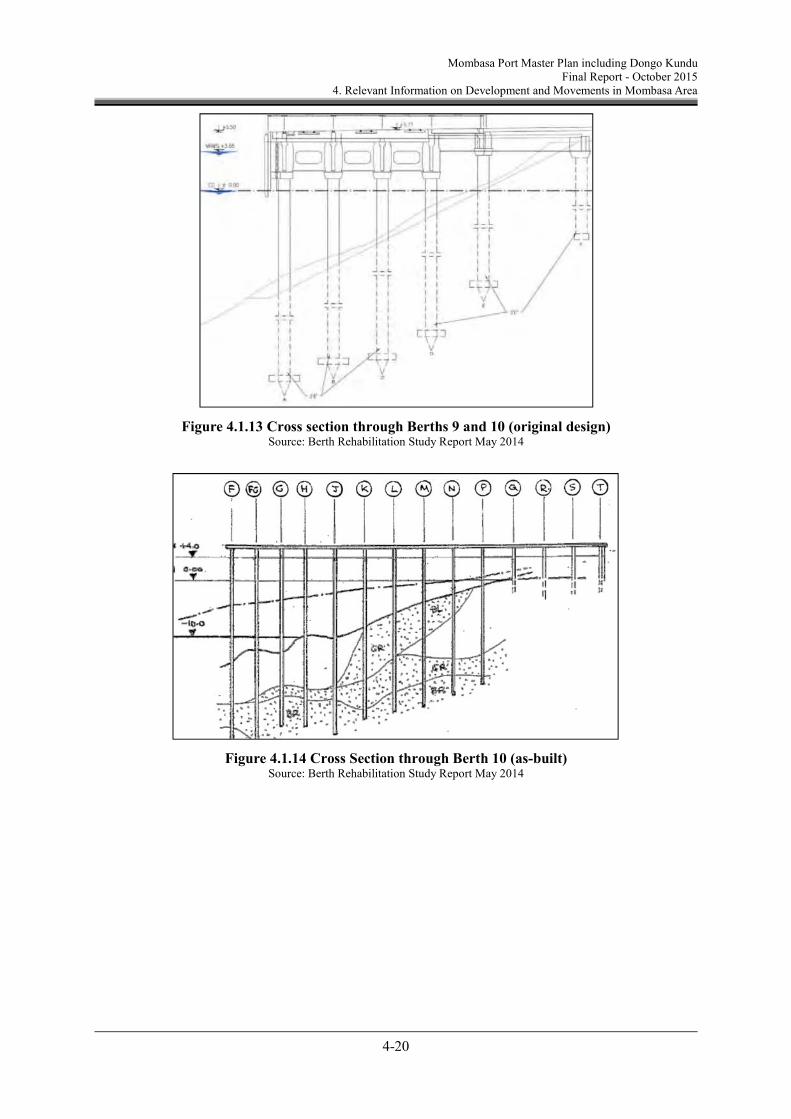
MOTI Ministry of Transport and Infrastructure
MPDP Mombasa Port Development Project
MSC Mediterranean Shipping Company
MSS Manager Self-Service
MTO Middle Term Plan
MTP2 2nd Middle Term Plan
NAVFOR Naval Force
NCL National Land Commission
NCTA Northern Corridor Transit Agreement
NEMA National Environment Management Authority
NDB Non Directional Beacon
NDF Nordic Development Fund
NK Nippon Koei Co., Ltd.
NMK National Museums of Kenya
Abbreviation Description
NPV Net Present Value
NSW National Single Window System
NTSA National Transport and Safety Authority
OBP Oceans Beyond Piracy
OC Oriental Consultants Global Co., Ltd.
OCDI Overseas Coastal Area Development Institute of Japan
OD Origin and Destination
ODA Official Development Assistance
OSBP One Stop Border Post
PCBS Ports Community-Based System
PDM Project Design Matrix
PIC Public Investment Committee
PMPF Puntland Maritime Police Force
PO Plan of Operation
POL Petroleum, Oil & Lubricants
PPP Public Private Partnership
RAF Royal Air Force
RAP Resettlement Action Plan
R/C or RC Reinforced Concrete
R/D Record of Discussion
RFP Request for Proposal
RICS Road Inventory and Condition Survey
RMG Rail Mounted Gantry Crane
RMRCC Regional Maritime Rescue Co-ordination Center
RTG Rubber Tired Gantry Crane
Ro/Ro Roll on/ Roll off
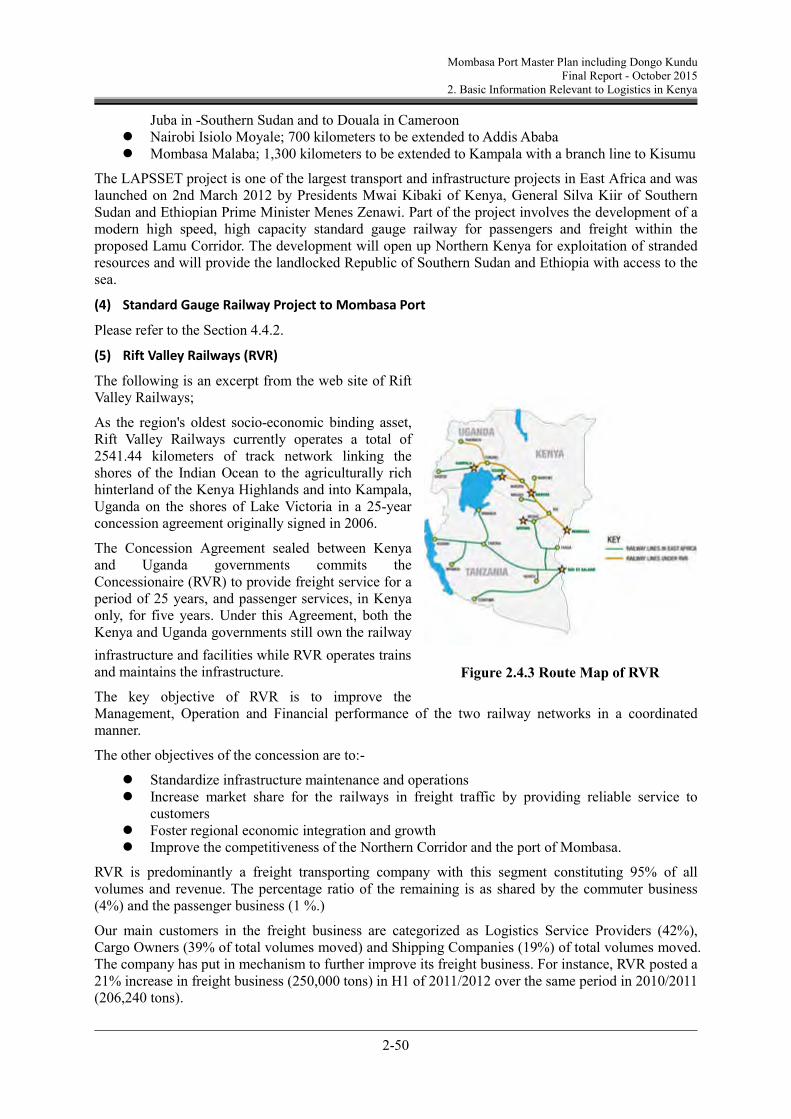
RVR Rift Valley Railway
RVRK Rift Valley Railway Kenya Ltd.
RVRU Rift Valley Railway Uganda Ltd.
SADC Southern African Development Community
SAPROF Special Assistance for Project Formation
SAP/ERP Enterprise Resource Planning Software by SAP
SARPs ICAO Standards and Recommended Practices
S/C Ship Convenience
SCEA Shippers Council of East Africa
SCT Single Custom Territory
SEA Strategic Environmental Assessment
SEZ Special Economic Zone
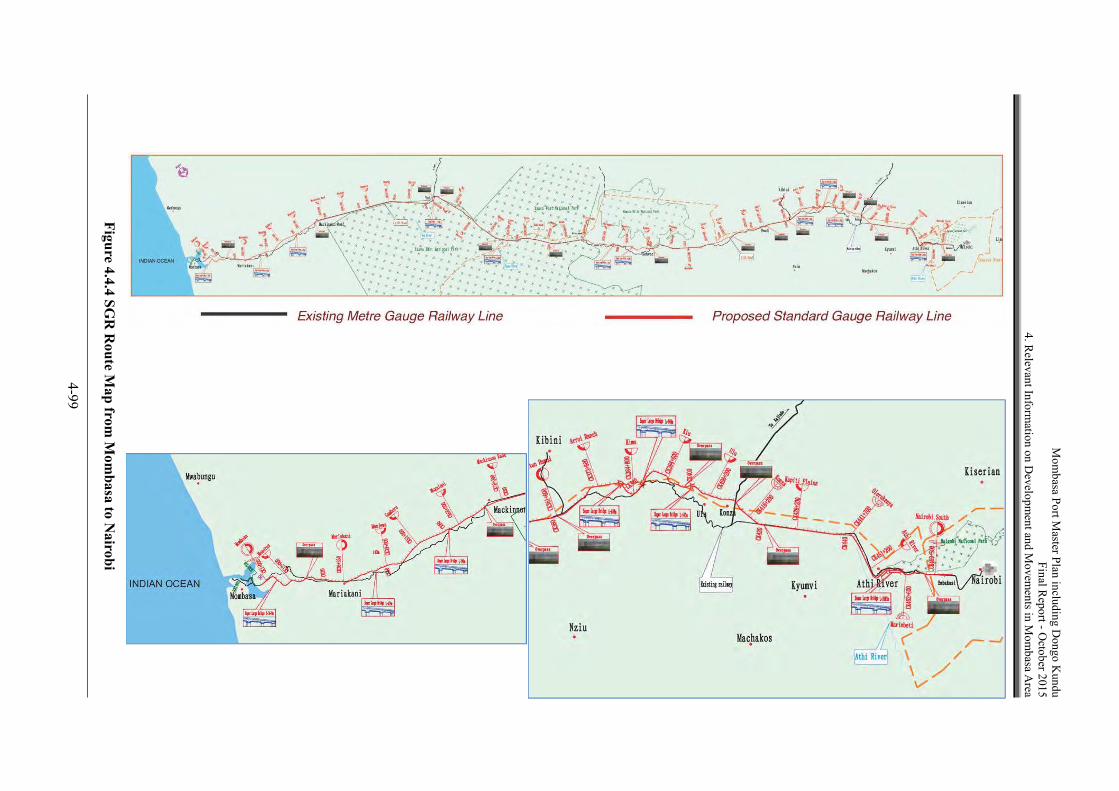
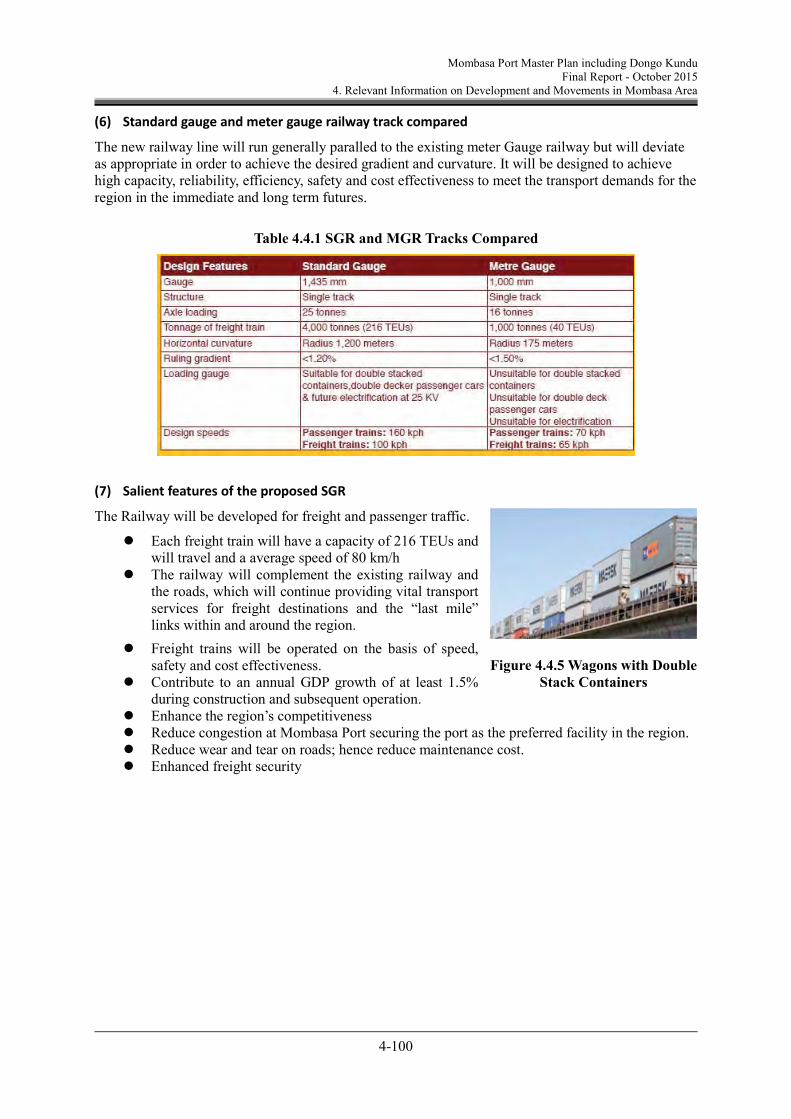
SGR Standard Gauge Railway
SME Small and Medium Enterprise
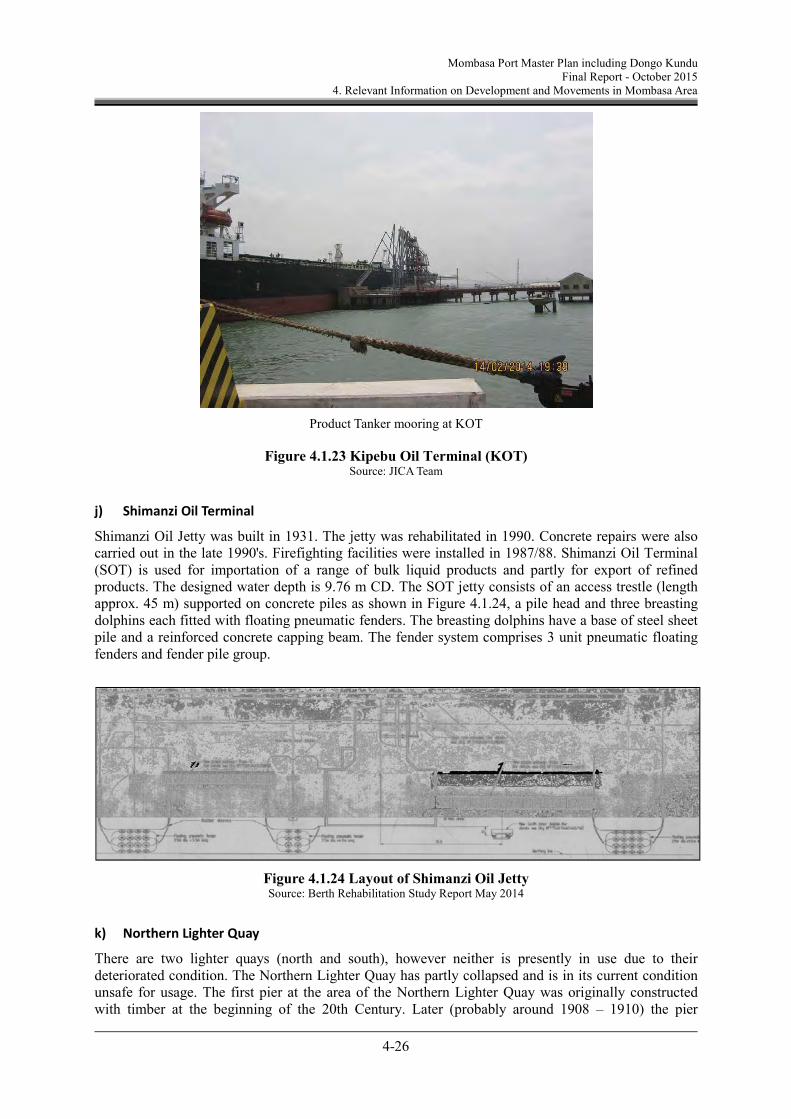
SOT Shimanzi Oil Terminal
Abbreviation Description
SRM Supplier Relationship Management
SSG Ship to Shore Gantry Crane
STS Ship to Shore
TEU Twenty-Foot Equivalent Unit
TMEA Trademark East Africa
TPA Tanzania Port Authority
TSCPHF Technical Standard and Commentaries for Port and Harbor Facilities
TTCA-NC Northern Corridor Transit Transport Coordination Authority
TWG Technical Working Group
UN United Nations
UNCTAD United Nations Conference on Trade and Development
UNESCO United Nations Educational, Scientific and Cultural Organization
UNRA Uganda National Road Authority
URC Uganda Railway Corporation
USAID United States Agency for International Development
VOR VHF Omni Directional Radio Range
VTMS Vessel Traffic Management System
VTMIS Vessel Traffic Management Information System
VTS Vessel Traffic Service
WACC Weighted Average Cost of Capital
WAN Wide Area Network
WB World Bank
WBS Work Breakdown Structure
WFP World Food Program
WKPE Western Kenya Pipeline Extension
WOMESA Association of Women in the Maritime Sector in East and South Africa
Mombasa Port Master Plan including Dongo Kundu Final Report – October 2015
Executive Summary
i
Executive Summary
Contents
1. Background and objectives of the Project ....................................................................................... 1 1.1 Purpose of the project .............................................................................................................. 1 1.2 Overall goal .............................................................................................................................. 1 1.3 Project purpose......................................................................................................................... 1 1.4 Outputs ..................................................................................................................................... 1
2. Maritime Traffic in East Africa ........................................................................................................ 2 2.1 Djibouti Port............................................................................................................................. 2
2.1.1 Comparison between berth capacity at Djibouti and Mombasa ports .............................. 3 2.1.2 Main regular services ....................................................................................................... 3
2.2 Tanzania ................................................................................................................................... 4 2.3 Mozambique ............................................................................................................................ 5 2.4 Category and type of vessels calling at major East African ports ............................................ 7
3. Current Port Master Plan (2009) ...................................................................................................... 9 3.1 Review of traffic forecast ......................................................................................................... 9 3.2 Review of proposals in the current master plan ....................................................................... 9
4. Current Situation of Mombasa Port ............................................................................................... 13 4.1 Throughput in Mombasa Port ................................................................................................ 13
4.2 Number of arriving and departing ships ................................................................................ 18 4.3 Current Issues of Mombasa Port ............................................................................................ 20
4.3.1 Excessively high berth occupancy ratio (B.O.R) followed by long waiting time for berthing .......................................................................................................................... 20
4.3.2 Excessive mixture of various commodities followed by low cargo handling productivity ........................................................................................................................................ 21
8.2 Facility Development Plan and Improvement Plan ............................................................... 31 8.2.1 Up to 2020 ...................................................................................................................... 31 8.2.2 2021-2025 ....................................................................................................................... 31 8.2.3 2026-2030 ....................................................................................................................... 33 8.2.4 2031-2035 ....................................................................................................................... 35
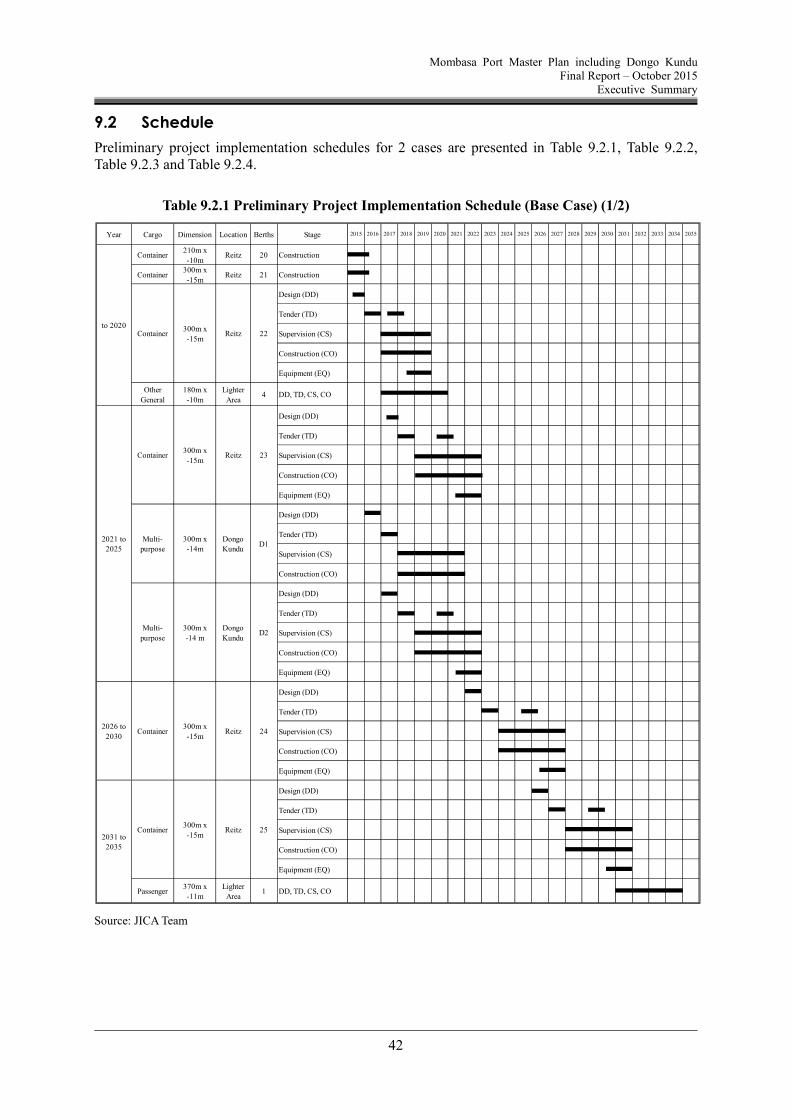
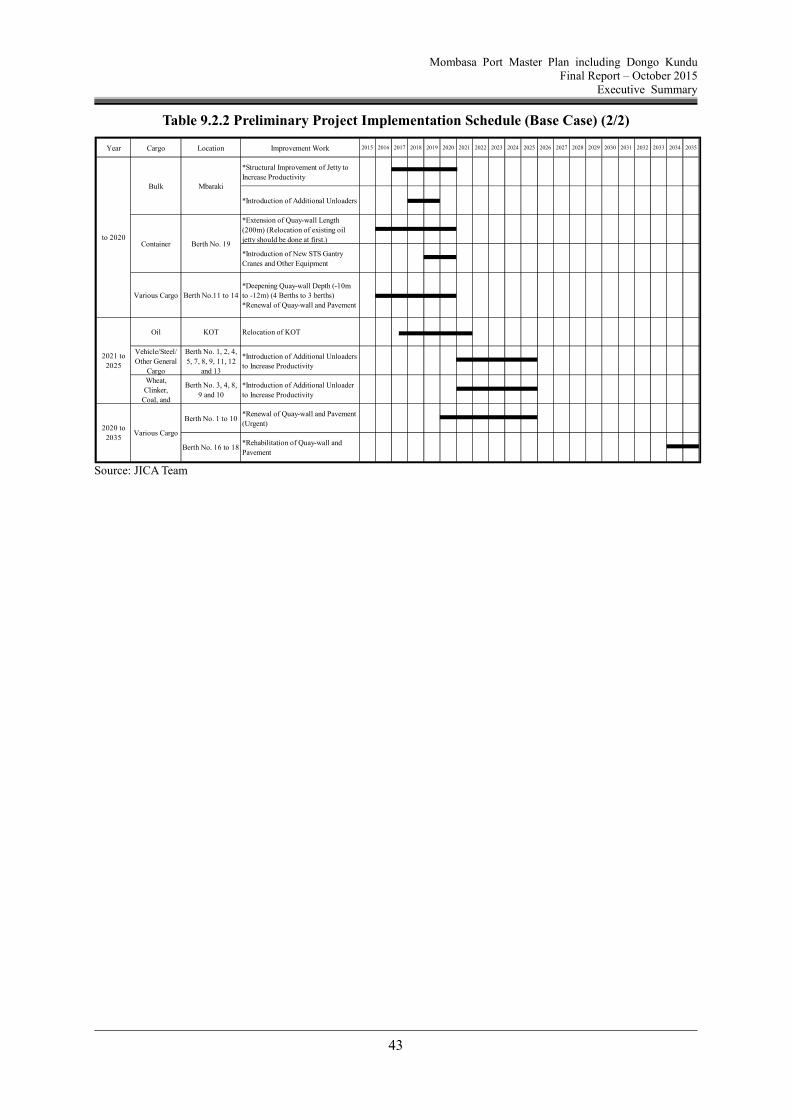
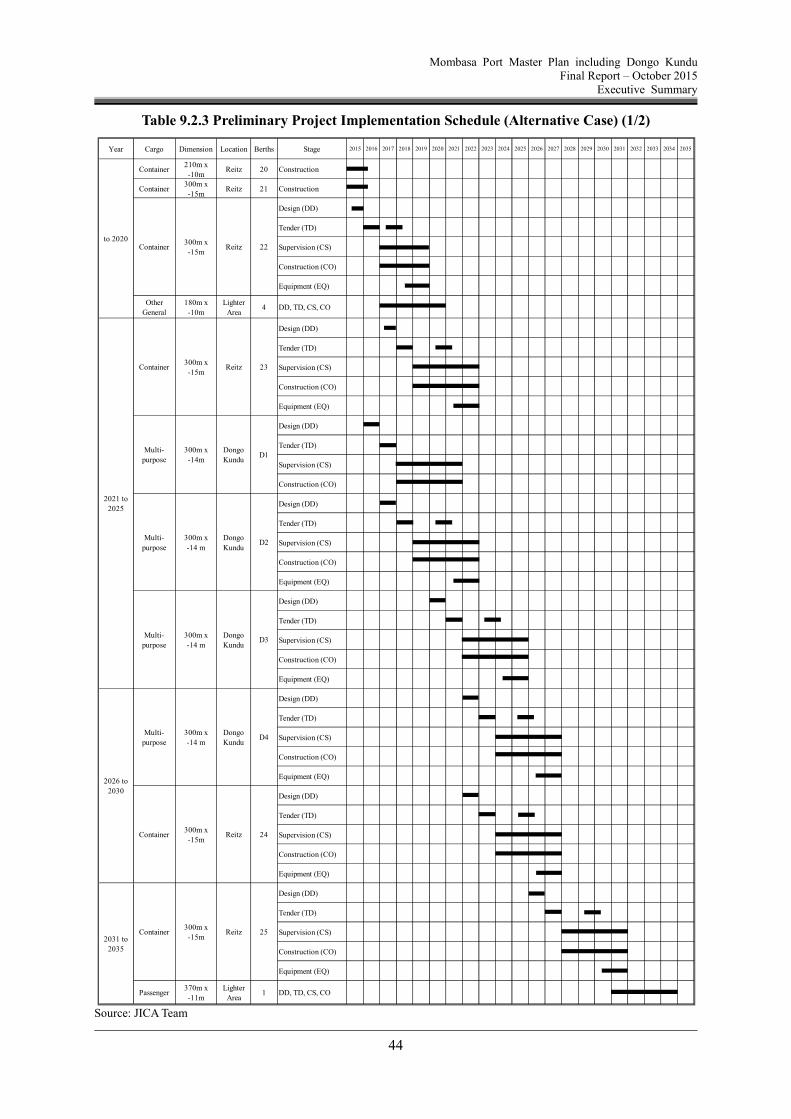
9. Implementation of Port Development ............................................................................................ 37 9.1 Cost ........................................................................................................................................ 37 9.2 Schedule ................................................................................................................................. 42 9.3 Economic analysis ................................................................................................................. 46
Mombasa Port Master Plan including Dongo Kundu Final Report – October 2015
10. Environmental and Social Considerations ..................................................................................... 48 10.1 Necessity of Mangrove reforestation ..................................................................................... 48 10.2 Consideration of cumulative impacts on ecosystems............................................................. 48 10.3 Measures for increase in pollution load ................................................................................. 48 10.4 Involuntary resettlement ........................................................................................................ 49 10.5 Potential damage to fisheries ................................................................................................. 49 10.6 Sacred place with social and cultural values .......................................................................... 49
11. Administrative and Management Issue .......................................................................................... 50 11.1 Strengthen port administration and coordination power of MOTI ........................................ 50 11.2 Establishment of Port Division in MOTI and enactment of a new Port Act .......................... 50 11.3 Transformation to landlord port ............................................................................................. 50 11.4 Realistic PPP model in Mombasa Port ................................................................................... 51 11.5 Single window and new gate system ..................................................................................... 51
12. Conclusion and Recommendations ................................................................................................ 52 12.1 Current Situation and Issues of Mombasa Port ...................................................................... 52
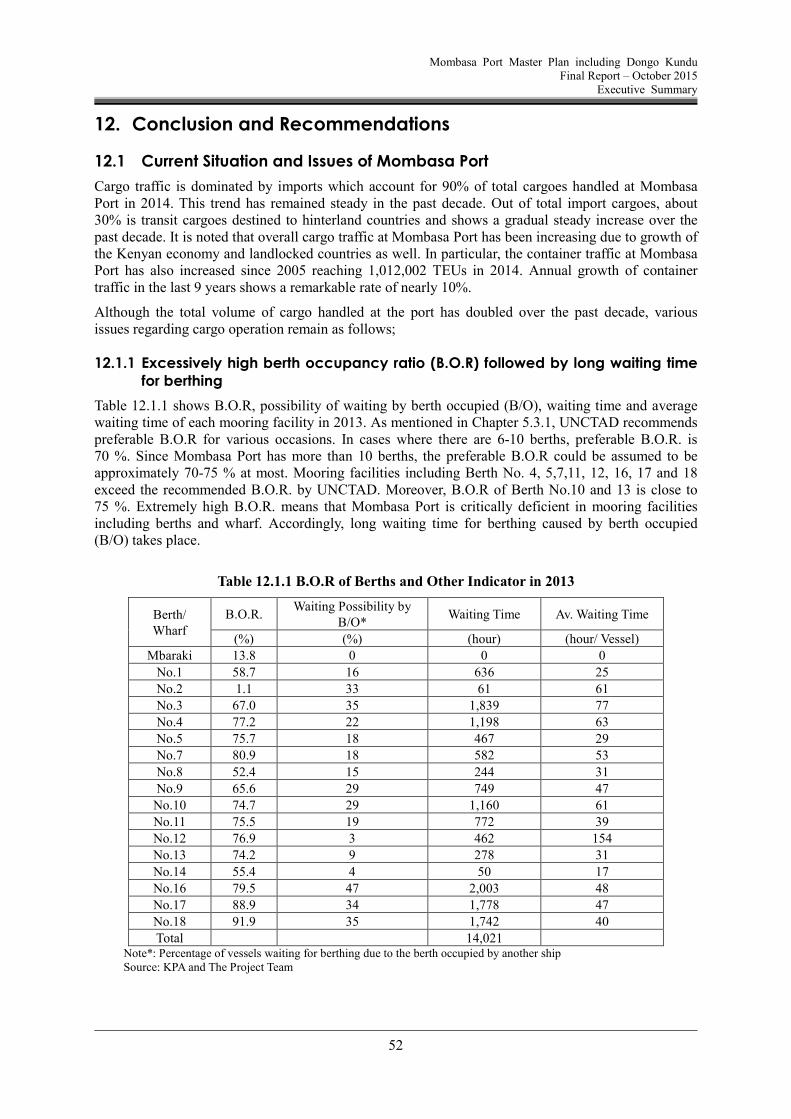
12.1.1 Excessively high berth occupancy ratio (B.O.R) followed by long waiting time for berthing .......................................................................................................................... 52
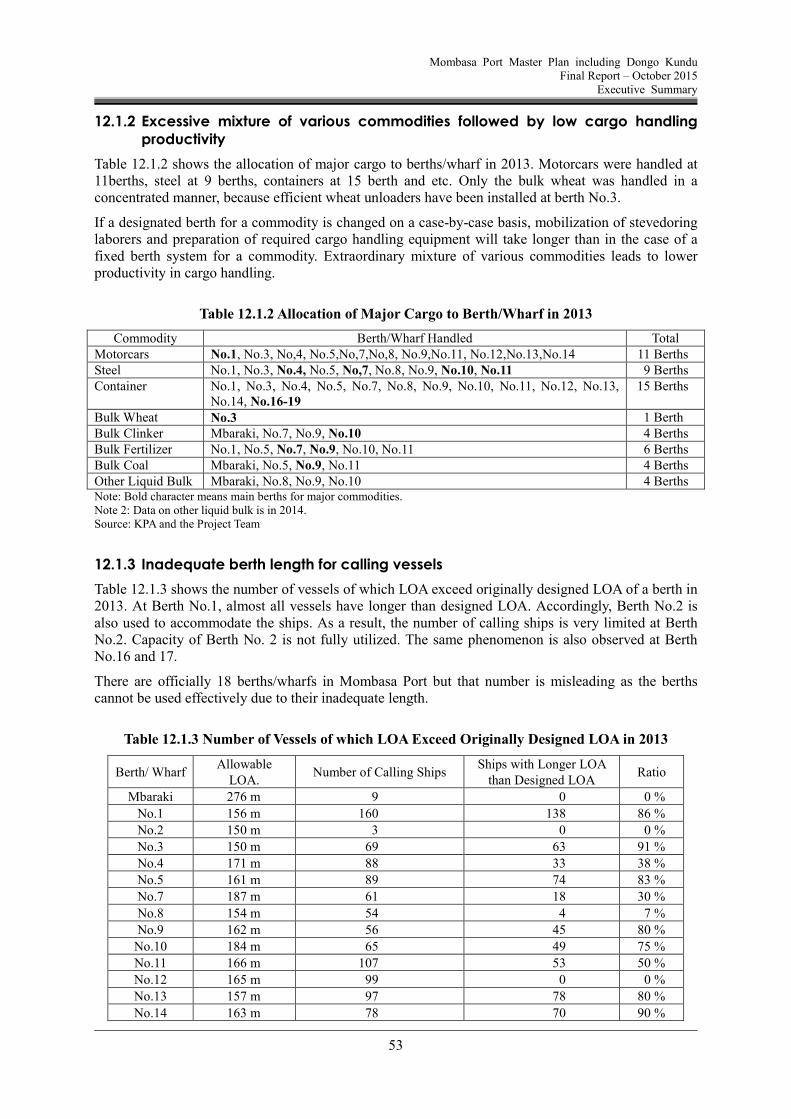
12.1.2 Excessive mixture of various commodities followed by low cargo handling productivity ........................................................................................................................................ 53
12.2 Mombasa Port Master Plan .................................................................................................... 56 12.2.1 Basic policies and strategies of port development and management .............................. 56 12.2.2 Facility development and improvement plan ................................................................. 59 12.2.3 Administrative development........................................................................................... 64
12.3 Recommendations .................................................................................................................. 65 12.3.1 Efficient port operation ................................................................................................... 65 12.3.2 Improvement of gate system........................................................................................... 65 12.3.3 Harmonization of road and railway ................................................................................ 65 12.3.4 Channel dredging, reclamation and environmental mitigation ....................................... 66 12.3.5 Master plan adjustment in every 5 years ........................................................................ 66 12.3.6 Strengthen port administration and coordination power of MOTI ................................. 66 12.3.7 Establishment of Port Division in MOTI and enactment of a new Port Act .................. 66 12.3.8 Study on new international port development plan in Kenya ......................................... 66
Mombasa Port Master Plan including Dongo Kundu Final Report – October 2015
Executive Summary
1
1. Background and objectives of the Project
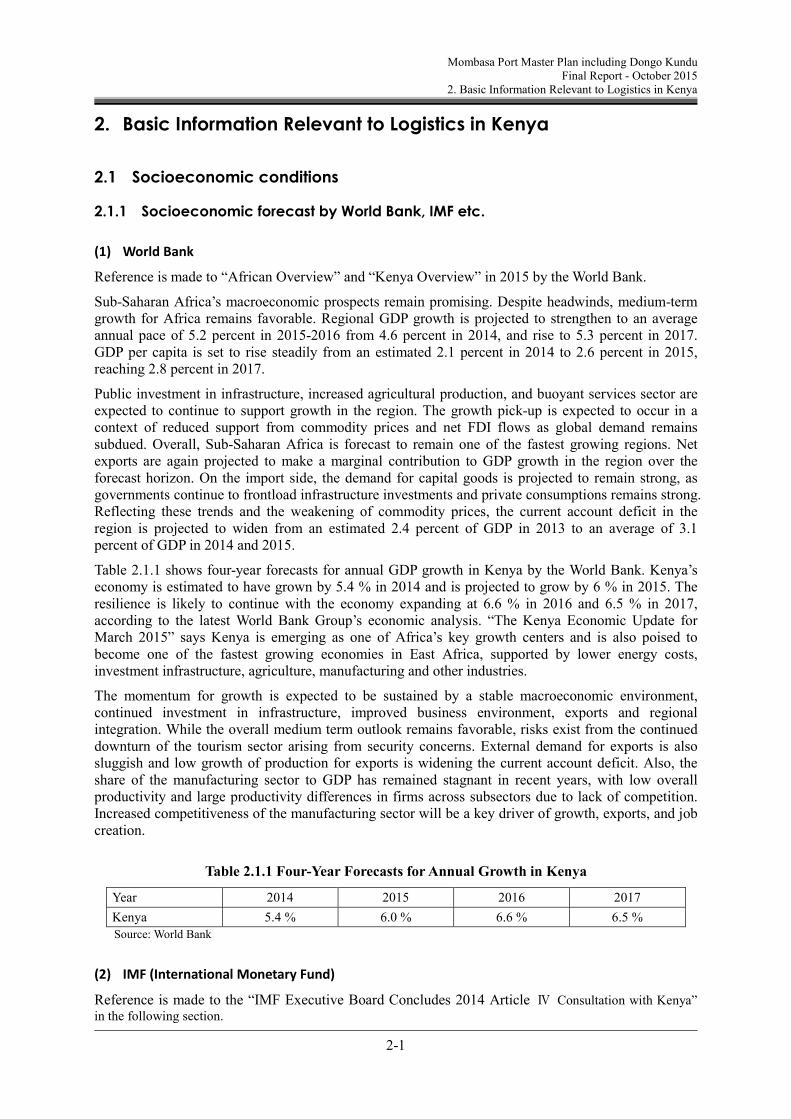
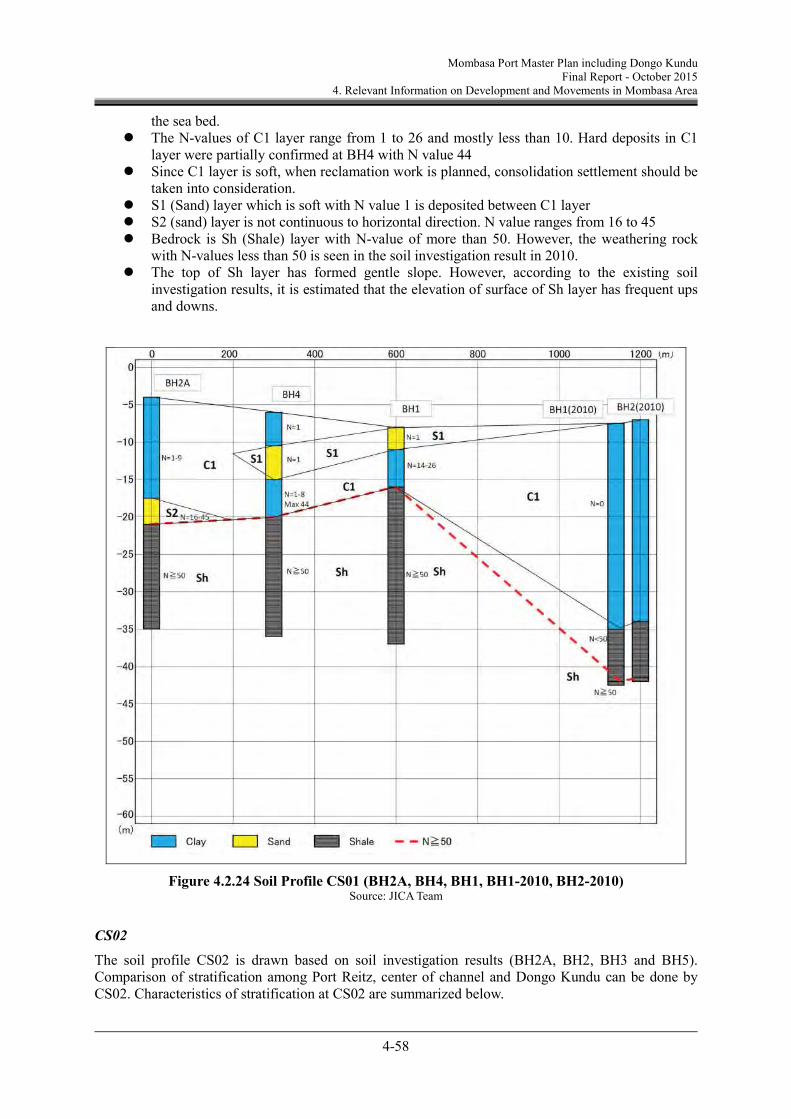
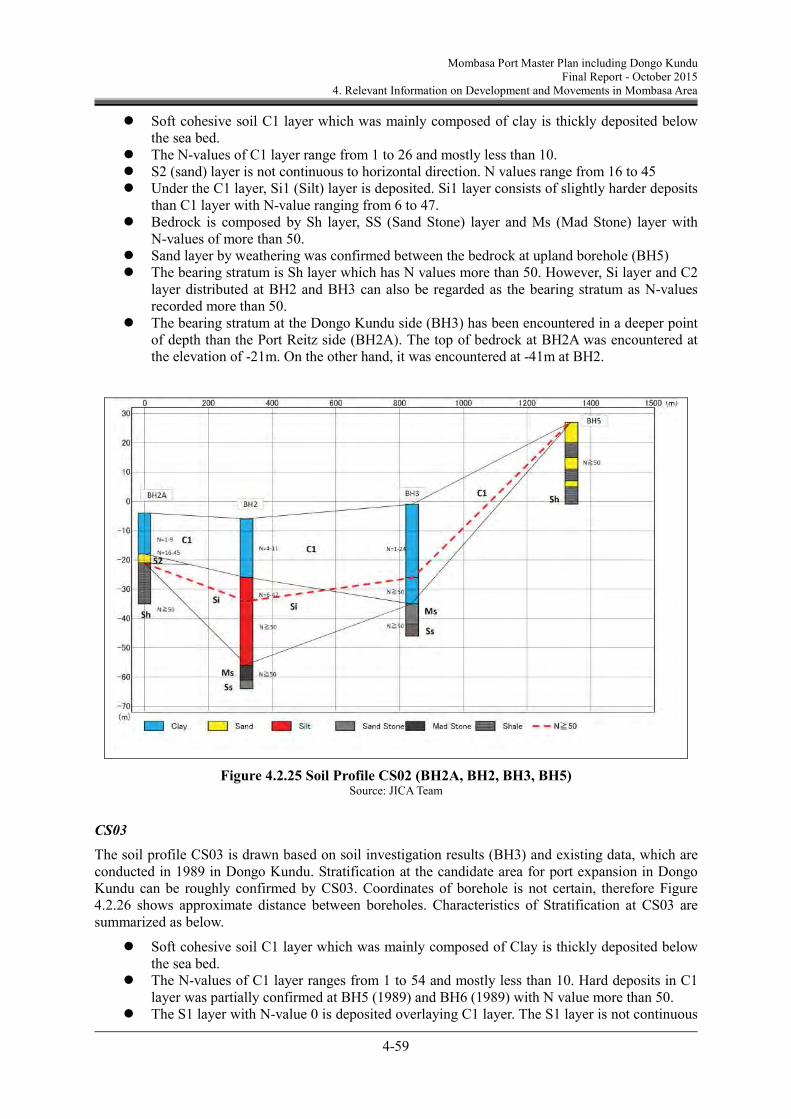
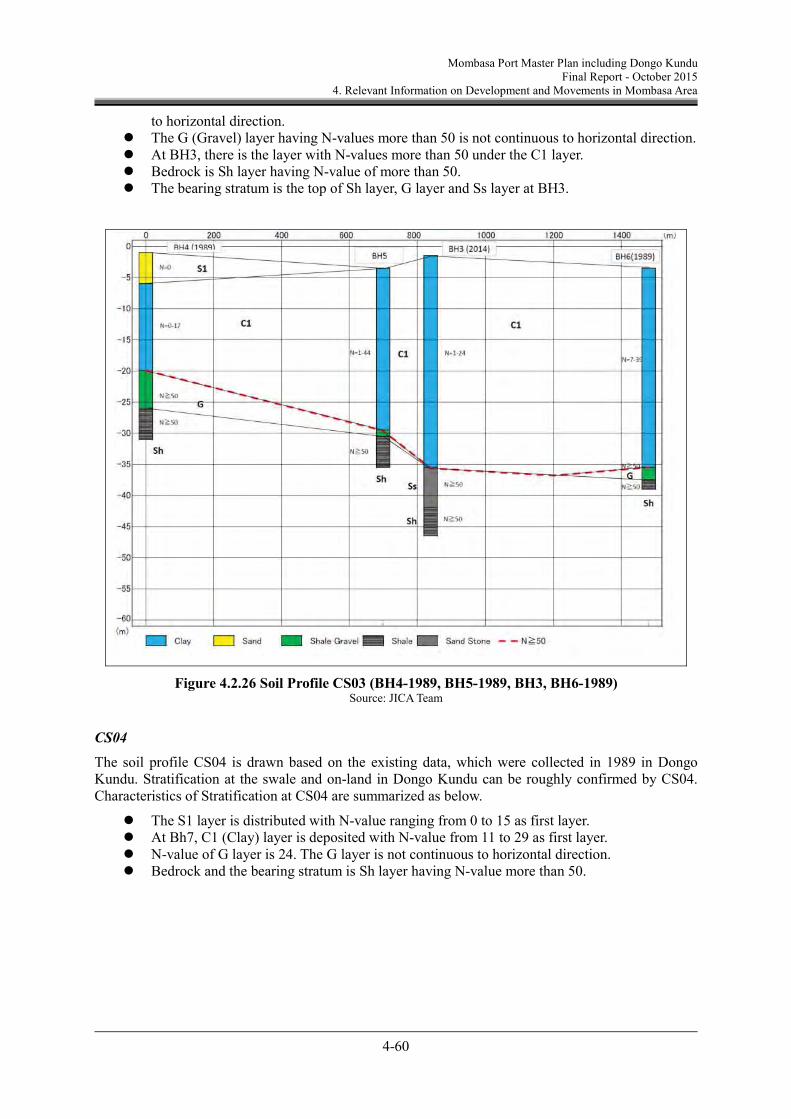
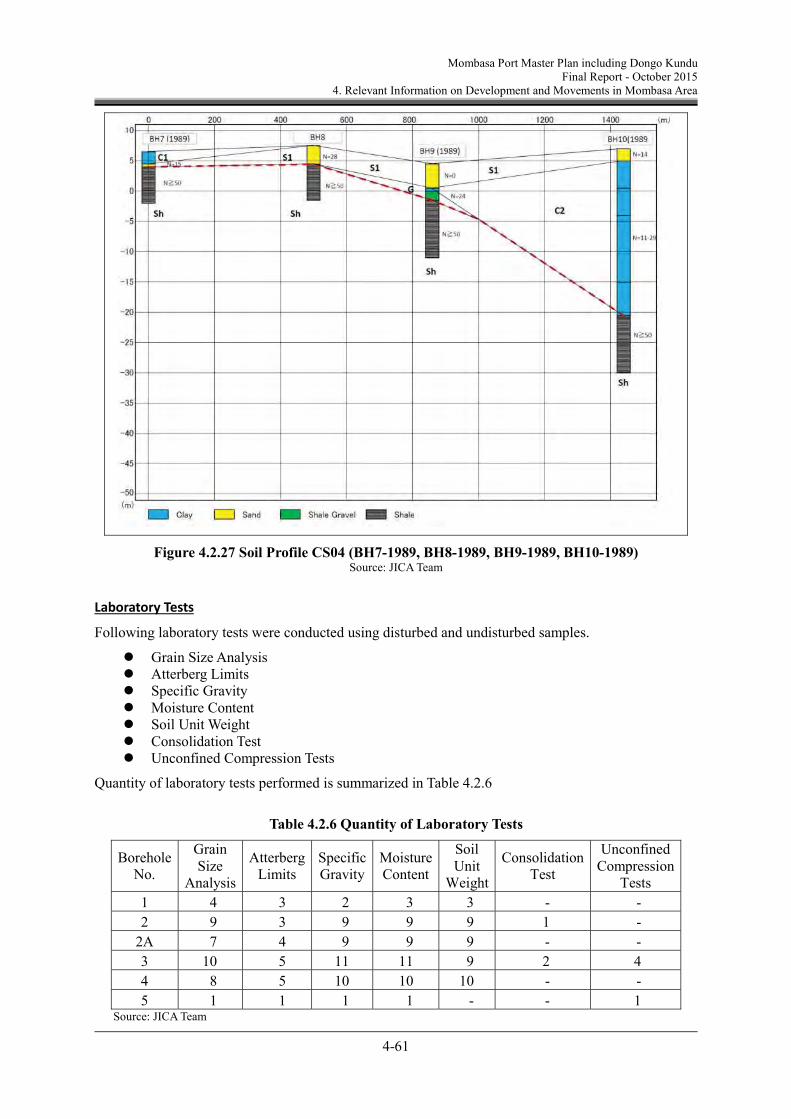
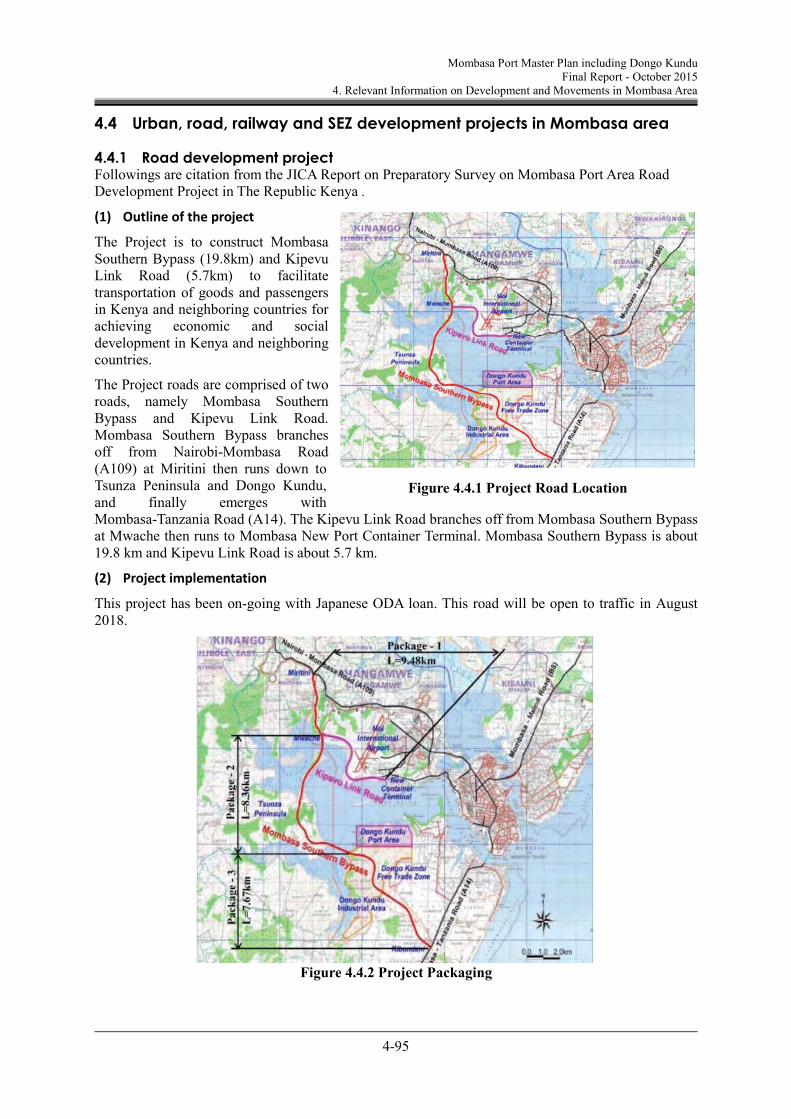
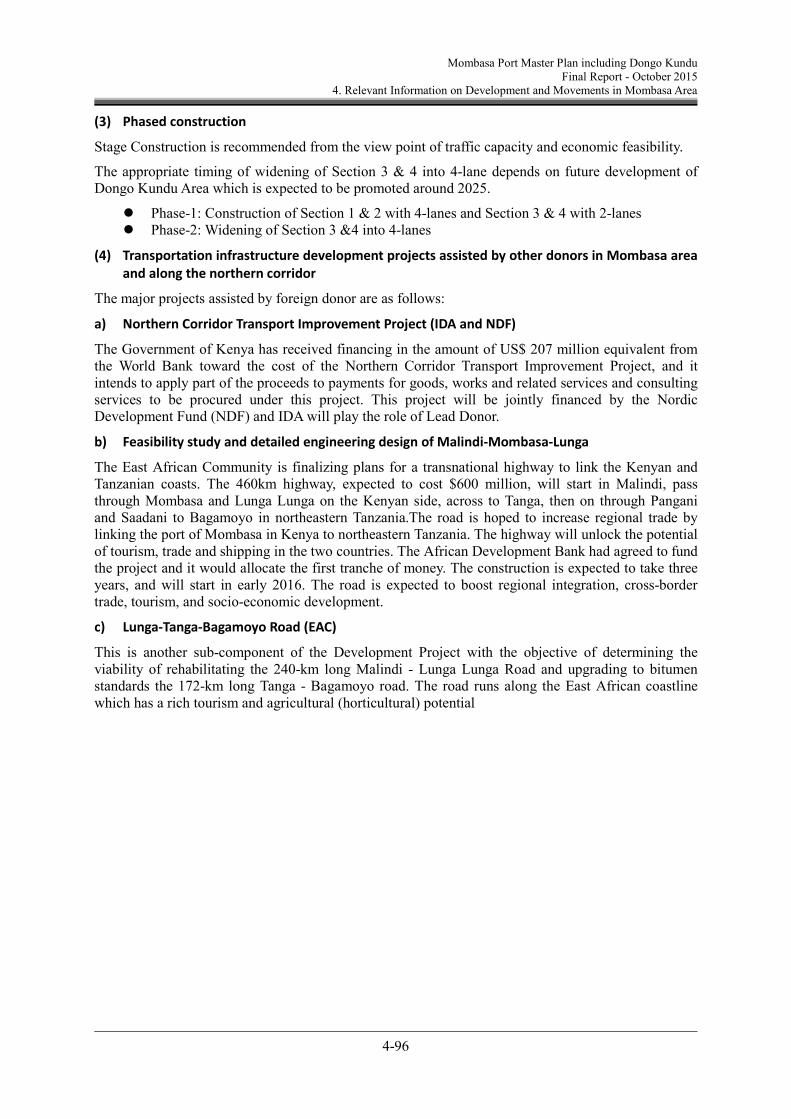
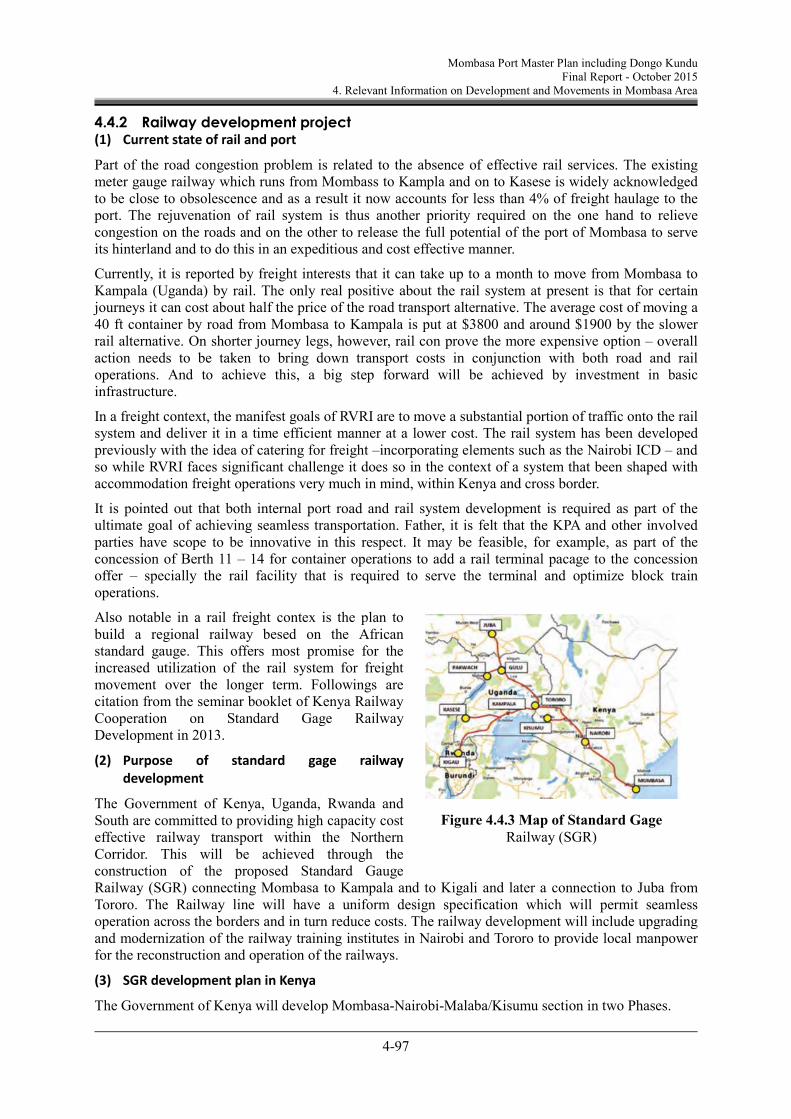
Mombasa Port, located in Mombasa City, is the largest port in the East Africa region. Mombasa port is used not only for the trade of Kenya, but also for inland countries such as Uganda and Rwanda. Due to the rapid economic development in the region and the increasing container handling volume, the Japan International Cooperation Agency (hereinafter referred to as “JICA”) is supporting Kenya Ports Authority (hereinafter referred to as “KPA”) in expanding the container terminal on the northern side of the port under the “Mombasa Port Development Project” (hereinafter referred to as “MPDP”) of which a loan agreement was signed in November 2007 for the amount of 26.7 billion Japanese Yen. In addition, at the request of the Government of Kenya (hereinafter referred to as “GOK”), JICA commenced “The Project on Master plan for Development of Dongo Kundu, Mombasa Special Economic Zone” which is expected to contribute to the acceleration of economic growth in Kenya and the East African region.
In recent years, the cargo handling volume of Mombasa port has been increasing much more than forecast. Taking the current situation into consideration, it is required to formulate the Master Plan for the Development of Mombasa Port which contains the vision and concept of Mombasa Port development after completion of the above mentioned Yen loan project. A Detailed Planning Survey Team was dispatched to Kenya in November 2013 and held a series of discussions with Kenyan authorities on formulation of the Project. Based on the discussions, a consensus was reached on the objectives and methodology of the Project.
1.1 Purpose of the project
The project shall be implemented based on the Record of Discussions (hereinafter referred to as “RD”) signed by the Ministry of Transport and Infrastructure (hereinafter referred to as “MOTI”), KPA and JICA on May 29, 2014 including the Project Design Matrix (hereinafter referred to as “PDM”) and Plan of Operation (hereinafter referred to as “PO”).
1.2 Overall goal
For the purpose of developing Mombasa Port, projects are to be implemented in accordance with the Mombasa Port Master Plan.
1.3 Project purpose
Capacity of KPA staff regarding port development is enhanced.
1.4 Outputs
Outputs based on the PDM are as follows;
Mombasa Port Master Plan (revised in 2009 by KPA) is reviewed and revised. Strategic planning and management system in KPA is improved. Future capacity and forecast method in KPA is improved. Comprehensive Mombasa Port development implementation/investment plan is prepared.
Mombasa Port Master Plan including Dongo Kundu Final Report – October 2015
Executive Summary
2
2. Maritime Traffic in East Africa
2.1 Djibouti Port
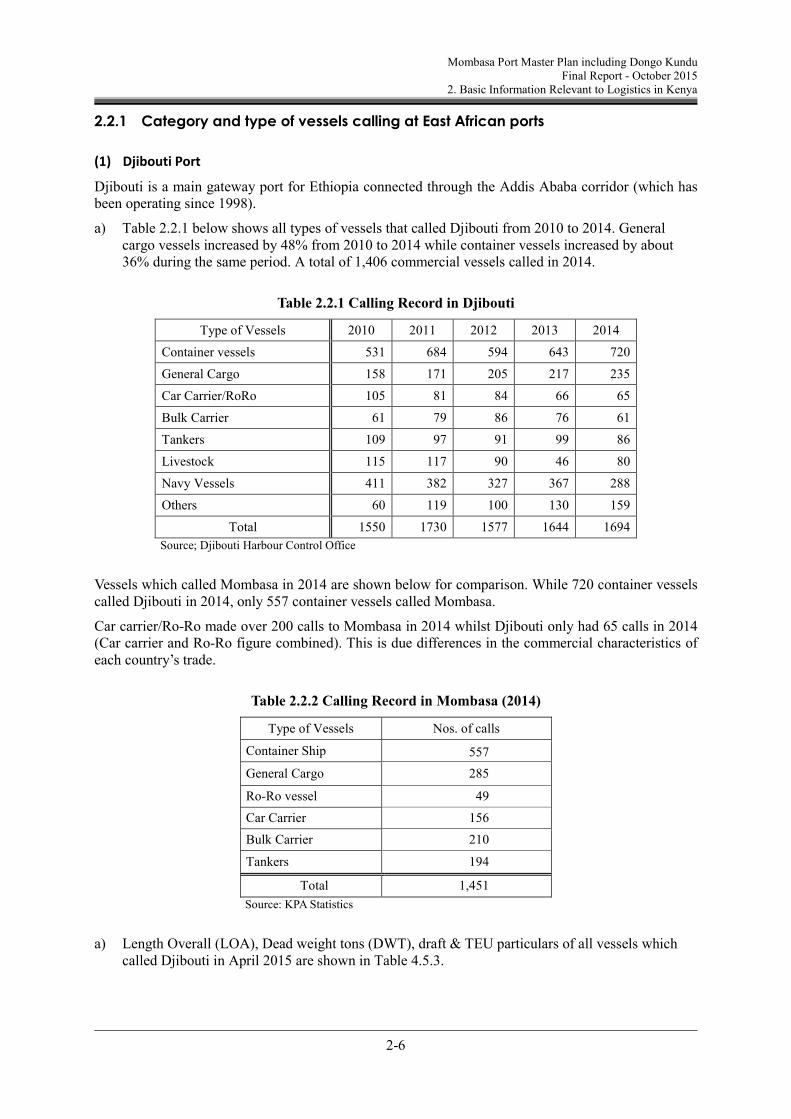
Djibouti is a main gateway port for Ethiopia connected through the Addis Ababa corridor (which has been operating since 1998).
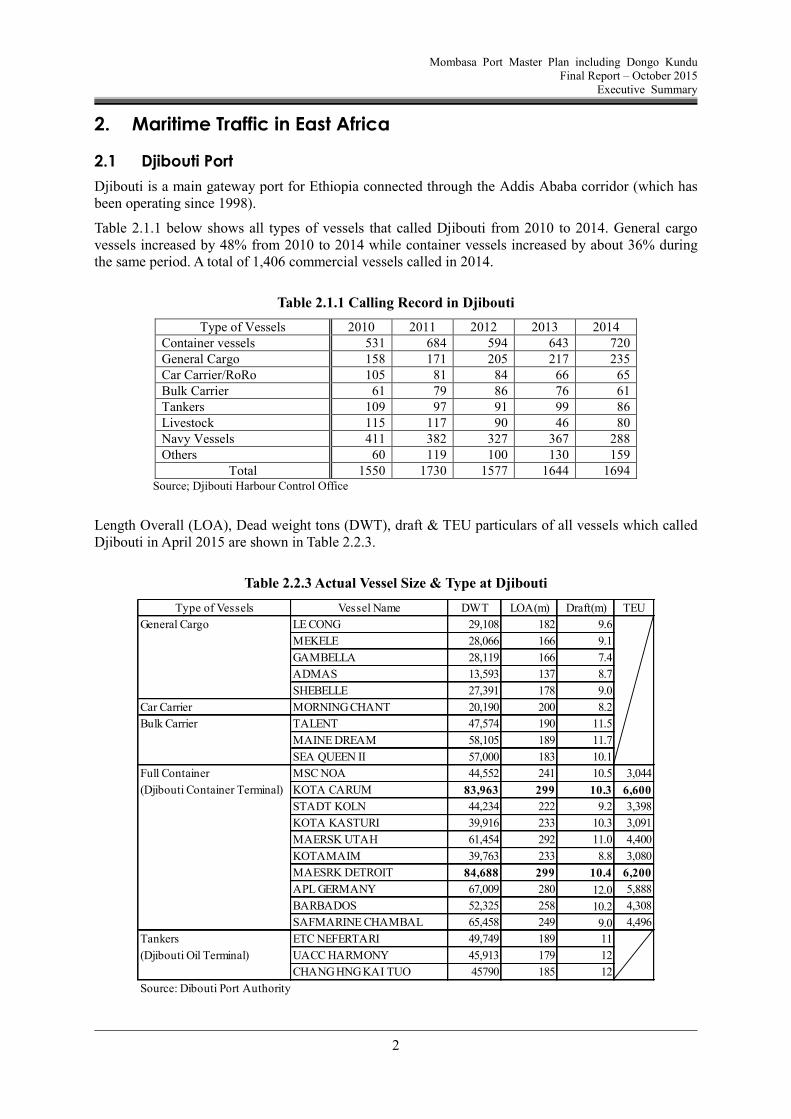
Table 2.1.1 below shows all types of vessels that called Djibouti from 2010 to 2014. General cargo vessels increased by 48% from 2010 to 2014 while container vessels increased by about 36% during the same period. A total of 1,406 commercial vessels called in 2014.
Mombasa Port Master Plan including Dongo Kundu Final Report – October 2015
Executive Summary
3
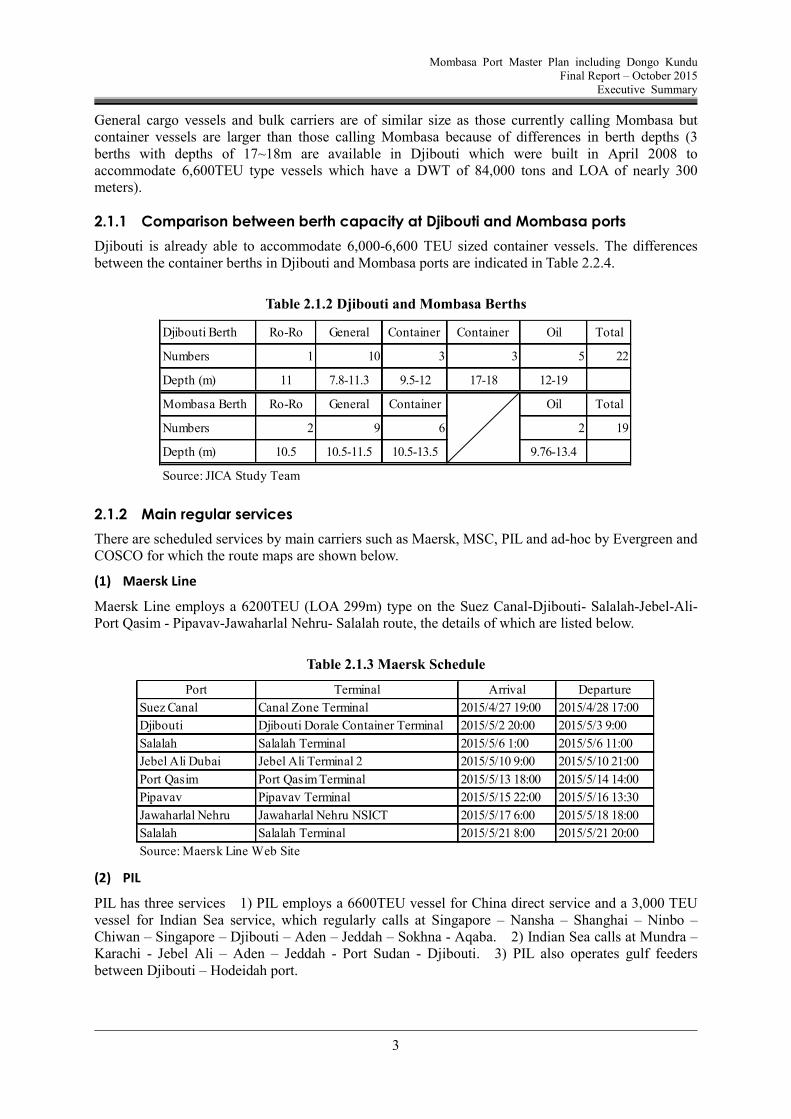
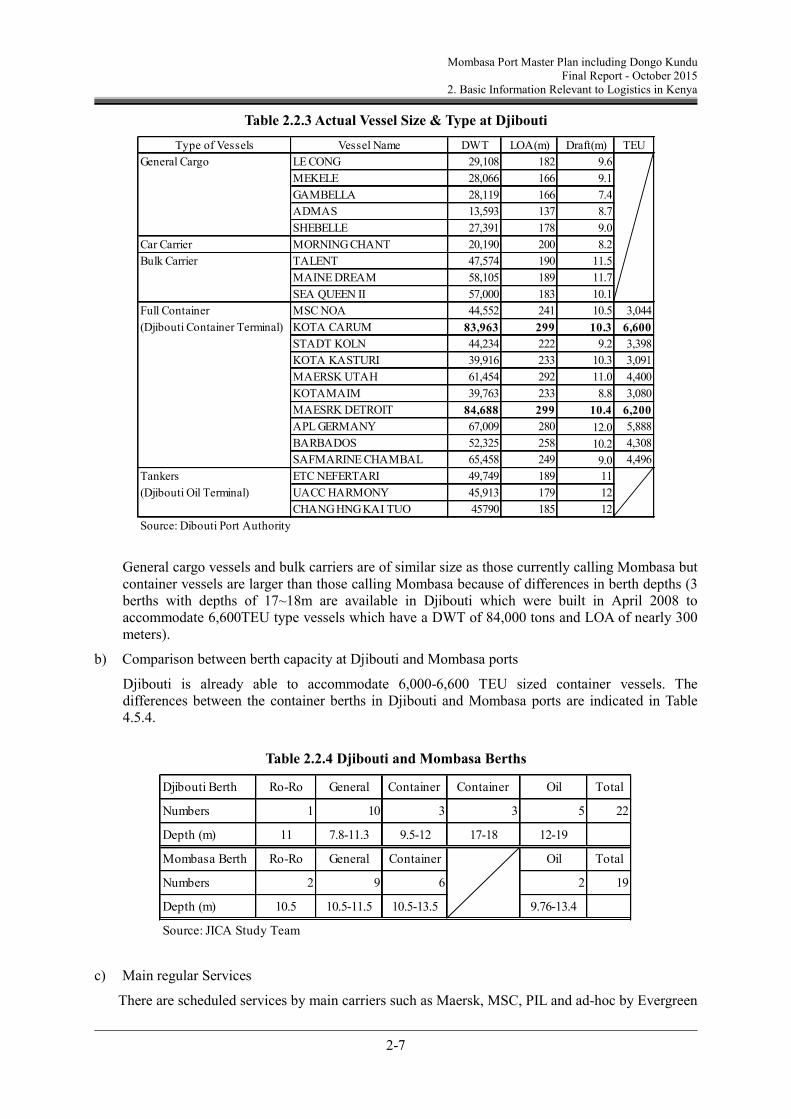
General cargo vessels and bulk carriers are of similar size as those currently calling Mombasa but container vessels are larger than those calling Mombasa because of differences in berth depths (3 berths with depths of 17~18m are available in Djibouti which were built in April 2008 to accommodate 6,600TEU type vessels which have a DWT of 84,000 tons and LOA of nearly 300 meters).
2.1.1 Comparison between berth capacity at Djibouti and Mombasa ports
Djibouti is already able to accommodate 6,000-6,600 TEU sized container vessels. The differences between the container berths in Djibouti and Mombasa ports are indicated in Table 2.2.4.
Table 2.1.2 Djibouti and Mombasa Berths
2.1.2 Main regular services
There are scheduled services by main carriers such as Maersk, MSC, PIL and ad-hoc by Evergreen and COSCO for which the route maps are shown below.
(1) Maersk Line
Maersk Line employs a 6200TEU (LOA 299m) type on the Suez Canal-Djibouti- Salalah-Jebel-Ali- Port Qasim - Pipavav-Jawaharlal Nehru- Salalah route, the details of which are listed below.
Table 2.1.3 Maersk Schedule
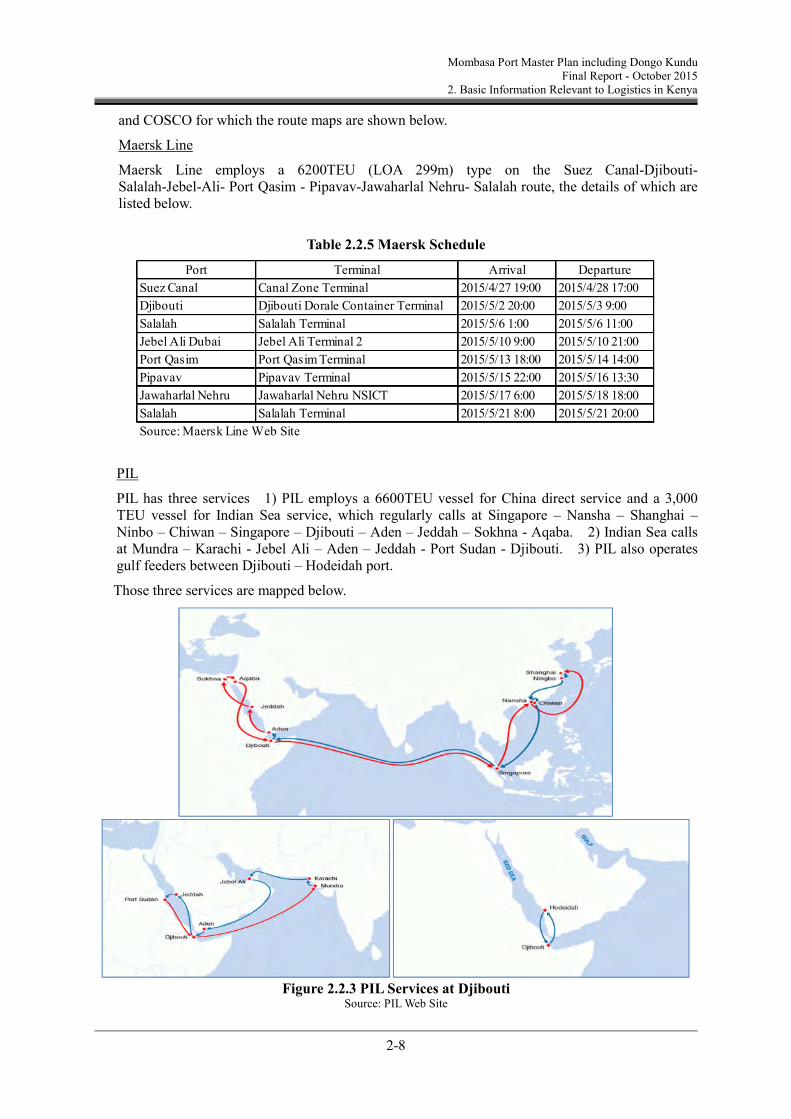
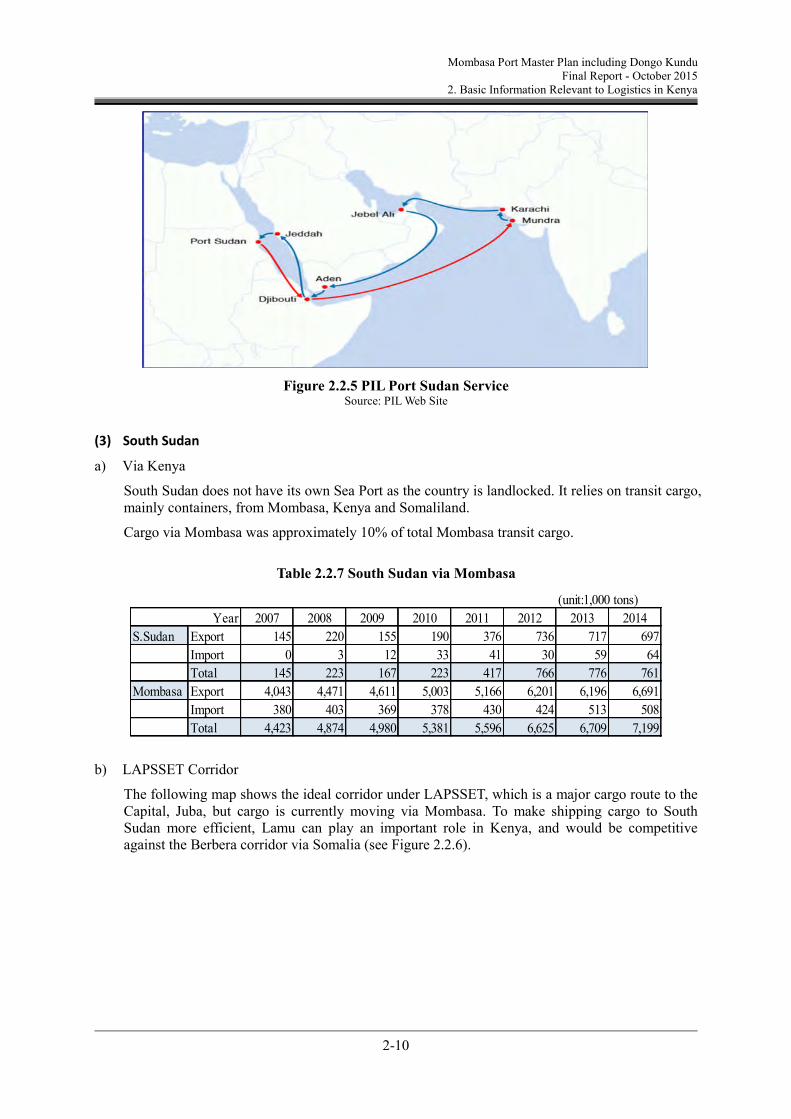
(2) PIL
PIL has three services 1) PIL employs a 6600TEU vessel for China direct service and a 3,000 TEU vessel for Indian Sea service, which regularly calls at Singapore – Nansha – Shanghai – Ninbo – Chiwan – Singapore – Djibouti – Aden – Jeddah – Sokhna - Aqaba. 2) Indian Sea calls at Mundra – Karachi - Jebel Ali – Aden – Jeddah - Port Sudan - Djibouti. 3) PIL also operates gulf feeders between Djibouti – Hodeidah port.
Djibouti Berth Ro-Ro General Container Container Oil Total
Numbers 1 10 3 3 5 22
Depth (m) 11 7.8-11.3 9.5-12 17-18 12-19
Mombasa Berth Ro-Ro General Container Oil Total
Numbers 2 9 6 2 19
Depth (m) 10.5 10.5-11.5 10.5-13.5 9.76-13.4
Source: JICA Study Team
Port Terminal Arrival Departure
Suez Canal Canal Zone Terminal 2015/4/27 19:00 2015/4/28 17:00
Mombasa Port Master Plan including Dongo Kundu Final Report – October 2015
Executive Summary
4
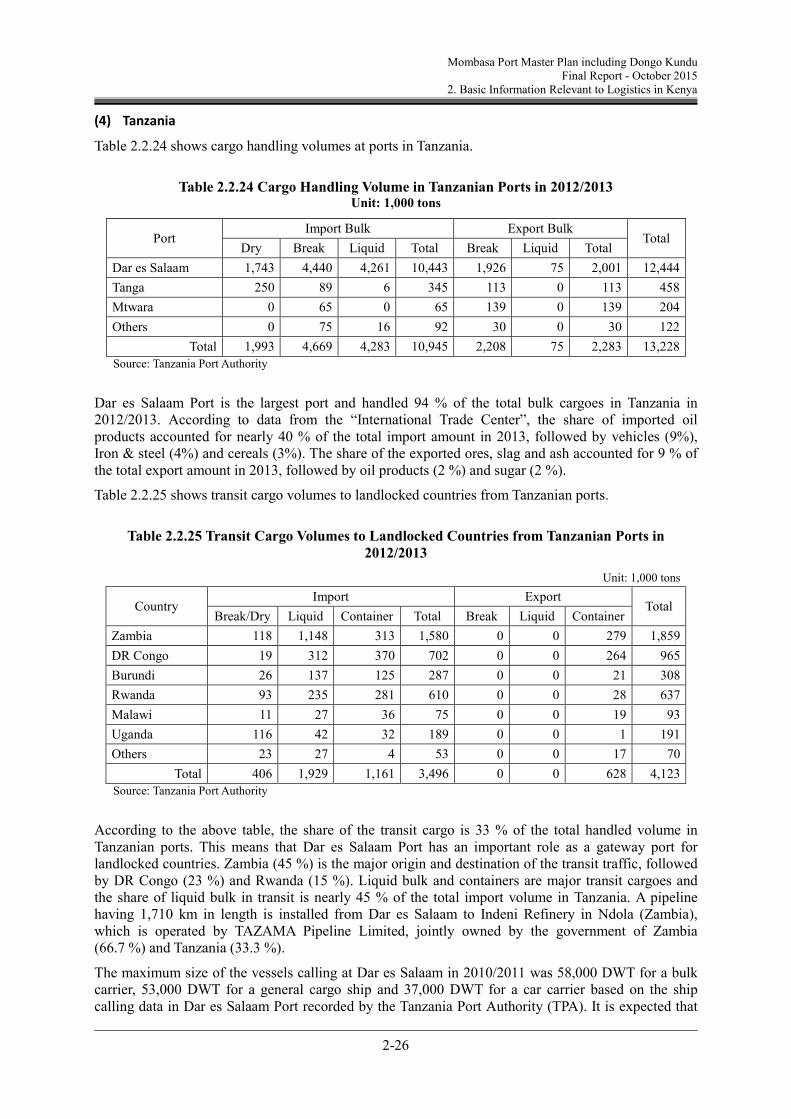
2.2 Tanzania
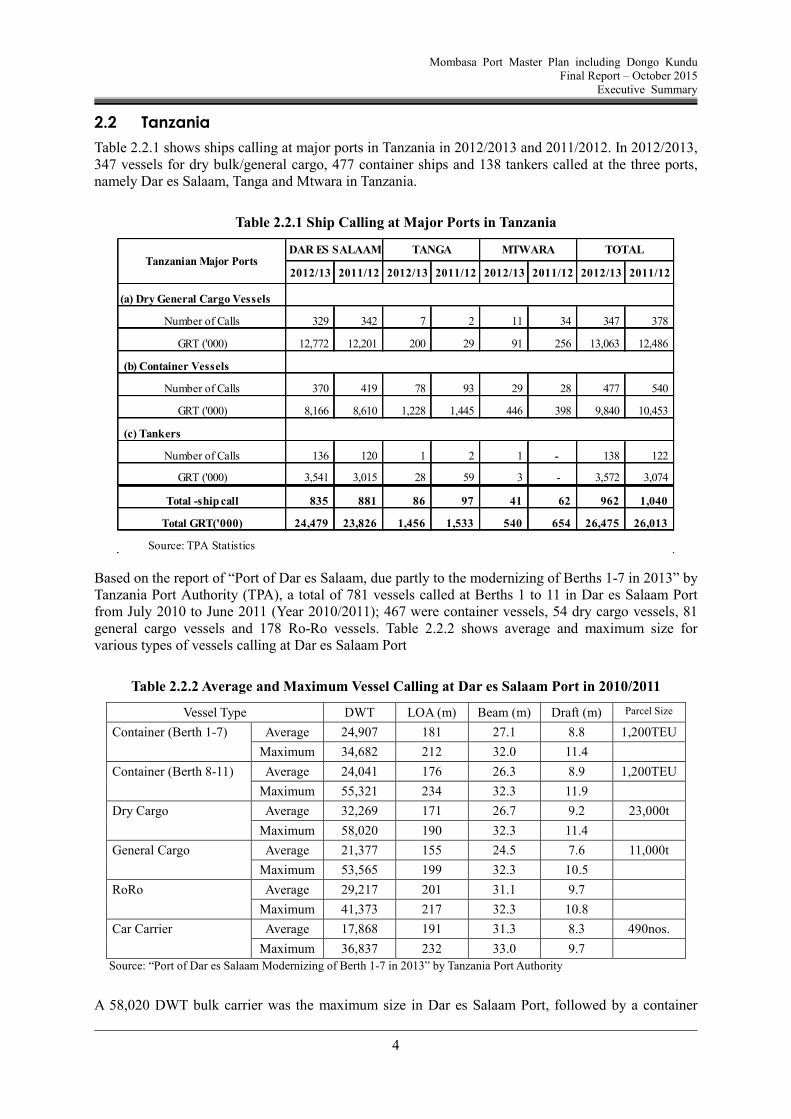
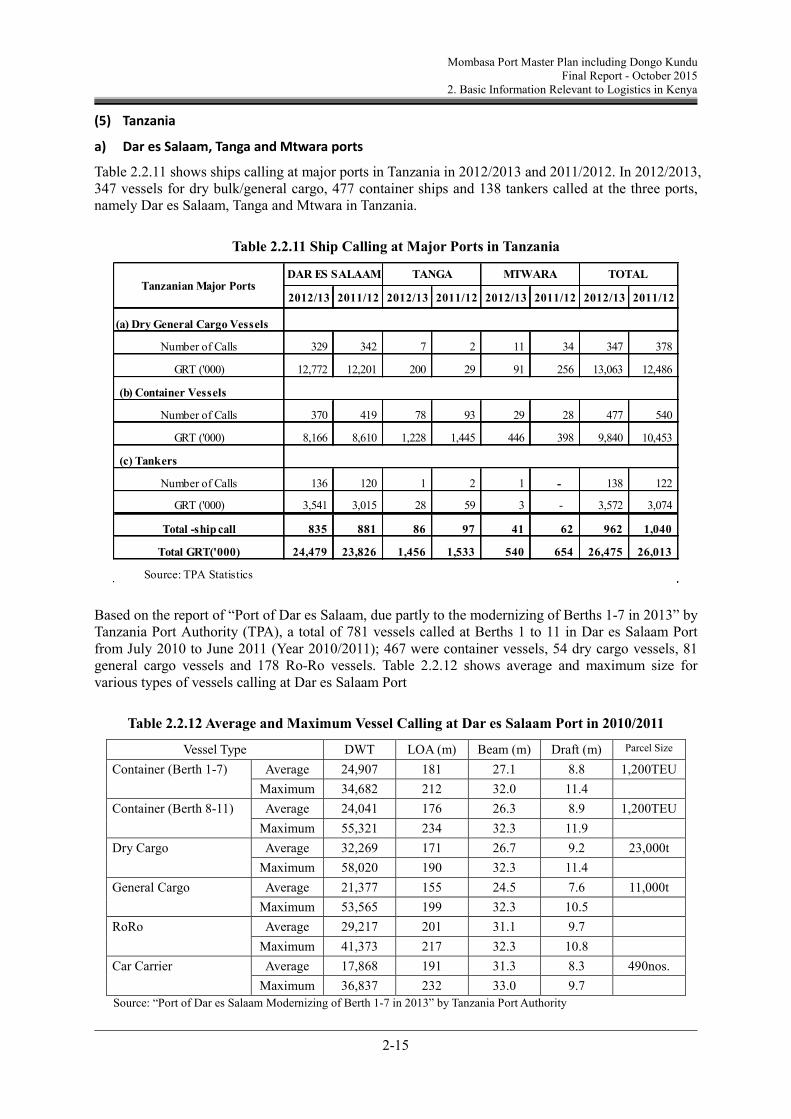
Table 2.2.1 shows ships calling at major ports in Tanzania in 2012/2013 and 2011/2012. In 2012/2013, 347 vessels for dry bulk/general cargo, 477 container ships and 138 tankers called at the three ports, namely Dar es Salaam, Tanga and Mtwara in Tanzania.
Table 2.2.1 Ship Calling at Major Ports in Tanzania
Based on the report of “Port of Dar es Salaam, due partly to the modernizing of Berths 1-7 in 2013” by Tanzania Port Authority (TPA), a total of 781 vessels called at Berths 1 to 11 in Dar es Salaam Port from July 2010 to June 2011 (Year 2010/2011); 467 were container vessels, 54 dry cargo vessels, 81 general cargo vessels and 178 Ro-Ro vessels. Table 2.2.2 shows average and maximum size for various types of vessels calling at Dar es Salaam Port
Table 2.2.2 Average and Maximum Vessel Calling at Dar es Salaam Port in 2010/2011
Vessel Type DWT LOA (m) Beam (m) Draft (m) Parcel Size
Container (Berth 1-7) Average 24,907 181 27.1 8.8 1,200TEU
Maximum 34,682 212 32.0 11.4
Container (Berth 8-11) Average 24,041 176 26.3 8.9 1,200TEU
Maximum 55,321 234 32.3 11.9
Dry Cargo Average 32,269 171 26.7 9.2 23,000t
Maximum 58,020 190 32.3 11.4
General Cargo Average 21,377 155 24.5 7.6 11,000t
Maximum 53,565 199 32.3 10.5
RoRo Average 29,217 201 31.1 9.7
Maximum 41,373 217 32.3 10.8
Car Carrier Average 17,868 191 31.3 8.3 490nos.
Maximum 36,837 232 33.0 9.7
Source: “Port of Dar es Salaam Modernizing of Berth 1-7 in 2013” by Tanzania Port Authority
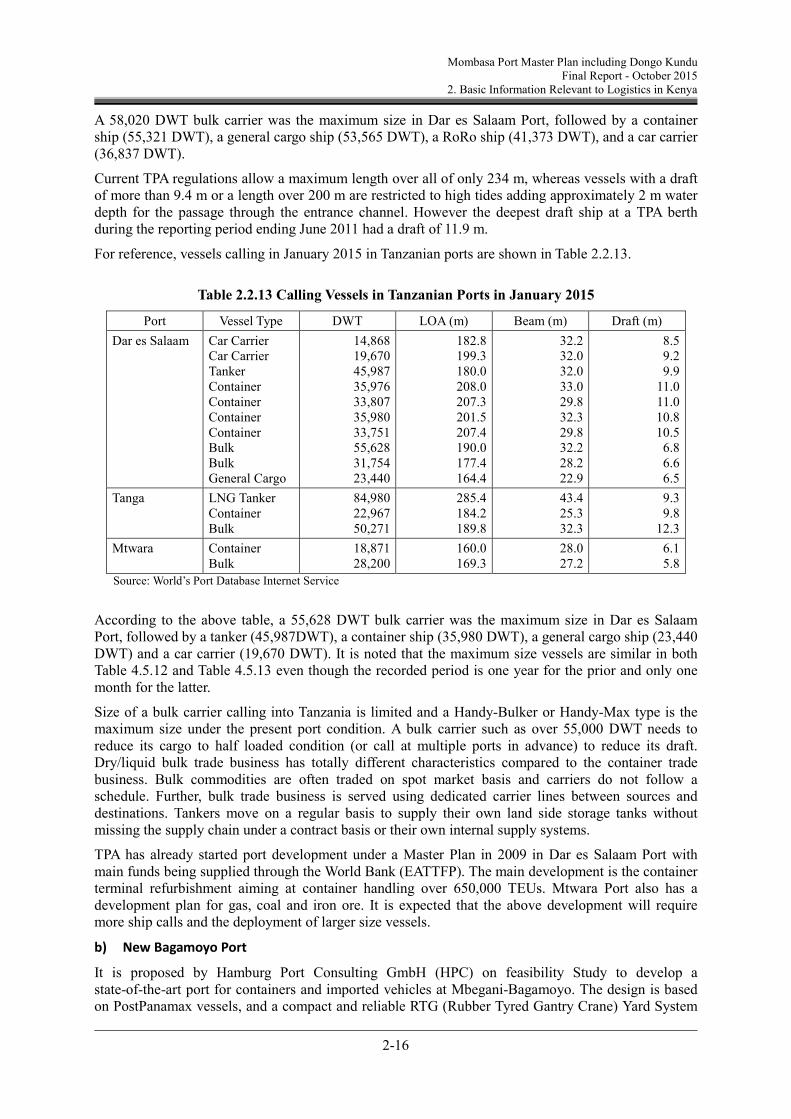
A 58,020 DWT bulk carrier was the maximum size in Dar es Salaam Port, followed by a container
Total GRT('000) 24,479 23,826 1,456 1,533 540 654 26,475 26,013
Source: TPA Statistics
DAR ES SALAAM TANGA MTWARA TOTAL Tanzanian Major Ports
Mombasa Port Master Plan including Dongo Kundu Final Report – October 2015
Executive Summary
5
ship (55,321 DWT), a general cargo ship (53,565 DWT), a RoRo ship (41,373 DWT), and a car carrier (36,837 DWT).
Current TPA regulations allow a maximum length over all of only 234 m, whereas vessels with a draft of more than 9.4 m or a length over 200 m are restricted to high tides adding approximately 2 m water depth for the passage through the entrance channel. However the deepest draft ship at a TPA berth during the reporting period ending June 2011 had a draft of 11.9 m.
Size of a bulk carrier calling into Tanzania is limited and a Handy-Bulker or Handy-Max type is the maximum size under the present port condition. A bulk carrier such as over 55,000 DWT needs to reduce its cargo to half loaded condition (or call at multiple ports in advance) to reduce its draft. Dry/liquid bulk trade business has totally different characteristics compared to the container trade business. Bulk commodities are often traded on spot market basis and carriers do not follow a schedule. Further, bulk trade business is served using dedicated carrier lines between sources and destinations. Tankers move on a regular basis to supply their own land side storage tanks without missing the supply chain under a contract basis or their own internal supply systems.
TPA has already started port development under a Master Plan in 2009 in Dar es Salaam Port with main funds being supplied through the World Bank (EATTFP). The main development is the container terminal refurbishment aiming at container handling over 650,000 TEUs. Mtwara Port also has a development plan for gas, coal and iron ore. It is expected that the above development will require more ship calls and the deployment of larger size vessels.
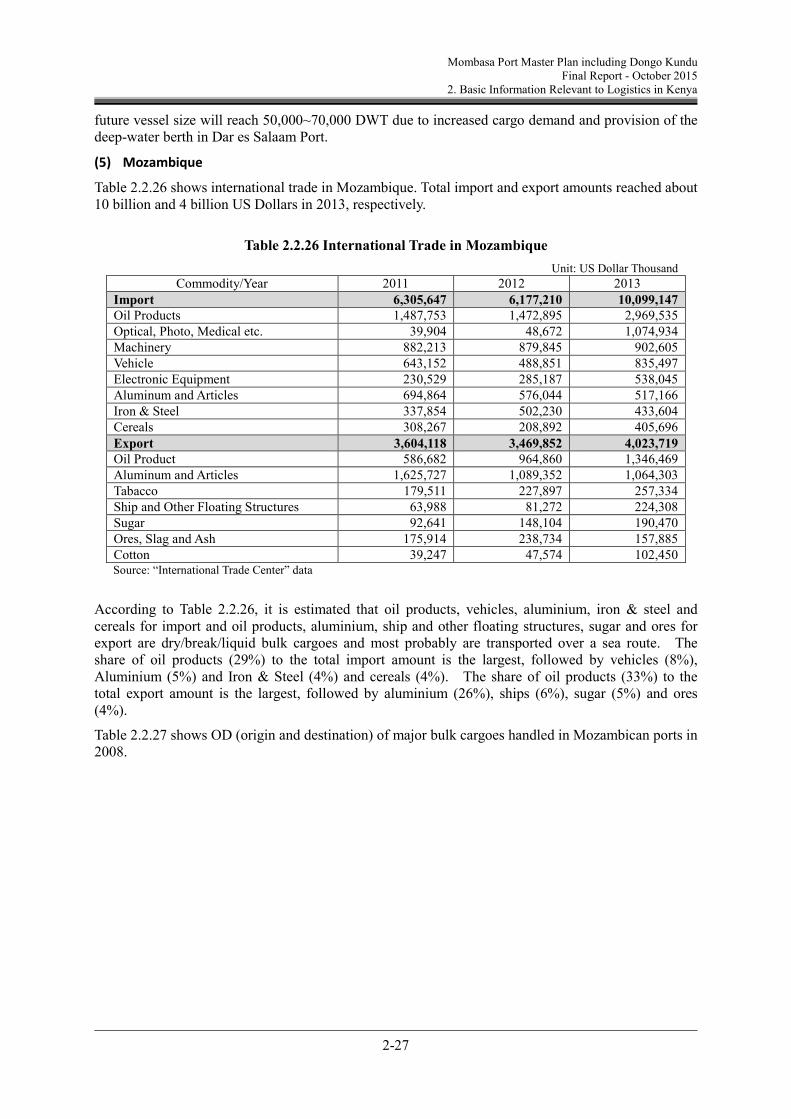
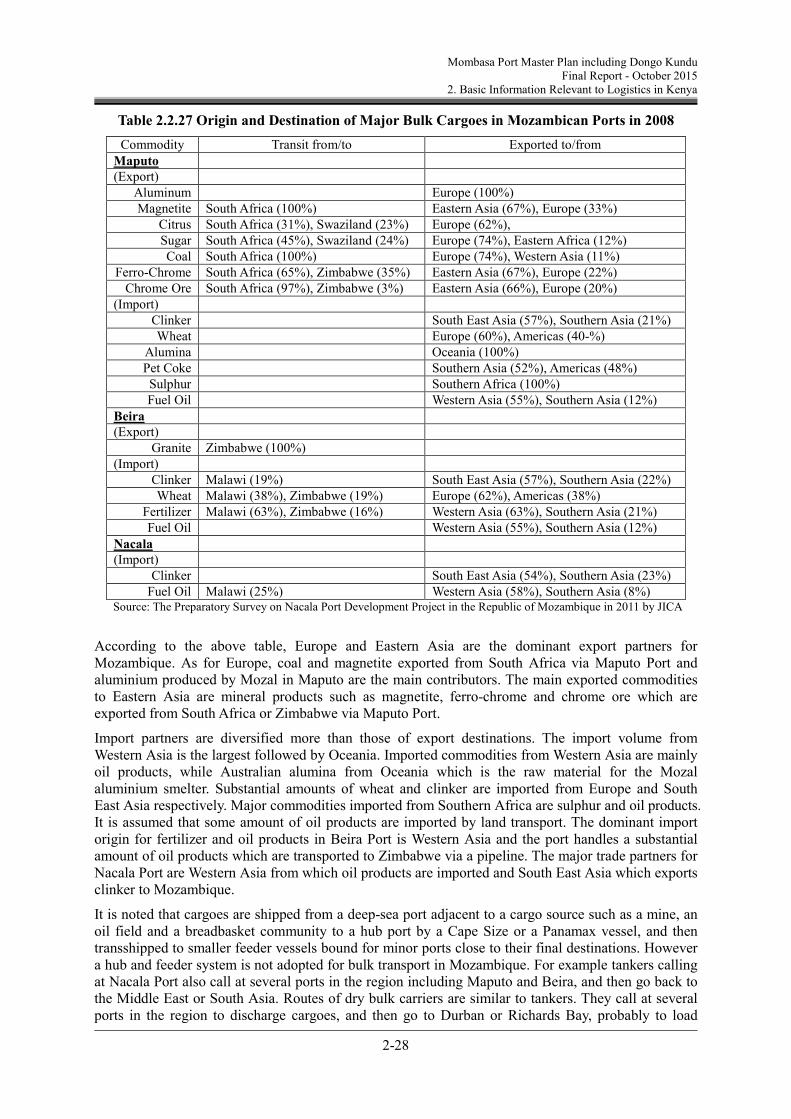
2.3 Mozambique
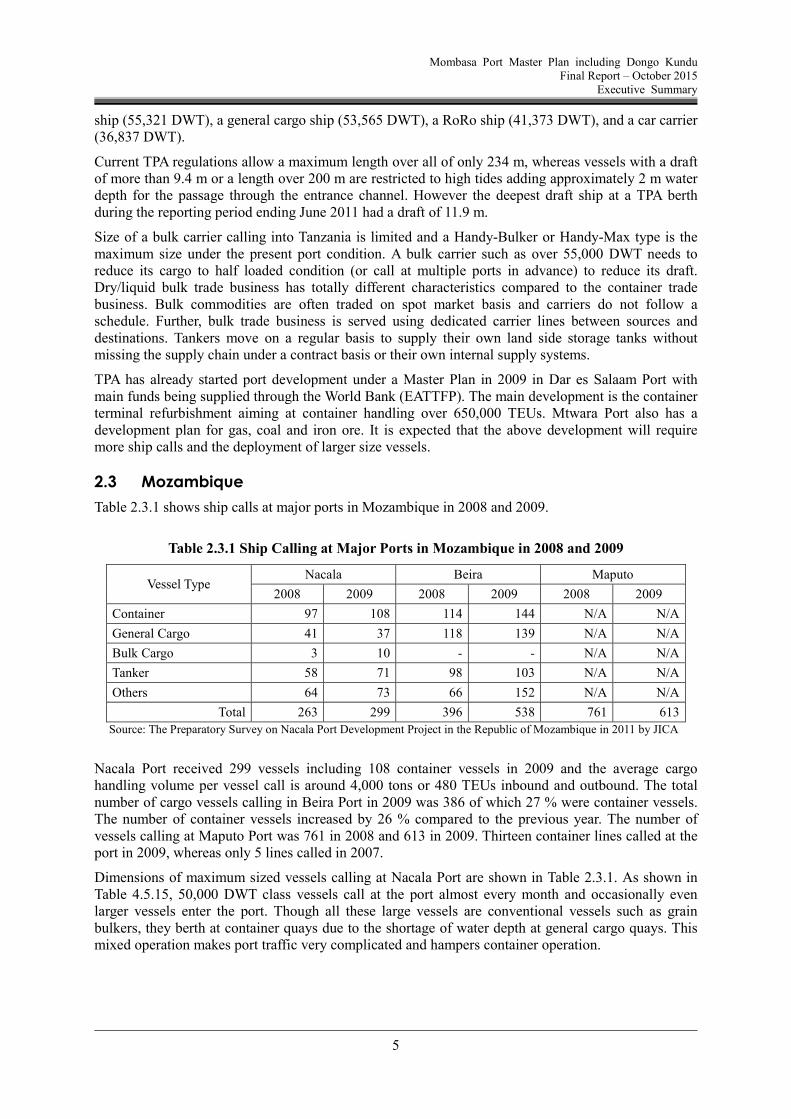
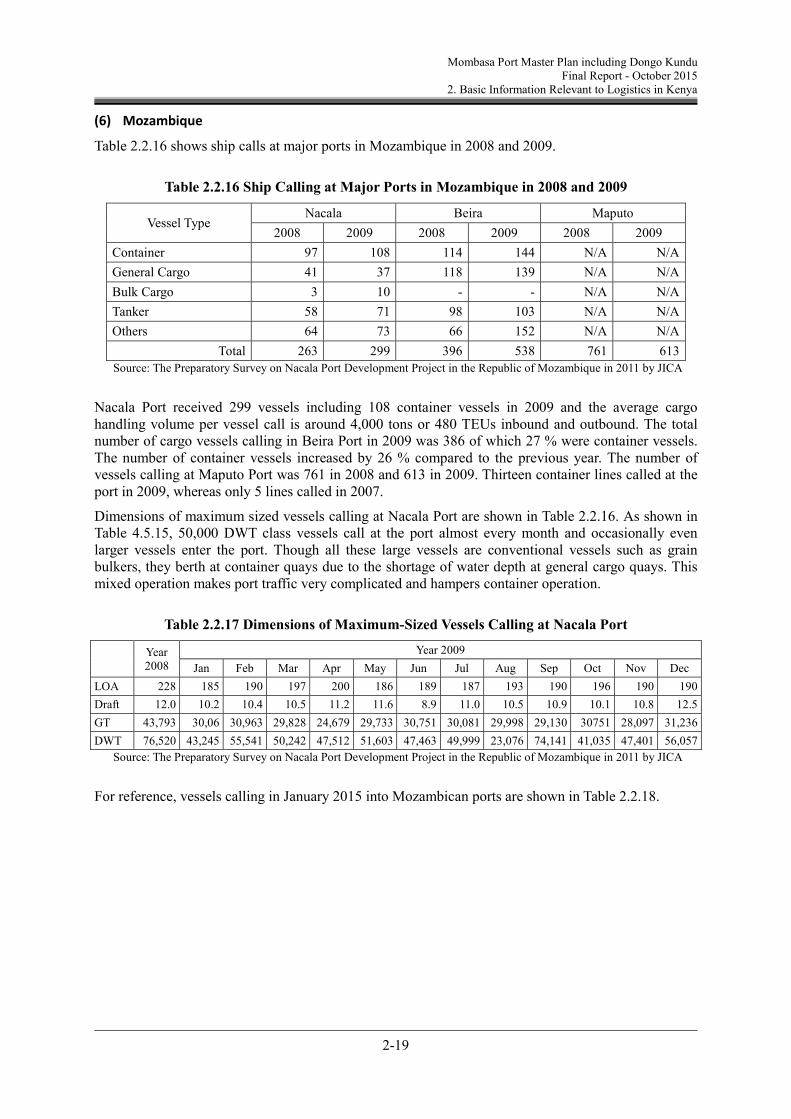
Table 2.3.1 shows ship calls at major ports in Mozambique in 2008 and 2009.
Table 2.3.1 Ship Calling at Major Ports in Mozambique in 2008 and 2009
Vessel Type Nacala Beira Maputo
2008 2009 2008 2009 2008 2009
Container 97 108 114 144 N/A N/A
General Cargo 41 37 118 139 N/A N/A
Bulk Cargo 3 10 - - N/A N/A
Tanker 58 71 98 103 N/A N/A
Others 64 73 66 152 N/A N/A
Total 263 299 396 538 761 613
Source: The Preparatory Survey on Nacala Port Development Project in the Republic of Mozambique in 2011 by JICA
Nacala Port received 299 vessels including 108 container vessels in 2009 and the average cargo handling volume per vessel call is around 4,000 tons or 480 TEUs inbound and outbound. The total number of cargo vessels calling in Beira Port in 2009 was 386 of which 27 % were container vessels. The number of container vessels increased by 26 % compared to the previous year. The number of vessels calling at Maputo Port was 761 in 2008 and 613 in 2009. Thirteen container lines called at the port in 2009, whereas only 5 lines called in 2007.
Dimensions of maximum sized vessels calling at Nacala Port are shown in Table 2.3.1. As shown in Table 4.5.15, 50,000 DWT class vessels call at the port almost every month and occasionally even larger vessels enter the port. Though all these large vessels are conventional vessels such as grain bulkers, they berth at container quays due to the shortage of water depth at general cargo quays. This mixed operation makes port traffic very complicated and hampers container operation.
Mombasa Port Master Plan including Dongo Kundu Final Report – October 2015
Executive Summary
6
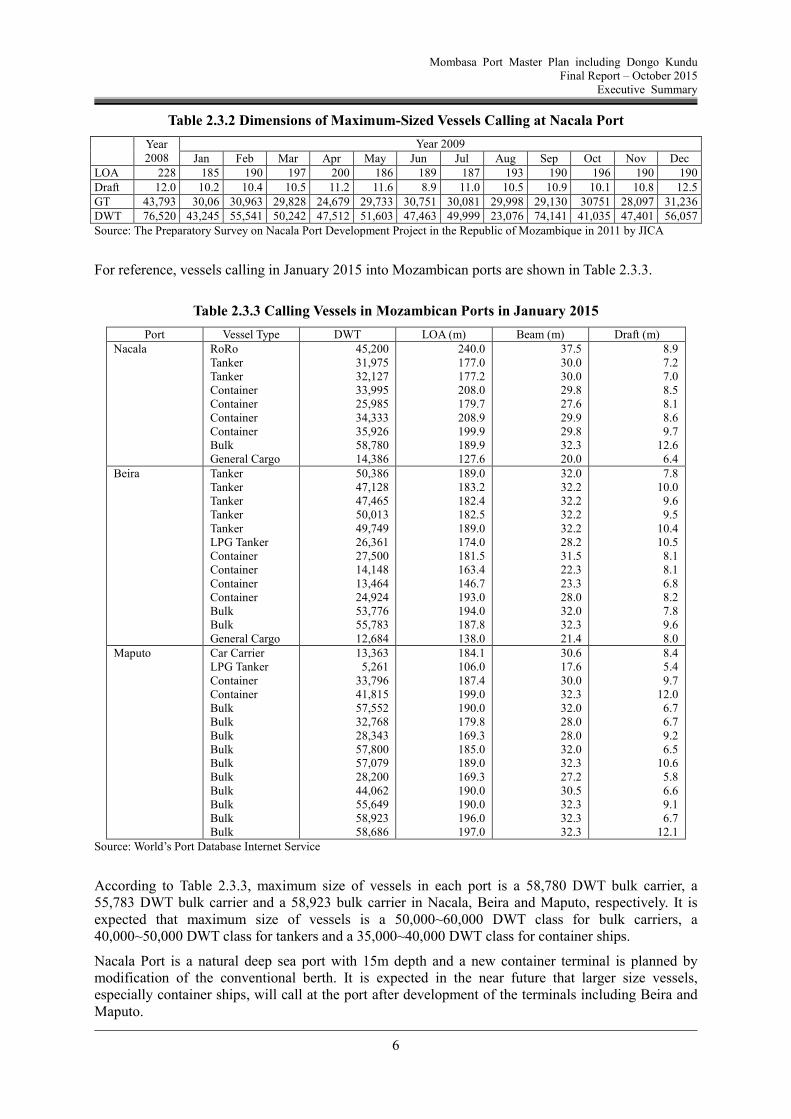
Table 2.3.2 Dimensions of Maximum-Sized Vessels Calling at Nacala Port
Year 2008
Year 2009 Jan Feb Mar Apr May Jun Jul Aug Sep Oct Nov Dec
LOA 228 185 190 197 200 186 189 187 193 190 196 190 190 Draft 12.0 10.2 10.4 10.5 11.2 11.6 8.9 11.0 10.5 10.9 10.1 10.8 12.5 GT 43,793 30,06 30,963 29,828 24,679 29,733 30,751 30,081 29,998 29,130 30751 28,097 31,236 DWT 76,520 43,245 55,541 50,242 47,512 51,603 47,463 49,999 23,076 74,141 41,035 47,401 56,057 Source: The Preparatory Survey on Nacala Port Development Project in the Republic of Mozambique in 2011 by JICA
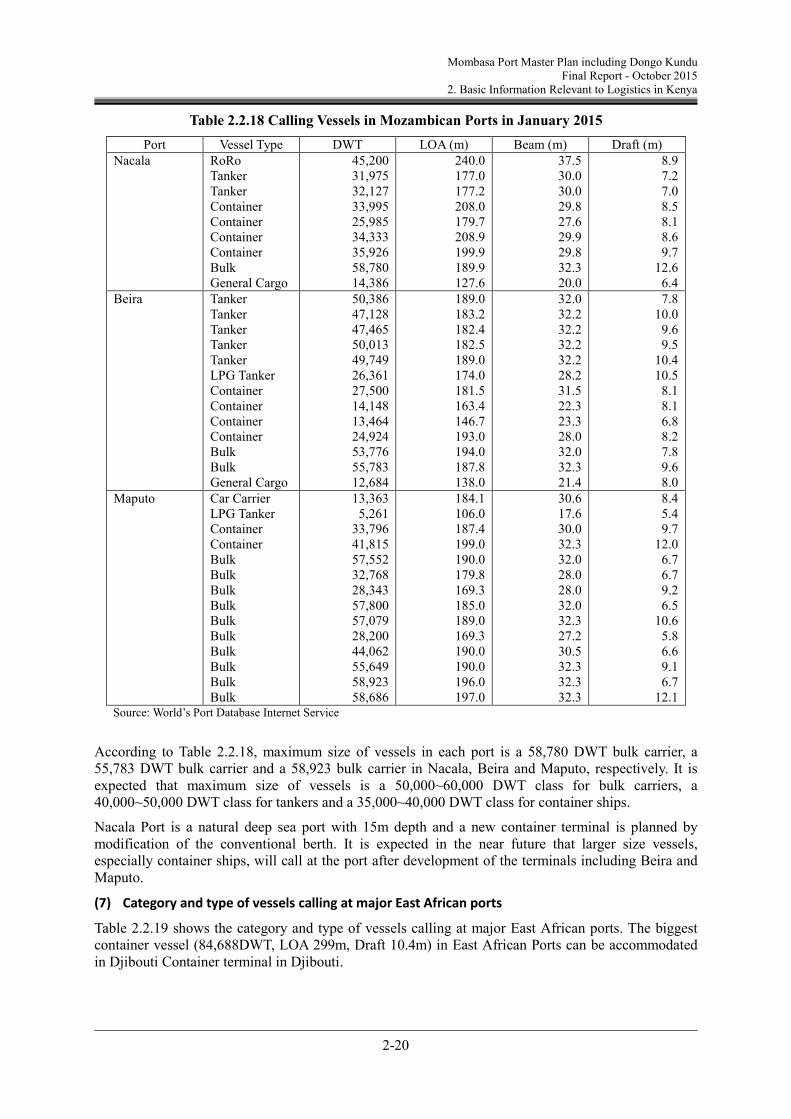
For reference, vessels calling in January 2015 into Mozambican ports are shown in Table 2.3.3.
Table 2.3.3 Calling Vessels in Mozambican Ports in January 2015
Port Vessel Type DWT LOA (m) Beam (m) Draft (m) Nacala RoRo
Tanker Tanker Container Container Container Container Bulk General Cargo
12.1 Source: World’s Port Database Internet Service
According to Table 2.3.3, maximum size of vessels in each port is a 58,780 DWT bulk carrier, a 55,783 DWT bulk carrier and a 58,923 bulk carrier in Nacala, Beira and Maputo, respectively. It is expected that maximum size of vessels is a 50,000~60,000 DWT class for bulk carriers, a 40,000~50,000 DWT class for tankers and a 35,000~40,000 DWT class for container ships.
Nacala Port is a natural deep sea port with 15m depth and a new container terminal is planned by modification of the conventional berth. It is expected in the near future that larger size vessels, especially container ships, will call at the port after development of the terminals including Beira and Maputo.
Mombasa Port Master Plan including Dongo Kundu Final Report – October 2015
Executive Summary
7
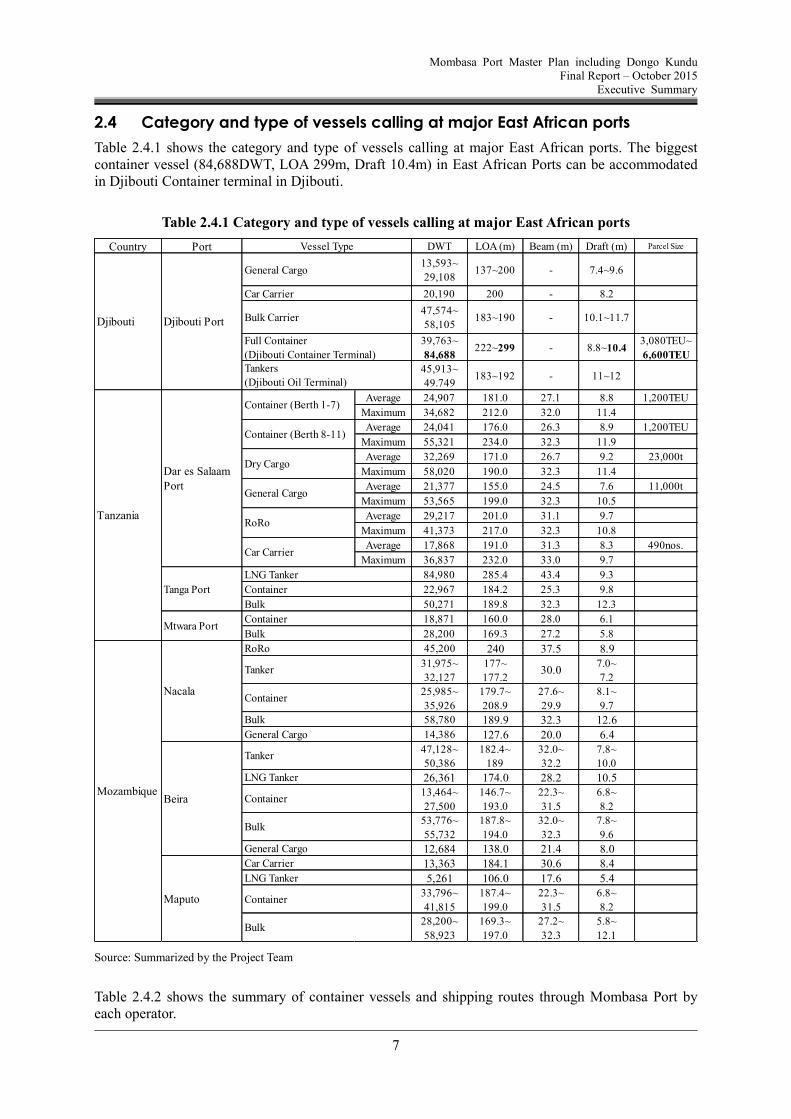
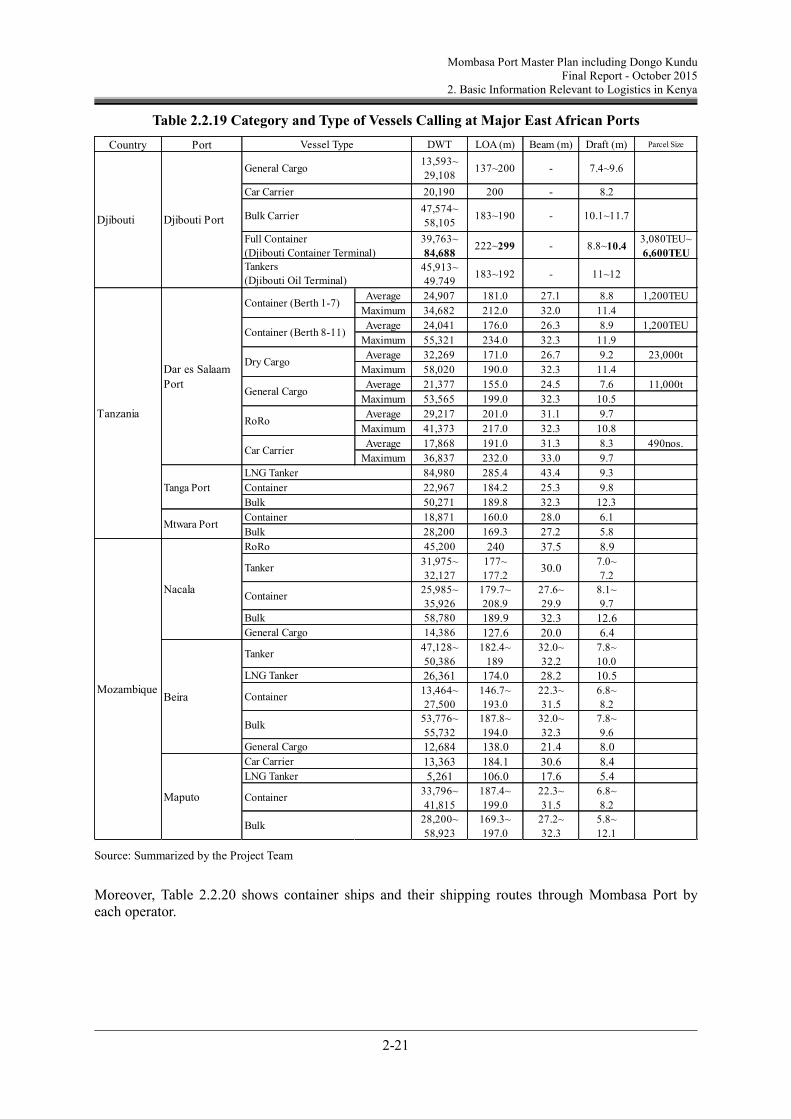
2.4 Category and type of vessels calling at major East African ports
Table 2.4.1 shows the category and type of vessels calling at major East African ports. The biggest container vessel (84,688DWT, LOA 299m, Draft 10.4m) in East African Ports can be accommodated in Djibouti Container terminal in Djibouti.
Table 2.4.1 Category and type of vessels calling at major East African ports
Source: Summarized by the Project Team
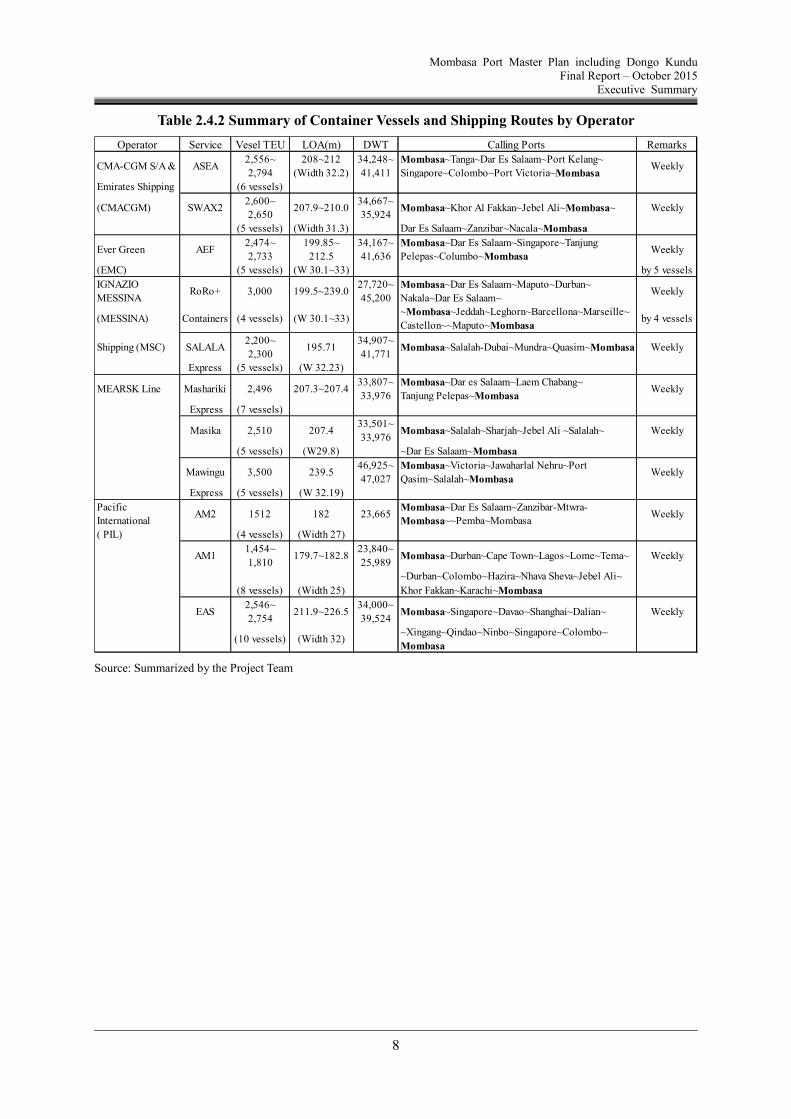
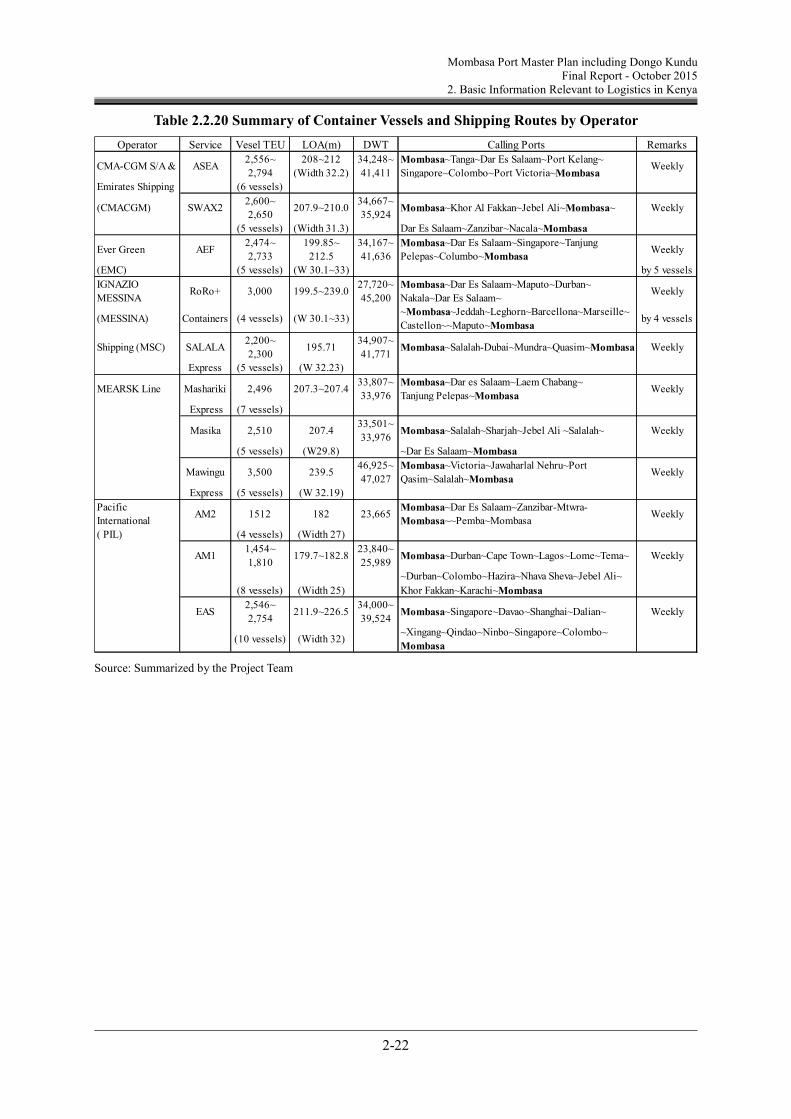
Table 2.4.2 shows the summary of container vessels and shipping routes through Mombasa Port by each operator.
Country Port DWT LOA (m) Beam (m) Draft (m) Parcel Size
13,593~
29,108137~200 - 7.4~9.6
20,190 200 - 8.2
47,574~
58,105183~190 - 10.1~11.7
39,763~
84,688222~299 - 8.8~10.4
3,080TEU~
6,600TEU
45,913~
49.749183~192 - 11~12
Average 24,907 181.0 27.1 8.8 1,200TEU
Maximum 34,682 212.0 32.0 11.4
Average 24,041 176.0 26.3 8.9 1,200TEU
Maximum 55,321 234.0 32.3 11.9
Average 32,269 171.0 26.7 9.2 23,000t
Maximum 58,020 190.0 32.3 11.4
Average 21,377 155.0 24.5 7.6 11,000t
Maximum 53,565 199.0 32.3 10.5
Average 29,217 201.0 31.1 9.7
Maximum 41,373 217.0 32.3 10.8
Average 17,868 191.0 31.3 8.3 490nos.
Maximum 36,837 232.0 33.0 9.7
84,980 285.4 43.4 9.3
22,967 184.2 25.3 9.8
50,271 189.8 32.3 12.3
18,871 160.0 28.0 6.1
28,200 169.3 27.2 5.8
45,200 240 37.5 8.931,975~
32,127
177~
177.230.0
7.0~
7.2
25,985~
35,926
179.7~
208.9
27.6~
29.9
8.1~
9.7
58,780 189.9 32.3 12.614,386 127.6 20.0 6.4
47,128~
50,386
182.4~
189
32.0~
32.2
7.8~
10.0
26,361 174.0 28.2 10.513,464~
27,500
146.7~
193.0
22.3~
31.5
6.8~
8.2
53,776~
55,732
187.8~
194.0
32.0~
32.3
7.8~
9.6
12,684 138.0 21.4 8.0
13,363 184.1 30.6 8.4
5,261 106.0 17.6 5.433,796~
41,815
187.4~
199.0
22.3~
31.5
6.8~
8.2
28,200~
58,923
169.3~
197.0
27.2~
32.3
5.8~
12.1
Djibouti Port
Vessel Type
Container (Berth 1-7)
Container (Berth 8-11)
Dry Cargo
General Cargo
Car Carrier
Bulk Carrier
Full Container
(Djibouti Container Terminal)Tankers
(Djibouti Oil Terminal)
Djibouti
Tanker
LNG Tanker
Container
Bulk
Beira
RoRo
Tanker
Container
Bulk
General Cargo
Nacala
Tanga Port
Mtwara Port
LNG Tanker
Container
Tanzania
Mozambique
Car Carrier
LNG Tanker
Container
Bulk
Maputo
General Cargo
Bulk
Container
Bulk
Car Carrier
Dar es Salaam
PortGeneral Cargo
RoRo
Mombasa Port Master Plan including Dongo Kundu Final Report – October 2015
Executive Summary
8
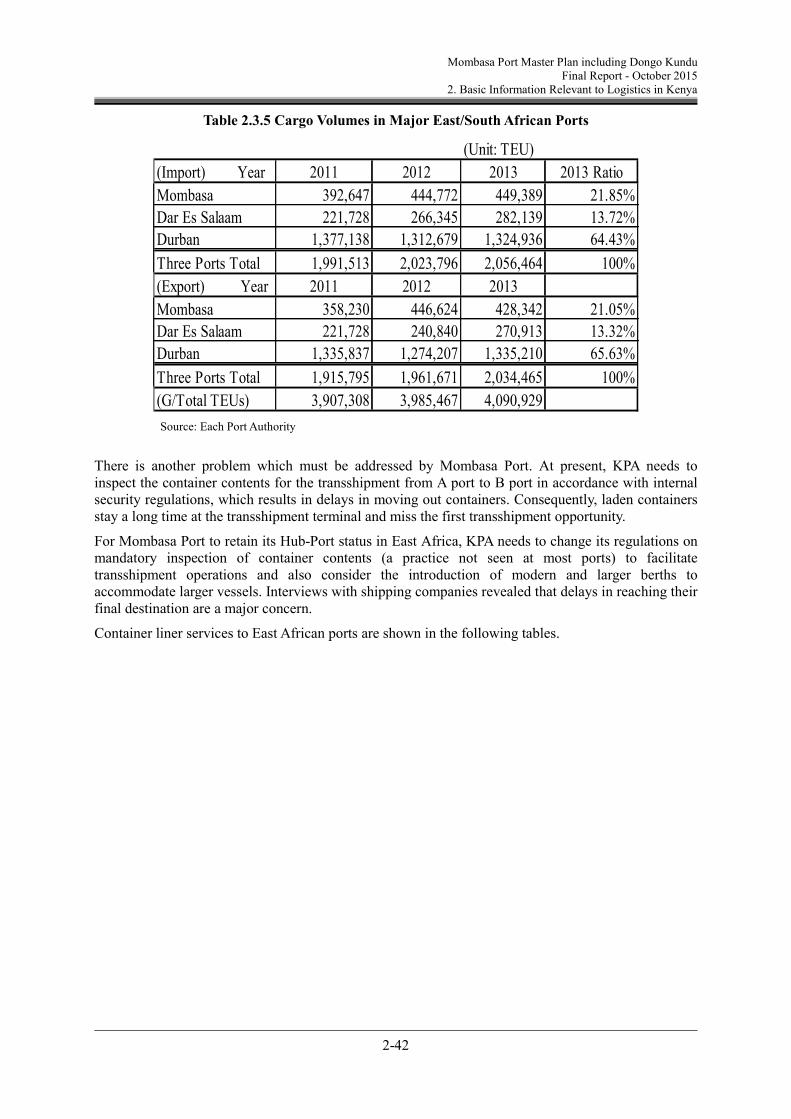
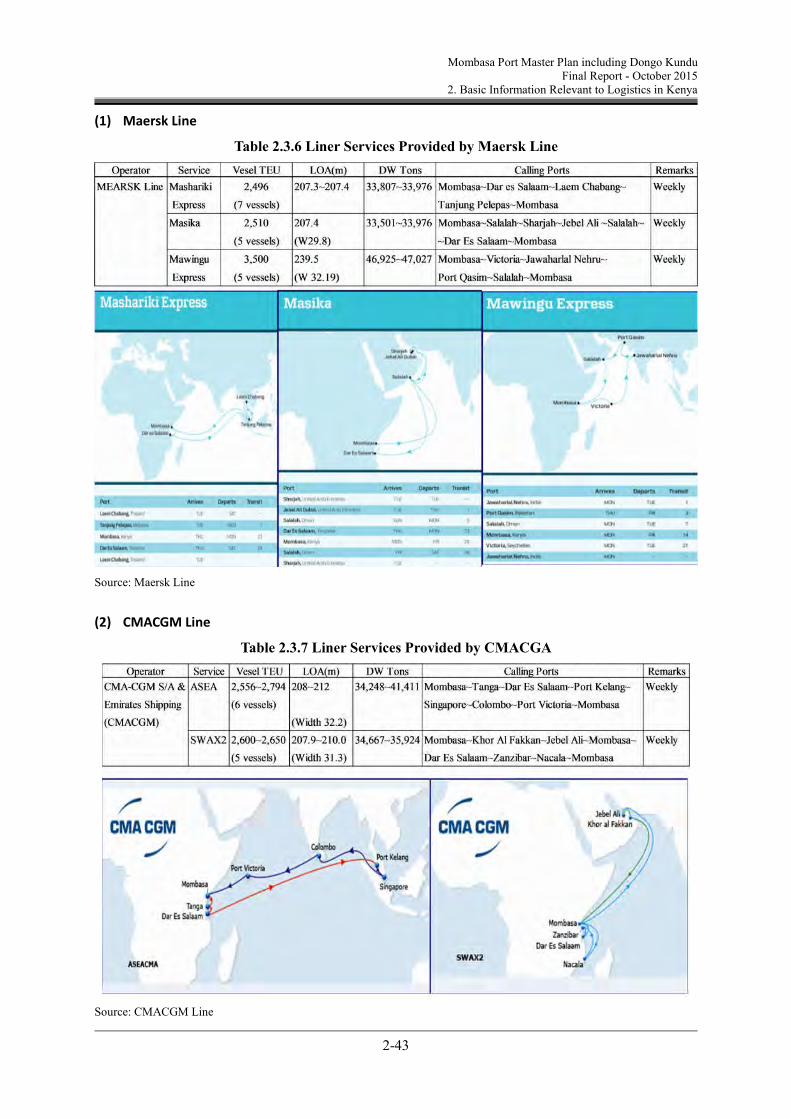
Table 2.4.2 Summary of Container Vessels and Shipping Routes by Operator
Source: Summarized by the Project Team
Operator Service Vesel TEU LOA(m) DWT Calling Ports Remarks
CMA-CGM S/A & ASEA2,556~
2,794
208~212
(Width 32.2)
34,248~
41,411
Mombasa~Tanga~Dar Es Salaam~Port Kelang~
Singapore~Colombo~Port Victoria~MombasaWeekly
Emirates Shipping (6 vessels)
(CMACGM) SWAX22,600~
2,650207.9~210.0
34,667~
35,924Mombasa~Khor Al Fakkan~Jebel Ali~Mombasa~ Weekly
(5 vessels) (Width 31.3) Dar Es Salaam~Zanzibar~Nacala~Mombasa
Ever Green AEF2,474~
2,733
199.85~
212.5
34,167~
41,636
Mombasa~Dar Es Salaam~Singapore~Tanjung
Pelepas~Columbo~MombasaWeekly
(EMC) (5 vessels) (W 30.1~33) by 5 vessels
IGNAZIO
MESSINARoRo+ 3,000 199.5~239.0
27,720~
45,200
Mombasa~Dar Es Salaam~Maputo~Durban~
Nakala~Dar Es Salaam~Weekly
(MESSINA) Containers (4 vessels) (W 30.1~33)~Mombasa~Jeddah~Leghorn~Barcellona~Marseille~
Mombasa Port Master Plan including Dongo Kundu Final Report – October 2015
Executive Summary
9
3. Current Port Master Plan (2009)
3.1 Review of traffic forecast
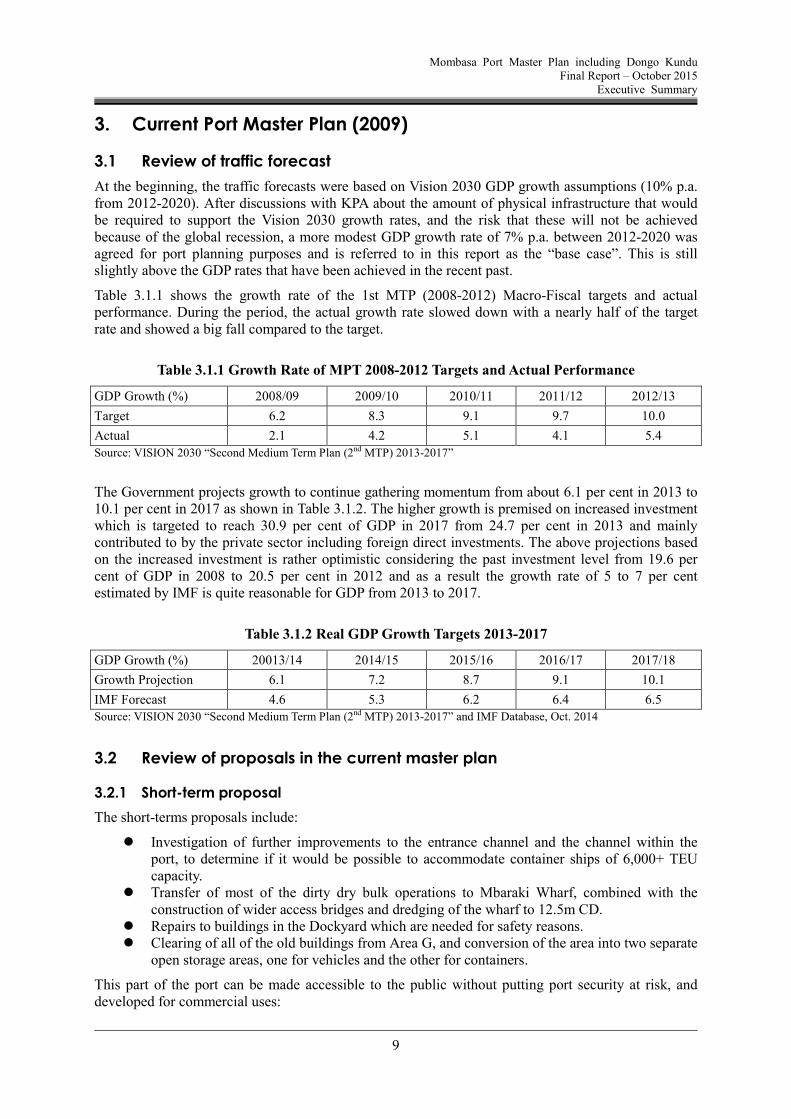
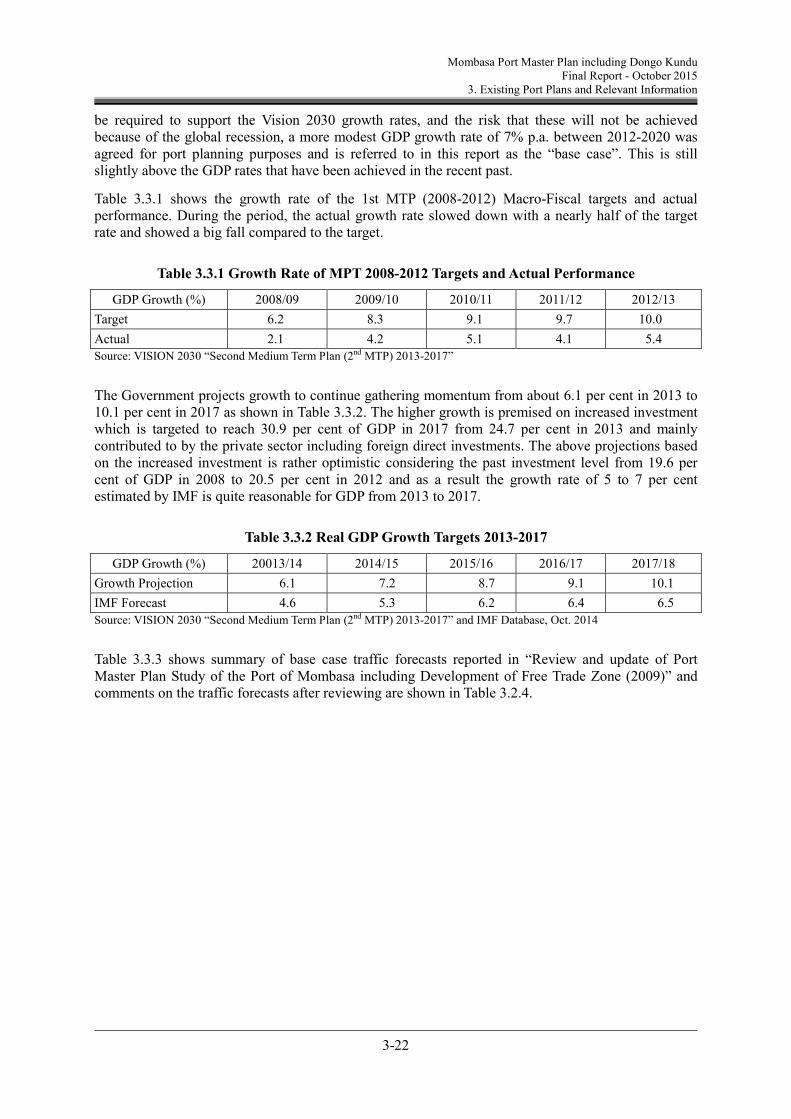
At the beginning, the traffic forecasts were based on Vision 2030 GDP growth assumptions (10% p.a. from 2012-2020). After discussions with KPA about the amount of physical infrastructure that would be required to support the Vision 2030 growth rates, and the risk that these will not be achieved because of the global recession, a more modest GDP growth rate of 7% p.a. between 2012-2020 was agreed for port planning purposes and is referred to in this report as the “base case”. This is still slightly above the GDP rates that have been achieved in the recent past.
Table 3.1.1 shows the growth rate of the 1st MTP (2008-2012) Macro-Fiscal targets and actual performance. During the period, the actual growth rate slowed down with a nearly half of the target rate and showed a big fall compared to the target.
Table 3.1.1 Growth Rate of MPT 2008-2012 Targets and Actual Performance
GDP Growth (%) 2008/09 2009/10 2010/11 2011/12 2012/13
Target 6.2 8.3 9.1 9.7 10.0
Actual 2.1 4.2 5.1 4.1 5.4
Source: VISION 2030 “Second Medium Term Plan (2nd MTP) 2013-2017”
The Government projects growth to continue gathering momentum from about 6.1 per cent in 2013 to 10.1 per cent in 2017 as shown in Table 3.1.2. The higher growth is premised on increased investment which is targeted to reach 30.9 per cent of GDP in 2017 from 24.7 per cent in 2013 and mainly contributed to by the private sector including foreign direct investments. The above projections based on the increased investment is rather optimistic considering the past investment level from 19.6 per cent of GDP in 2008 to 20.5 per cent in 2012 and as a result the growth rate of 5 to 7 per cent estimated by IMF is quite reasonable for GDP from 2013 to 2017.
Table 3.1.2 Real GDP Growth Targets 2013-2017
GDP Growth (%) 20013/14 2014/15 2015/16 2016/17 2017/18
Growth Projection 6.1 7.2 8.7 9.1 10.1
IMF Forecast 4.6 5.3 6.2 6.4 6.5
Source: VISION 2030 “Second Medium Term Plan (2nd MTP) 2013-2017” and IMF Database, Oct. 2014
3.2 Review of proposals in the current master plan
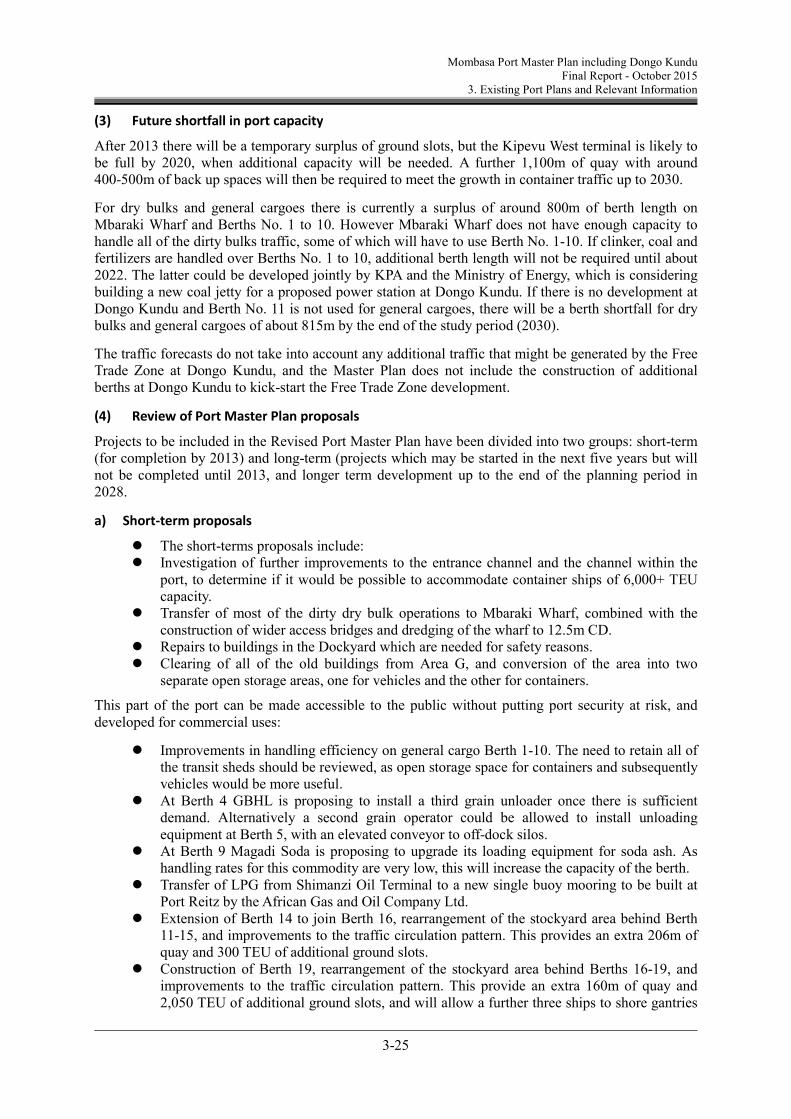
3.2.1 Short-term proposal
The short-terms proposals include:
Investigation of further improvements to the entrance channel and the channel within the port, to determine if it would be possible to accommodate container ships of 6,000+ TEU capacity.
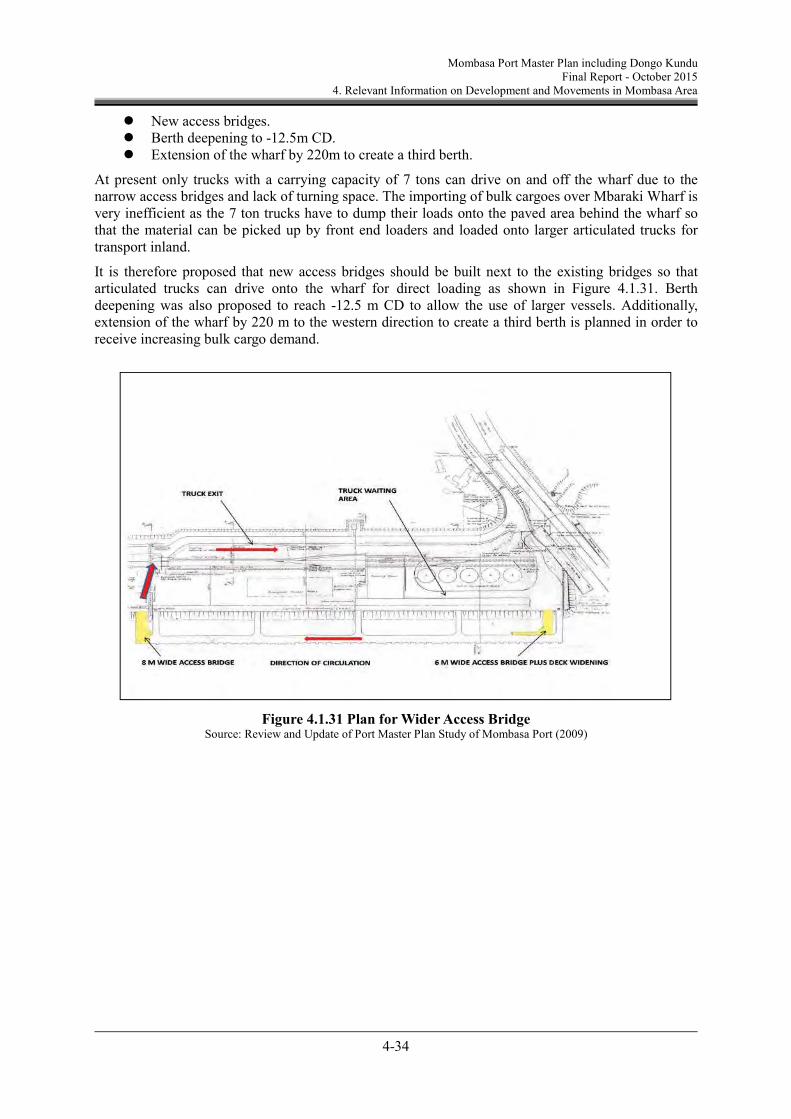
Transfer of most of the dirty dry bulk operations to Mbaraki Wharf, combined with the construction of wider access bridges and dredging of the wharf to 12.5m CD.
Repairs to buildings in the Dockyard which are needed for safety reasons. Clearing of all of the old buildings from Area G, and conversion of the area into two separate
open storage areas, one for vehicles and the other for containers.
This part of the port can be made accessible to the public without putting port security at risk, and developed for commercial uses:
Mombasa Port Master Plan including Dongo Kundu Final Report – October 2015
Executive Summary
10
Improvements in handling efficiency on general cargo Berth 1-10. The need to retain all of the transit sheds should be reviewed, as open storage space for containers and subsequently vehicles would be more useful.
At Berth 4 GBHL is proposing to install a third grain unloader once there is sufficient demand. Alternatively a second grain operator could be allowed to install unloading equipment at Berth 5, with an elevated conveyor to off-dock silos.
At Berth 9 Magadi Soda is proposing to upgrade its loading equipment for soda ash. As handling rates for this commodity are very low, this will increase the capacity of the berth.
Transfer of LPG from Shimanzi Oil Terminal to a new single buoy mooring to be built at Port Reitz by the African Gas and Oil Company Ltd.
Extension of Berth 14 to join Berth 16, rearrangement of the stockyard area behind Berth 11-15, and improvements to the traffic circulation pattern. This provides an extra 206m of quay and 300 TEU of additional ground slots.
Construction of Berth 19, rearrangement of the stockyard area behind Berths 16-19, and improvements to the traffic circulation pattern. This provide an extra 160m of quay and 2,050 TEU of additional ground slots, and will allow a further three ships to shore gantries to be installed in addition to the four in use.
Enlargement of Gate 19 to provide three additional check-out booths, and widening of the truck waiting area near the gate to avoid long queues of vehicles impeding other port operations.
Widening of the road behind Berths 16-19 to improve access to the Kipevu West container terminal.
A study of the need for new hydrocarbons berths (LPG, compressed natural gas and petroleum products). If productivity improvements at KOT cannot be achieved quickly, a new oil berth will be needed in the short-term.
Upgrading of the incoming power supply to 33 kV and provision of a second power line. Other power-related improvements include the purchase of three new generators to provide back-up power to communications equipment.
Construction of a new water pipeline and upgrading of the sewage system.
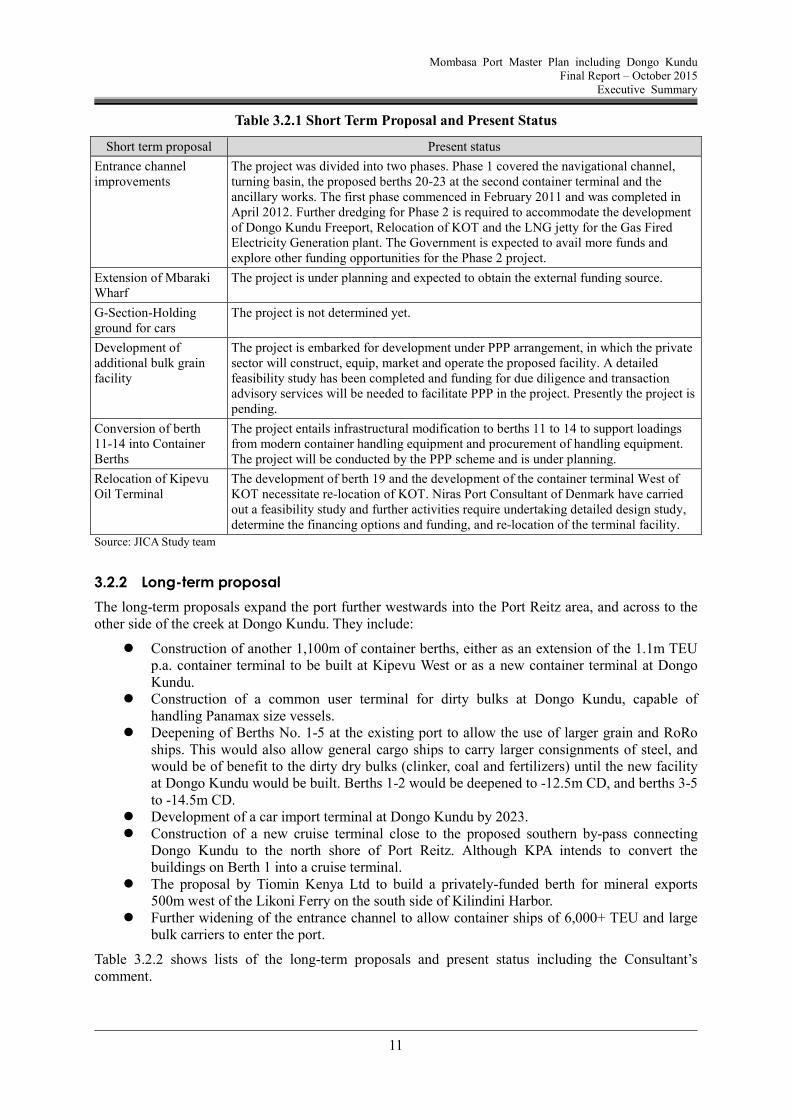
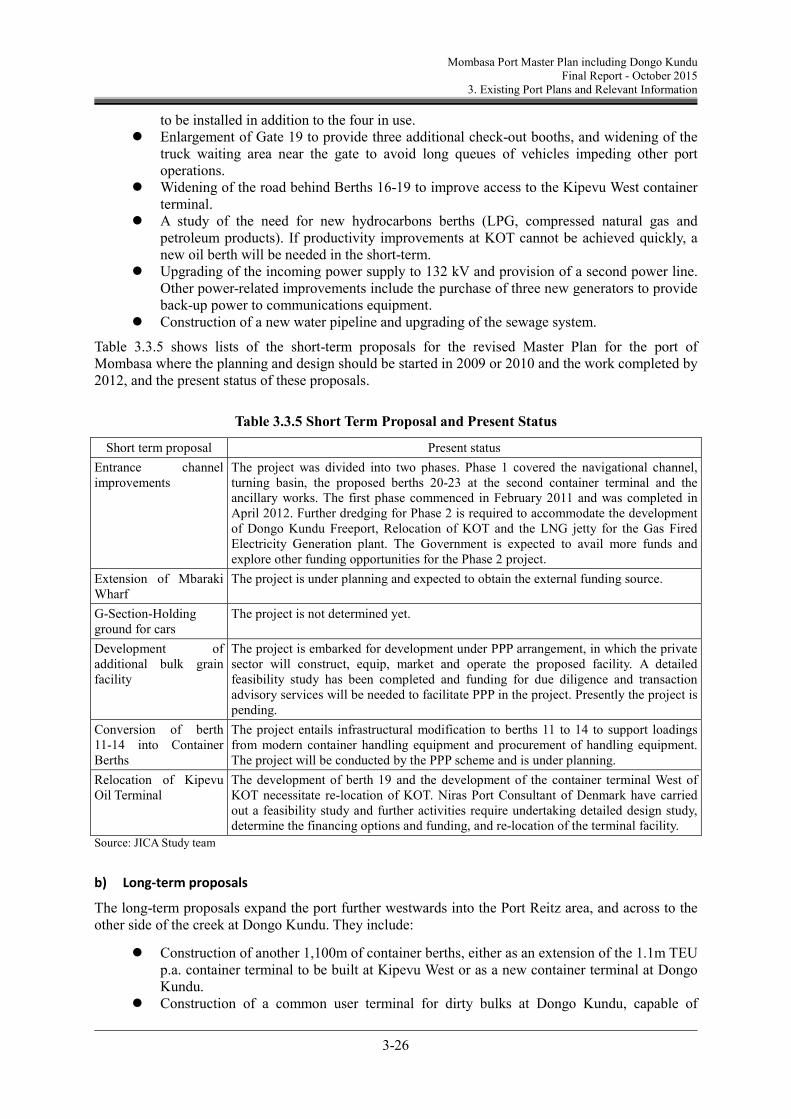
Table 3.2.1 shows lists of the short-term proposals for the revised Master Plan for the port of Mombasa where the planning and design should be started in 2009 or 2010 and the work completed by 2012, and the present status of these proposals.
Mombasa Port Master Plan including Dongo Kundu Final Report – October 2015
Executive Summary
11
Table 3.2.1 Short Term Proposal and Present Status
Short term proposal Present status
Entrance channel improvements
The project was divided into two phases. Phase 1 covered the navigational channel, turning basin, the proposed berths 20-23 at the second container terminal and the ancillary works. The first phase commenced in February 2011 and was completed in April 2012. Further dredging for Phase 2 is required to accommodate the development of Dongo Kundu Freeport, Relocation of KOT and the LNG jetty for the Gas Fired Electricity Generation plant. The Government is expected to avail more funds and explore other funding opportunities for the Phase 2 project.
Extension of Mbaraki Wharf
The project is under planning and expected to obtain the external funding source.
G-Section-Holding ground for cars
The project is not determined yet.
Development of additional bulk grain facility
The project is embarked for development under PPP arrangement, in which the private sector will construct, equip, market and operate the proposed facility. A detailed feasibility study has been completed and funding for due diligence and transaction advisory services will be needed to facilitate PPP in the project. Presently the project is pending.
Conversion of berth 11-14 into Container Berths
The project entails infrastructural modification to berths 11 to 14 to support loadings from modern container handling equipment and procurement of handling equipment. The project will be conducted by the PPP scheme and is under planning.
Relocation of Kipevu Oil Terminal
The development of berth 19 and the development of the container terminal West of KOT necessitate re-location of KOT. Niras Port Consultant of Denmark have carried out a feasibility study and further activities require undertaking detailed design study, determine the financing options and funding, and re-location of the terminal facility.
Source: JICA Study team
3.2.2 Long-term proposal
The long-term proposals expand the port further westwards into the Port Reitz area, and across to the other side of the creek at Dongo Kundu. They include:
Construction of another 1,100m of container berths, either as an extension of the 1.1m TEU p.a. container terminal to be built at Kipevu West or as a new container terminal at Dongo Kundu.
Construction of a common user terminal for dirty bulks at Dongo Kundu, capable of handling Panamax size vessels.
Deepening of Berths No. 1-5 at the existing port to allow the use of larger grain and RoRo ships. This would also allow general cargo ships to carry larger consignments of steel, and would be of benefit to the dirty dry bulks (clinker, coal and fertilizers) until the new facility at Dongo Kundu would be built. Berths 1-2 would be deepened to -12.5m CD, and berths 3-5 to -14.5m CD.
Development of a car import terminal at Dongo Kundu by 2023. Construction of a new cruise terminal close to the proposed southern by-pass connecting
Dongo Kundu to the north shore of Port Reitz. Although KPA intends to convert the buildings on Berth 1 into a cruise terminal.
The proposal by Tiomin Kenya Ltd to build a privately-funded berth for mineral exports 500m west of the Likoni Ferry on the south side of Kilindini Harbor.
Further widening of the entrance channel to allow container ships of 6,000+ TEU and large bulk carriers to enter the port.
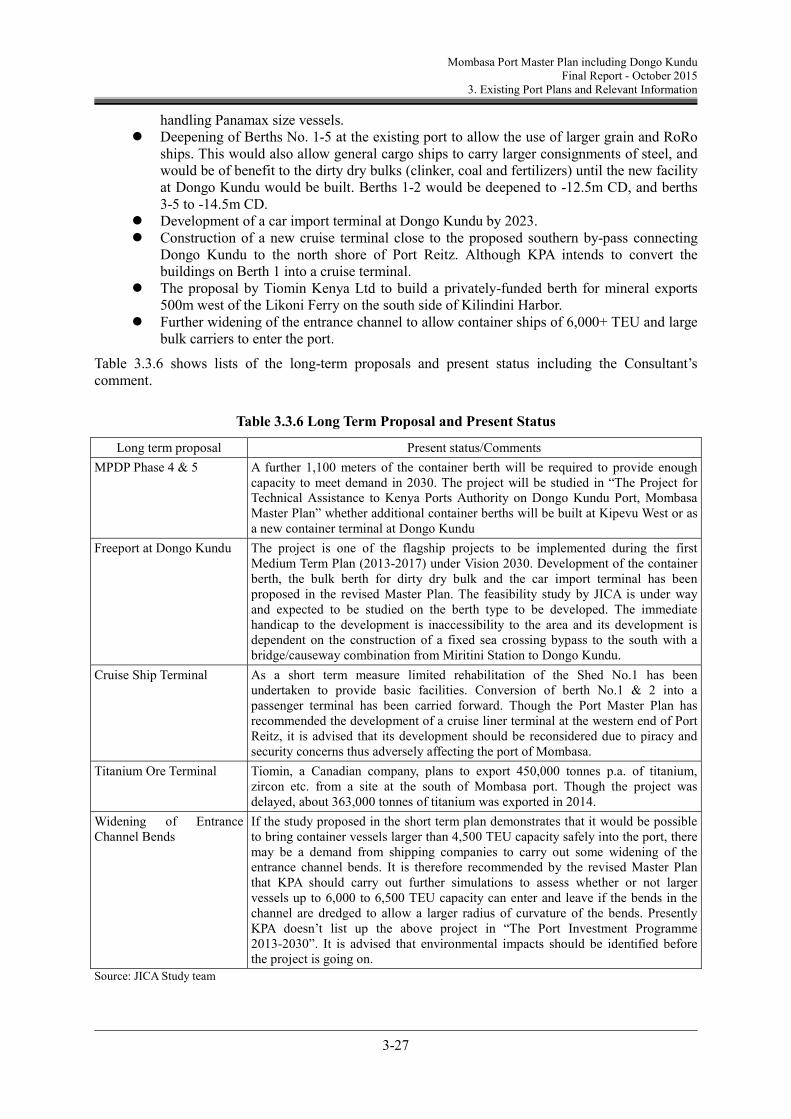
Table 3.2.2 shows lists of the long-term proposals and present status including the Consultant’s comment.
Mombasa Port Master Plan including Dongo Kundu Final Report – October 2015
Executive Summary
12
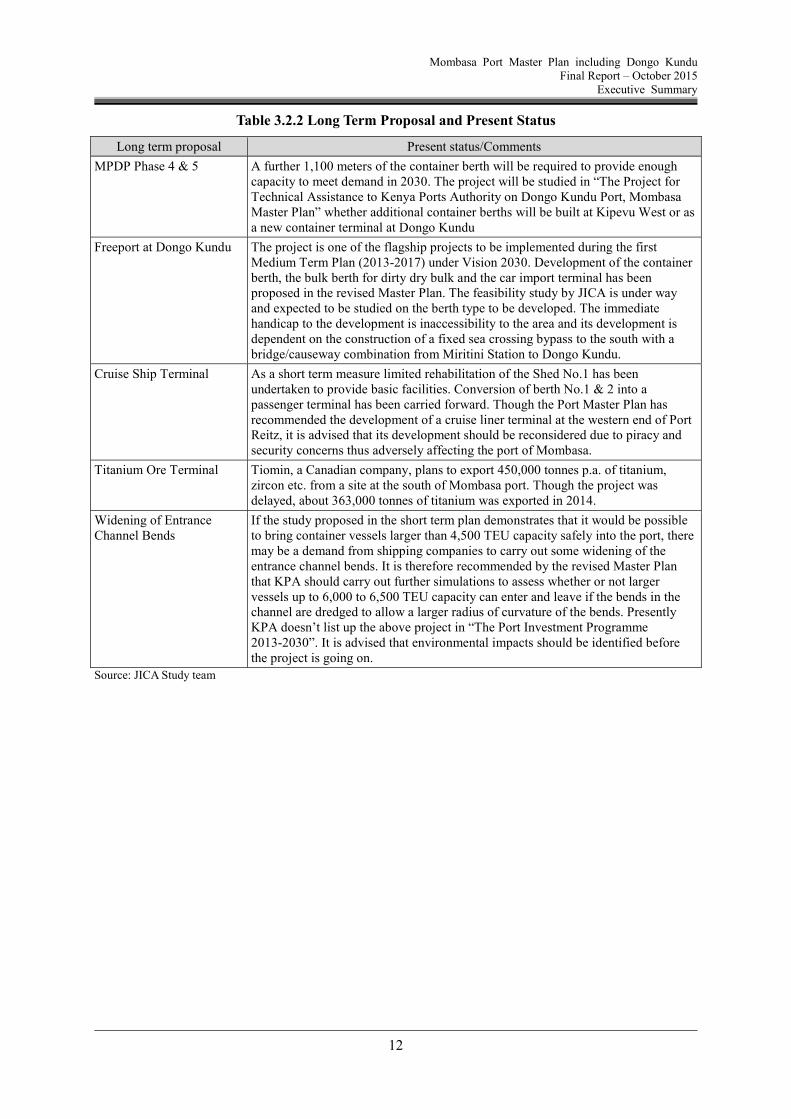
Table 3.2.2 Long Term Proposal and Present Status
Long term proposal Present status/Comments
MPDP Phase 4 & 5 A further 1,100 meters of the container berth will be required to provide enough capacity to meet demand in 2030. The project will be studied in “The Project for Technical Assistance to Kenya Ports Authority on Dongo Kundu Port, Mombasa Master Plan” whether additional container berths will be built at Kipevu West or as a new container terminal at Dongo Kundu
Freeport at Dongo Kundu The project is one of the flagship projects to be implemented during the first Medium Term Plan (2013-2017) under Vision 2030. Development of the container berth, the bulk berth for dirty dry bulk and the car import terminal has been proposed in the revised Master Plan. The feasibility study by JICA is under way and expected to be studied on the berth type to be developed. The immediate handicap to the development is inaccessibility to the area and its development is dependent on the construction of a fixed sea crossing bypass to the south with a bridge/causeway combination from Miritini Station to Dongo Kundu.
Cruise Ship Terminal As a short term measure limited rehabilitation of the Shed No.1 has been undertaken to provide basic facilities. Conversion of berth No.1 & 2 into a passenger terminal has been carried forward. Though the Port Master Plan has recommended the development of a cruise liner terminal at the western end of Port Reitz, it is advised that its development should be reconsidered due to piracy and security concerns thus adversely affecting the port of Mombasa.
Titanium Ore Terminal Tiomin, a Canadian company, plans to export 450,000 tonnes p.a. of titanium, zircon etc. from a site at the south of Mombasa port. Though the project was delayed, about 363,000 tonnes of titanium was exported in 2014.
Widening of Entrance Channel Bends
If the study proposed in the short term plan demonstrates that it would be possible to bring container vessels larger than 4,500 TEU capacity safely into the port, there may be a demand from shipping companies to carry out some widening of the entrance channel bends. It is therefore recommended by the revised Master Plan that KPA should carry out further simulations to assess whether or not larger vessels up to 6,000 to 6,500 TEU capacity can enter and leave if the bends in the channel are dredged to allow a larger radius of curvature of the bends. Presently KPA doesn’t list up the above project in “The Port Investment Programme 2013-2030”. It is advised that environmental impacts should be identified before the project is going on.
Source: JICA Study team
Mombasa Port Master Plan including Dongo Kundu Final Report – October 2015
Executive Summary
13
4. Current Situation of Mombasa Port
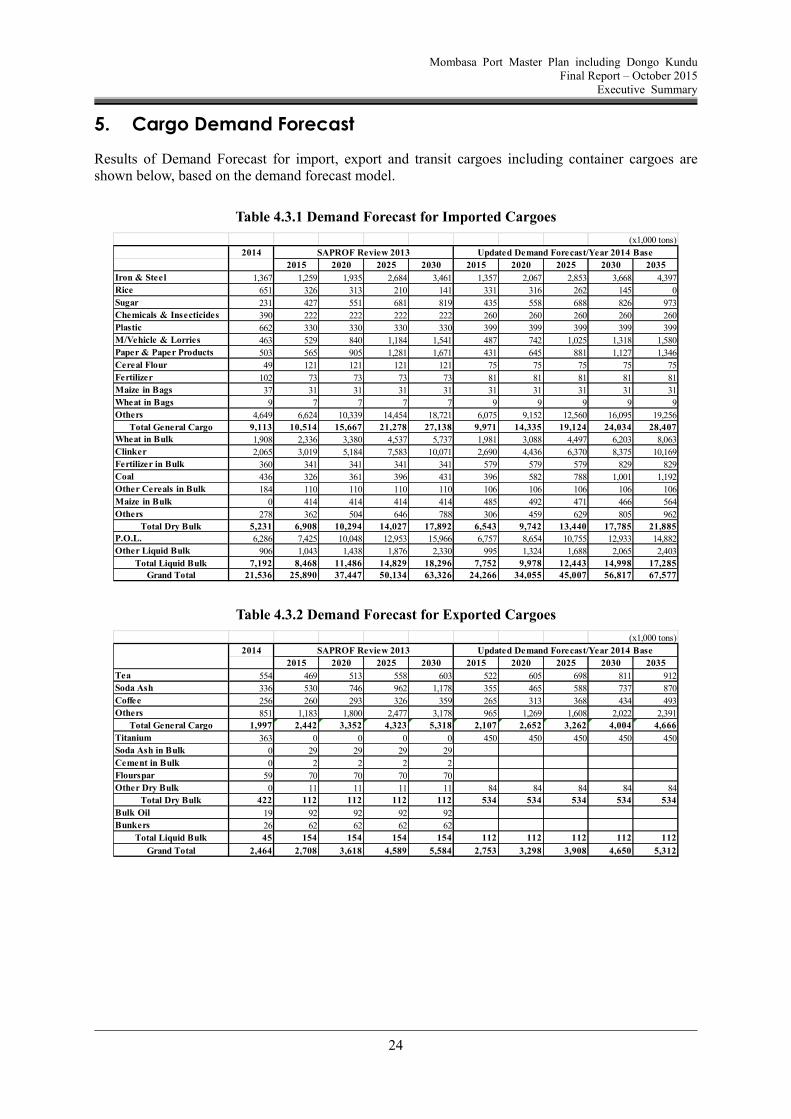
4.1 Throughput in Mombasa Port
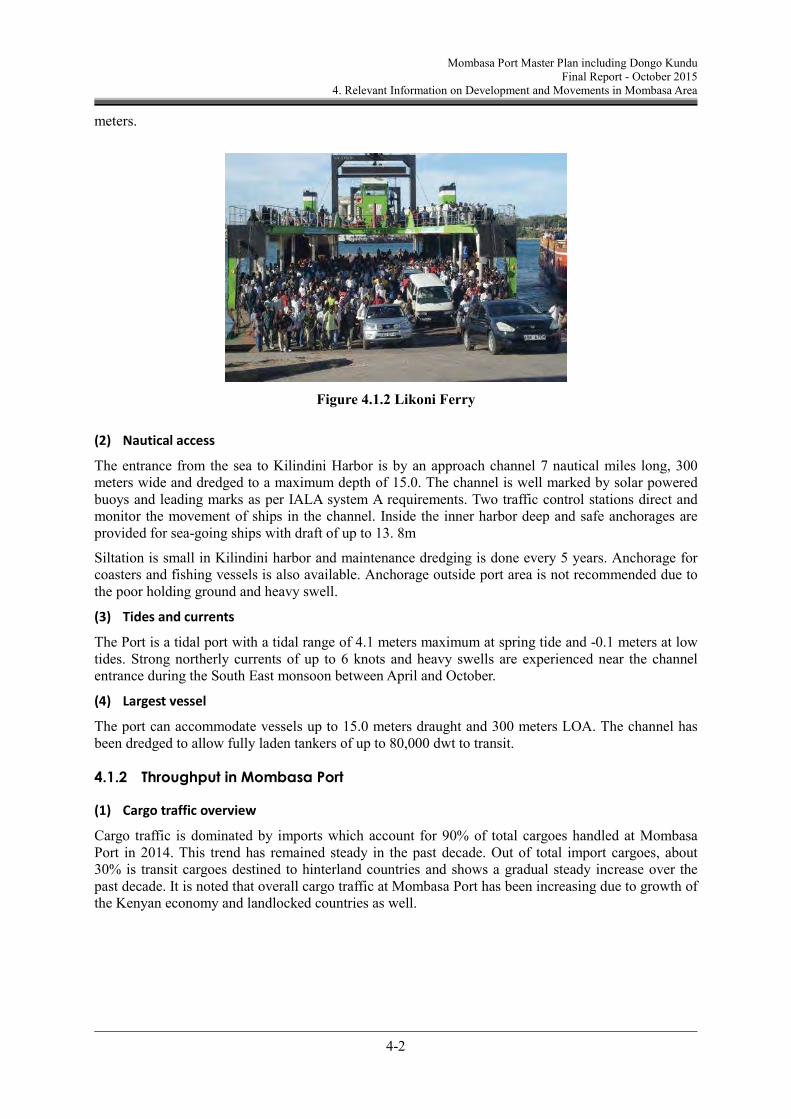
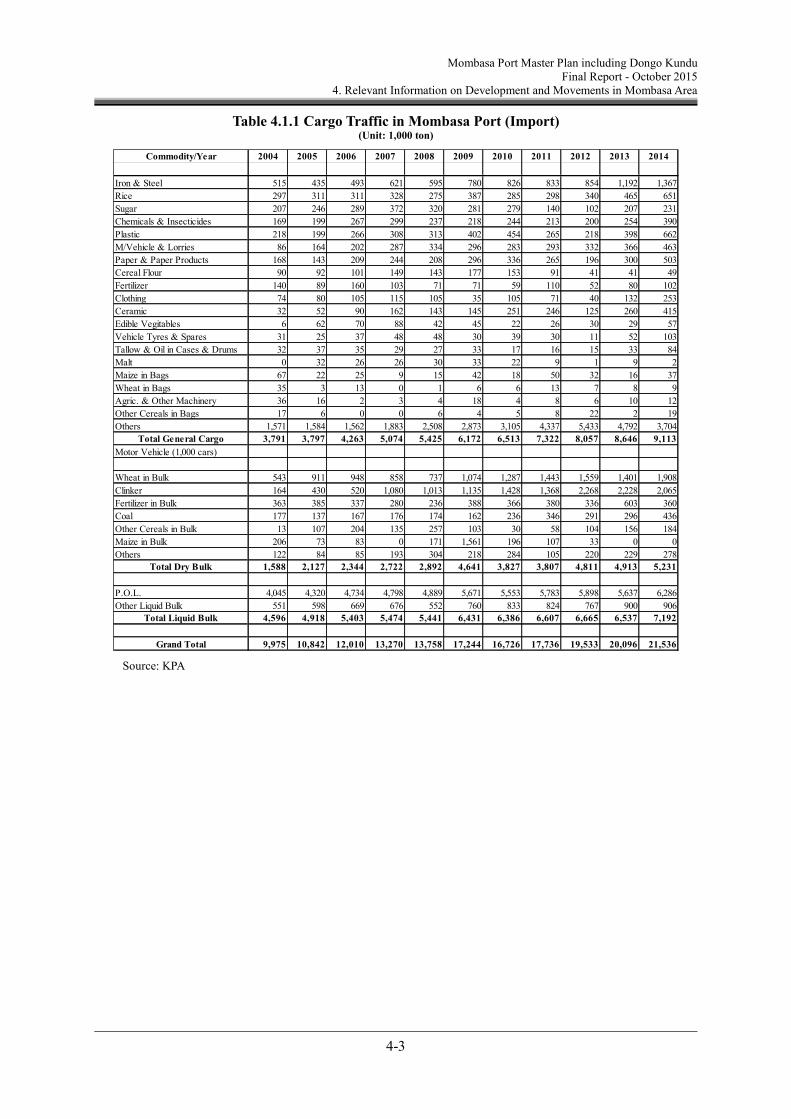
4.1.1 Cargo traffic overview
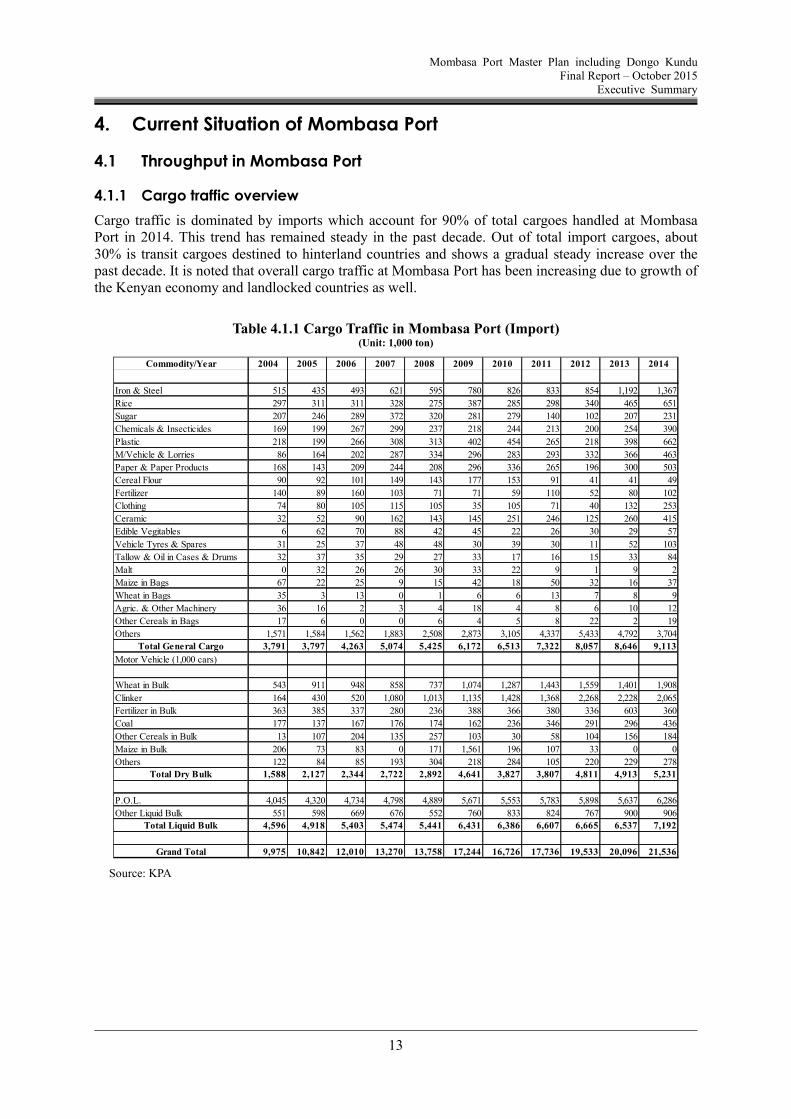
Cargo traffic is dominated by imports which account for 90% of total cargoes handled at Mombasa Port in 2014. This trend has remained steady in the past decade. Out of total import cargoes, about 30% is transit cargoes destined to hinterland countries and shows a gradual steady increase over the past decade. It is noted that overall cargo traffic at Mombasa Port has been increasing due to growth of the Kenyan economy and landlocked countries as well.
Table 4.1.1 Cargo Traffic in Mombasa Port (Import) (Unit: 1,000 ton)
Grand Total 9,975 10,842 12,010 13,270 13,758 17,244 16,726 17,736 19,533 20,096 21,536
Mombasa Port Master Plan including Dongo Kundu Final Report – October 2015
Executive Summary
14
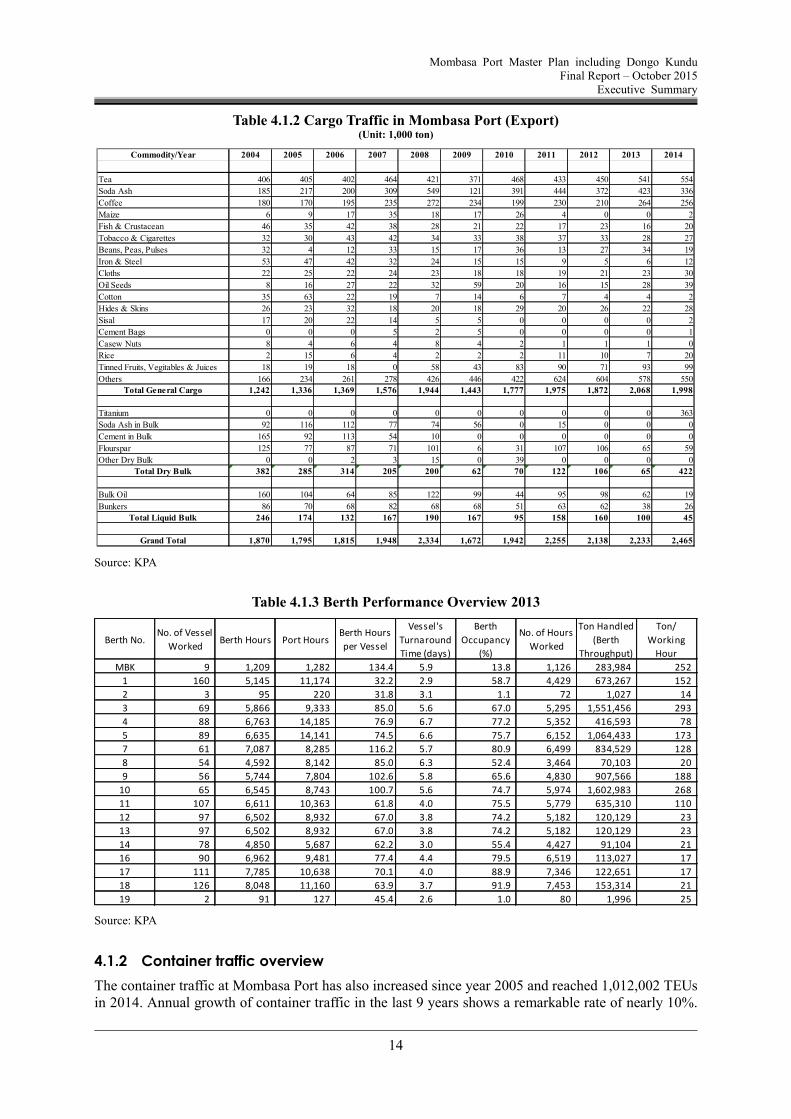
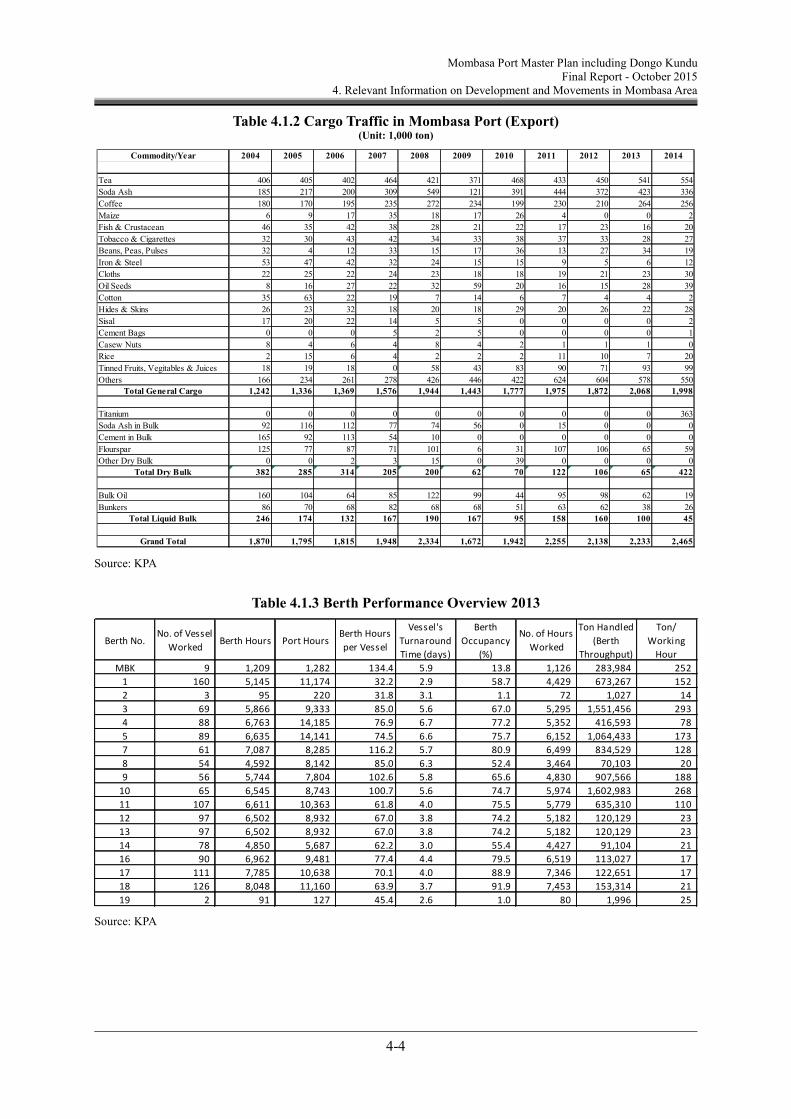
Table 4.1.2 Cargo Traffic in Mombasa Port (Export) (Unit: 1,000 ton)
Source: KPA
Table 4.1.3 Berth Performance Overview 2013
Source: KPA
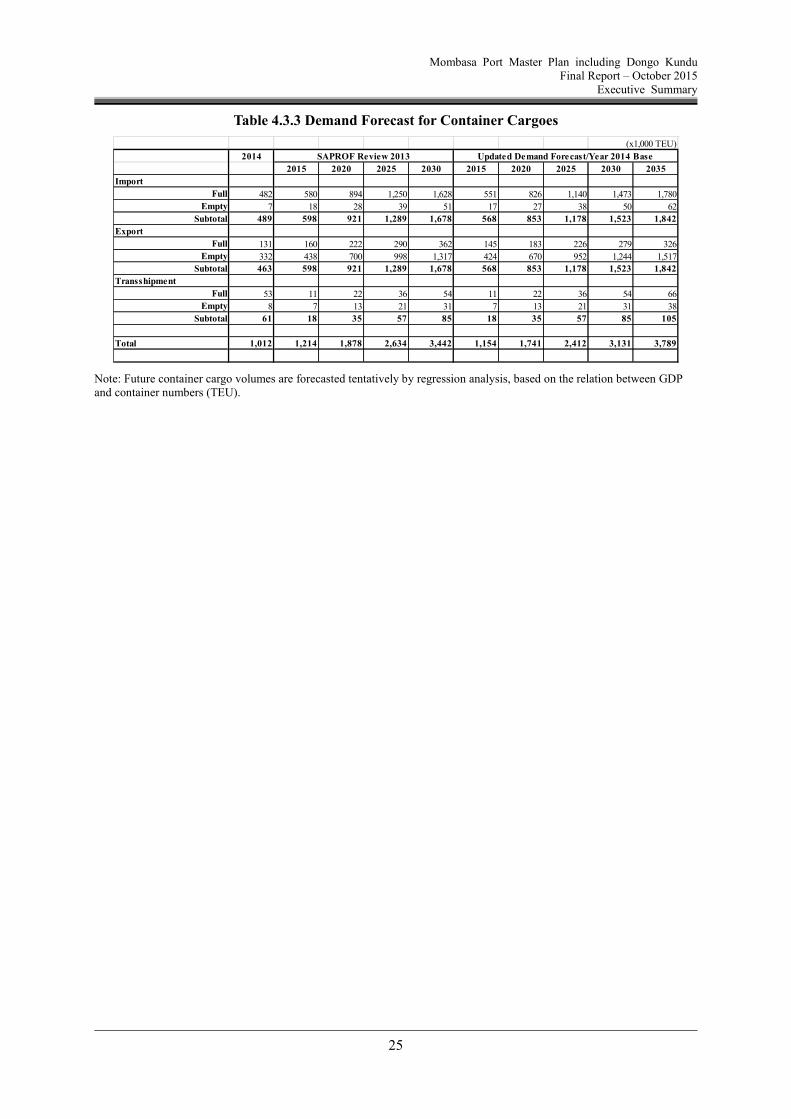
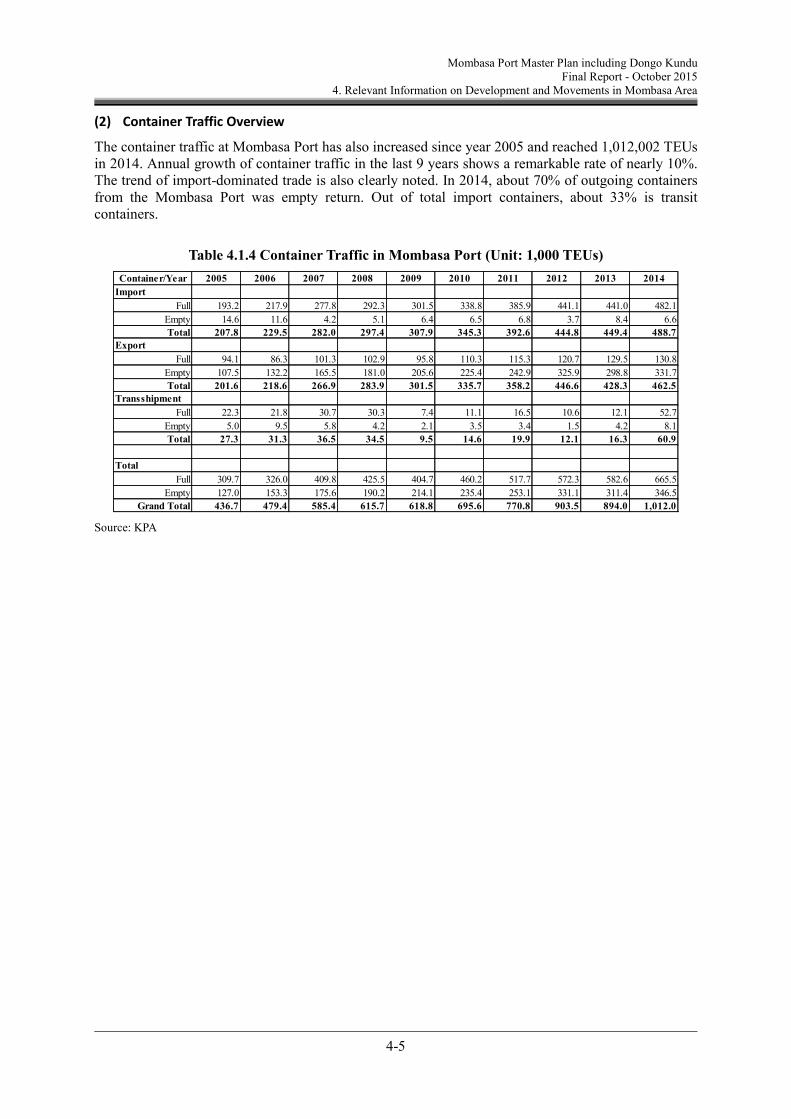
4.1.2 Container traffic overview
The container traffic at Mombasa Port has also increased since year 2005 and reached 1,012,002 TEUs in 2014. Annual growth of container traffic in the last 9 years shows a remarkable rate of nearly 10%.
Mombasa Port Master Plan including Dongo Kundu Final Report – October 2015
Executive Summary
15
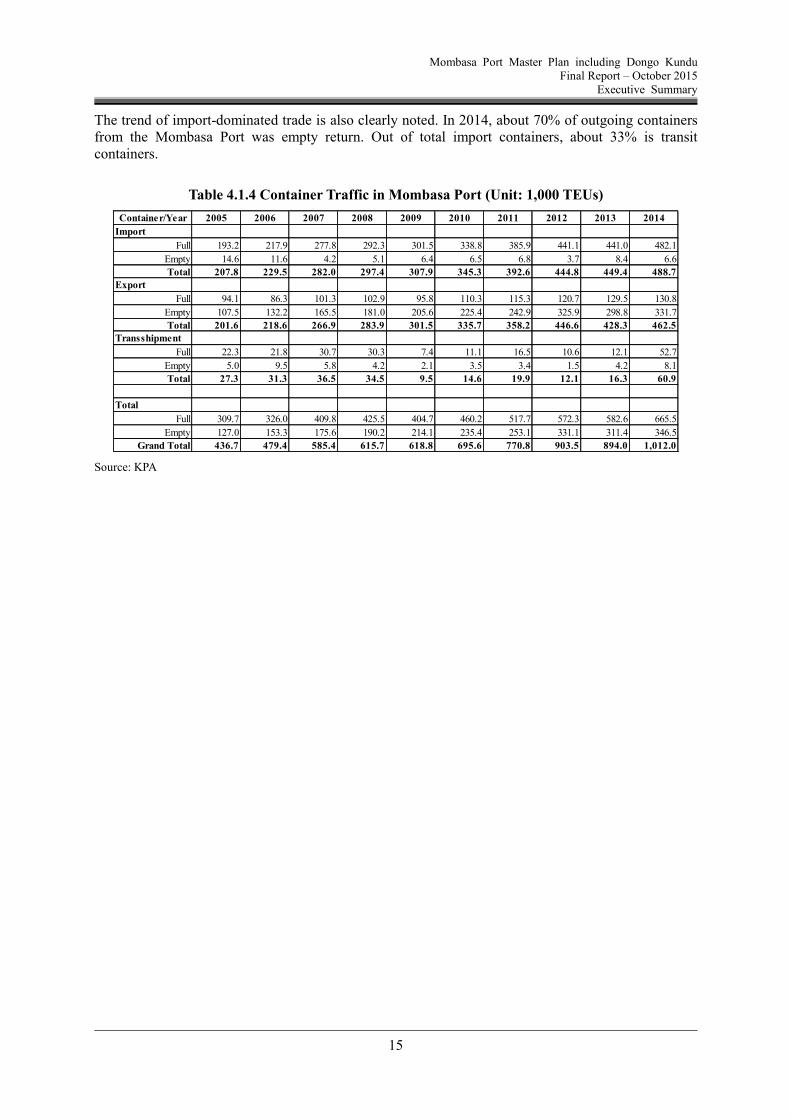
The trend of import-dominated trade is also clearly noted. In 2014, about 70% of outgoing containers from the Mombasa Port was empty return. Out of total import containers, about 33% is transit containers.
Table 4.1.4 Container Traffic in Mombasa Port (Unit: 1,000 TEUs)
Grand Total 436.7 479.4 585.4 615.7 618.8 695.6 770.8 903.5 894.0 1,012.0
Mombasa Port Master Plan including Dongo Kundu Final Report – October 2015
Executive Summary
16
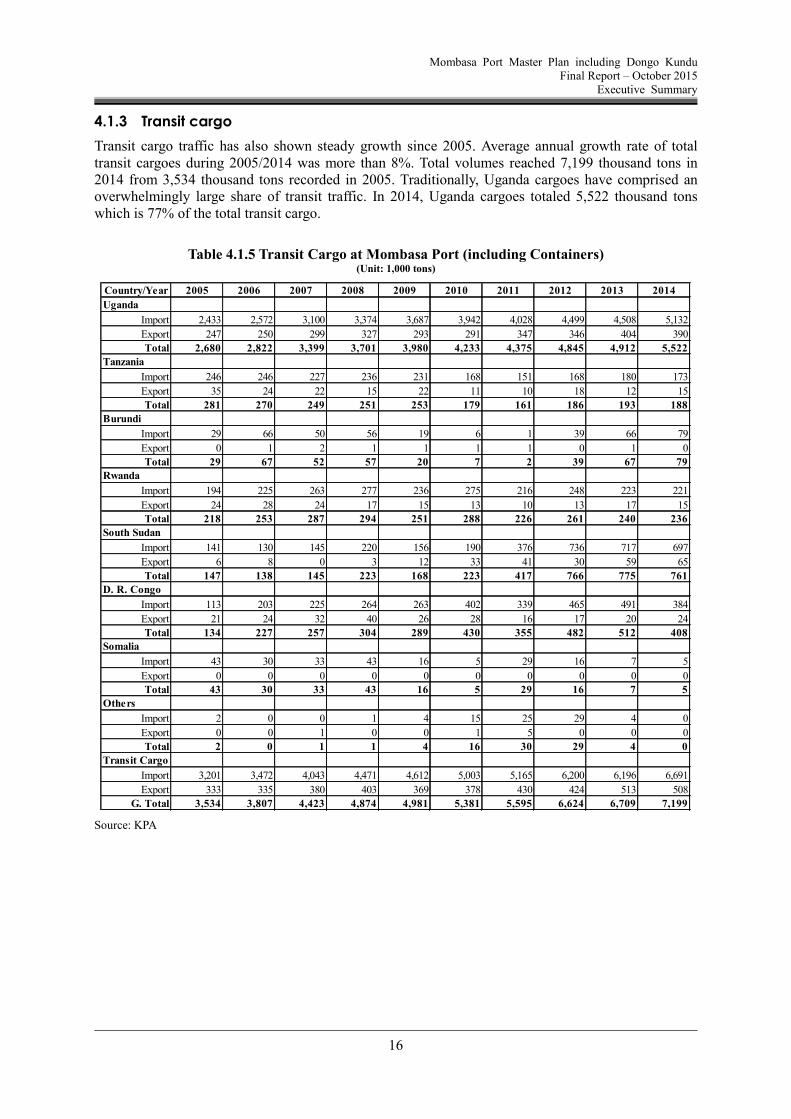
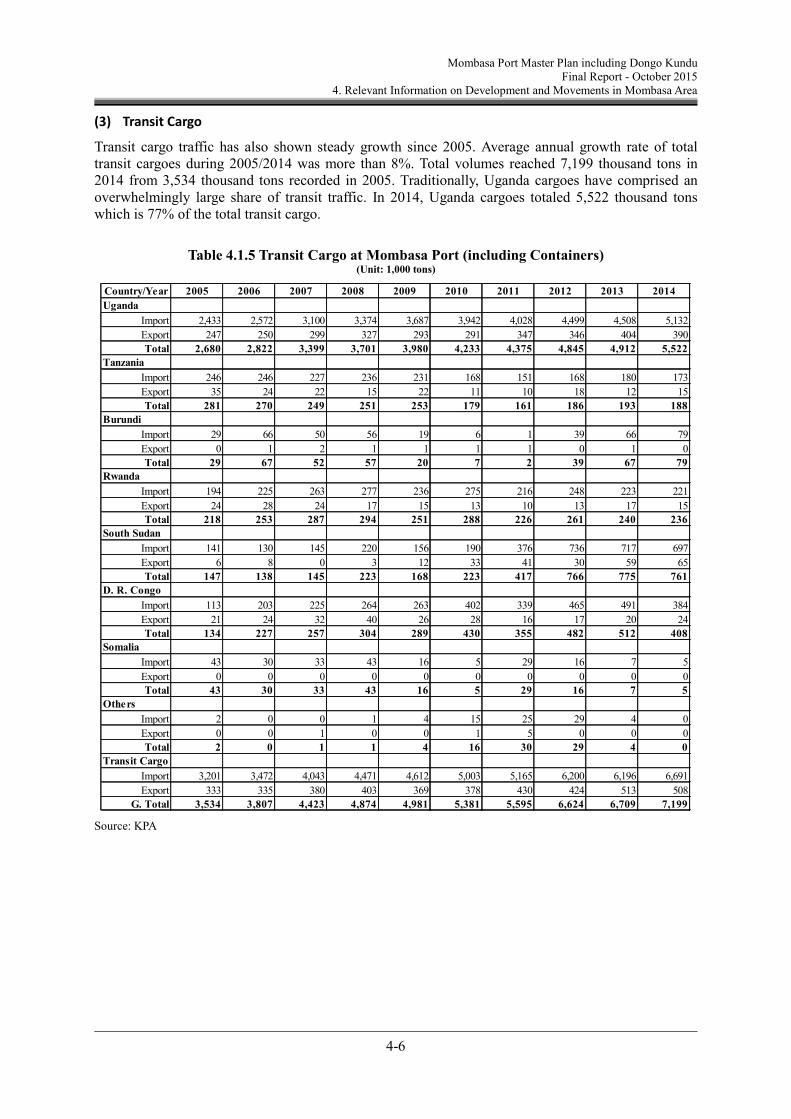
4.1.3 Transit cargo
Transit cargo traffic has also shown steady growth since 2005. Average annual growth rate of total transit cargoes during 2005/2014 was more than 8%. Total volumes reached 7,199 thousand tons in 2014 from 3,534 thousand tons recorded in 2005. Traditionally, Uganda cargoes have comprised an overwhelmingly large share of transit traffic. In 2014, Uganda cargoes totaled 5,522 thousand tons which is 77% of the total transit cargo.
Table 4.1.5 Transit Cargo at Mombasa Port (including Containers) (Unit: 1,000 tons)
G. Total 3,534 3,807 4,423 4,874 4,981 5,381 5,595 6,624 6,709 7,199
Mombasa Port Master Plan including Dongo Kundu Final Report – October 2015
Executive Summary
17
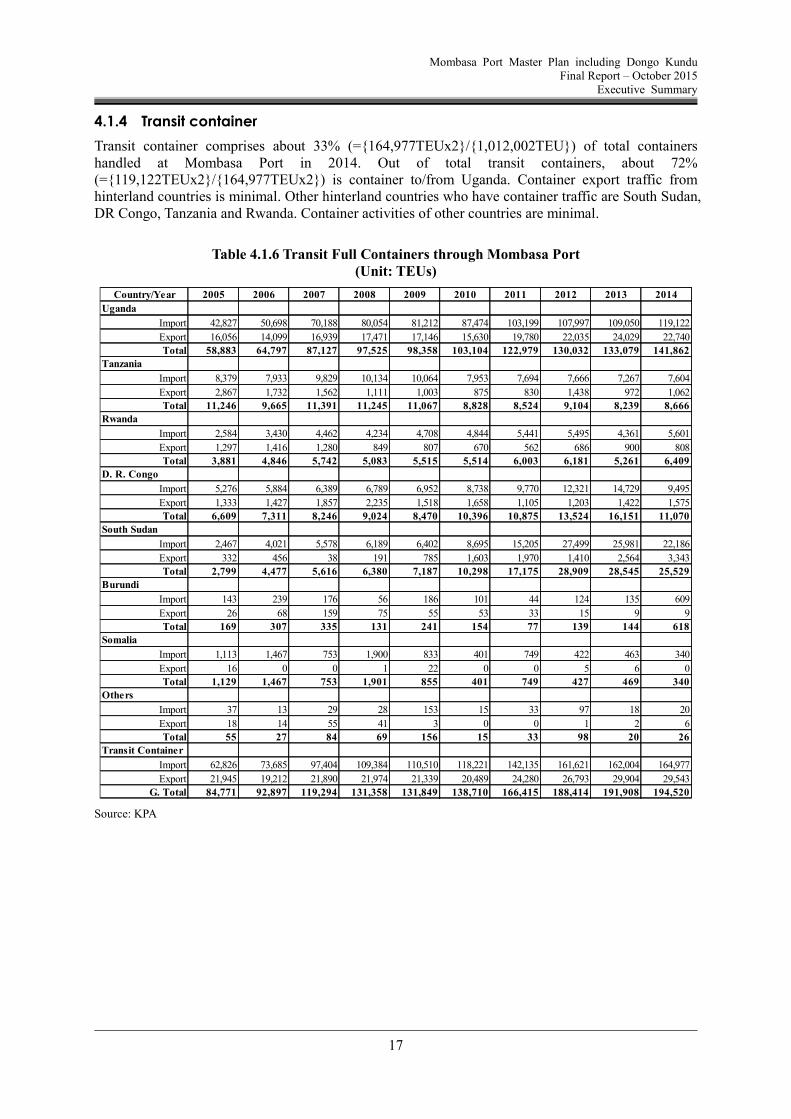
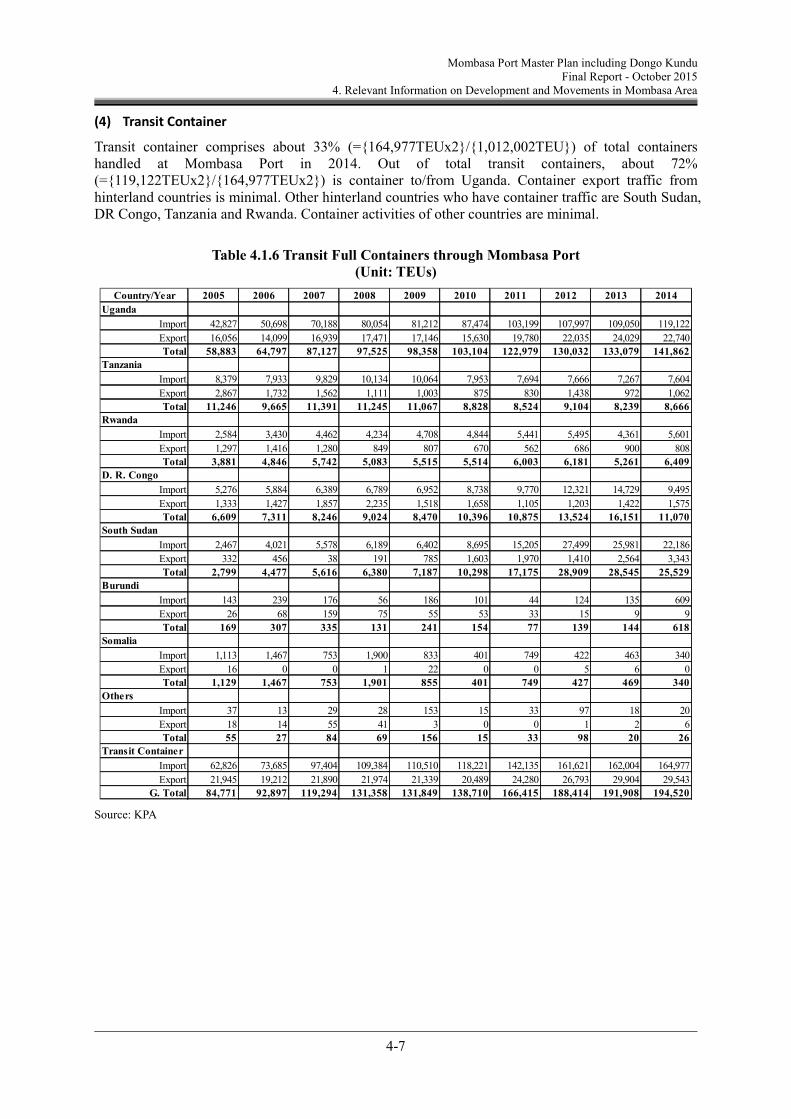
4.1.4 Transit container
Transit container comprises about 33% (={164,977TEUx2}/{1,012,002TEU}) of total containers handled at Mombasa Port in 2014. Out of total transit containers, about 72% (={119,122TEUx2}/{164,977TEUx2}) is container to/from Uganda. Container export traffic from hinterland countries is minimal. Other hinterland countries who have container traffic are South Sudan, DR Congo, Tanzania and Rwanda. Container activities of other countries are minimal.
Table 4.1.6 Transit Full Containers through Mombasa Port (Unit: TEUs)
G. Total 84,771 92,897 119,294 131,358 131,849 138,710 166,415 188,414 191,908 194,520
Mombasa Port Master Plan including Dongo Kundu Final Report – October 2015
Executive Summary
18
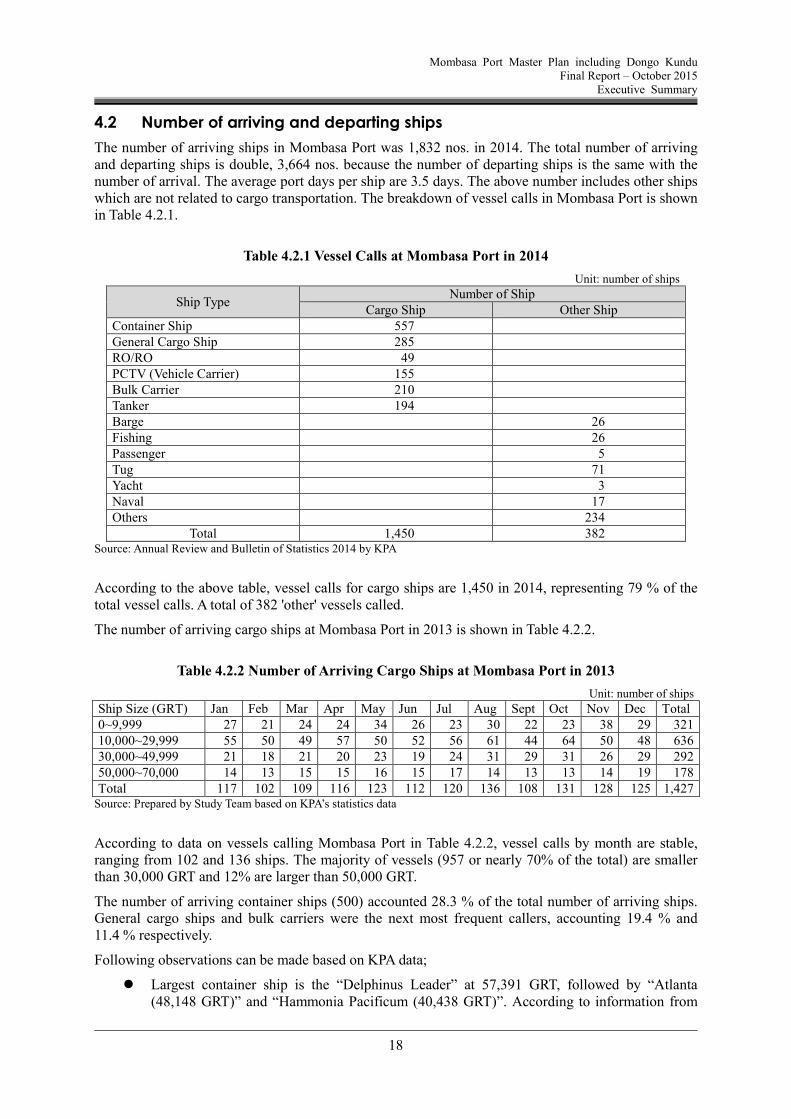
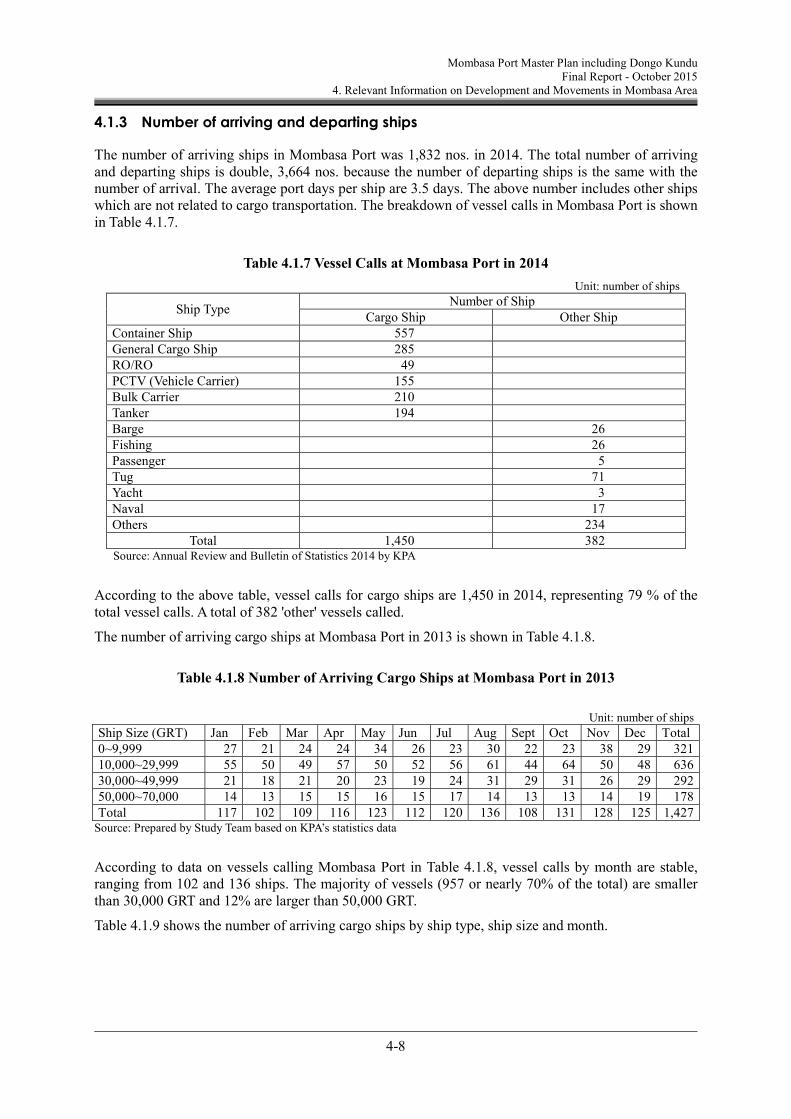
4.2 Number of arriving and departing ships
The number of arriving ships in Mombasa Port was 1,832 nos. in 2014. The total number of arriving and departing ships is double, 3,664 nos. because the number of departing ships is the same with the number of arrival. The average port days per ship are 3.5 days. The above number includes other ships which are not related to cargo transportation. The breakdown of vessel calls in Mombasa Port is shown in Table 4.2.1.
Total 1,450 382 Source: Annual Review and Bulletin of Statistics 2014 by KPA
According to the above table, vessel calls for cargo ships are 1,450 in 2014, representing 79 % of the total vessel calls. A total of 382 'other' vessels called.
The number of arriving cargo ships at Mombasa Port in 2013 is shown in Table 4.2.2.
Table 4.2.2 Number of Arriving Cargo Ships at Mombasa Port in 2013
Unit: number of ships
Ship Size (GRT) Jan Feb Mar Apr May Jun Jul Aug Sept Oct Nov Dec Total 0~9,999 27 21 24 24 34 26 23 30 22 23 38 29 321 10,000~29,999 55 50 49 57 50 52 56 61 44 64 50 48 636 30,000~49,999 21 18 21 20 23 19 24 31 29 31 26 29 292 50,000~70,000 14 13 15 15 16 15 17 14 13 13 14 19 178 Total 117 102 109 116 123 112 120 136 108 131 128 125 1,427
Source: Prepared by Study Team based on KPA’s statistics data
According to data on vessels calling Mombasa Port in Table 4.2.2, vessel calls by month are stable, ranging from 102 and 136 ships. The majority of vessels (957 or nearly 70% of the total) are smaller than 30,000 GRT and 12% are larger than 50,000 GRT.
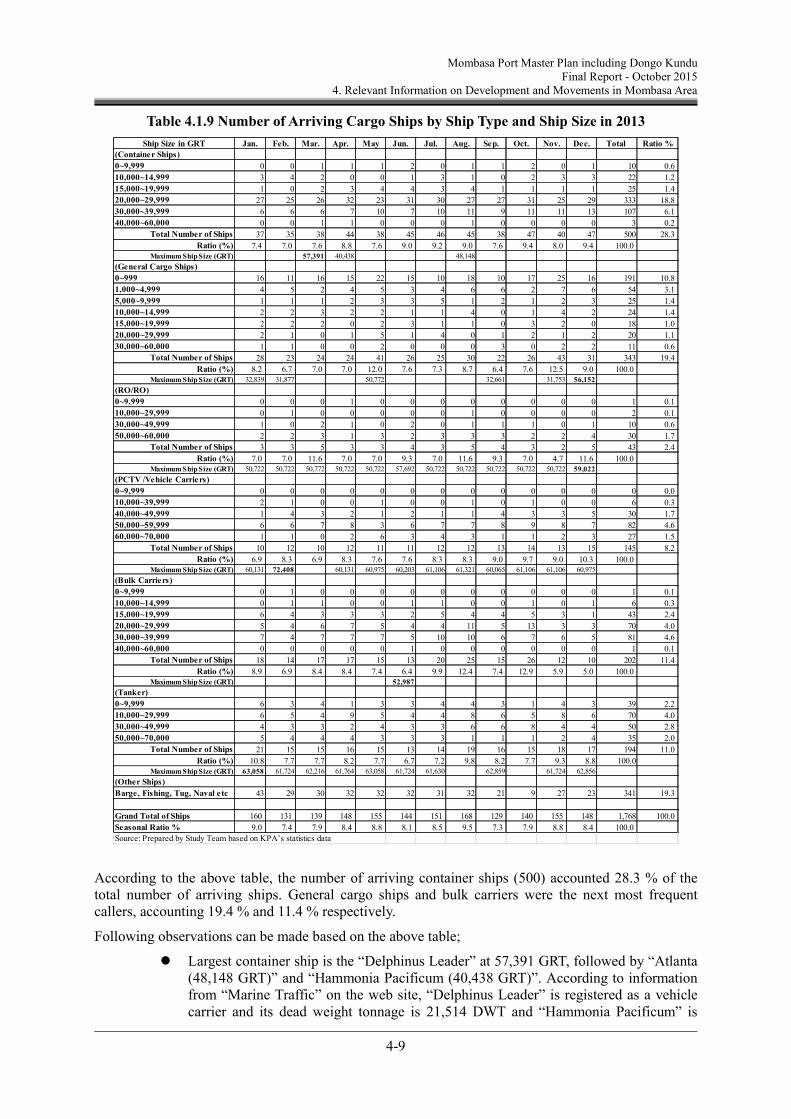
The number of arriving container ships (500) accounted 28.3 % of the total number of arriving ships. General cargo ships and bulk carriers were the next most frequent callers, accounting 19.4 % and 11.4 % respectively.
Following observations can be made based on KPA data;
Largest container ship is the “Delphinus Leader” at 57,391 GRT, followed by “Atlanta (48,148 GRT)” and “Hammonia Pacificum (40,438 GRT)”. According to information from
Mombasa Port Master Plan including Dongo Kundu Final Report – October 2015
Executive Summary
19
“Marine Traffic” on the web site, “Delphinus Leader” is registered as a vehicle carrier and its dead weight tonnage is 21,514 DWT and “Hammonia Pacificum” is 26,435 GRT, not 40,438 GRT. Further the registered “Atlanta” is OOCL “ATLANTA” container ship with 89,097 GRT. “Atlanta” might be a RO/RO vessel because her berthing location is Berth No.1. As a result, it is assumed that a container ship larger than 40,000 GRT did not call at Mombasa Port in 2013.
Largest general cargo ship is “Usher Sagar” registered in India at 56,152 GRT, but there is no information in “Marine Traffic” on the web site. The “Jolly Quarzo” is a larger ship at 50,722 GRT. She is registered as a vehicle carrier on “Marine Traffic”. Two other ships, namely “Filia Glory (32,839 GRT)“ and “Wikanda Naree (32,661 GRT)”, are registered as a bulk carrier on “Marine Traffic”. This means that some bulk carriers having larger dead weight tonnage are categorized as general cargo ship in KPA’s statistic data. However, it is difficult to identify ships as bulk or general cargo because the majority of bulk ships are equipped with ship gears. Furthermore, container ships with ship gears are originally general cargo ships into which container cargoes can be loaded as cargoes for developing countries.
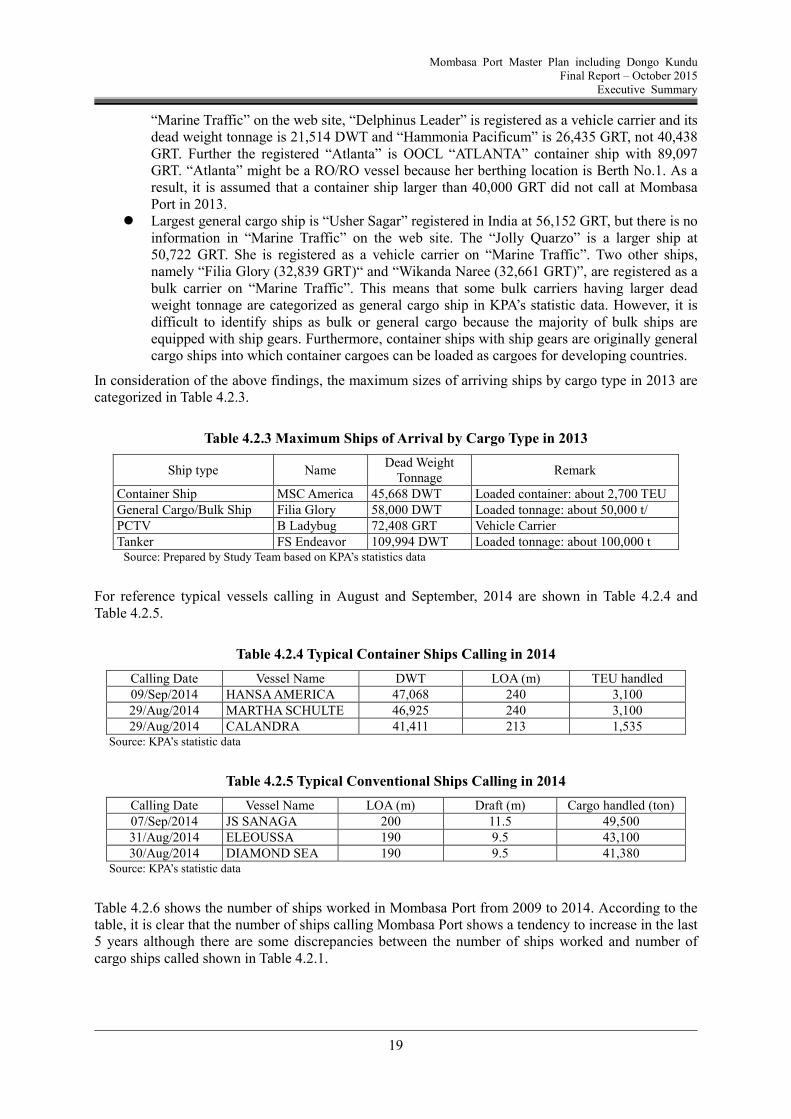
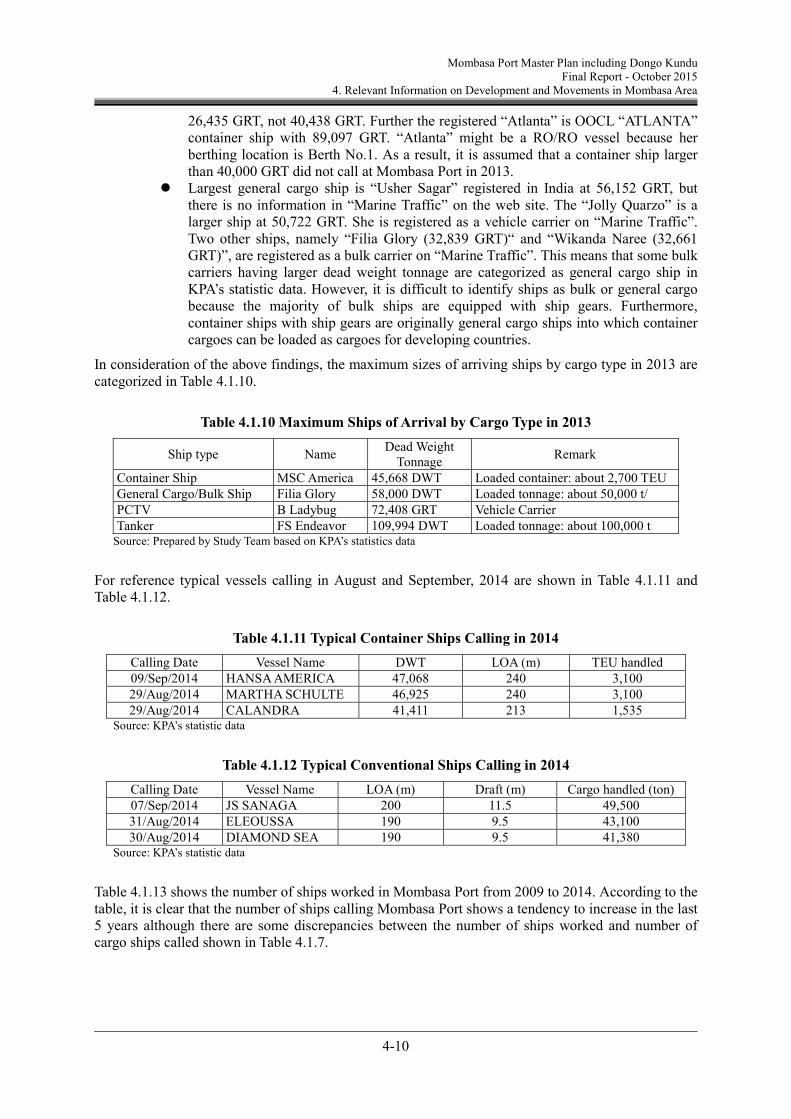
In consideration of the above findings, the maximum sizes of arriving ships by cargo type in 2013 are categorized in Table 4.2.3.
Table 4.2.3 Maximum Ships of Arrival by Cargo Type in 2013
Ship type Name Dead Weight
Tonnage Remark
Container Ship MSC America 45,668 DWT Loaded container: about 2,700 TEU General Cargo/Bulk Ship Filia Glory 58,000 DWT Loaded tonnage: about 50,000 t/ PCTV B Ladybug 72,408 GRT Vehicle Carrier Tanker FS Endeavor 109,994 DWT Loaded tonnage: about 100,000 t
Source: Prepared by Study Team based on KPA’s statistics data
For reference typical vessels calling in August and September, 2014 are shown in Table 4.2.4 and Table 4.2.5.
Table 4.2.4 Typical Container Ships Calling in 2014
Calling Date Vessel Name DWT LOA (m) TEU handled 09/Sep/2014 HANSA AMERICA 47,068 240 3,100 29/Aug/2014 MARTHA SCHULTE 46,925 240 3,100 29/Aug/2014 CALANDRA 41,411 213 1,535
Source: KPA’s statistic data
Table 4.2.5 Typical Conventional Ships Calling in 2014
Calling Date Vessel Name LOA (m) Draft (m) Cargo handled (ton) 07/Sep/2014 JS SANAGA 200 11.5 49,500 31/Aug/2014 ELEOUSSA 190 9.5 43,100 30/Aug/2014 DIAMOND SEA 190 9.5 41,380
Source: KPA’s statistic data
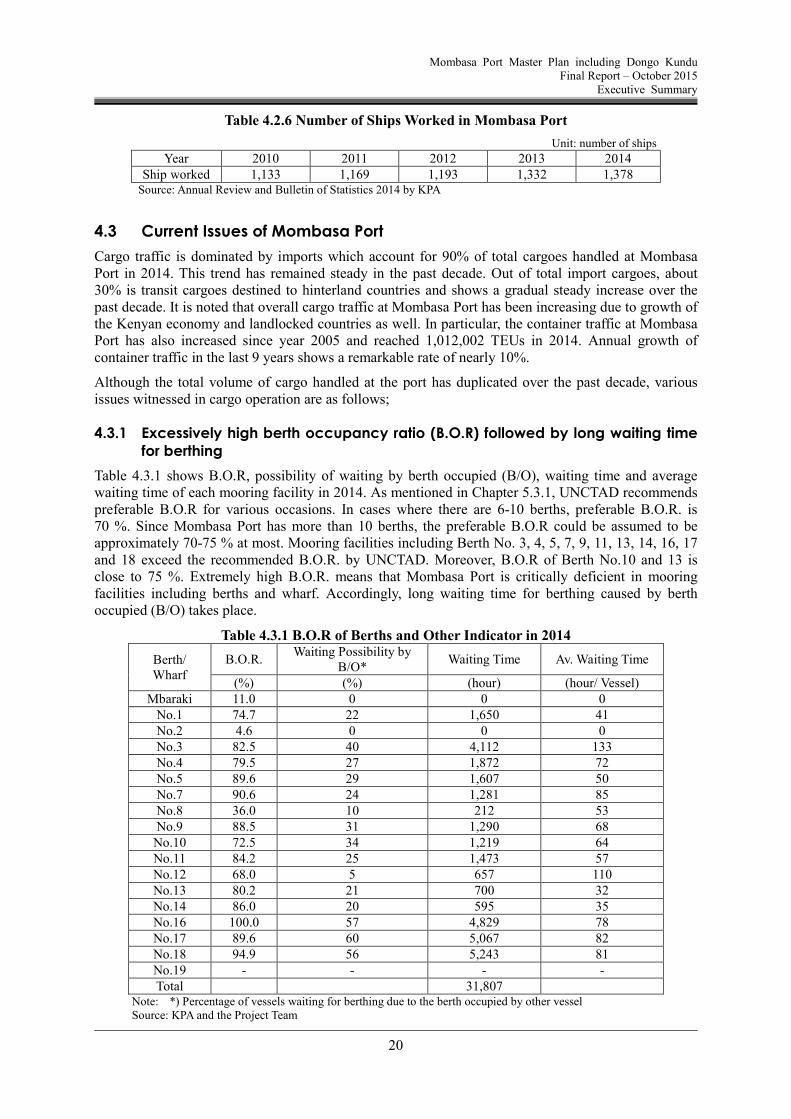
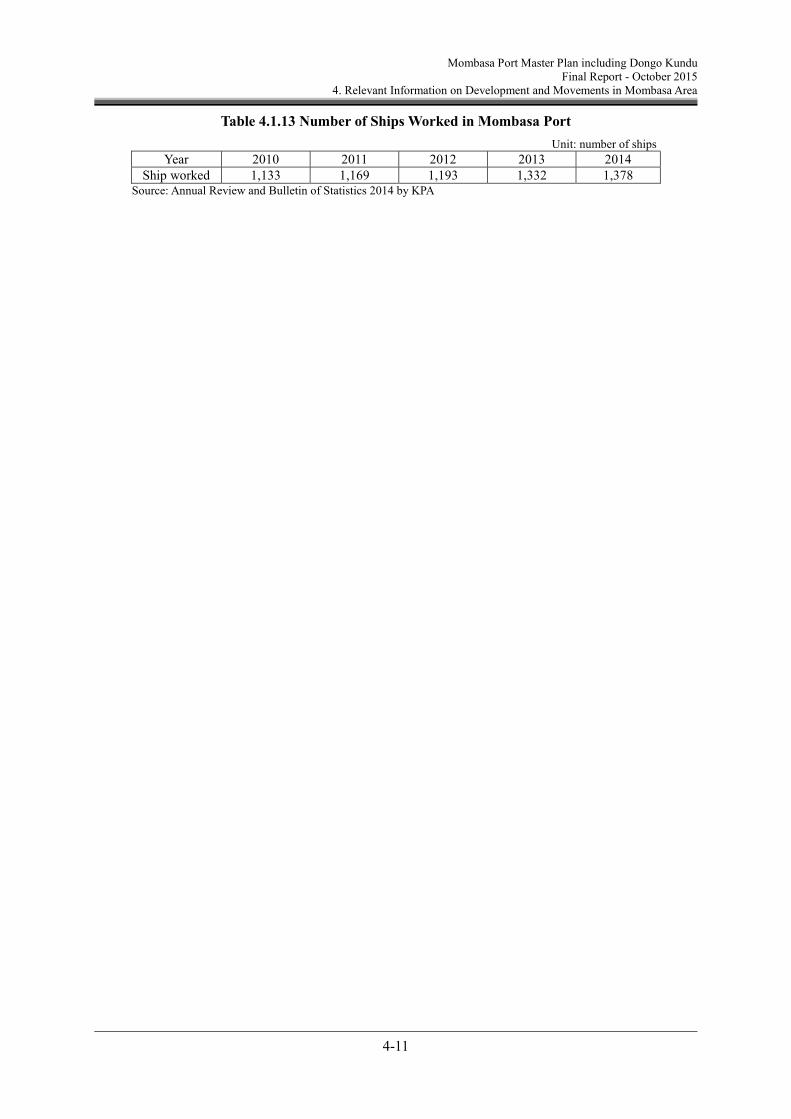
Table 4.2.6 shows the number of ships worked in Mombasa Port from 2009 to 2014. According to the table, it is clear that the number of ships calling Mombasa Port shows a tendency to increase in the last 5 years although there are some discrepancies between the number of ships worked and number of cargo ships called shown in Table 4.2.1.
Mombasa Port Master Plan including Dongo Kundu Final Report – October 2015
Executive Summary
20
Table 4.2.6 Number of Ships Worked in Mombasa Port
Unit: number of ships
Year 2010 2011 2012 2013 2014 Ship worked 1,133 1,169 1,193 1,332 1,378
Source: Annual Review and Bulletin of Statistics 2014 by KPA
4.3 Current Issues of Mombasa Port
Cargo traffic is dominated by imports which account for 90% of total cargoes handled at Mombasa Port in 2014. This trend has remained steady in the past decade. Out of total import cargoes, about 30% is transit cargoes destined to hinterland countries and shows a gradual steady increase over the past decade. It is noted that overall cargo traffic at Mombasa Port has been increasing due to growth of the Kenyan economy and landlocked countries as well. In particular, the container traffic at Mombasa Port has also increased since year 2005 and reached 1,012,002 TEUs in 2014. Annual growth of container traffic in the last 9 years shows a remarkable rate of nearly 10%.
Although the total volume of cargo handled at the port has duplicated over the past decade, various issues witnessed in cargo operation are as follows;
4.3.1 Excessively high berth occupancy ratio (B.O.R) followed by long waiting time for berthing
Table 4.3.1 shows B.O.R, possibility of waiting by berth occupied (B/O), waiting time and average waiting time of each mooring facility in 2014. As mentioned in Chapter 5.3.1, UNCTAD recommends preferable B.O.R for various occasions. In cases where there are 6-10 berths, preferable B.O.R. is 70 %. Since Mombasa Port has more than 10 berths, the preferable B.O.R could be assumed to be approximately 70-75 % at most. Mooring facilities including Berth No. 3, 4, 5, 7, 9, 11, 13, 14, 16, 17 and 18 exceed the recommended B.O.R. by UNCTAD. Moreover, B.O.R of Berth No.10 and 13 is close to 75 %. Extremely high B.O.R. means that Mombasa Port is critically deficient in mooring facilities including berths and wharf. Accordingly, long waiting time for berthing caused by berth occupied (B/O) takes place.
Table 4.3.1 B.O.R of Berths and Other Indicator in 2014
Note: *) Percentage of vessels waiting for berthing due to the berth occupied by other vessel Source: KPA and the Project Team
Mombasa Port Master Plan including Dongo Kundu Final Report – October 2015
Executive Summary
21
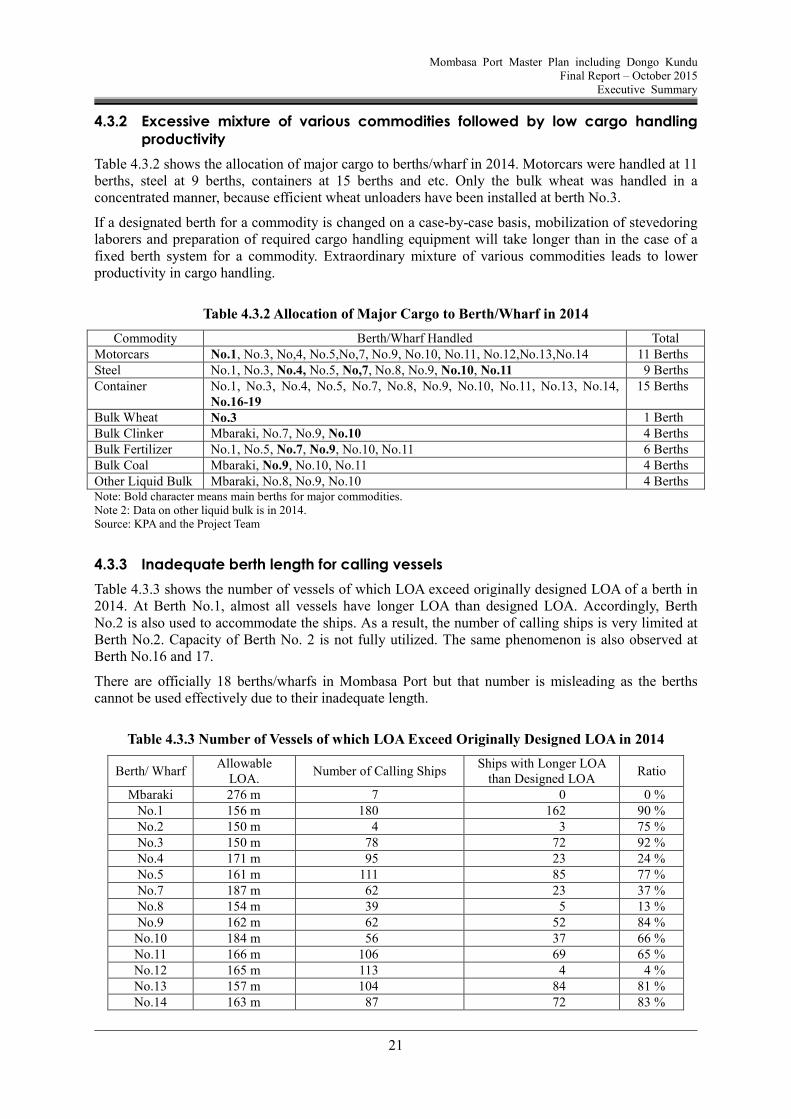
4.3.2 Excessive mixture of various commodities followed by low cargo handling productivity
Table 4.3.2 shows the allocation of major cargo to berths/wharf in 2014. Motorcars were handled at 11 berths, steel at 9 berths, containers at 15 berths and etc. Only the bulk wheat was handled in a concentrated manner, because efficient wheat unloaders have been installed at berth No.3.
If a designated berth for a commodity is changed on a case-by-case basis, mobilization of stevedoring laborers and preparation of required cargo handling equipment will take longer than in the case of a fixed berth system for a commodity. Extraordinary mixture of various commodities leads to lower productivity in cargo handling.
Table 4.3.2 Allocation of Major Cargo to Berth/Wharf in 2014
Bulk Wheat No.3 1 Berth Bulk Clinker Mbaraki, No.7, No.9, No.10 4 Berths Bulk Fertilizer No.1, No.5, No.7, No.9, No.10, No.11 6 Berths Bulk Coal Mbaraki, No.9, No.10, No.11 4 Berths Other Liquid Bulk Mbaraki, No.8, No.9, No.10 4 Berths Note: Bold character means main berths for major commodities. Note 2: Data on other liquid bulk is in 2014. Source: KPA and the Project Team
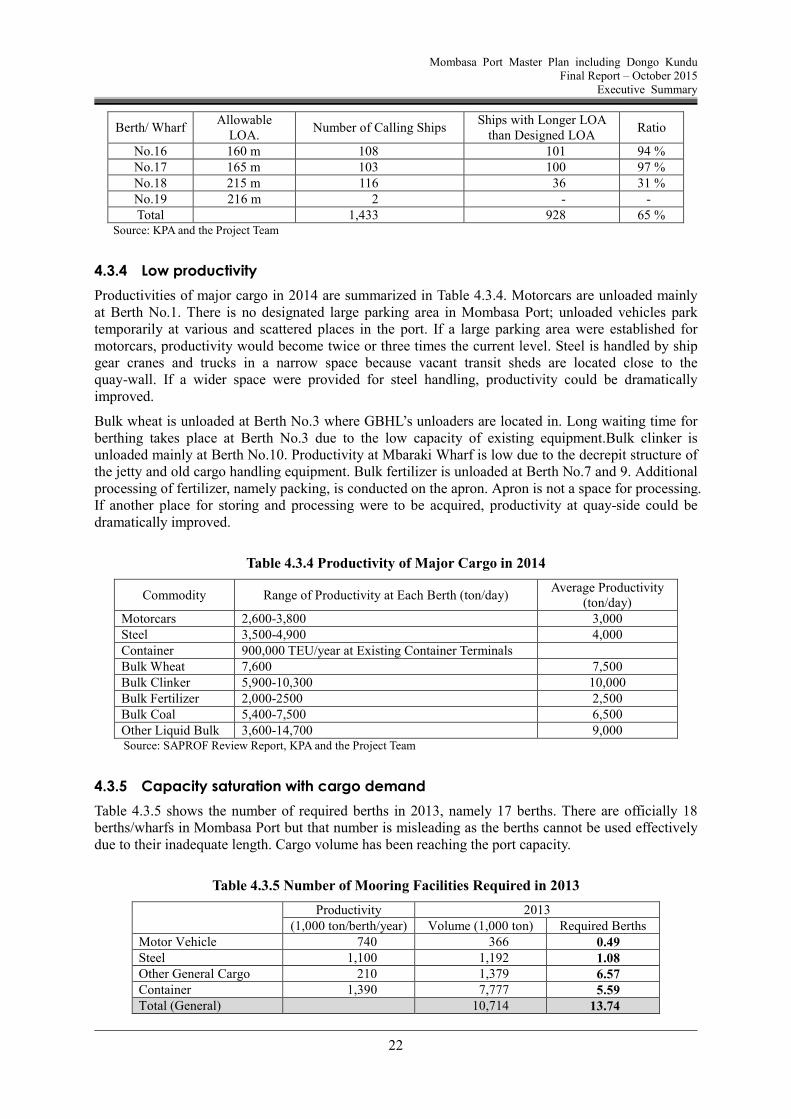
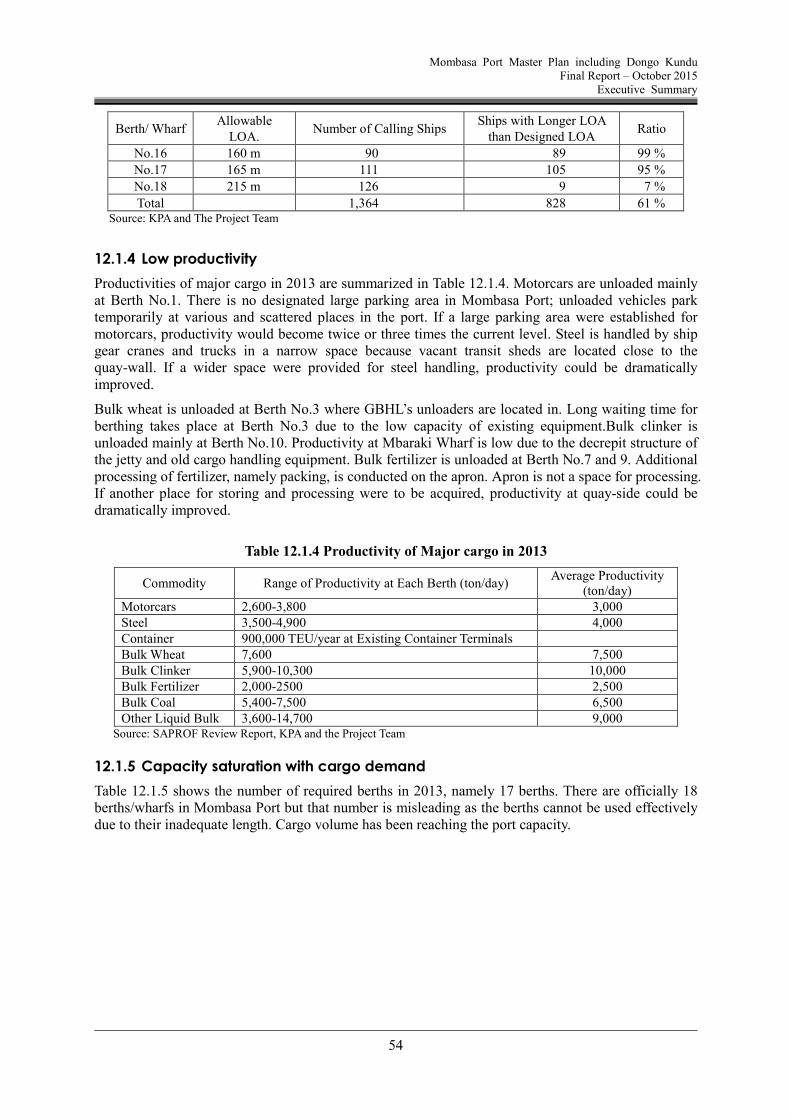
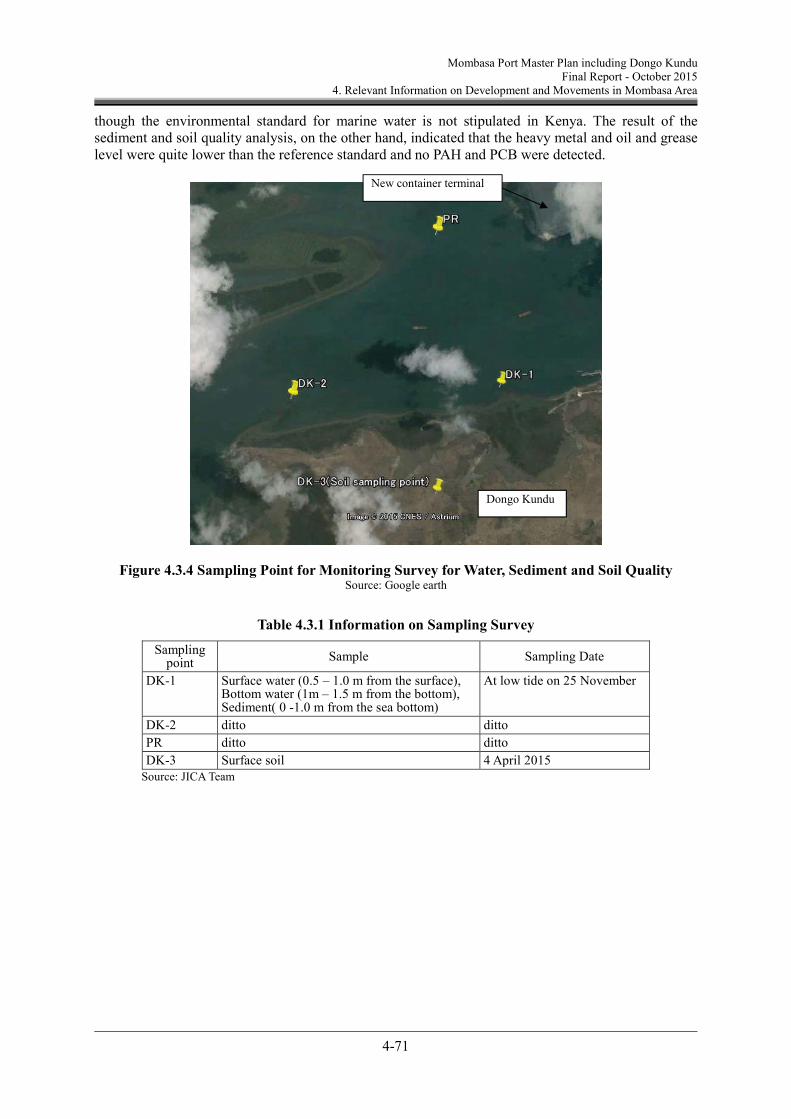
4.3.3 Inadequate berth length for calling vessels
Table 4.3.3 shows the number of vessels of which LOA exceed originally designed LOA of a berth in 2014. At Berth No.1, almost all vessels have longer LOA than designed LOA. Accordingly, Berth No.2 is also used to accommodate the ships. As a result, the number of calling ships is very limited at Berth No.2. Capacity of Berth No. 2 is not fully utilized. The same phenomenon is also observed at Berth No.16 and 17.
There are officially 18 berths/wharfs in Mombasa Port but that number is misleading as the berths cannot be used effectively due to their inadequate length.
Table 4.3.3 Number of Vessels of which LOA Exceed Originally Designed LOA in 2014
Berth/ Wharf Allowable
LOA. Number of Calling Ships
Ships with Longer LOA than Designed LOA
Ratio
Mbaraki 276 m 7 0 0 % No.1 156 m 180 162 90 % No.2 150 m 4 3 75 % No.3 150 m 78 72 92 % No.4 171 m 95 23 24 % No.5 161 m 111 85 77 % No.7 187 m 62 23 37 % No.8 154 m 39 5 13 % No.9 162 m 62 52 84 %
No.10 184 m 56 37 66 % No.11 166 m 106 69 65 % No.12 165 m 113 4 4 % No.13 157 m 104 84 81 % No.14 163 m 87 72 83 %
Mombasa Port Master Plan including Dongo Kundu Final Report – October 2015
Executive Summary
22
Berth/ Wharf Allowable
LOA. Number of Calling Ships
Ships with Longer LOA than Designed LOA
Ratio
No.16 160 m 108 101 94 % No.17 165 m 103 100 97 % No.18 215 m 116 36 31 % No.19 216 m 2 - - Total 1,433 928 65 %
Source: KPA and the Project Team
4.3.4 Low productivity
Productivities of major cargo in 2014 are summarized in Table 4.3.4. Motorcars are unloaded mainly at Berth No.1. There is no designated large parking area in Mombasa Port; unloaded vehicles park temporarily at various and scattered places in the port. If a large parking area were established for motorcars, productivity would become twice or three times the current level. Steel is handled by ship gear cranes and trucks in a narrow space because vacant transit sheds are located close to the quay-wall. If a wider space were provided for steel handling, productivity could be dramatically improved.
Bulk wheat is unloaded at Berth No.3 where GBHL’s unloaders are located in. Long waiting time for berthing takes place at Berth No.3 due to the low capacity of existing equipment.Bulk clinker is unloaded mainly at Berth No.10. Productivity at Mbaraki Wharf is low due to the decrepit structure of the jetty and old cargo handling equipment. Bulk fertilizer is unloaded at Berth No.7 and 9. Additional processing of fertilizer, namely packing, is conducted on the apron. Apron is not a space for processing. If another place for storing and processing were to be acquired, productivity at quay-side could be dramatically improved.
Table 4.3.4 Productivity of Major Cargo in 2014
Commodity Range of Productivity at Each Berth (ton/day) Average Productivity
(ton/day) Motorcars 2,600-3,800 3,000 Steel 3,500-4,900 4,000 Container 900,000 TEU/year at Existing Container Terminals Bulk Wheat 7,600 7,500 Bulk Clinker 5,900-10,300 10,000 Bulk Fertilizer 2,000-2500 2,500 Bulk Coal 5,400-7,500 6,500 Other Liquid Bulk 3,600-14,700 9,000 Source: SAPROF Review Report, KPA and the Project Team
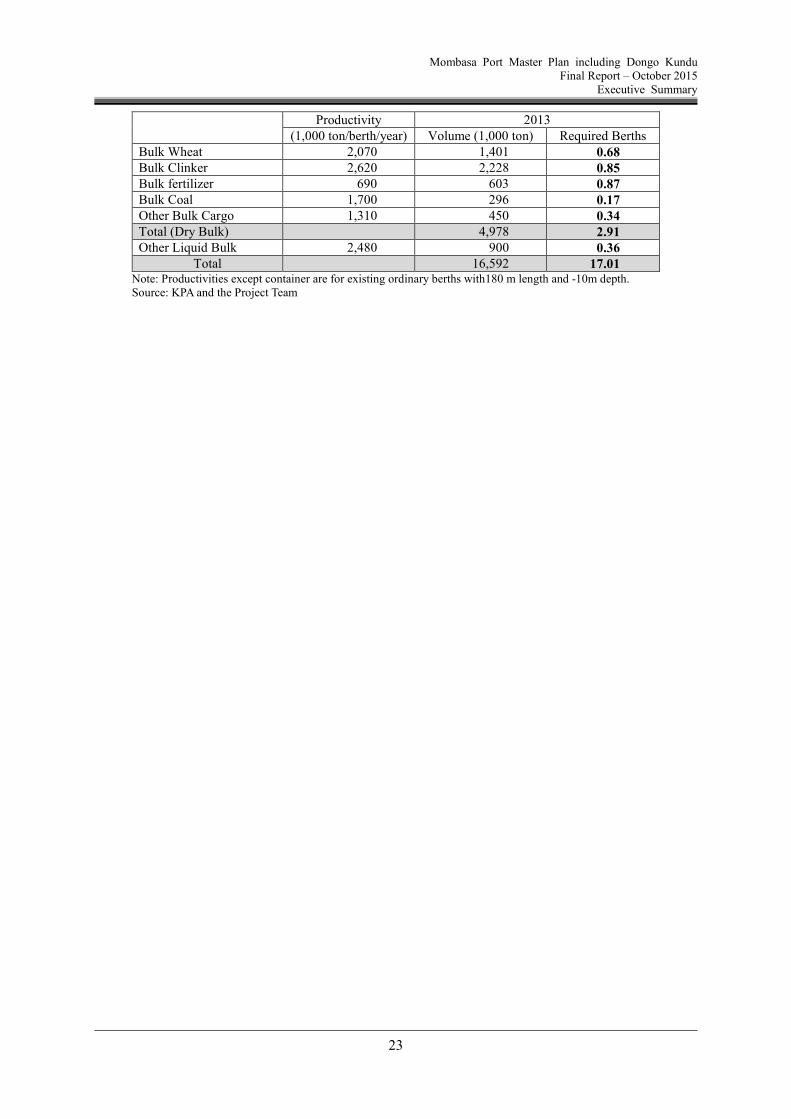
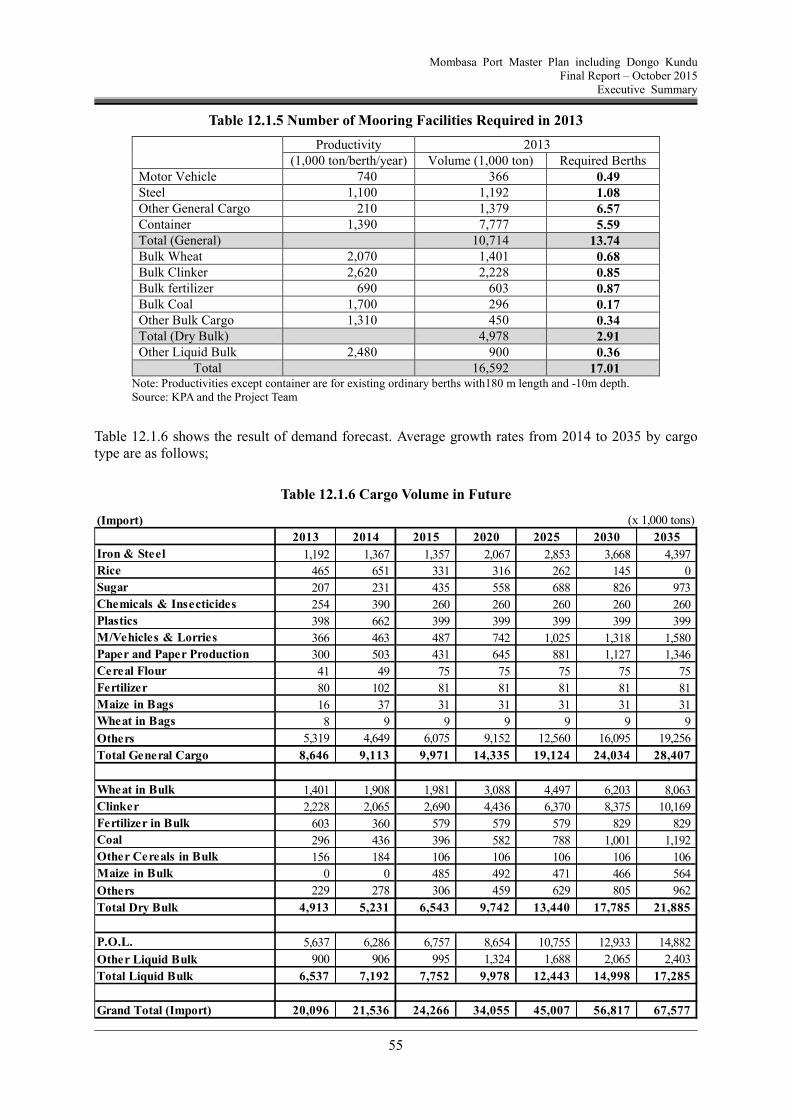
4.3.5 Capacity saturation with cargo demand
Table 4.3.5 shows the number of required berths in 2013, namely 17 berths. There are officially 18 berths/wharfs in Mombasa Port but that number is misleading as the berths cannot be used effectively due to their inadequate length. Cargo volume has been reaching the port capacity.
Table 4.3.5 Number of Mooring Facilities Required in 2013
Productivity 2013
(1,000 ton/berth/year) Volume (1,000 ton) Required Berths Motor Vehicle 740 366 0.49 Steel 1,100 1,192 1.08 Other General Cargo 210 1,379 6.57 Container 1,390 7,777 5.59 Total (General)
10,714 13.74
Mombasa Port Master Plan including Dongo Kundu Final Report – October 2015
SAPROF Review 2013 Updated Demand Forecast/Year 2014 Base
Mombasa Port Master Plan including Dongo Kundu Final Report – October 2015
Executive Summary
26
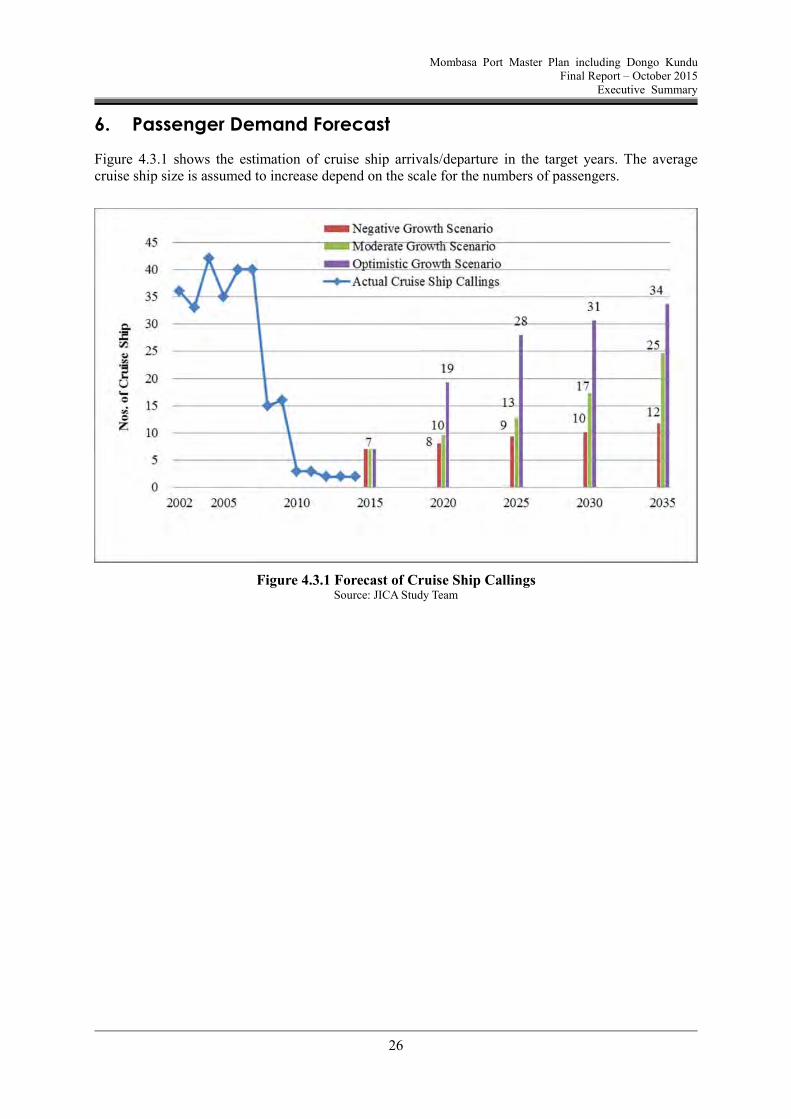
6. Passenger Demand Forecast
Figure 4.3.1 shows the estimation of cruise ship arrivals/departure in the target years. The average cruise ship size is assumed to increase depend on the scale for the numbers of passengers.
Figure 4.3.1 Forecast of Cruise Ship Callings Source: JICA Study Team
Mombasa Port Master Plan including Dongo Kundu Final Report – October 2015
Executive Summary
27
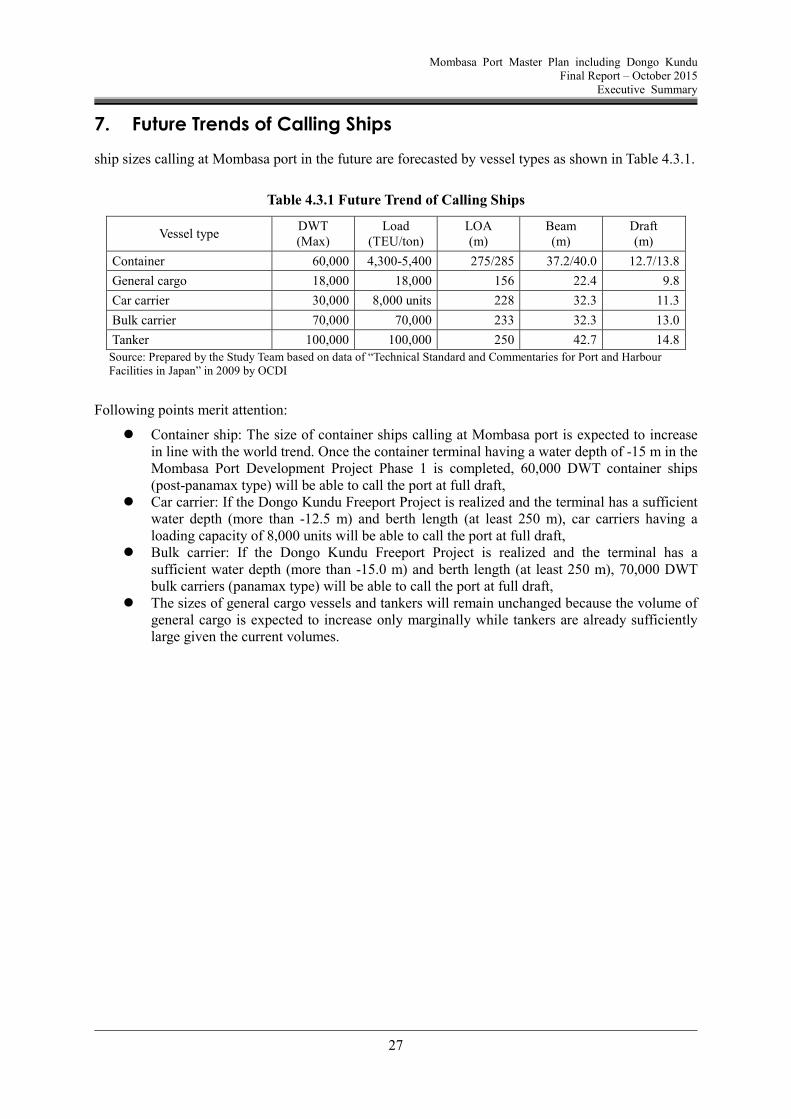
7. Future Trends of Calling Ships
ship sizes calling at Mombasa port in the future are forecasted by vessel types as shown in Table 4.3.1.
Source: Prepared by the Study Team based on data of “Technical Standard and Commentaries for Port and Harbour Facilities in Japan” in 2009 by OCDI
Following points merit attention:
Container ship: The size of container ships calling at Mombasa port is expected to increase in line with the world trend. Once the container terminal having a water depth of -15 m in the Mombasa Port Development Project Phase 1 is completed, 60,000 DWT container ships (post-panamax type) will be able to call the port at full draft,
Car carrier: If the Dongo Kundu Freeport Project is realized and the terminal has a sufficient water depth (more than -12.5 m) and berth length (at least 250 m), car carriers having a loading capacity of 8,000 units will be able to call the port at full draft,
Bulk carrier: If the Dongo Kundu Freeport Project is realized and the terminal has a sufficient water depth (more than -15.0 m) and berth length (at least 250 m), 70,000 DWT bulk carriers (panamax type) will be able to call the port at full draft,
The sizes of general cargo vessels and tankers will remain unchanged because the volume of general cargo is expected to increase only marginally while tankers are already sufficiently large given the current volumes.
Mombasa Port Master Plan including Dongo Kundu Final Report – October 2015
Executive Summary
28
8. Development Plan
8.1 Basic stance on facility planning
Although the total volume of cargo handled at the port has duplicated over the past decade, various issues in cargo handling are witnessed in the port including absolute shortage of mooring facilities, inadequate staking area, extraordinarily high berth occupancy ratio and mismatch between the length of existing berths and LOA of calling vessels of which dimension has been enlarging. Cargo handling capacity of the port has been saturated with the cargo demand already. Consequently, long waiting time for berthing due to berth occupied by another ship and low productivity in cargo handling take place. Capacity development is an urgent issue to be tackled.
Mombasa Port has various advantages in maritime transport, namely long history as an international port, an international gateway function referred by Kenya and other landlocked countries and plenty of direct hinterland which could be developed as industrial area. Mombasa Port shall be developed taking these advantages into consideration.
In this context, facility planning is conducted based on the following stances and two scenarios.
To develop Mombasa Port in the most effective and efficient manner utilizing existing resources and potential of the port.
To maximize cargo handling capacity of the port. Overflowing cargo will be handled in another international port including Lamu Port.
To develop required mooring and other facilities in a timely manner. These required facilities include terminals for MPDP, Dongo Kundu SEZ Project and other necessary projects.
To renew existing berths in Kilindini in series. Passenger facilities including a berth and terminal will be developed.
To introduce more efficient cargo handling equipment to cope with the critical shortage of berths.
8.1.1 Scenario 1
Major characteristics of scenario 1 are as follows;
Amount of Investment is minimized. New berths at Dongo Kundu are deep-water multi-purpose terminals for rapidly increasing
commodities including vehicle, wheat and container. Other bulk cargo including clinker and coal are handled at existing berths. Cargo handling productivities are to increase. Since the productivities of vehicle and grain at
deep-water terminal in Japan are three (3) to four (4) times of that in Mombasa Port, productivities at deep-water terminal in Dongo Kundu could be assumed to be three (3) to four (4) times of current productivites at existing terminals.
Ship waiting time for berthing remains at current level. Cargo handling capacity may be saturated with cargo demand at a certain year
8.1.2 Scenario 2
Major characteristics of scenario 2 are as follows;
Amount of Investment is more than Scenario 1 New berths at Dongo Kundu are deep-water multi-purpose terminals for rapidly increasing
commodities including vehicle, wheat, container, clinker and coal. A terminal for clinker and coal will commence operation in 2026.
Other bulk cargo is handled at existing berths. Cargo handling productivities are to increase. Since the productivities of vehicle and grain at
deep-water terminal in Japan are three (3) to four (4) times of that in Mombasa Port, productivities at deep-water terminal in Dongo Kundu could be assumed to be three (3) to
Mombasa Port Master Plan including Dongo Kundu Final Report – October 2015
Executive Summary
29
four (4) times of current productivites at existing terminals. Ship waiting time for berthing remains at current level. Cargo handling capacity may be saturated with cargo demand at a certain year
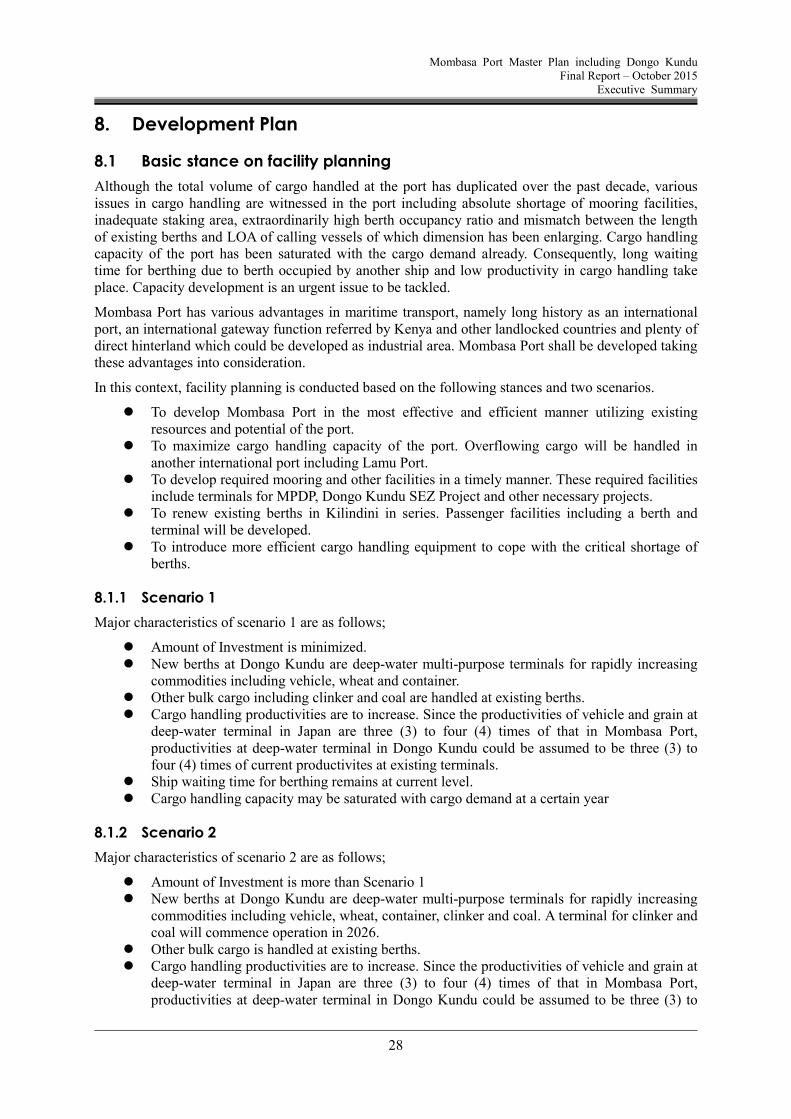
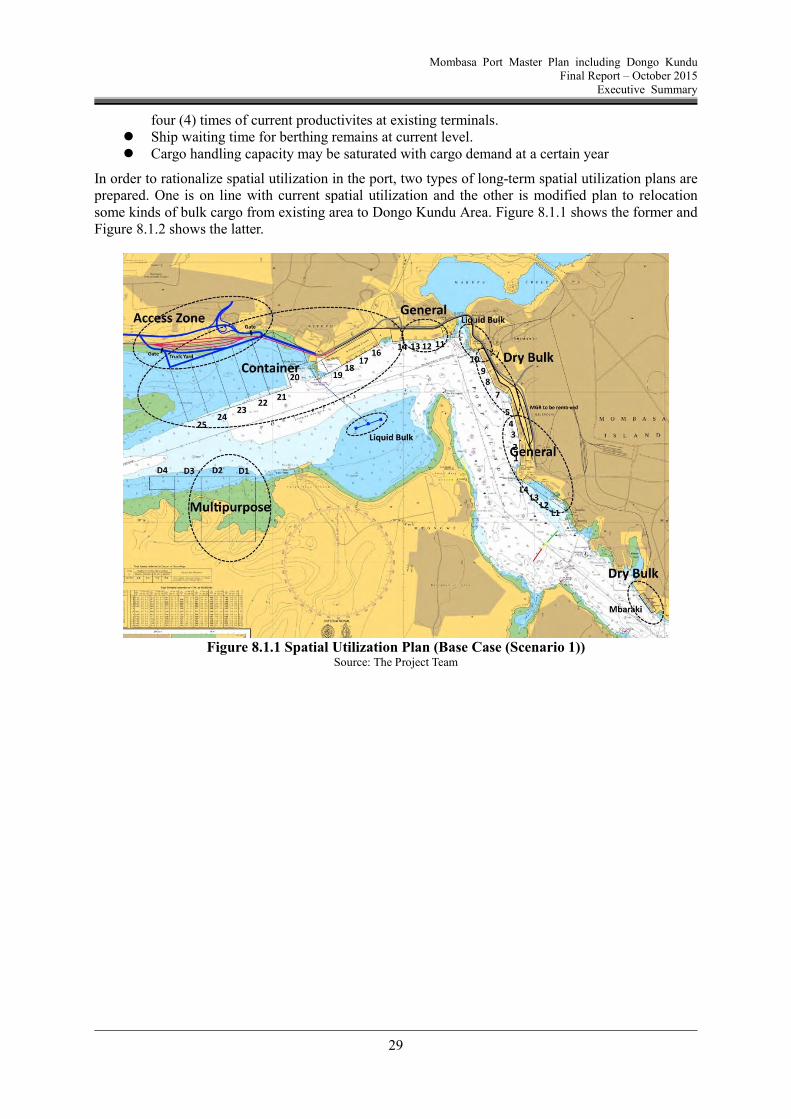
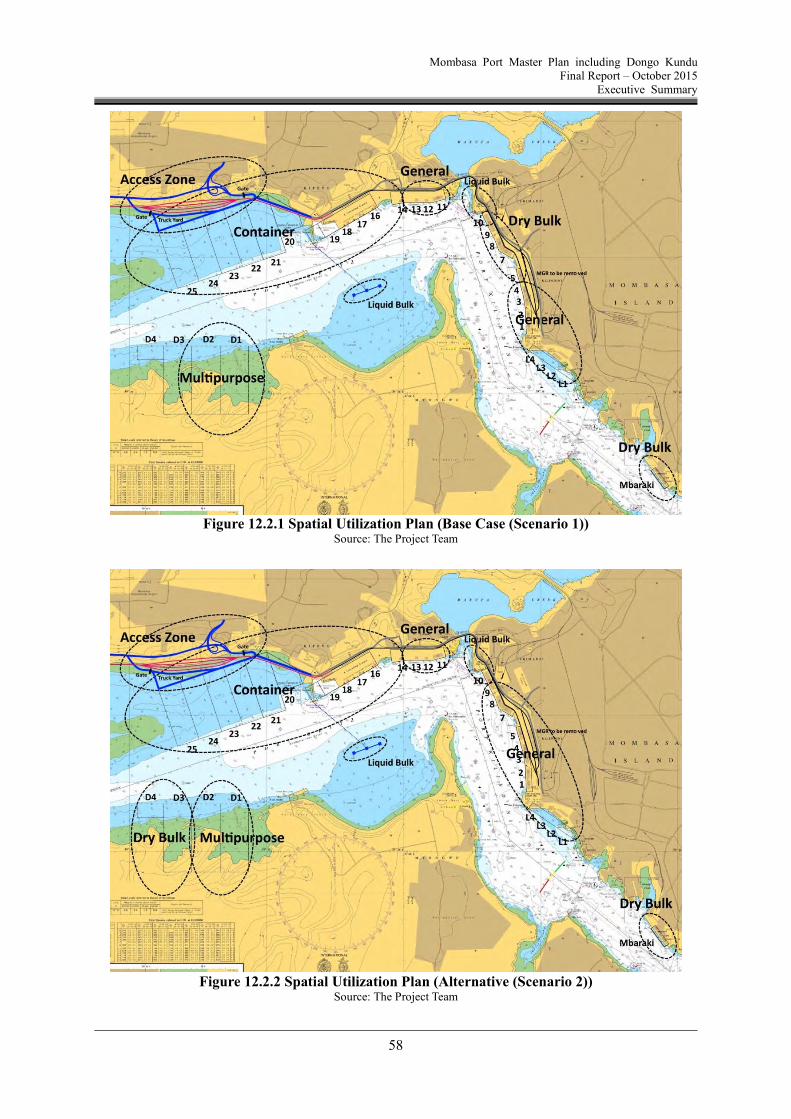
In order to rationalize spatial utilization in the port, two types of long-term spatial utilization plans are prepared. One is on line with current spatial utilization and the other is modified plan to relocation some kinds of bulk cargo from existing area to Dongo Kundu Area. Figure 8.1.1 shows the former and Figure 8.1.2 shows the latter.
Figure 8.1.1 Spatial Utilization Plan (Base Case (Scenario 1))
Source: The Project Team
Mombasa Port Master Plan including Dongo Kundu Final Report – October 2015
Executive Summary
30
Figure 8.1.2 Spatial Utilization Plan (Alternative (Scenario 2))
Source: The Project Team
Mombasa Port Master Plan including Dongo Kundu Final Report – October 2015
Executive Summary
31
8.2 Facility Development Plan and Improvement Plan
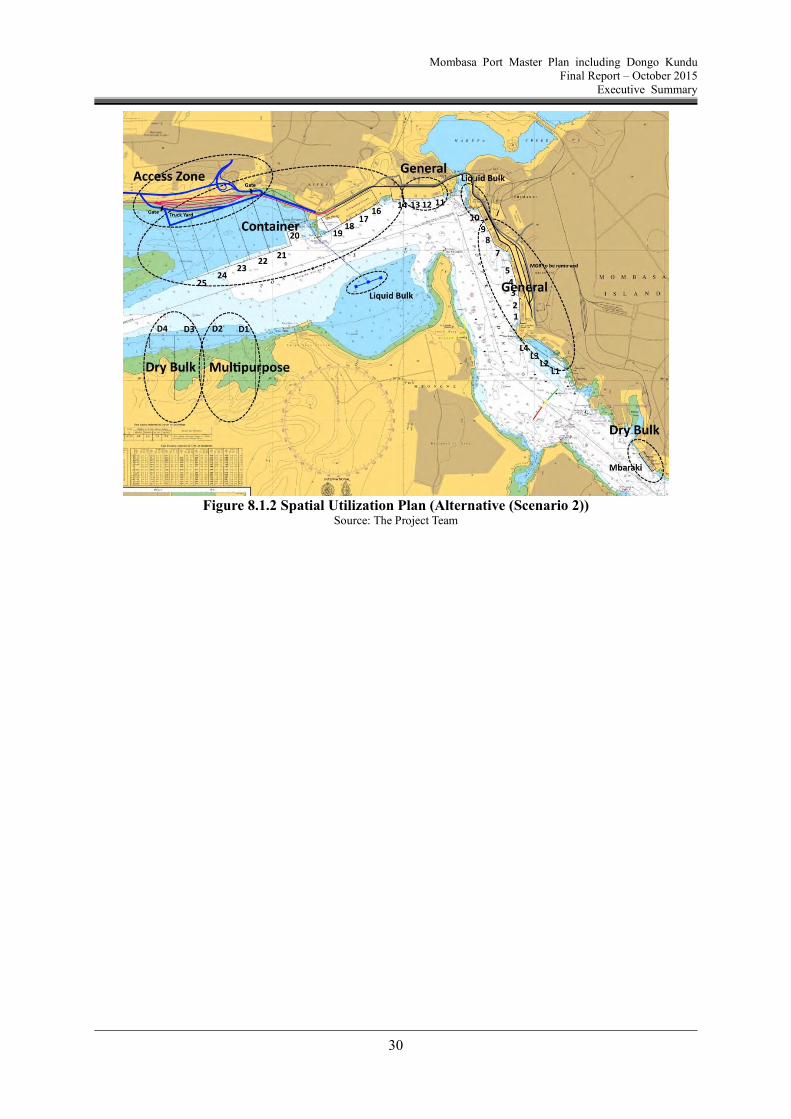
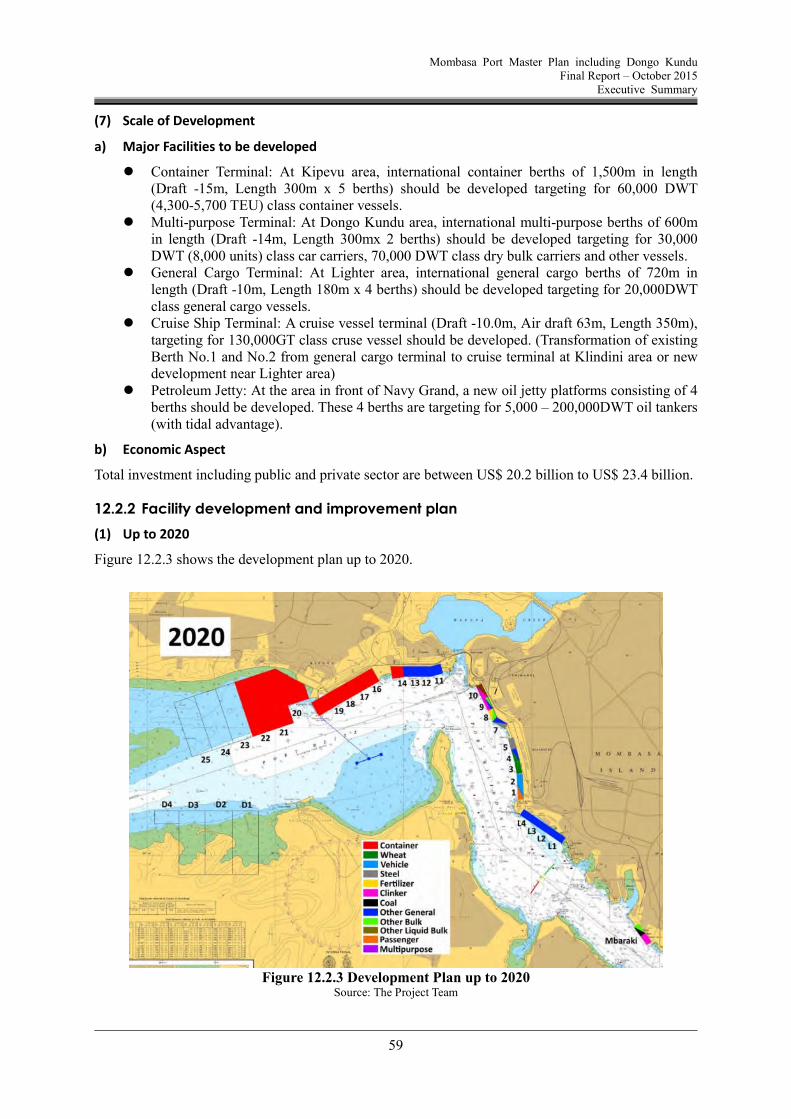
8.2.1 Up to 2020
Figure 8.2.1 shows the development plan up to 2020.
Figure 8.2.1 Development Plan up to 2020 Source: The Project Team
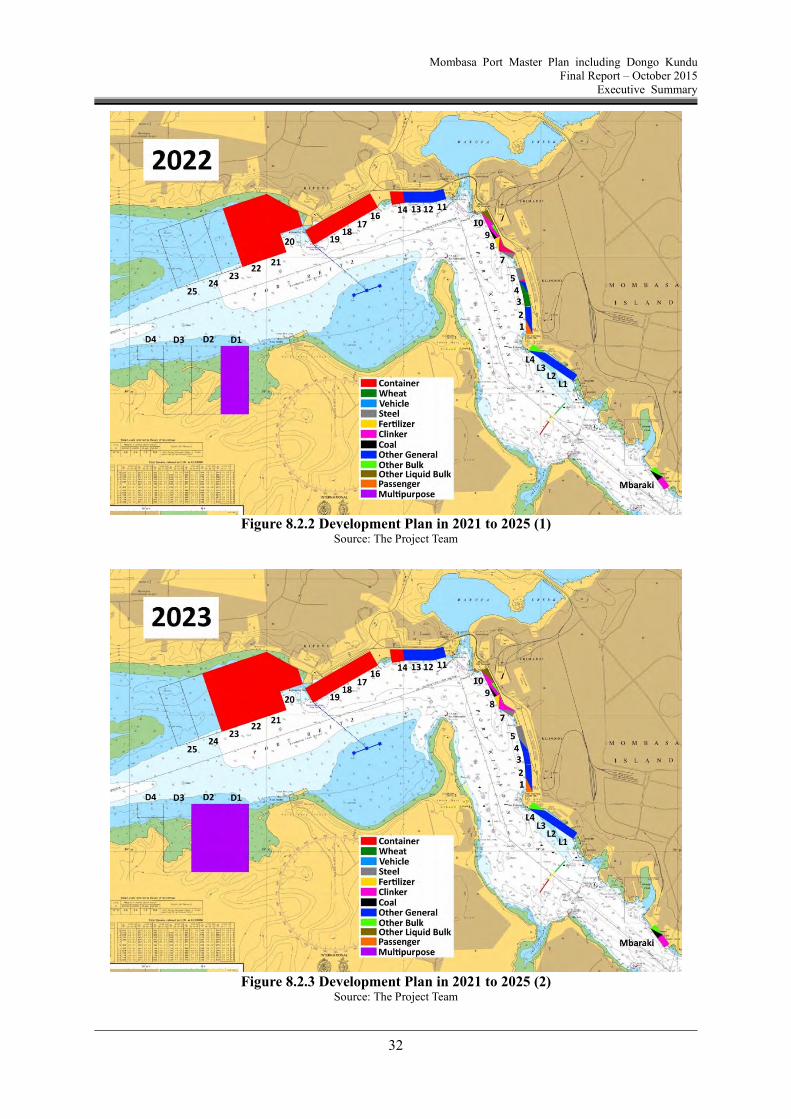
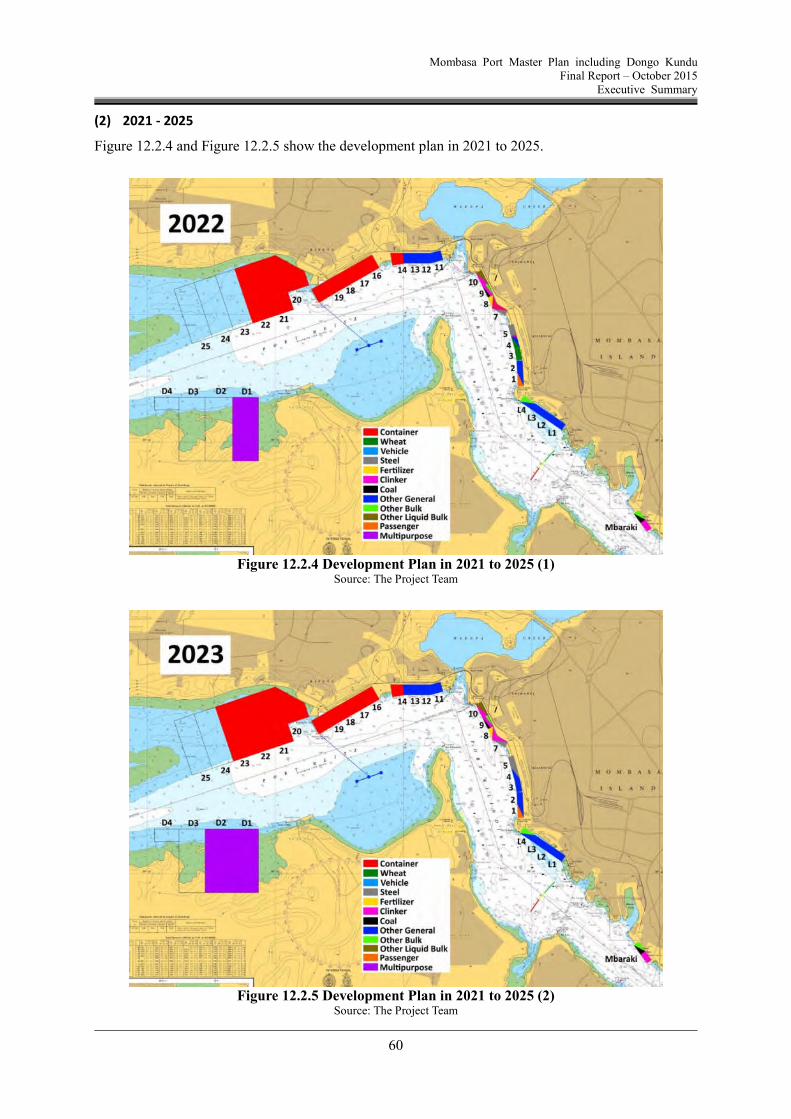
8.2.2 2021-2025
Figure 8.2.2 and Figure 8.2.3 show the development plan in 2021 to 2025.
Mombasa Port Master Plan including Dongo Kundu Final Report – October 2015
Executive Summary
32
Figure 8.2.2 Development Plan in 2021 to 2025 (1)
Source: The Project Team
Figure 8.2.3 Development Plan in 2021 to 2025 (2)
Source: The Project Team
Mombasa Port Master Plan including Dongo Kundu Final Report – October 2015
Executive Summary
33
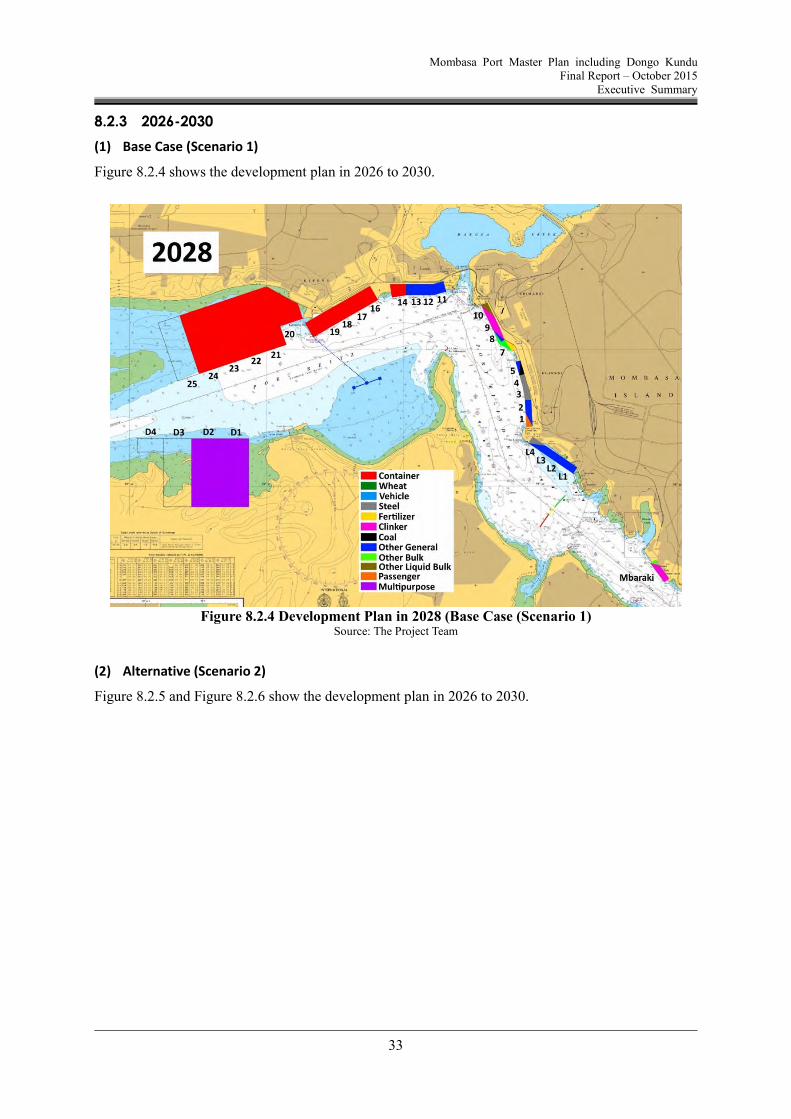
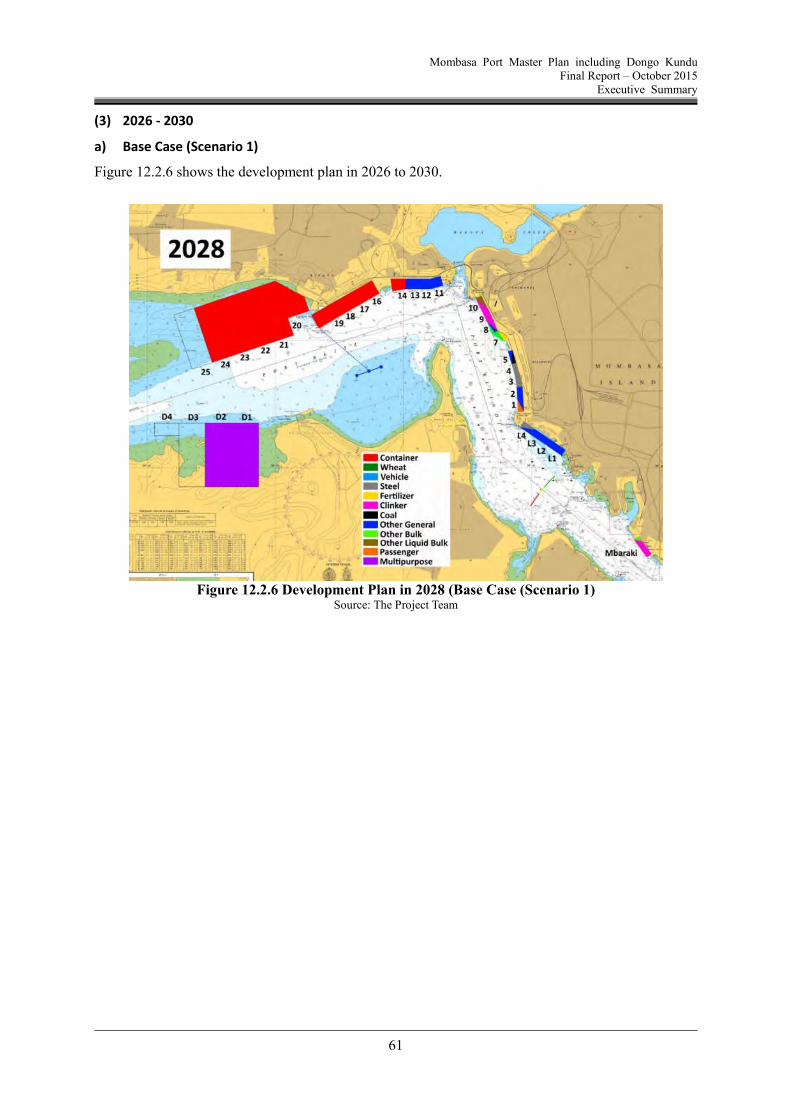
8.2.3 2026-2030
(1) Base Case (Scenario 1)
Figure 8.2.4 shows the development plan in 2026 to 2030.
Figure 8.2.4 Development Plan in 2028 (Base Case (Scenario 1)
Source: The Project Team
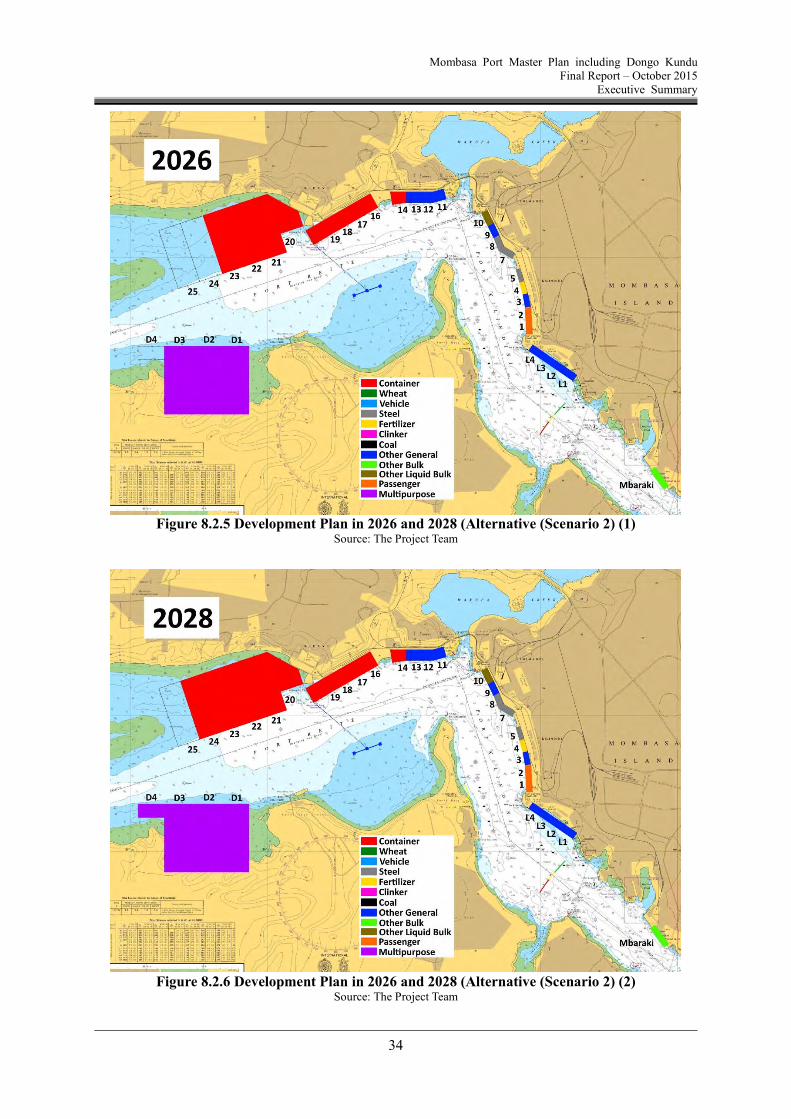
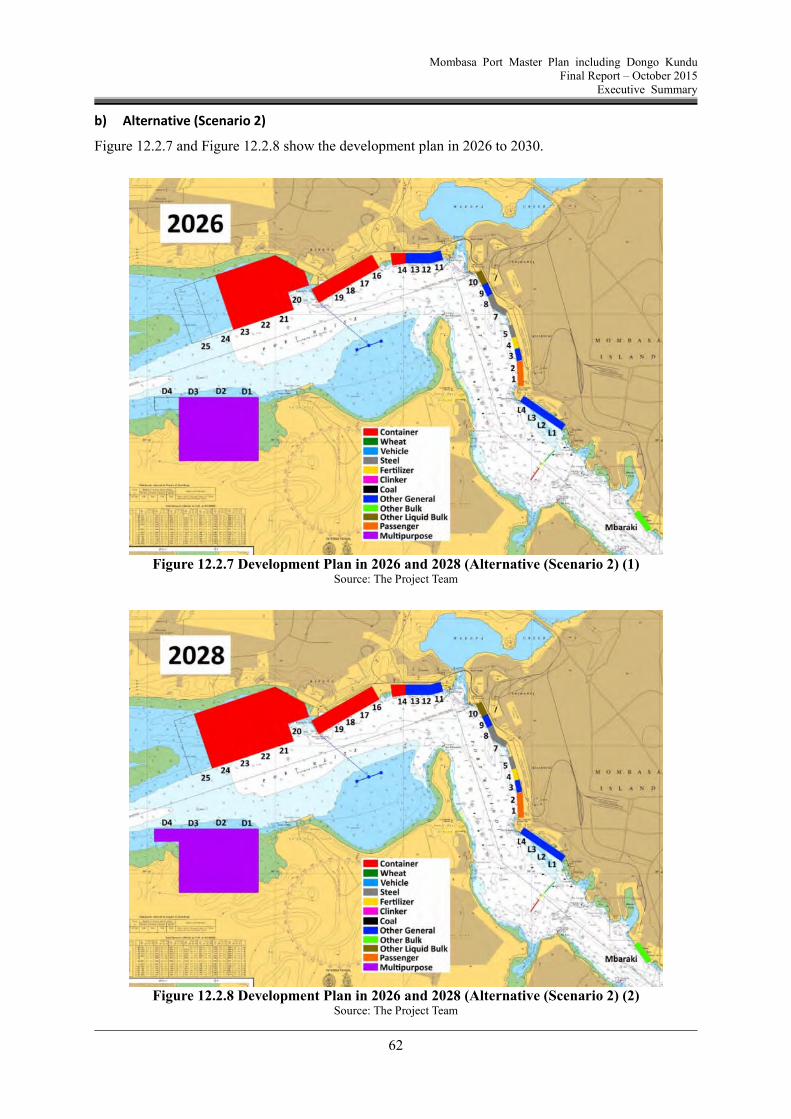
(2) Alternative (Scenario 2)
Figure 8.2.5 and Figure 8.2.6 show the development plan in 2026 to 2030.
Mombasa Port Master Plan including Dongo Kundu Final Report – October 2015
Executive Summary
34
Figure 8.2.5 Development Plan in 2026 and 2028 (Alternative (Scenario 2) (1)
Source: The Project Team
Figure 8.2.6 Development Plan in 2026 and 2028 (Alternative (Scenario 2) (2)
Source: The Project Team
Mombasa Port Master Plan including Dongo Kundu Final Report – October 2015
Executive Summary
35
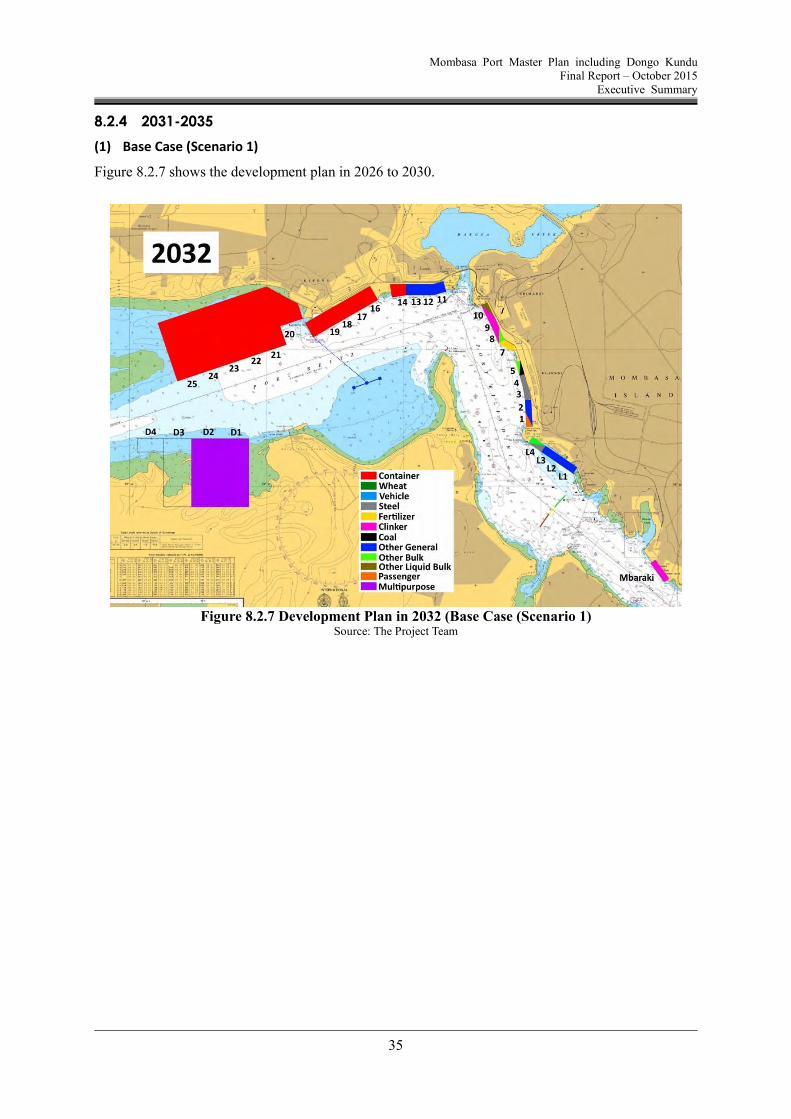
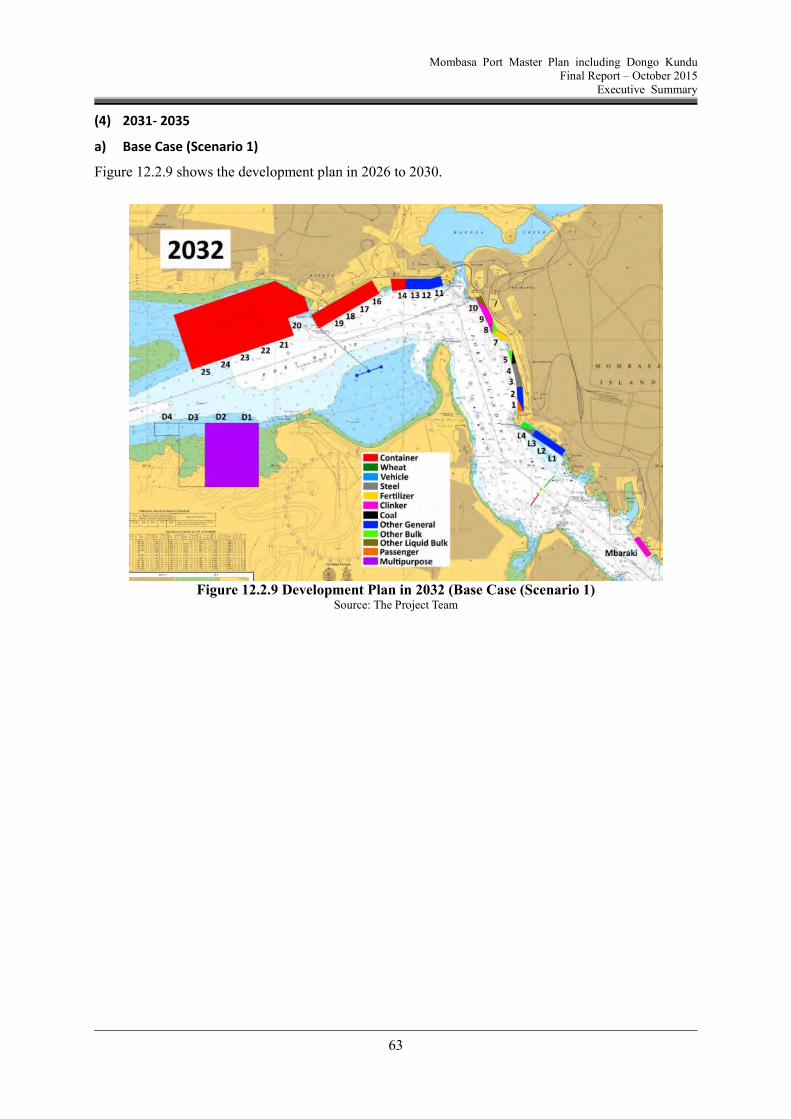
8.2.4 2031-2035
(1) Base Case (Scenario 1)
Figure 8.2.7 shows the development plan in 2026 to 2030.
Figure 8.2.7 Development Plan in 2032 (Base Case (Scenario 1)
Source: The Project Team
Mombasa Port Master Plan including Dongo Kundu Final Report – October 2015
Executive Summary
36
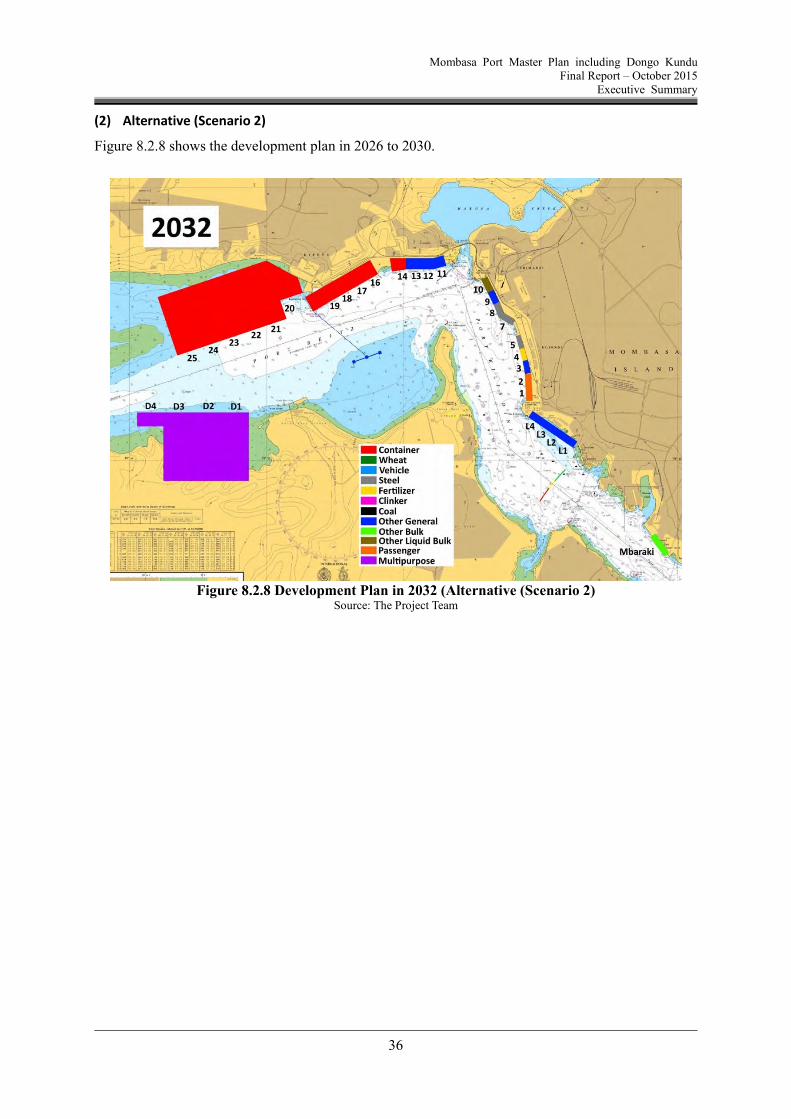
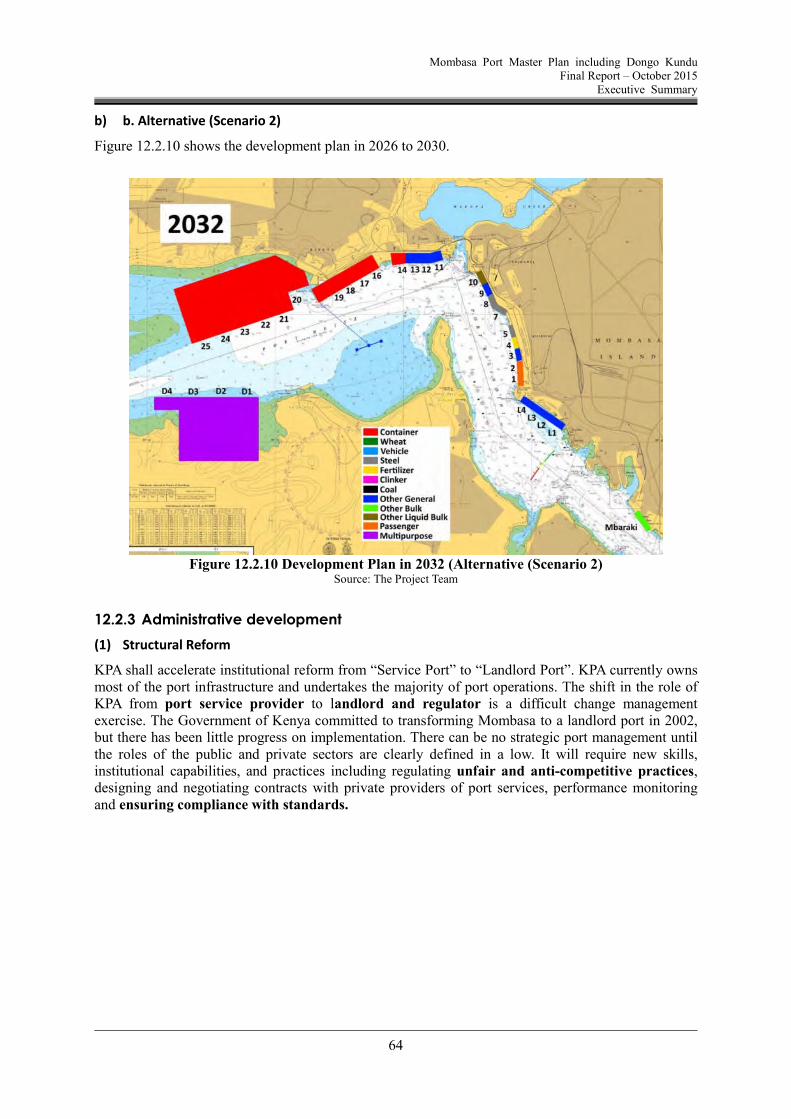
(2) Alternative (Scenario 2)
Figure 8.2.8 shows the development plan in 2026 to 2030.
Figure 8.2.8 Development Plan in 2032 (Alternative (Scenario 2)
Source: The Project Team
Mombasa Port Master Plan including Dongo Kundu Final Report – October 2015
Executive Summary
37
9. Implementation of Port Development
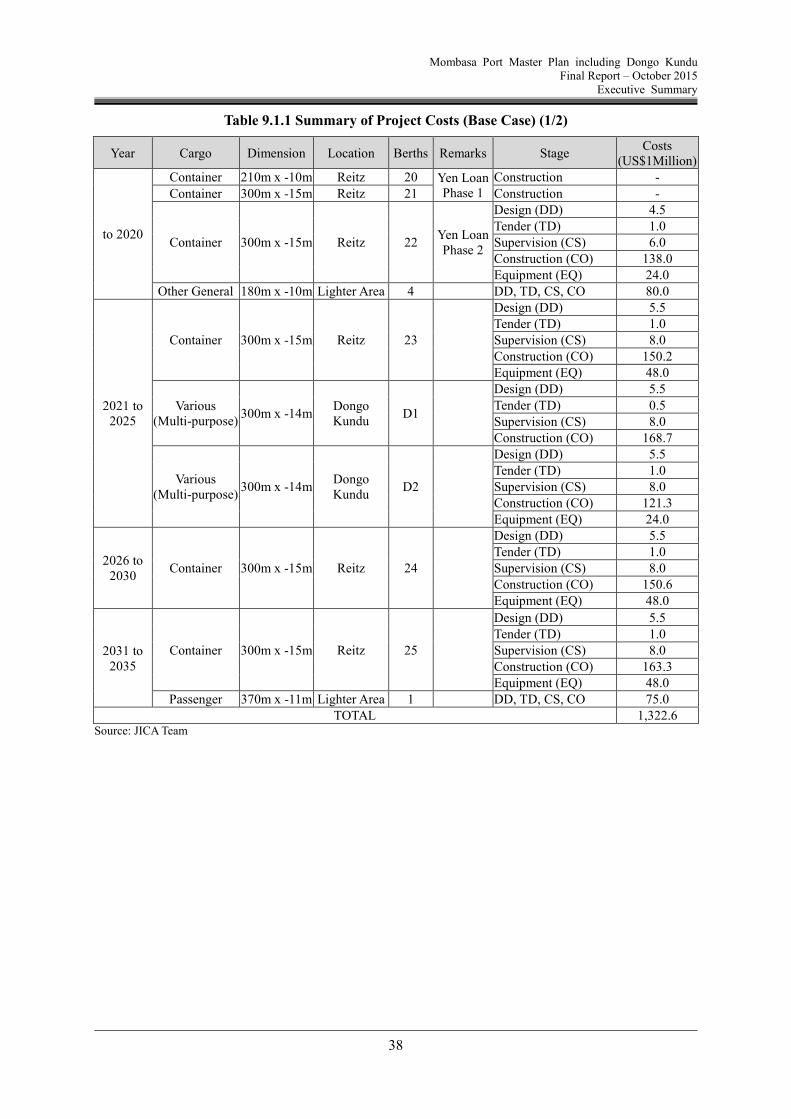
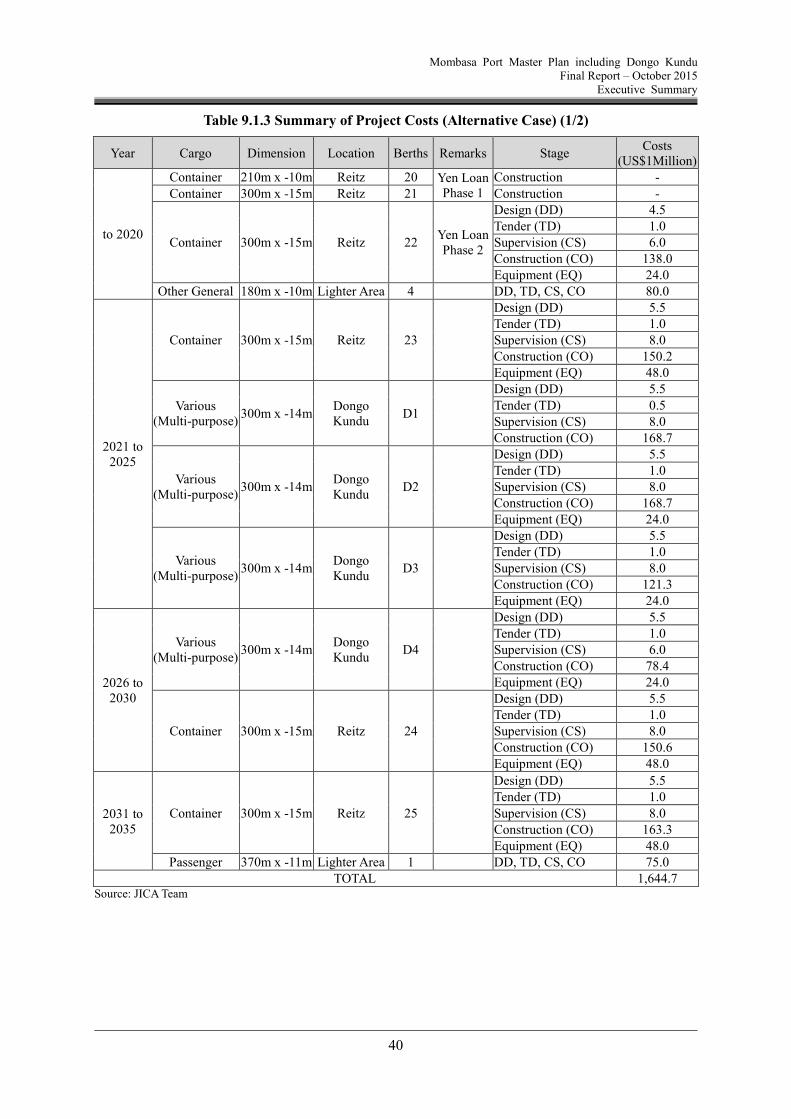
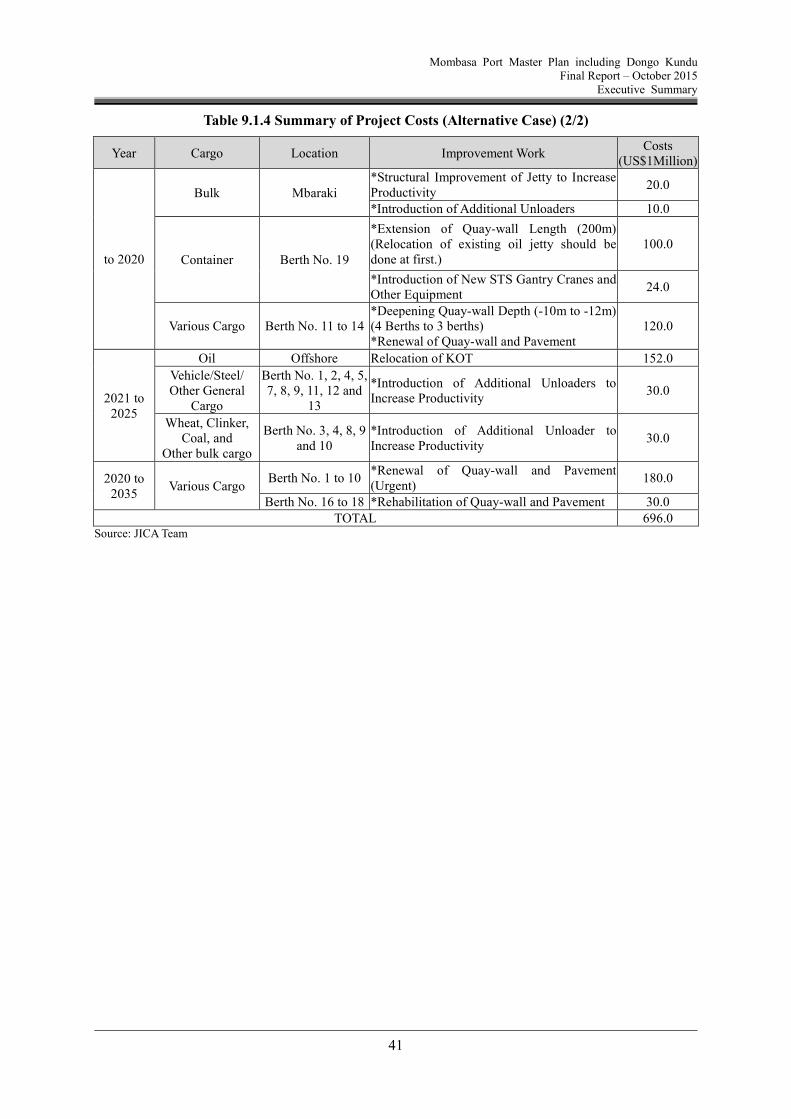
9.1 Cost
The construction of civil and building works and procurement of equipment for the Mombasa Port development including the Dongo Kundu area have been estimated as below.
General Requirement (Mobilization/Demobilization, Preparation) Dredging Reclamation Revetments Berths (Container, General Cargo, Bulk) Soil Improvement Pavement Utility Works Building Works Cargo Handling Equipment
Cost estimates for 2 cases namely, Base case and Alternative case, has been established a shown below. However, the costs for construction and equipment procurement are in a preliminary stage and more detailed cost estimation should be conducted in the succeeding feasibility study stage.
Mombasa Port Master Plan including Dongo Kundu Final Report – October 2015
Executive Summary
38
Table 9.1.1 Summary of Project Costs (Base Case) (1/2)
Year Cargo Dimension Location Berths Remarks Stage Costs
(US$1Million)
to 2020
Container 210m x -10m Reitz 20 Yen Loan Phase 1
Construction - Container 300m x -15m Reitz 21 Construction -
Berth No. 1 to 10*Renewal of Quay-wall and Pavement
(Urgent)
Berth No. 16 to 18*Rehabilitation of Quay-wall and
Pavement
2020 to
2035Various Cargo
to 2020
Bulk Mbaraki
Container Berth No. 19
2021 to
2025
Mombasa Port Master Plan including Dongo Kundu Final Report – October 2015
Executive Summary
46
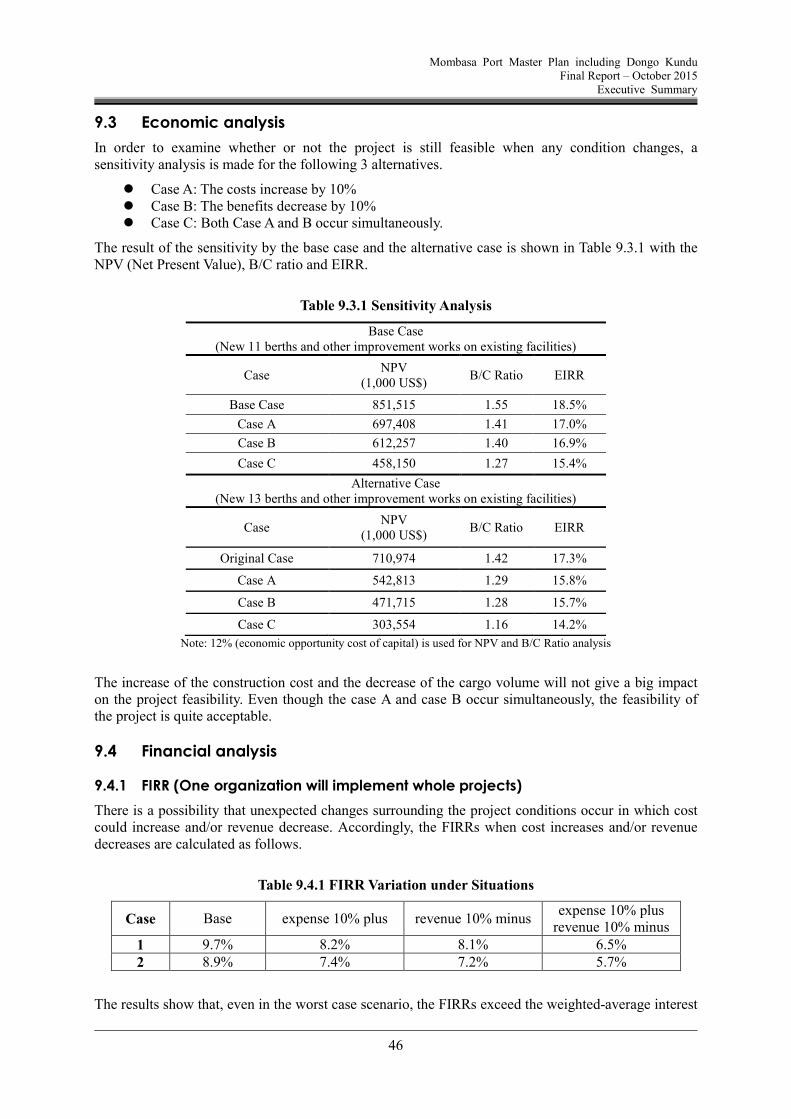
9.3 Economic analysis
In order to examine whether or not the project is still feasible when any condition changes, a sensitivity analysis is made for the following 3 alternatives.
Case A: The costs increase by 10% Case B: The benefits decrease by 10% Case C: Both Case A and B occur simultaneously.
The result of the sensitivity by the base case and the alternative case is shown in Table 9.3.1 with the NPV (Net Present Value), B/C ratio and EIRR.
Table 9.3.1 Sensitivity Analysis
Base Case (New 11 berths and other improvement works on existing facilities)
Case NPV
(1,000 US$) B/C Ratio EIRR
Base Case 851,515 1.55 18.5%
Case A 697,408 1.41 17.0%
Case B 612,257 1.40 16.9%
Case C 458,150 1.27 15.4%
Alternative Case (New 13 berths and other improvement works on existing facilities)
Case NPV
(1,000 US$) B/C Ratio EIRR
Original Case 710,974 1.42 17.3%
Case A 542,813 1.29 15.8%
Case B 471,715 1.28 15.7%
Case C 303,554 1.16 14.2%
Note: 12% (economic opportunity cost of capital) is used for NPV and B/C Ratio analysis
The increase of the construction cost and the decrease of the cargo volume will not give a big impact on the project feasibility. Even though the case A and case B occur simultaneously, the feasibility of the project is quite acceptable.
9.4 Financial analysis
9.4.1 FIRR (One organization will implement whole projects)
There is a possibility that unexpected changes surrounding the project conditions occur in which cost could increase and/or revenue decrease. Accordingly, the FIRRs when cost increases and/or revenue decreases are calculated as follows.
Table 9.4.1 FIRR Variation under Situations
Case Base expense 10% plus revenue 10% minus expense 10% plus
The results show that, even in the worst case scenario, the FIRRs exceed the weighted-average interest
Mombasa Port Master Plan including Dongo Kundu Final Report – October 2015
Executive Summary
47
rate of assumed loans: 5.1%, and that the both development alternatives are deemed to be financially feasible.
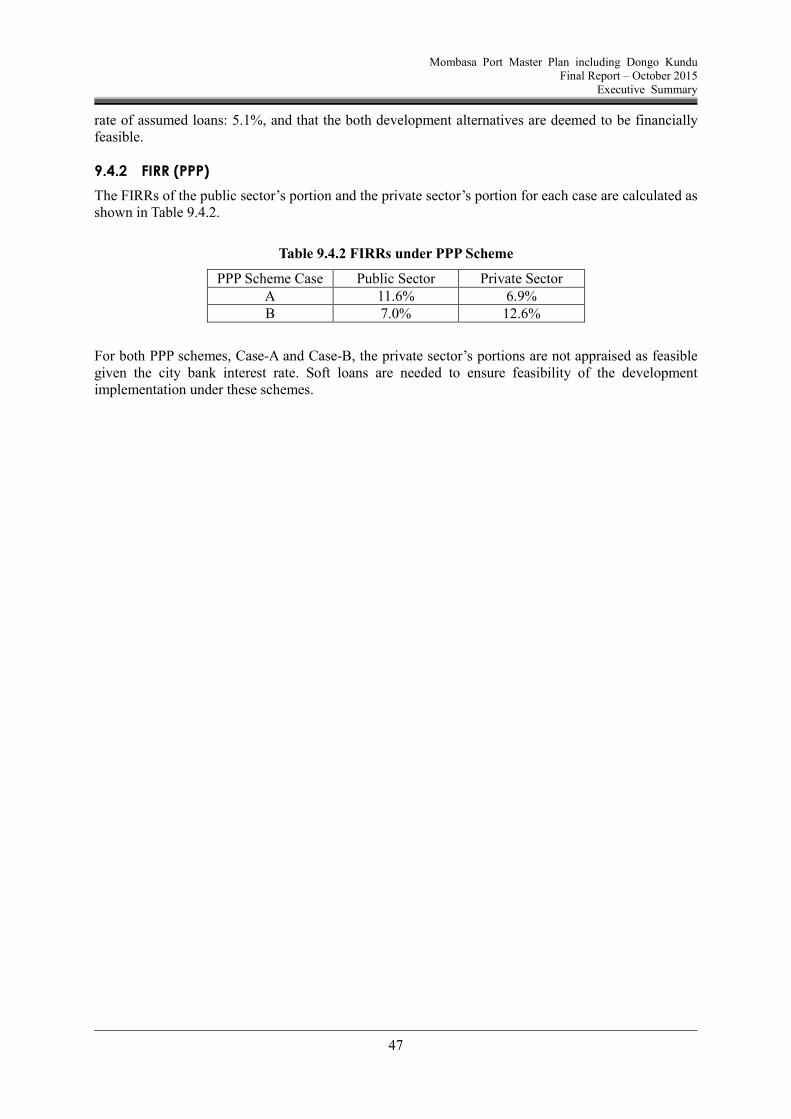
9.4.2 FIRR (PPP)
The FIRRs of the public sector’s portion and the private sector’s portion for each case are calculated as shown in Table 9.4.2.
Table 9.4.2 FIRRs under PPP Scheme
PPP Scheme Case Public Sector Private Sector A 11.6% 6.9% B 7.0% 12.6%
For both PPP schemes, Case-A and Case-B, the private sector’s portions are not appraised as feasible given the city bank interest rate. Soft loans are needed to ensure feasibility of the development implementation under these schemes.
Mombasa Port Master Plan including Dongo Kundu Final Report – October 2015
Executive Summary
48
10. Environmental and Social Considerations
The preliminary scoping study for Environmental and Social Considerations identified the following concerns and challenges for the proposed development plan of expanded port in Port Reitz and Dongo Kundu.
10.1 Necessity of Mangrove reforestation
The coastal line of Dongo Kundu area is almost all covered by the Mangrove forest that serves as a breeding ground preserving the enriched tidal and marine biodiversity and providing a fishing place where the local people earn their livelihood. The proposed plan will directly clear 36 ha of Mangrove at maximum. It will consequently lead to a significant loss of biodiversity and associated ecological services that include the provision of the products for local communities such as fuel wood and construction materials, fishing ground and breeding ground for offshore organisms, as well as acting as a natural barrier/buffer from disaster, tidal waves and providing carbon storage. The subsequent study needs to suggest a sound mitigation program including the Mangrove reforestation plan. In order to compensate for potential loss, the site for Mangrove restoration needs to be selected according to the results of impact assessment to restore the original functions.
10.2 Consideration of cumulative impacts on ecosystems
Port development will involve large scale reclamation, bank protection and dredging works and result in a wide-range of both direct and indirect impacts. The direct impacts include the physical removal and disturbance of aquatic and tidal flora and fauna, while the indirect impacts may result from changes in water quality and flow, sedimentation pattern and discharges of storm water and wastewater. Deterioration of ecology results in loss or secondary damage to fisheries and fragile coastal habitats. In addition, the Dongo Kundu and Port Reitz area will undergo increased development activities from other development of infrastructure services represented by Mombasa Bypass Road and SGR as well as Mombasa SEZ in the near future. It will significantly change the land use of Port Reitz’s creek and waterfront area. It is necessary for the subsequent ESIA to consider those induced and cumulative impacts. Furthermore, the mitigation measures and environmental management plan to be derived from ESIA need to suggest a suitable management system that conserves the shoreline ecosystem in the whole creek area. It probably should include habitat evaluation, zoning approach and Mangrove management plan with community involvement.
10.3 Measures for increase in pollution load
The reclamation, dredging and other construction work will also involve the short-term deterioration of water quality in terms of turbidity and transparency as well as deterioration of air quality and noise and vibration. In the long term, the operation of expanded port facilities will increase the burden of pollution and other risks such as an oil spill, air emissions from a ship and port operation, environmental accident, generation of wastes, effluent from water front activities, and so on. While the pollution burden will be dramatically increased in the area surrounding Port Reitz, the self-purification capacity of water and intertidal environment will be deteriorated and it will accelerate the accumulated adverse impact represented by the eutrophication in the creek. Among some impact items, it is suggested that the impact on level of pollution, turbid water and eutrophication be predicted quantitatively as much as possible in the course of ESIA. In addition, KPA, as an environmental leader for the entire area of Mombasa port will need to enhance the monitoring and management system of offshore and onshore environment. Careful attention should also be paid to occupational health and safety especially for port workers. KPA has responsibility to implement proactive measures against potential concerns of pollution control, waste management, global warming prevention, and occupational health and safety coordinating with the relevant authorities. The design of installed facilities and operation of new berths also can be harmonized with the implementation of Green Port Policy that will provide a variety of programs for such mitigation measures.
Mombasa Port Master Plan including Dongo Kundu Final Report – October 2015
Executive Summary
49
10.4 Involuntary resettlement
This study confirmed the 19 households of informal settlers locating in the Study Area of Dongo Kundu based on the demographic survey result in 2014 (MOIED, SEA for Master Plan for the development of Mombasa SEZ). As of August 2015, KPA is engaging the consulting team to develop the comprehensive RAP (Resettlement Action Plan) for the entire area of Dongo Kundu whose target includes the affected people in the port development area. In that sense, the subsequent study will monitor the progress, review the output and implement the supplementary study if needed, in order to ensure that the RAP will undertake sufficient compensation and assistance for PAPs (Project Affected Peoples). The RAP should also take into account a livelihood restoration program for the PAPs given their high vulnerability and poverty. Since the progress of resettlement is a critical factor for the implementation of the port development project, KPA, the land owner of Dongo Kundu, needs to ensure that the resettlement as well as the compensation and assistance to be agreed in RAP should be implemented in a timely and appropriate manner.
10.5 Potential damage to fisheries
Considering the abundant fishery resources and existing artisanal fishing activities in the Port Reitz creek area, the development of Port Reitz creek will affect on the livelihood of fisheries and fish traders for long periods. The construction work will keep the fisheries out of the area. The expansion of reclamation and ship navigation route will deprive the fisheries of their fishing grounds including the landing site. The change in hydrological and geological characteristics of area and deterioration of natural resources will result in decrease in fish catch and income. The necessary mitigation measures may include: procurement of equipment such as a vessel and gear, development of a new landing site, technical training and other assistance for their transformation to deep fishing as well as to the aquaculture industry, eco-tourism and any other alternative livelihoods. Those considerations are included in the on-going RAP study for Dongo Kundu and shall be reviewed in the course of ESIA.
10.6 Sacred place with social and cultural values
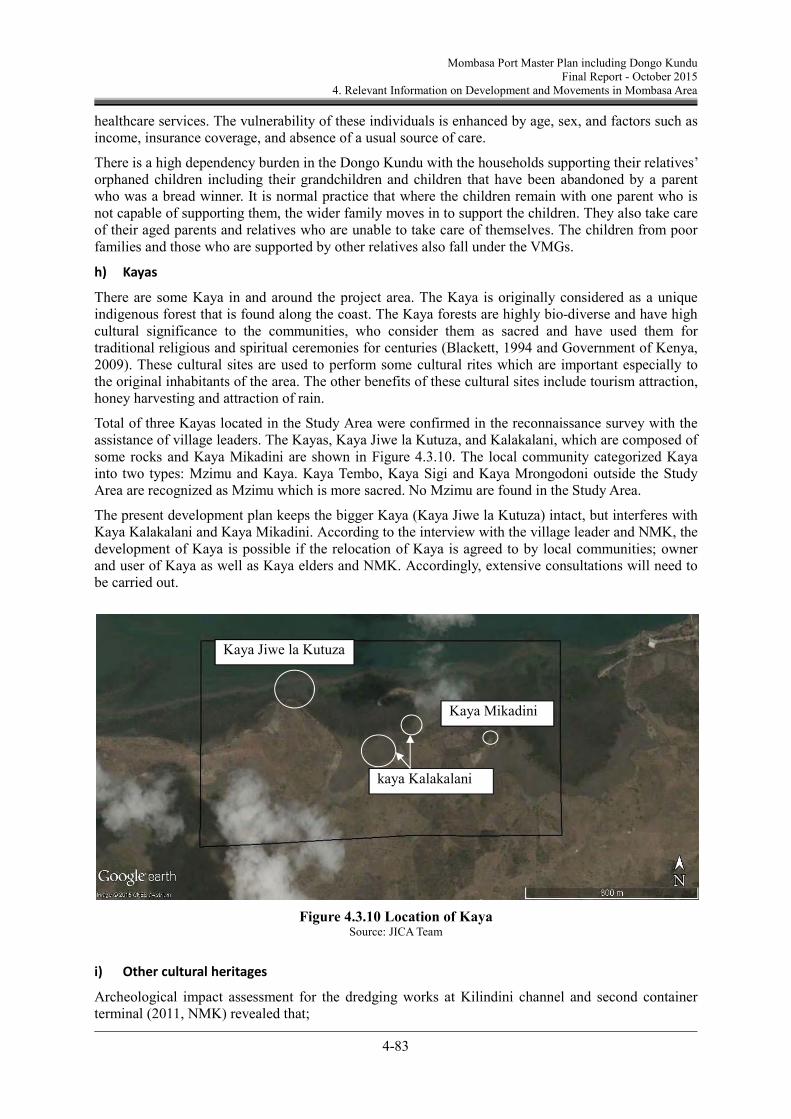
The sacred forests, Kaya, have biological diversity and the cultural significance to the local communities in coastal Kenya who use it as for traditional religious and spiritual ceremonies. This study found that two Kayas covered by the construction area in Dongo Kundu need to be relocated at least and the access to another Kaya which is close to the planned berths would be interfered with. Consultation with Kaya elders as well as local community and NMK (National Museum of Kenya) need to be made in order to conserve or relocate those Kayas in the ESIA Archeological Impact Assessment that is proposed as one of outputs in ESIA as well as the on-going RAP study for Dongo Kundu.
Mombasa Port Master Plan including Dongo Kundu Final Report – October 2015
Executive Summary
50
11. Administrative and Management Issue
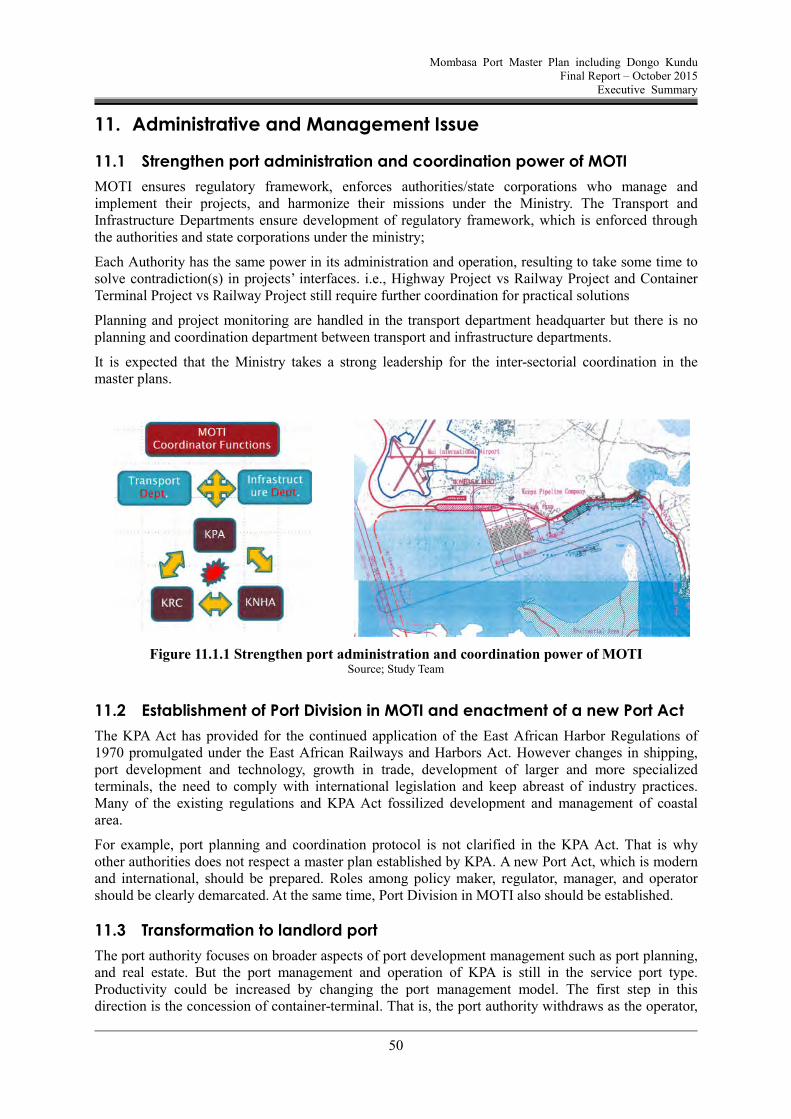
11.1 Strengthen port administration and coordination power of MOTI
MOTI ensures regulatory framework, enforces authorities/state corporations who manage and implement their projects, and harmonize their missions under the Ministry. The Transport and Infrastructure Departments ensure development of regulatory framework, which is enforced through the authorities and state corporations under the ministry;
Each Authority has the same power in its administration and operation, resulting to take some time to solve contradiction(s) in projects’ interfaces. i.e., Highway Project vs Railway Project and Container Terminal Project vs Railway Project still require further coordination for practical solutions
Planning and project monitoring are handled in the transport department headquarter but there is no planning and coordination department between transport and infrastructure departments.
It is expected that the Ministry takes a strong leadership for the inter-sectorial coordination in the master plans.
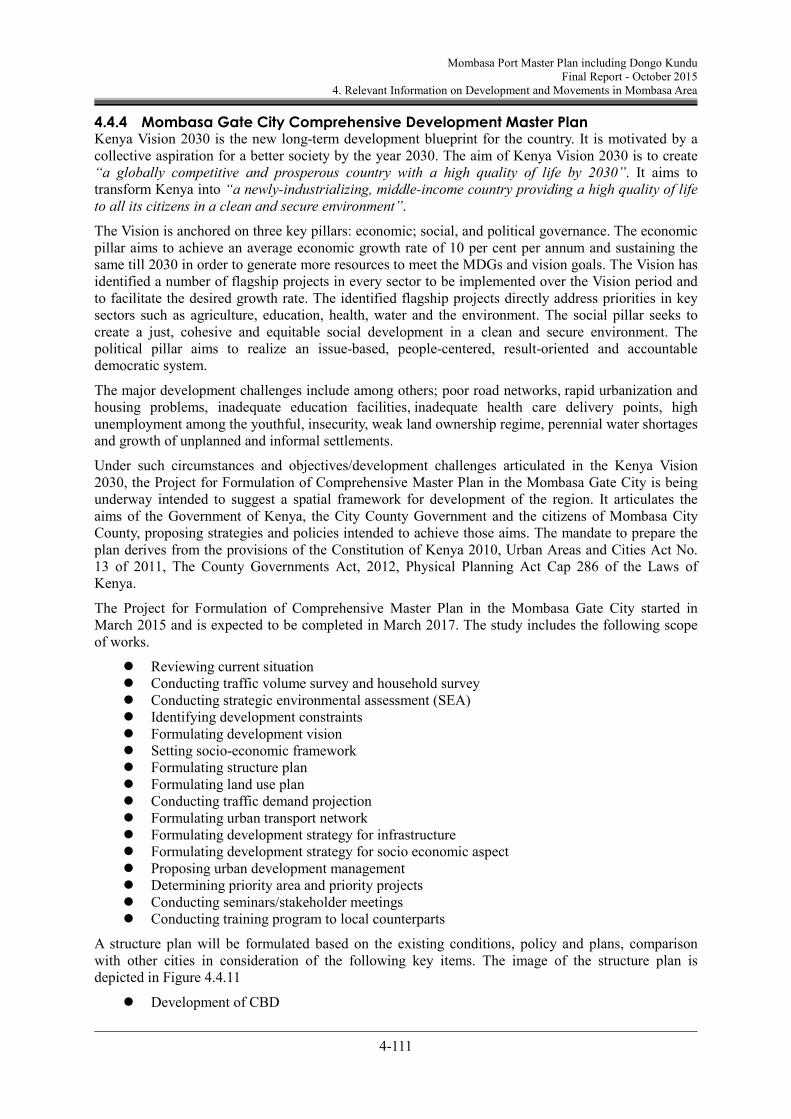
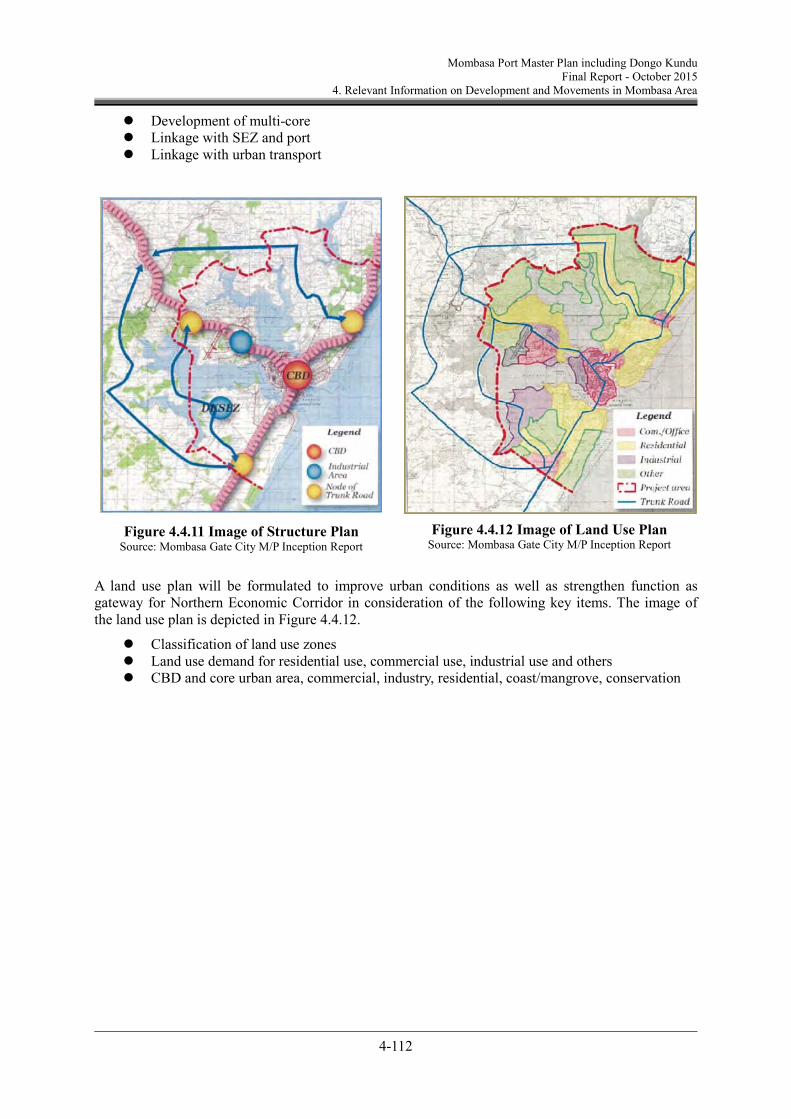
Figure 11.1.1 Strengthen port administration and coordination power of MOTI Source; Study Team
11.2 Establishment of Port Division in MOTI and enactment of a new Port Act
The KPA Act has provided for the continued application of the East African Harbor Regulations of 1970 promulgated under the East African Railways and Harbors Act. However changes in shipping, port development and technology, growth in trade, development of larger and more specialized terminals, the need to comply with international legislation and keep abreast of industry practices. Many of the existing regulations and KPA Act fossilized development and management of coastal area.
For example, port planning and coordination protocol is not clarified in the KPA Act. That is why other authorities does not respect a master plan established by KPA. A new Port Act, which is modern and international, should be prepared. Roles among policy maker, regulator, manager, and operator should be clearly demarcated. At the same time, Port Division in MOTI also should be established.
11.3 Transformation to landlord port
The port authority focuses on broader aspects of port development management such as port planning, and real estate. But the port management and operation of KPA is still in the service port type. Productivity could be increased by changing the port management model. The first step in this direction is the concession of container-terminal. That is, the port authority withdraws as the operator,
Mombasa Port Master Plan including Dongo Kundu Final Report – October 2015
Executive Summary
51
allowing a private sector company to take over as the terminal operator and manager. KPA is on the way of selection of concessionaire for a new container terminal.
Changes to the existing roles of some government agencies would likely require changes in the relevant laws which created them. In particular, a new port act that defines the roles of public and private sectors, or roles of regulator, manager and operator of port, is required.
11.4 Realistic PPP model in Mombasa Port
For the development of the new container terminals, PPP initiative will be introduced. If private companies are not interested in investing in infrastructure development due to the huge costs involved, a PPP initiative in which the public sector bears the cost of infrastructure while the private sector covers superstructure will be examined.
11.5 Single window and new gate system
The objective of the Single Window system can be achieved by eliminating existing inefficiencies, for instance the inefficient space utilization at ports, where waiting times lead to congestion. Furthermore there are inefficiencies in the cargo clearance process which involves manually handling paper documents between many stakeholders. These inefficiencies lead to delays in cargo clearance, high trade transaction costs and corruption which together reduce Kenya’s competitiveness.
On the other hand, the Simba System needs to be improved to prevent program downtime which suspends the port operation.
The most serious issue is to improve the gate system of KPA. When a container arrives at the KPA gate, a staff inputs container number to the system, and then a slip which shows where a container should be brought to, comes out. Even now, the gate is congested by trailers. The gate system should be updated and upgraded as container cargoes in Mombasa port are rapidly increasing. A container booking system should be introduced as soon as possible. RFID tag for container and GPS yard system for container should also be introduced.
Mombasa Port Master Plan including Dongo Kundu Final Report – October 2015
Executive Summary
52
12. Conclusion and Recommendations
12.1 Current Situation and Issues of Mombasa Port
Cargo traffic is dominated by imports which account for 90% of total cargoes handled at Mombasa Port in 2014. This trend has remained steady in the past decade. Out of total import cargoes, about 30% is transit cargoes destined to hinterland countries and shows a gradual steady increase over the past decade. It is noted that overall cargo traffic at Mombasa Port has been increasing due to growth of the Kenyan economy and landlocked countries as well. In particular, the container traffic at Mombasa Port has also increased since 2005 reaching 1,012,002 TEUs in 2014. Annual growth of container traffic in the last 9 years shows a remarkable rate of nearly 10%.
Although the total volume of cargo handled at the port has doubled over the past decade, various issues regarding cargo operation remain as follows;
12.1.1 Excessively high berth occupancy ratio (B.O.R) followed by long waiting time for berthing
Table 12.1.1 shows B.O.R, possibility of waiting by berth occupied (B/O), waiting time and average waiting time of each mooring facility in 2013. As mentioned in Chapter 5.3.1, UNCTAD recommends preferable B.O.R for various occasions. In cases where there are 6-10 berths, preferable B.O.R. is 70 %. Since Mombasa Port has more than 10 berths, the preferable B.O.R could be assumed to be approximately 70-75 % at most. Mooring facilities including Berth No. 4, 5,7,11, 12, 16, 17 and 18 exceed the recommended B.O.R. by UNCTAD. Moreover, B.O.R of Berth No.10 and 13 is close to 75 %. Extremely high B.O.R. means that Mombasa Port is critically deficient in mooring facilities including berths and wharf. Accordingly, long waiting time for berthing caused by berth occupied (B/O) takes place.
Table 12.1.1 B.O.R of Berths and Other Indicator in 2013
Berth/ Wharf
B.O.R. Waiting Possibility by
B/O* Waiting Time Av. Waiting Time
(%) (%) (hour) (hour/ Vessel)
Mbaraki 13.8 0 0 0
No.1 58.7 16 636 25
No.2 1.1 33 61 61
No.3 67.0 35 1,839 77
No.4 77.2 22 1,198 63
No.5 75.7 18 467 29
No.7 80.9 18 582 53
No.8 52.4 15 244 31
No.9 65.6 29 749 47
No.10 74.7 29 1,160 61
No.11 75.5 19 772 39
No.12 76.9 3 462 154
No.13 74.2 9 278 31
No.14 55.4 4 50 17
No.16 79.5 47 2,003 48
No.17 88.9 34 1,778 47
No.18 91.9 35 1,742 40
Total 14,021 Note*: Percentage of vessels waiting for berthing due to the berth occupied by another ship Source: KPA and The Project Team
Mombasa Port Master Plan including Dongo Kundu Final Report – October 2015
Executive Summary
53
12.1.2 Excessive mixture of various commodities followed by low cargo handling productivity
Table 12.1.2 shows the allocation of major cargo to berths/wharf in 2013. Motorcars were handled at 11berths, steel at 9 berths, containers at 15 berth and etc. Only the bulk wheat was handled in a concentrated manner, because efficient wheat unloaders have been installed at berth No.3.
If a designated berth for a commodity is changed on a case-by-case basis, mobilization of stevedoring laborers and preparation of required cargo handling equipment will take longer than in the case of a fixed berth system for a commodity. Extraordinary mixture of various commodities leads to lower productivity in cargo handling.
Table 12.1.2 Allocation of Major Cargo to Berth/Wharf in 2013
Bulk Wheat No.3 1 Berth Bulk Clinker Mbaraki, No.7, No.9, No.10 4 Berths Bulk Fertilizer No.1, No.5, No.7, No.9, No.10, No.11 6 Berths Bulk Coal Mbaraki, No.5, No.9, No.11 4 Berths Other Liquid Bulk Mbaraki, No.8, No.9, No.10 4 Berths Note: Bold character means main berths for major commodities. Note 2: Data on other liquid bulk is in 2014. Source: KPA and the Project Team
12.1.3 Inadequate berth length for calling vessels
Table 12.1.3 shows the number of vessels of which LOA exceed originally designed LOA of a berth in 2013. At Berth No.1, almost all vessels have longer than designed LOA. Accordingly, Berth No.2 is also used to accommodate the ships. As a result, the number of calling ships is very limited at Berth No.2. Capacity of Berth No. 2 is not fully utilized. The same phenomenon is also observed at Berth No.16 and 17.
There are officially 18 berths/wharfs in Mombasa Port but that number is misleading as the berths cannot be used effectively due to their inadequate length.
Table 12.1.3 Number of Vessels of which LOA Exceed Originally Designed LOA in 2013
Berth/ Wharf Allowable
LOA. Number of Calling Ships
Ships with Longer LOA than Designed LOA
Ratio
Mbaraki 276 m 9 0 0 %
No.1 156 m 160 138 86 %
No.2 150 m 3 0 0 %
No.3 150 m 69 63 91 %
No.4 171 m 88 33 38 %
No.5 161 m 89 74 83 %
No.7 187 m 61 18 30 %
No.8 154 m 54 4 7 %
No.9 162 m 56 45 80 %
No.10 184 m 65 49 75 %
No.11 166 m 107 53 50 %
No.12 165 m 99 0 0 %
No.13 157 m 97 78 80 %
No.14 163 m 78 70 90 %
Mombasa Port Master Plan including Dongo Kundu Final Report – October 2015
Executive Summary
54
Berth/ Wharf Allowable
LOA. Number of Calling Ships
Ships with Longer LOA than Designed LOA
Ratio
No.16 160 m 90 89 99 %
No.17 165 m 111 105 95 %
No.18 215 m 126 9 7 %
Total 1,364 828 61 % Source: KPA and The Project Team
12.1.4 Low productivity
Productivities of major cargo in 2013 are summarized in Table 12.1.4. Motorcars are unloaded mainly at Berth No.1. There is no designated large parking area in Mombasa Port; unloaded vehicles park temporarily at various and scattered places in the port. If a large parking area were established for motorcars, productivity would become twice or three times the current level. Steel is handled by ship gear cranes and trucks in a narrow space because vacant transit sheds are located close to the quay-wall. If a wider space were provided for steel handling, productivity could be dramatically improved.
Bulk wheat is unloaded at Berth No.3 where GBHL’s unloaders are located in. Long waiting time for berthing takes place at Berth No.3 due to the low capacity of existing equipment.Bulk clinker is unloaded mainly at Berth No.10. Productivity at Mbaraki Wharf is low due to the decrepit structure of the jetty and old cargo handling equipment. Bulk fertilizer is unloaded at Berth No.7 and 9. Additional processing of fertilizer, namely packing, is conducted on the apron. Apron is not a space for processing. If another place for storing and processing were to be acquired, productivity at quay-side could be dramatically improved.
Table 12.1.4 Productivity of Major cargo in 2013
Commodity Range of Productivity at Each Berth (ton/day) Average Productivity
Source: SAPROF Review Report, KPA and the Project Team
12.1.5 Capacity saturation with cargo demand
Table 12.1.5 shows the number of required berths in 2013, namely 17 berths. There are officially 18 berths/wharfs in Mombasa Port but that number is misleading as the berths cannot be used effectively due to their inadequate length. Cargo volume has been reaching the port capacity.
Mombasa Port Master Plan including Dongo Kundu Final Report – October 2015
Executive Summary
55
Table 12.1.5 Number of Mooring Facilities Required in 2013
Productivity 2013
(1,000 ton/berth/year) Volume (1,000 ton) Required Berths Motor Vehicle 740 366 0.49 Steel 1,100 1,192 1.08 Other General Cargo 210 1,379 6.57 Container 1,390 7,777 5.59 Total (General)
Other Liquid Bulk 900 906 995 1,324 1,688 2,065 2,403
Total Liquid Bulk 6,537 7,192 7,752 9,978 12,443 14,998 17,285
Grand Total (Import) 20,096 21,536 24,266 34,055 45,007 56,817 67,577
(x 1,000 tons)
Mombasa Port Master Plan including Dongo Kundu Final Report – October 2015
Executive Summary
56
12.2 Mombasa Port Master Plan
12.2.1 Basic policies and strategies of port development and management
(1) Direction of Kenyan Economic Development
“Kenya Vision 2030” is the country’s new development blueprint covering the period 2008 t0 2030. The Vision is based on three “pillars”, namely the economic, the social and the political pillars. The economic pillar describes the economic vision and strategy. This economic vision and strategy shows six key sectors for sustainable economic development of Kenya; tourism, agriculture, wholesale and retail trade, manufacturing, business process offshoring (BPO) and financial service.
(2) Roles and Functions of Mombasa Port for accomplishment of the Vision 2030
Since Mombasa Port has been sole international gateway for not only Kenya but also landlocked neighboring countries including Ethiopia, South Sudan, Uganda, Burundi, Rwanda and D.R. Congo, Mombasa port should contribute toward the accomplishment of the Vision. Mombasa Port could support tourism sector by means of providing a safe and comfortable international passenger terminal. Mombasa Port also could support the agriculture sector and the wholesale and retail sector as well as the manufacturing sector. Should more efficient and effective cargo (fertilizer and other commodities) handling be achieved in the port, transport cost of commodity would decrease accordingly.
Mombasa port shall play absolutely necessary roles to sustain people’s daily life and economic development of Kenya by means of providing all customers with rational and efficient maritime transport services.
(3) Basic Policies for Port Development
Cargo handling capacity of the port has been saturated with the cargo demand already. Consequently, long waiting time for berthing due to berth occupied by another ship and low productivity in cargo handling take place. Capacity development is an urgent issue to be tackled.
Mombasa Port has various advantages in maritime transport, namely long history as an international port, an international gateway function referred by Kenya and other landlocked countries and plenty of
(Export)
2,013 2,014 2,015 2,020 2,025 2,030 2,035
Tea 541 554 522 605 698 811 912
Soda Ash 423 336 355 465 588 737 870
Coffee 264 256 265 313 368 434 493
Others 840 851 965 1,269 1,608 2,022 2,391
Total General Cargo 2,068 1,997 2,107 2,652 3,262 4,004 4,666
Titanium 0 363 450 450 450 450 450
Soda Ash in Bulk 0 0
Cement in Bulk 0 0
Fluorspar 65 59
Other Dry Bulk 0 0 84 84 84 84 84
Total Dry Bulk 65 422 534 534 534 534 534
Bulk Oil 62 19
Bunkers 38 26
Total Liquid Bulk 100 45 112 112 112 112 112
Grand Total (Export) 2,233 2,464 2,753 3,298 3,908 4,650 5,312
(x 1,000 tons)
2,013 2,014 2,015 2,020 2,025 2,030 2,035
Total (Import, Export) 22,329 24,000 27,019 37,353 48,915 61,467 72,889
Mombasa Port Master Plan including Dongo Kundu Final Report – October 2015
Executive Summary
57
direct hinterland which could be developed as industrial area. Mombasa Port shall be developed taking these advantages in to consideration.
In this context, basic policies are set as follows;
To develop cargo handling capacity to meet future cargo demand To develop Mombasa Port in comprehensive manner to meet various needs from other
projects including Dongo Kundu SEZ, Mombasa Urban Development Project, Mombasa Bypass Highway project and other important projects.
(4) Overall Goals of Master Plan
Overall goals of the Mombasa Port Master Plan are set as follows;
To strengthen an international gateway function not only for Kenya but also for but also landlocked neighboring countries including Ethiopia, South Sudan, Uganda, Burundi, Rwanda and D.R. Congo,
To develop the best and largest international maritime gateway port in the east African coast; container terminals will stretch 1,500 m length in Kipeve area.
To become the central area of free trade, manufacturing and processing in the east coast of Africa
To support the tourism sector To contribute actively to solutions in urban issues including traffic congestion in Mombasa
by means of vigorous utilization of railway and bypass highways.
(5) Strategies of the Master Plan
Basic strategies of the Master Plan are set as follows;
To develop Mombasa Port in the most effective and efficient manner utilizing existing resources and potential of the port.
To maximize cargo handling capacity of the port. Overflowing cargo will be handled in another international port including Lamu Port.
To develop required mooring and other facilities in a timely manner. These required facilities include terminals for MPDP, Dongo Kundu SEZ Project and other necessary projects.
To renew existing berths in Kilindini in series. Passenger facilities including a berth and terminal will be developed.
To introduce more efficient cargo handling equipment to cope with the critical shortage of berths.
To ensure the maritime safety and security To preserve and improve the natural environment in/out of the port
(6) Spatial Utilization Plan
In order to rationalize spatial utilization in the port, two types of long-term spatial utilization plans are prepared. One is on line with current spatial utilization and the other is modified plan to relocation some kinds of bulk cargo from existing area to Dongo Kundu Area. Figure 12.2.1 shows the former and Figure 12.2.2 shows the latter.
Mombasa Port Master Plan including Dongo Kundu Final Report – October 2015
Executive Summary
58
Figure 12.2.1 Spatial Utilization Plan (Base Case (Scenario 1))
Source: The Project Team
Figure 12.2.2 Spatial Utilization Plan (Alternative (Scenario 2))
Source: The Project Team
Mombasa Port Master Plan including Dongo Kundu Final Report – October 2015
Executive Summary
59
(7) Scale of Development
a) Major Facilities to be developed
Container Terminal: At Kipevu area, international container berths of 1,500m in length (Draft -15m, Length 300m x 5 berths) should be developed targeting for 60,000 DWT (4,300-5,700 TEU) class container vessels.
Multi-purpose Terminal: At Dongo Kundu area, international multi-purpose berths of 600m in length (Draft -14m, Length 300mx 2 berths) should be developed targeting for 30,000 DWT (8,000 units) class car carriers, 70,000 DWT class dry bulk carriers and other vessels.
General Cargo Terminal: At Lighter area, international general cargo berths of 720m in length (Draft -10m, Length 180m x 4 berths) should be developed targeting for 20,000DWT class general cargo vessels.
Cruise Ship Terminal: A cruise vessel terminal (Draft -10.0m, Air draft 63m, Length 350m), targeting for 130,000GT class cruse vessel should be developed. (Transformation of existing Berth No.1 and No.2 from general cargo terminal to cruise terminal at Klindini area or new development near Lighter area)
Petroleum Jetty: At the area in front of Navy Grand, a new oil jetty platforms consisting of 4 berths should be developed. These 4 berths are targeting for 5,000 – 200,000DWT oil tankers (with tidal advantage).
b) Economic Aspect
Total investment including public and private sector are between US$ 20.2 billion to US$ 23.4 billion.
12.2.2 Facility development and improvement plan
(1) Up to 2020
Figure 12.2.3 shows the development plan up to 2020.
Figure 12.2.3 Development Plan up to 2020
Source: The Project Team
Mombasa Port Master Plan including Dongo Kundu Final Report – October 2015
Executive Summary
60
(2) 2021 - 2025
Figure 12.2.4 and Figure 12.2.5 show the development plan in 2021 to 2025.
Figure 12.2.4 Development Plan in 2021 to 2025 (1)
Source: The Project Team
Figure 12.2.5 Development Plan in 2021 to 2025 (2)
Source: The Project Team
Mombasa Port Master Plan including Dongo Kundu Final Report – October 2015
Executive Summary
61
(3) 2026 - 2030
a) Base Case (Scenario 1)
Figure 12.2.6 shows the development plan in 2026 to 2030.
Figure 12.2.6 Development Plan in 2028 (Base Case (Scenario 1)
Source: The Project Team
Mombasa Port Master Plan including Dongo Kundu Final Report – October 2015
Executive Summary
62
b) Alternative (Scenario 2)
Figure 12.2.7 and Figure 12.2.8 show the development plan in 2026 to 2030.
Figure 12.2.7 Development Plan in 2026 and 2028 (Alternative (Scenario 2) (1)
Source: The Project Team
Figure 12.2.8 Development Plan in 2026 and 2028 (Alternative (Scenario 2) (2)
Source: The Project Team
Mombasa Port Master Plan including Dongo Kundu Final Report – October 2015
Executive Summary
63
(4) 2031- 2035
a) Base Case (Scenario 1)
Figure 12.2.9 shows the development plan in 2026 to 2030.
Figure 12.2.9 Development Plan in 2032 (Base Case (Scenario 1)
Source: The Project Team
Mombasa Port Master Plan including Dongo Kundu Final Report – October 2015
Executive Summary
64
b) b. Alternative (Scenario 2)
Figure 12.2.10 shows the development plan in 2026 to 2030.
Figure 12.2.10 Development Plan in 2032 (Alternative (Scenario 2)
Source: The Project Team
12.2.3 Administrative development
(1) Structural Reform
KPA shall accelerate institutional reform from “Service Port” to “Landlord Port”. KPA currently owns most of the port infrastructure and undertakes the majority of port operations. The shift in the role of KPA from port service provider to landlord and regulator is a difficult change management exercise. The Government of Kenya committed to transforming Mombasa to a landlord port in 2002, but there has been little progress on implementation. There can be no strategic port management until the roles of the public and private sectors are clearly defined in a low. It will require new skills, institutional capabilities, and practices including regulating unfair and anti-competitive practices, designing and negotiating contracts with private providers of port services, performance monitoring and ensuring compliance with standards.
Mombasa Port Master Plan including Dongo Kundu Final Report – October 2015
Executive Summary
65
12.3 Recommendations
12.3.1 Efficient port operation
(1) PPP scheme at new container terminals in Kipevu area
To realize the efficient and global operation of port, PPP scheme and concessioned terminal operation should be introduced in development and operation of new container terminals in Kipevu area, and multi-purpose terminals in Dongo Kundu area.
(2) Improvement of existing cargo handling equipment/systems
Chapter 6 of this master plan, “Mombasa Port Development Plan including Dongo Kundu Area”, introduced the following assumption on future improvement of cargo handling productivity.
Productivities except container and other liquid bulk will increase 10 % in 2020 and 2025. Productivities except container and other liquid bulk will increase 20 % in 2030 and 2035. Productivity of container will be stable. Since current productivity at the existing berths
seems to have almost reached the maximum and that of the second container terminal (MPDP) is expected to be very high, it is not realistic to expect productivities to increase in future.
Productivity of other liquid bulk will increase 20 % in 2020 and 2025. Productivity of other liquid bulk will increase 40 % in 2030 and 2035.
These improvements by means of introduction of new and larger cargo handling equipment/systems are inevitable to implement the master plan.
Specified issues of current cargo handling are as follows;
Motorcars are unloaded mainly at Berth No.1. There is no designated large parking area in Mombasa Port; unloaded vehicles park temporarily at various and scattered places in the port. If a large parking area were established for motorcars, productivity would become twice or three times the current level.
Steel is handled by ship gear cranes and trucks in a narrow space because vacant transit sheds are located close to the quay-wall. If a wider space were provided for steel handling, productivity could be dramatically improved.
Container handling productivity has already been surveyed in the “SAPROF Review Report.”
Bulk wheat is unloaded at Berth No.3 where GBHL’s unloaders are located in. Long waiting time for berthing takes place at Berth No.3 due to the low capacity of existing equipment.
Bulk clinker is unloaded mainly at Berth No.10. Productivity at Mbaraki Wharf is low due to the decrepit structure of the jetty and old cargo handling equipment.
Bulk fertilizer is unloaded at Berth No.7 and 9. Additional processing of fertilizer, namely packing, is conducted on the apron. Apron is not a space for processing. If another place for storing and processing were to be acquired, productivity at quay-side could be dramatically improved.
12.3.2 Improvement of gate system
Container positioning document system in the port gate and terminal gate should be reviewed, and automated and advanced gate system and container transport booking system should be introduced to cope with the increase of container cargo. Container trailers should pass through gates more smoothly and rapidly.
12.3.3 Harmonization of road and railway
China will supply the initial rolling stock comprising 56 diesel locomotives, 1,620 wagons and 40 coaches. If the availability ratio of wagons is assumed to be 50%, and one wagon carries 4 TEUs containers, annual transport volume by train becomes 1183,000 TEUs. Container demand in 2035 will
Mombasa Port Master Plan including Dongo Kundu Final Report – October 2015
Executive Summary
66
be 3789,000 TEUs. Therefore, transport ratio by rail will be 31%. In the case of 2 TEU in one wagon, its ratio will decrease to 16%. In addition, container cargo volume which is transit to landlocked countries is 104,500 TEUs (3% in total) in 2035. Container logistics is always carried out based on the concept of just in time. Cargo owners who prefer to use railway are in the minority. This means that road transportation is main player for container while rail transportation is a side player. Road access development to the port should be prioritized.
12.3.4 Channel dredging, reclamation and environmental mitigation
Implementation of this port master plan involves a huge amount of channel dredging and reclamation works. Site selection in an offshore of Mombasa to dispose dredged material and collect sea sand material for the reclamation, should be carefully examined. In addition, impacts to mangrove forests should be mitigated, and the relocation of local port inhabitant should be minimized when possible.
12.3.5 Master plan adjustment in every 5 years
To realize this master plan, a huge amount of financial resource and investment are required. This master plan should be implemented step by step examining the economic situation in Kenya and should be adjusted every 5 years. In addition, financial sources should be carefully examined.
12.3.6 Strengthen port administration and coordination power of MOTI
MOTI ensures regulatory framework, enforces authorities/state corporations who manage and implement their projects, and harmonize their missions under the Ministry. The Transport and Infrastructure Departments are responsible for the development of the regulatory framework, which is enforced through the authorities and state corporations under the ministry;
Each Authority has the same power in its administration and operation, which means resolving contradiction(s) in projects’ interfaces is often time-consuming. For example, the Highway Project vs Railway Project and Container Terminal Project vs Railway Project still require further coordination for practical solutions
Planning and project monitoring are handled in the transport department headquarter but there is no planning and coordination department between transport and infrastructure departments. In other words, establish a port and harbor division within MOTI having administrative functions such as to approve port development plans and to establish port and harbor related laws. Moreover, a development coordination division under direct control of each ministry is proposed to coordinate projects among ministries.
It is expected that the Ministry will pay the leading role in inter-sectorial coordination in the master plans.
12.3.7 Establishment of Port Division in MOTI and enactment of a new Port Act
KPA Act has provided for the continued application of the East African Harbor Regulations of 1970 promulgated under the East African Railways and Harbors Act. However changes in shipping, port development and technology, growth in trade, development of larger and more specialized terminals, the need to comply with international legislation and keep abreast of industry practices. Many of the existing regulations and KPA Act fossilized development and management of coastal area. For example, port planning and coordination protocol is not clarified in the KPA Act. That is why other authorities does not respect a master plan established by KPA. A new Port Act, in line with modern international trends, should be prepared. Roles among policy maker, regulator, manager, and operator should be clearly demarcated. At the same time, Port Division in MOTI also should be established.
12.3.8 Study on new international port development plan in Kenya
Mombasa port is the port for 5 countries’ economy, not only for Kenya's. KPA should challenge not only to renew the rules and regulations for port management, but also to develop a new international
Mombasa Port Master Plan including Dongo Kundu Final Report – October 2015
Executive Summary
67
port. A total cargo demand including import and export in 2035 will be 72.9 million tons in Mombasa Port. On the other hand, the future capacity in the new development master plan of Mombasa port including Dongo Kundu area is 52.4 million tons, which means 20.5 million tons of cargo will not be able to absorb in Mombasa port. Lamu port in the north part of Kenya is on the way to be developed but the start of Lamu port operation is not clear now. In addition, the friction between port and urban activities in Mombasa will increase even if development of bye pass highways, standard gage railway and Dongo Kundu area terminals are developed. Therefore a study of new international port development should be start earlier. Malindi area might be considered as one of proposed sites for a new international port.
Mombasa Port Master Plan including Dongo Kundu Final Report - October 2015
Contents
i
Contents
1. Outline of the Project····················································································· 1-1
2. Basic Information Relevant to Logistics in Kenya ··················································· 2-1
2.1.1 Socioeconomic forecast by World Bank, IMF etc. ········································· 2-1 2.1.2 Population ······················································································· 2-2 2.1.3 Gross domestic product (GDP) ······························································· 2-3 2.1.4 Population and GDP Forecast in East African Countries ·································· 2-4
2.2 Maritime transport in East Africa ····································································· 2-5
2.2.1 Category and type of vessels calling at East African ports ································ 2-6 2.2.2 Correlation between calling port and commodities handled ···························· 2-23 2.2.3 Piracy situation and its security measures adopted by concerned countries ··········· 2-30
2.3 Current situation of trade and international transport ············································ 2-34
2.3.1 Trends in East African Trade Flows ······················································· 2-34 2.3.2 Transportation routes to/from Kenya ······················································ 2-35 2.3.3 Liner services to/from Kenya ······························································· 2-39 2.3.4 Liner services to major East African ports ················································ 2-41
2.4 Current situation of domestic transport system in Kenya ········································ 2-46
3. Existing Port Plans and Relevant Information ························································ 3-1
3.1 National Development Plan and other plans in the related Sectors ······························· 3-1
3.1.1 Kenya Vision 2030 ············································································· 3-1 3.1.2 First Medium Term Plan (2008-2012) ······················································· 3-2 3.1.3 Second Medium Term Plan (MTP2) (2013-2017) ········································· 3-4
3.2 Transport Policy and Master Plan ···································································· 3-8
3.2.1 Integrated National Transport Policy ························································ 3-8 3.2.2 National Transport Master Plan (Transport Sector Plan for Vision 2030) ············ 3-16
3.3 Existing port development plans ···································································· 3-21
3.3.1 Review and update of Port Master Plan Study of the Port of Mombasa including Development of Free Trade Zone (2009) ················································· 3-21
3.3.2 SAPROF Review Report (2013) ··························································· 3-28 3.3.3 Strategic Plan 2013-2017 by KPA ························································· 3-32
3.4 Development of Northern Corridor from Mombasa to Nairobi and surrounding countries · 3-37
3.4.1 Outline of Northern Corridor ······························································· 3-37 3.4.2 Current status of infrastructure and system ··············································· 3-39 3.4.3 Corridor cargo movement ··································································· 3-47 3.4.4 Lamu Port and New Transport Corridor Development to Southern Sudan and Ethiopia
4. Relevant Information on Development and Movements in Mombasa Area ······················· 4-1
4.1 Port activities ··················································································· 4-1 4.1.1 Outline of Mombasa Port ······································································ 4-1
Mombasa Port Master Plan including Dongo Kundu Final Report - October 2015
Contents
ii
4.1.2 Throughput in Mombasa Port ································································· 4-2 4.1.3 Number of arriving and departing ships ····················································· 4-8 4.1.4 Present conditions of port facilities ························································ 4-12 4.1.5 Improvement of existing port facilities ···················································· 4-31 4.1.6 Operation of inland container depot ······················································· 4-35
4.3 Environmental and social considerations ·························································· 4-68
4.3.1 Scope of environmental and social considerations study ································ 4-68 4.3.2 Target area of the Environmental and Social Considerations Study ··················· 4-69 4.3.3 Environmental and social baseline ························································· 4-70 4.3.4 Regulatory and institutional framework ··················································· 4-85
4.4 Urban, road, railway and SEZ development projects in Mombasa area ······················· 4-95
4.4.1 Road development project··································································· 4-95 4.4.2 Railway development project ······························································· 4-97 4.4.3 Mombasa SEZ Master Plan ································································ 4-101 4.4.4 Mombasa Gate City Comprehensive Development Master Plan ······················ 4-111
5.1 Future demand forecast model based on the results of existing studies ·························· 5-1
5.1.1 Updated Demand Forecast ···································································· 5-1 5.1.2 Demand forecast model ······································································· 5-5 5.1.3 Results of Demand Forecast ································································ 5-19
5.2 Future trend forecast on ships calling at Mombasa Port ········································· 5-23
5.2.1 Overview of world seaborne trade ························································· 5-23 5.2.2 Present vessel calling at Mombasa port ··················································· 5-27 5.2.3 Future trends of calling ships ······························································· 5-33
5.3 Future passenger demand and port capacity forecast at Mombasa Port ························ 5-36
5.3.1 National Strategy and Policy of Tourism ·················································· 5-36 5.3.2 Present Cruise Ship Calling and Passengers ·············································· 5-38 5.3.3 Demand of Cruise Ship Calling and Passengers ·········································· 5-43
6. Mombasa Port Development Plan Including Dongo Kundu Area ·································· 6-1
6.1 Evaluation of Current Cargo Handling ······························································ 6-1
6.1.1 Cargo Handling at Existing Berths ··························································· 6-1 6.1.2 Major Issues on Current Cargo Handling ················································· 6-36
6.2.1 Basic Stance on Facility Planning ·························································· 6-40 6.2.2 Required Mooring Facilities in 2014······················································· 6-43 6.2.3 Cargo Volume in Future ····································································· 6-45 6.2.4 Productivity in Future ········································································ 6-48 6.2.5 Scenario 1 ····················································································· 6-49 6.2.6 Scenario 2 ····················································································· 6-61
Mombasa Port Master Plan including Dongo Kundu Final Report - October 2015
Contents
iii
6.3 ICD and Rail Access to the Port ···································································· 6-72
6.3.1 Current MGR system in Mombasa Port ··················································· 6-72 6.3.2 Current status of KPA’s ICDs ······························································ 6-73 6.3.3 Advanced rail and ICD systems in Thailand ·············································· 6-75 6.3.4 Recent movement of the SGR Project in Kenya ·········································· 6-76 6.3.5 The SGR development and the new container terminal ································· 6-77 6.3.6 Harmonization of road and railway ························································ 6-78 6.3.7 Basic direction for improvement of traffic flow inside and outside of the port ······· 6-78
7. Implementation of the Port Development and its Investment Policy ······························· 7-1
7.1 Economic and financial analysis ······································································ 7-1
7.1.1 Estimation of the investment amount ························································ 7-1 7.1.2 Economic analysis ··········································································· 7-15 7.1.3 Financial analysis ············································································ 7-24
7.2 Development and investment policy ······························································· 7-44
7.2.1 Study of public-private cooperation for the development ······························· 7-44 7.2.2 Financial studies under PPP scheme ······················································· 7-45
7.3 Scoping on priority project ·········································································· 7-50
7.3.1 Major concerns and benefits ································································ 7-50 7.3.2 Scoping matrix ················································································ 7-53 7.3.3 Stakeholder Meetings ········································································ 7-64 7.3.4 Suggestions for future study ································································ 7-65
8. Port Administration and Management ································································· 8-1
8.1 Government ministries ················································································· 8-1
8.2 Ministry of Transport and Infrastructure ····························································· 8-2
8.2.1 Core functions of transport department ······················································ 8-2 8.2.2 Core Functions of Infrastructure Department ··············································· 8-3 8.2.3 Institutions ······················································································ 8-3 8.2.4 Strengthen port administration and coordination power of MOTI ······················· 8-4
8.3 Kenya Maritime Authority (KMA) ··································································· 8-6
8.4 Kenya Port Authority (KPA) ·········································································· 8-8
8.4.1 Current status of KPA ········································································· 8-8 8.4.2 Establishment of Port Division in MOTI and enactment of a new Port Act ·········· 8-13
8.5 KPA’s endeavors to become a landlord and concession port ···································· 8-14
8.5.1 Port reform action in Africa ································································· 8-14 8.5.2 Transformation to landlord port ···························································· 8-14 8.5.3 Endeavors of KPA ··········································································· 8-15
8.6 Public Private Partnerships (PPP) ·································································· 8-17
8.6.1 PPP Act in Kenya ············································································ 8-17 8.6.2 Implication of the PPP Act ·································································· 8-18 8.6.3 PPP port projects considered by KPA ····················································· 8-20 8.6.4 Realistic PPP model in Mombasa Port ···················································· 8-21
8.7 Port entry system in Mombasa Port ································································ 8-22
8.7.1 Customs clearance ··········································································· 8-22 8.7.2 No real time cargo status in SIMBA ······················································· 8-22
Mombasa Port Master Plan including Dongo Kundu Final Report - October 2015
Contents
iv
8.7.3 Slow cargo flow in Mombasa Port facilities ·············································· 8-23
8.8 E-Port System in KPA ··············································································· 8-24
8.8.1 Kenya National Single Window System (KNESW) ····································· 8-24 8.8.2 E-port system in KPA········································································ 8-25 8.8.3 Going Forward (New Gate System)························································ 8-26
9. Conclusion and Recommendation ······································································ 9-1
9.1 Mombasa Port Master Plan ············································································ 9-1
9.1.1 Current Situation and Issues of Mombasa Port ············································· 9-1 9.1.2 Future Cargo Demand ········································································· 9-4 9.1.3 Mombasa Port Master Plan ··································································· 9-5
9.2.1 Efficient port operation ······································································ 9-15 9.2.2 Improvement of gate system ································································ 9-15 9.2.3 Harmonization of road and railway ························································ 9-15 9.2.4 Channel dredging, reclamation and environmental mitigation ························· 9-16 9.2.5 Master plan adjustment in every 5 years ·················································· 9-16 9.2.6 Strengthen port administration and coordination power of MOTI ····················· 9-16 9.2.7 Establishment Port Division in MOTI and enactment of a new Port Act·············· 9-16 9.2.8 Study on new international port development plan in Kenya ··························· 9-17
Mombasa Port Master Plan including Dongo Kundu Final Report - October 2015
1. Outline of the Project
1-1
1. Outline of the Project
Mombasa Port, located in Mombasa City, is the largest port in the East Africa region. Mombasa port is used not only for the trade of Kenya, but also for inland countries such as Uganda and Rwanda. Due to the rapid economic development in the region and the increasing container handling volume, the Japan International Cooperation Agency (hereinafter referred to as “JICA”) is supporting Kenya Ports Authority (hereinafter referred to as “KPA”) in expanding the container terminal on the northern side of the port under the “Mombasa Port Development Project” (hereinafter referred to as “MPDP”) of which a loan agreement was signed in November 2007 for the amount of 26.7 billion Japanese Yen. In addition, at the request of the Government of Kenya (hereinafter referred to as “GOK”), JICA commenced “The Project on Master plan for Development of Dongo Kundu, Mombasa Special Economic Zone” which is expected to contribute to the acceleration of economic growth in Kenya and the East African region.
In recent years, the cargo handling volume of Mombasa port has been increasing much more than forecast. Taking the current situation into consideration, it is required to formulate the Master Plan for the Development of Mombasa Port which contains the vision and concept of Mombasa Port development after completion of the above mentioned Yen loan project. A Detailed Planning Survey Team was dispatched to Kenya in November 2013 and held a series of discussions with Kenyan authorities on formulation of the Project. Based on the discussions, a consensus was reached on the objectives and methodology of the Project.
(1) Purpose of the project
The project shall be implemented based on the Record of Discussions (hereinafter referred to as “RD”) signed by the Ministry of Transport and Infrastructure (hereinafter referred to as “MOTI”), KPA and JICA on May 29, 2014 including the Project Design Matrix (hereinafter referred to as “PDM”) and Plan of Operation (hereinafter referred to as “PO”).
(2) Overall Goal
For the purpose of developing Mombasa Port, projects are to be implemented in accordance with the Mombasa Port Master Plan including Dongo Kundu.
(3) Project Purpose
Capacity of KPA staff regarding port development is enhanced.
(4) Outputs
Outputs based on the PDM are as follows;
Mombasa Port Master Plan (revised in 2009 by KPA) is reviewed and revised. Strategic planning and management system in KPA is improved. Future capacity and forecast method in KPA is improved. Comprehensive Mombasa Port development implementation/investment plan is prepared.
(5) Project area
The project area shall be Mombasa Port including Dongo Kundu as well as other areas related to the project.
Mombasa Port Master Plan including Dongo Kundu Final Report - October 2015
2. Basic Information Relevant to Logistics in Kenya
2-1
2. Basic Information Relevant to Logistics in Kenya
2.1 Socioeconomic conditions
2.1.1 Socioeconomic forecast by World Bank, IMF etc.
(1) World Bank
Reference is made to “African Overview” and “Kenya Overview” in 2015 by the World Bank.
Sub-Saharan Africa’s macroeconomic prospects remain promising. Despite headwinds, medium-term growth for Africa remains favorable. Regional GDP growth is projected to strengthen to an average annual pace of 5.2 percent in 2015-2016 from 4.6 percent in 2014, and rise to 5.3 percent in 2017. GDP per capita is set to rise steadily from an estimated 2.1 percent in 2014 to 2.6 percent in 2015, reaching 2.8 percent in 2017.
Public investment in infrastructure, increased agricultural production, and buoyant services sector are expected to continue to support growth in the region. The growth pick-up is expected to occur in a context of reduced support from commodity prices and net FDI flows as global demand remains subdued. Overall, Sub-Saharan Africa is forecast to remain one of the fastest growing regions. Net exports are again projected to make a marginal contribution to GDP growth in the region over the forecast horizon. On the import side, the demand for capital goods is projected to remain strong, as governments continue to frontload infrastructure investments and private consumptions remains strong. Reflecting these trends and the weakening of commodity prices, the current account deficit in the region is projected to widen from an estimated 2.4 percent of GDP in 2013 to an average of 3.1 percent of GDP in 2014 and 2015.
Table 2.1.1 shows four-year forecasts for annual GDP growth in Kenya by the World Bank. Kenya’s economy is estimated to have grown by 5.4 % in 2014 and is projected to grow by 6 % in 2015. The resilience is likely to continue with the economy expanding at 6.6 % in 2016 and 6.5 % in 2017, according to the latest World Bank Group’s economic analysis. “The Kenya Economic Update for March 2015” says Kenya is emerging as one of Africa’s key growth centers and is also poised to become one of the fastest growing economies in East Africa, supported by lower energy costs, investment infrastructure, agriculture, manufacturing and other industries.
The momentum for growth is expected to be sustained by a stable macroeconomic environment, continued investment in infrastructure, improved business environment, exports and regional integration. While the overall medium term outlook remains favorable, risks exist from the continued downturn of the tourism sector arising from security concerns. External demand for exports is also sluggish and low growth of production for exports is widening the current account deficit. Also, the share of the manufacturing sector to GDP has remained stagnant in recent years, with low overall productivity and large productivity differences in firms across subsectors due to lack of competition. Increased competitiveness of the manufacturing sector will be a key driver of growth, exports, and job creation.
Table 2.1.1 Four-Year Forecasts for Annual Growth in Kenya
Year 2014 2015 2016 2017
Kenya 5.4 % 6.0 % 6.6 % 6.5 %
Source: World Bank
(2) IMF (International Monetary Fund)
Reference is made to the “IMF Executive Board Concludes 2014 Article Ⅳ Consultation with Kenya” in the following section.
Mombasa Port Master Plan including Dongo Kundu Final Report - October 2015
2. Basic Information Relevant to Logistics in Kenya
2-2
Kenya’s economy has continued to expand in a stable economic environment. Credit to the manufacturing sector has picked up and foreign investor interest is growing, notably in the extractive industries. The economy’s growth rate rose to 5 percent in 2013/2014 and is expected to gain further momentum in 2014/2015, driven by higher domestic and external investment. Kenya’s medium-term growth prospects are favorable, supported by rising infrastructure investment in energy and transportation; the expansion of the East African Community market; deepening financial inclusion, which fosters a more dynamic small and medium-sized enterprise sector; and the positive impact of large-size irrigation projects on agricultural productivity.
The IMF staff report projected higher growth in the Kenyan economy for a third straight year, at 5.8 percent in 2014/2015 after an estimated 5 percent in 2013/2014. Inflation remains moderate, but rising food prices and rapid credit growth may fuel inflation expectations. The staff report noted, however, that manufacturing, transport, and communications were the main supports of growth in early 2014, while the agricultural sector was relatively subdued due mainly to poor rains. In addition, security concerns following terrorist attacks and threats hit the tourism industry.
Promising commercial prospects of oil discoveries could potentially provide significant foreign exchange and fiscal resources. Kenya’s relatively high current account deficit, at 7.7 percent of GDP in 2013/2014, reflects strong capital goods imports, in particular of equipment for oil exploration.
The report said there are five principal drivers of growth in Kenya that support positive projections of economic expansion.
Improved business conditions arising from the removal of bottlenecks by increased infrastructure investment in energy and transportation;
Expansion of the East African Community market thanks to decisive steps toward regional integration with neighboring Burundi, Rwanda, Tanzania, and Uganda;
Reduced social strife as a result of devolution and central government transfers to 47 newly formed countries under the 2010 constitution;
A more dynamic small and medium-sized enterprises sector arising from strong financial inclusion and small business access to credit;
Higher agricultural productivity and reduced medium-term vulnerability of agricultural production to weather shocks, reflecting implementation of large irrigation projects.
A boost in investor confidence following the successful Eurobond issuance could further improve Kenya’s outlook. Accelerated regional integration, improved security conditions, and possible new discoveries of oil, gas, and other minerals could have a large impact on investor sentiment. Nevertheless, the report added, the Kenyan economy is vulnerable to risks affecting the external and fiscal positions. Near-term risks include the potential for security conditions to deteriorate further, for poor rains followed by other weather-related shocks, and additional difficulties in implementing devolution that could complicate public finance management.
Table 2.1.2 shows forecasts for annual growth in Kenya up to Year 2019 by IMF.
Table 2.1.2 Forecasts for Annual Growth in Kenya
Year 2014 2015 2016 2017 2018 2019
GDP(Billion)* 3,841 4,078 4,338 4,619 4,922 5,248
GDP Growth(%) 5.344 6.159 6.381 6.487 6.552 6.617
Source: IMF Note: *Kenya Shillings(Constant Price/Base Year 2009)
2.1.2 Population
According to “World Population Prospects, The 2012 Revisions by United Nations”, the total population in 2014 in Kenya is expected to be 45.581 million and the growth rate is 2.71 % for the last
Mombasa Port Master Plan including Dongo Kundu Final Report - October 2015
2. Basic Information Relevant to Logistics in Kenya
2-3
decade. The change of the population in Kenya for the last decade is shown in Table 2.1.3.
Table 2.1.3 Change of the Population in Kenya for the Last Decade
Source: World Population Prospects; The 2012 Revision by United Nations
The population distribution and density by provinces is shown in Table 2.1.4.
Table 2.1.4 Population Distribution and Density by Provinces (Year 2009)
Province*1 Area (sq. km) No. of Districts Population Density (per km2)
Nairobi 695.1 4 3,138,369 4,515
Central 13,163.7 17 4,383,743 333
Coast 82,892.8 13 3,325,307 40
Eastern 153,403.9 28 5,663,123 37
North Eastern 126,852.3 11 2,310,757 18
Nyanza 12,612.9 21 5,442,711 432
Rift Valley 183,383.2 44 10,005,805 55
Western 8,309.3 20 4,334,282 522
Total 581,313.2 158 38,604,097 66
Note *1: In accordance to the new constitution on 2010, "Province" cease to exist and "County" became as a unit of devolution.
Source: Kenya National Bureau of Statistics; 2009 Population and Housing Census
Out of Kenya’s total population of 38.6 million in 2009, Rift Valley (10 million) has the highest population among the provinces followed by Eastern (5.7 million), Nyanza (5.4 million) and Central (4.4 million) Provinces. Nairobi Province has the highest population density with 4,515 persons/km2
followed by Western (522 persons/ km2), Nyanza (432 persons/ km2) and Central (333 persons/ km2) Provinces.
2.1.3 Gross domestic product (GDP)
Table 2.1.5 shows GDP in Kenya and Uganda surveyed by International Monetary Fund (IMF). According to the data, GDP in 2014 in Kenya was Kenya shillings 3,841,300 billion (Constant prices/Base year 2009) and the average annual growth rates for the last decade and for the last five years were 5.17 %/year and 6.13 %/year, respectively. While, GDP in 2014 in Uganda was Uganda shillings 25,580,200 billion (Constant prices/Base year 2002) and the average annual growth rates for the last decade and for the last five years were 6.63 %/year and 5.36 %/year, respectively.
Mombasa Port Master Plan including Dongo Kundu Final Report - October 2015
2. Basic Information Relevant to Logistics in Kenya
2-4
Table 2.1.5 GDP and Growth Rate in Kenya and Uganda
2.1.4 Population and GDP Forecast in East African Countries
Table 2.1.6 shows the population and GDP in East African Countries, based on the data by International Monetary Fund (IMF). Ethiopia is the biggest population in East African Countries and the second ranking of high GDP growth rate.
Table 2.1.6 Population and GDP Forecast in East African Countries around Kenya
Source: International Monetary Fund, World Economic Outlook Database, April 2015
2014 2020 2014 2020
1,787.3 2,422.9
(4.7) (5.5)
148.6 186.8
(3.3) (4.0)
8.9 10.5
(1.7) (3.8)
626.6 995.5
(10.3) (7.5)
7,467.8 9,999.8
(3.0) (5.0)
759.5 1066.9
(5.7) (5.9)
292.3 359
(3.2) (3.5)
419.6 692.5
(7.4) (14.5)
4,688.0 7,167.8
(7.0) (7.5)
8.0 9.9
(2.9) (3.5)
23.6 32.5
(5.5) (3.1)
41361.6 62093.3
(7.2) (6.9)
51473.8 72539.4
(4.9) (6.3)
124.2 182.5
(5.4) (6.4)
12.1 14.7
(3.2) (3.7)
120 177.9
(6.0) (6.0)Djibouti 0.9 1.1
Country
Zambia 15.0 18.3
Zimbabwe 13.3 14.2
Tanzania 47.7 56.9
Uganda 38.0 45.5
Seychelles 0.1 0.1
South Sudan 11.4 13.1
Mozambique 26.5 30.6
Rwanda 11.1 12.9
Malawi 17.6 20.9
Mauritius 1.3 1.3
Madagascar 23.6 27.8
Eritrea 6.5 7.9
Ethiopia 91.0 103.1
Population Forecast
(million)
GDP Forecast
Upper: National Currency (Billion)
Lower: GDP Growth Rate (%)
Burundi 9.2 10.6
Comoros 0.8 0.9
Mombasa Port Master Plan including Dongo Kundu Final Report - October 2015
2. Basic Information Relevant to Logistics in Kenya
2-5
2.2 Maritime transport in East Africa
Container handling volumes in major African countries for 2013 are shown in Figure 2.2.1. Egypt (Port Said) handled the largest volume (over 4.1 million TEUs) followed by South Africa (Durban) of 2.63 million TEUs. The location of major ports in East Africa is shown in Figure 2.2.2.
Figure 2.2.1 Container Throughput in Africa Source: Containerisation International Lloyd’s List 2013
Figure 2.2.2 Location of Major Ports in East Africa Source: Study Team
Mombasa Port Master Plan including Dongo Kundu Final Report - October 2015
2. Basic Information Relevant to Logistics in Kenya
2-6
2.2.1 Category and type of vessels calling at East African ports
(1) Djibouti Port
Djibouti is a main gateway port for Ethiopia connected through the Addis Ababa corridor (which has been operating since 1998).
a) Table 2.2.1 below shows all types of vessels that called Djibouti from 2010 to 2014. General cargo vessels increased by 48% from 2010 to 2014 while container vessels increased by about 36% during the same period. A total of 1,406 commercial vessels called in 2014.
Table 2.2.1 Calling Record in Djibouti
Type of Vessels 2010 2011 2012 2013 2014
Container vessels 531 684 594 643 720
General Cargo 158 171 205 217 235
Car Carrier/RoRo 105 81 84 66 65
Bulk Carrier 61 79 86 76 61
Tankers 109 97 91 99 86
Livestock 115 117 90 46 80
Navy Vessels 411 382 327 367 288
Others 60 119 100 130 159
Total 1550 1730 1577 1644 1694
Source; Djibouti Harbour Control Office
Vessels which called Mombasa in 2014 are shown below for comparison. While 720 container vessels called Djibouti in 2014, only 557 container vessels called Mombasa.
Car carrier/Ro-Ro made over 200 calls to Mombasa in 2014 whilst Djibouti only had 65 calls in 2014 (Car carrier and Ro-Ro figure combined). This is due differences in the commercial characteristics of each country’s trade.
Table 2.2.2 Calling Record in Mombasa (2014)
Type of Vessels Nos. of calls
Container Ship 557
General Cargo 285
Ro-Ro vessel 49
Car Carrier 156
Bulk Carrier 210
Tankers 194
Total 1,451
Source: KPA Statistics
a) Length Overall (LOA), Dead weight tons (DWT), draft & TEU particulars of all vessels which called Djibouti in April 2015 are shown in Table 4.5.3.
Mombasa Port Master Plan including Dongo Kundu Final Report - October 2015
2. Basic Information Relevant to Logistics in Kenya
2-7
Table 2.2.3 Actual Vessel Size & Type at Djibouti
General cargo vessels and bulk carriers are of similar size as those currently calling Mombasa but container vessels are larger than those calling Mombasa because of differences in berth depths (3 berths with depths of 17~18m are available in Djibouti which were built in April 2008 to accommodate 6,600TEU type vessels which have a DWT of 84,000 tons and LOA of nearly 300 meters).
b) Comparison between berth capacity at Djibouti and Mombasa ports
Djibouti is already able to accommodate 6,000-6,600 TEU sized container vessels. The differences between the container berths in Djibouti and Mombasa ports are indicated in Table 4.5.4.
Table 2.2.4 Djibouti and Mombasa Berths
c) Main regular Services
There are scheduled services by main carriers such as Maersk, MSC, PIL and ad-hoc by Evergreen
Type of Vessels Vessel Name DWT LOA(m) Draft(m) TEU
General Cargo LE CONG 29,108 182 9.6
MEKELE 28,066 166 9.1
GAMBELLA 28,119 166 7.4
ADMAS 13,593 137 8.7
SHEBELLE 27,391 178 9.0
Car Carrier MORNING CHANT 20,190 200 8.2
Bulk Carrier TALENT 47,574 190 11.5
MAINE DREAM 58,105 189 11.7
SEA QUEEN II 57,000 183 10.1
Full Container MSC NOA 44,552 241 10.5 3,044
(Djibouti Container Terminal) KOTA CARUM 83,963 299 10.3 6,600
Djibouti Berth Ro-Ro General Container Container Oil Total
Numbers 1 10 3 3 5 22
Depth (m) 11 7.8-11.3 9.5-12 17-18 12-19
Mombasa Berth Ro-Ro General Container Oil Total
Numbers 2 9 6 2 19
Depth (m) 10.5 10.5-11.5 10.5-13.5 9.76-13.4
Source: JICA Study Team
Mombasa Port Master Plan including Dongo Kundu Final Report - October 2015
2. Basic Information Relevant to Logistics in Kenya
2-8
and COSCO for which the route maps are shown below.
Maersk Line
Maersk Line employs a 6200TEU (LOA 299m) type on the Suez Canal-Djibouti- Salalah-Jebel-Ali- Port Qasim - Pipavav-Jawaharlal Nehru- Salalah route, the details of which are listed below.
Table 2.2.5 Maersk Schedule
PIL
PIL has three services 1) PIL employs a 6600TEU vessel for China direct service and a 3,000 TEU vessel for Indian Sea service, which regularly calls at Singapore – Nansha – Shanghai – Ninbo – Chiwan – Singapore – Djibouti – Aden – Jeddah – Sokhna - Aqaba. 2) Indian Sea calls at Mundra – Karachi - Jebel Ali – Aden – Jeddah - Port Sudan - Djibouti. 3) PIL also operates gulf feeders between Djibouti – Hodeidah port.
Those three services are mapped below.
Figure 2.2.3 PIL Services at Djibouti Source: PIL Web Site
Port Terminal Arrival Departure
Suez Canal Canal Zone Terminal 2015/4/27 19:00 2015/4/28 17:00
Mombasa Port Master Plan including Dongo Kundu Final Report - October 2015
2. Basic Information Relevant to Logistics in Kenya
2-9
(2) Port Sudan
Port Sudan has two areas, a North port and South port which faces the Red Sea as its main trading port. Container service is concentrated on the South port by Sea Ports Corporation.
a) Berths 13 and 14 and 16, 17 and 18 are operated 24 hours a day as container terminals. No.15 is a grain/bulk terminal, which is operated by Sea Ports Corporation. The largest container berth is No.13 with a depth of 16m and LOA of 400m which is suitable for larger sized vessels such as MSC (14,000TEU) as shown below.
Table 2.2.6 Port Sudan (South)
Source: Port Sudan Port Report
b) Calling liner services
Shipping lines calling at Port Sudan are: Maersk, MSC, COSCO, CMACGM, Evergreen, PIL and UASC as follows.
1) Maersk Line
Is operating 3,500 ~ 4,330 TEU vessels weekly on the Jebel Ali – Djibouti – Jeddah - Port Sudan - Djibouti route.
2) MSC - Operating between Yantian - Chiwan / Singapore - Port Sudan with DWT 162,000 sized full container vessel (LOA 366m, width 51m=21 rows, draft 16m, 14,000TEU sized) every week.
3) CMACGM & Evergreen– Jointly Operating between Port Sudan with 4,400 TEU sized vessel between China and Malaysia (Port Kelang) weekly as shown in the following Figure 2.2.4.
Figure 2.2.4 CAM CGM China/ Port Kelang service
Source: CMACGM Web Site
4) PIL – By following the Indian Service available at Port Sudan Calling rotation is Port Sudan – Djibouti –Mundra –Karachi –Jebel Ali – Aden-Jeddah.
Berth No. Depth/m Length/ m Usage
13 16.0 400 Containers
14 16.0 381 Containers
15 10.7 192 Grain/Bulk/G.C
16 10.7 143 Containers
17 12.6 210 Containers
18 12.6 210 Containers
Mombasa Port Master Plan including Dongo Kundu Final Report - October 2015
2. Basic Information Relevant to Logistics in Kenya
2-10
Figure 2.2.5 PIL Port Sudan Service Source: PIL Web Site
(3) South Sudan
a) Via Kenya
South Sudan does not have its own Sea Port as the country is landlocked. It relies on transit cargo, mainly containers, from Mombasa, Kenya and Somaliland.
Cargo via Mombasa was approximately 10% of total Mombasa transit cargo.
Table 2.2.7 South Sudan via Mombasa
b) LAPSSET Corridor
The following map shows the ideal corridor under LAPSSET, which is a major cargo route to the Capital, Juba, but cargo is currently moving via Mombasa. To make shipping cargo to South Sudan more efficient, Lamu can play an important role in Kenya, and would be competitive against the Berbera corridor via Somalia (see Figure 2.2.6).
Total 4,423 4,874 4,980 5,381 5,596 6,625 6,709 7,199
Mombasa Port Master Plan including Dongo Kundu Final Report - October 2015
2. Basic Information Relevant to Logistics in Kenya
2-11
Figure 2.2.6 LAPSSET Corridor Source: LAPSSET Corridor Development Authority
c) Berbera - Juba Corridor
There is another corridor that runs from Berbera to Juba (capital of South Sudan) which connects directly to Sudan from discharge at the Port (see Figure 2.2.7).
Figure 2.2.7 Berbera to Juba Corridor Source: Berbera Port Authority
(4) Somalian Ports
Somalia has two major ports of call, Berbera port (facing the Red Sea) and Mogadishu port under the control of the Somaliland Authority.
The Republic of Somaliland is situated in the Horn of Africa. Its boundaries are defined by the Gulf of Aden in the north, Somalia in the east, the Federal Republic of Ethiopia in the south-west, and the Republic of Djibouti in the north-west. It lies between Latitudes 8° and 11°27″ North and Longitudes 42°35′ and 49° East; it has mountain ranges rising up to six and seven thousand feet in the center and
Mombasa Port Master Plan including Dongo Kundu Final Report - October 2015
2. Basic Information Relevant to Logistics in Kenya
2-12
in the east of the country respectively. The total area of the Republic of Somaliland is 137,600sqkms, and it has a coastline which is 850kms long.
a) Berbera has been operating as a port for more than a 1000 years; the present facilities were developed initially by the Soviet Union in 1968 (300 meter berth) and expanded by the USA in 1984 to 350 meters.
In 2011, the volume of import containers reached nearly 15,000TEU, however there is no breakdown by individual commodity in the container statistics.
Information on berth dimensions is limited but shown below in Table 2.2.8.
Table 2.2.8 Berbera Berth
b) The number of vessels calling at Berbera increased rapidly from 2007-2011 but the figures for 2012/2013 have not yet been reported by the port authority.
Figure 2.2.8 Berbera Port Traffic Source: Berbera Port Authority
c) Regular Service –Berbera calling
PIL is provides service for Djibouti- Berbera- Massawa on the feeder service shown below.
Ro-Ro Berth
Berth No.1 No.2 No.3 No.4 No.5 No.6
Length (m) 125 125 125 125 125 25
Depth (m) -9 -9 -9 -9 -11 -9
Source: Berbera Port Authority
General Cago Berth
440 470495
670 735
0
100
200
300
400
500
600
700
800
2007 2008 2009 2010 2011
Nu
mb
er o
f C
alls
Year
Mombasa Port Master Plan including Dongo Kundu Final Report - October 2015
2. Basic Information Relevant to Logistics in Kenya
2-13
Figure 2.2.9 PIL Somalia Berbera Feeder Service Source: PIL Web Site
d) Regular Service-Mogadishu after Mombasa is called on.
Regular service is operated by CMACGM as shown in the following calling route between Khor Al Fakkan, Jebel Ali.
Figure 2.2.10 Mombasa-Mogadishu-Khor Fakkan Service Source: CMACGM Web Site
However, vessel size, at present, is limited because of the size and depth of the berths in both ports.
Vessels ranging from 1,600~2,200TEU typically call the ports. This service was not found in 2013 when the first survey of vessels calling Mombasa was conducted.
Mombasa Port Master Plan including Dongo Kundu Final Report - October 2015
2. Basic Information Relevant to Logistics in Kenya
2-14
Table 2.2.9 Vessels Employed (2015) by CMACGM
Of the 4 container vessels deployed on this route, three have ship’s gear and one is a gearless vessel.
e) Mogadishu Port
Mogadishu is located in Somalia north of Kenya as per the following map.
Figure 2.2.11 Mogadishu Port Source: Google Map
Mogadishu port is not fully containerized but accepts most general cargo vessels at its current 6 berths.
No.6 berth, with a depth of 10 m, is the only berth in Mogadishu capable of accommodating a 200m sized vessel.
Table 2.2.10 Mogadishu Berths
Vessel Name Ships geared TEU Size
CMACGM KAILAS Y 1,854
CMACGMLA TOUR Y 2,272
MARIE DELMAS Y 2,207
OSAKA TRADER N 1,613
Source: CMACGM Web Site
Container Berth
Berth No.1 No.2 No.3 No.4 No.5 No.6
Length (m) 160 160 160 160 140 200
Depth (m) -10 -10 -10 -8 -8 -10
Source: Somaliland Port Authority
General Cargo Berth
Mombasa Port Master Plan including Dongo Kundu Final Report - October 2015
2. Basic Information Relevant to Logistics in Kenya
2-15
(5) Tanzania
a) Dar es Salaam, Tanga and Mtwara ports
Table 2.2.11 shows ships calling at major ports in Tanzania in 2012/2013 and 2011/2012. In 2012/2013, 347 vessels for dry bulk/general cargo, 477 container ships and 138 tankers called at the three ports, namely Dar es Salaam, Tanga and Mtwara in Tanzania.
Table 2.2.11 Ship Calling at Major Ports in Tanzania
Based on the report of “Port of Dar es Salaam, due partly to the modernizing of Berths 1-7 in 2013” by Tanzania Port Authority (TPA), a total of 781 vessels called at Berths 1 to 11 in Dar es Salaam Port from July 2010 to June 2011 (Year 2010/2011); 467 were container vessels, 54 dry cargo vessels, 81 general cargo vessels and 178 Ro-Ro vessels. Table 2.2.12 shows average and maximum size for various types of vessels calling at Dar es Salaam Port
Table 2.2.12 Average and Maximum Vessel Calling at Dar es Salaam Port in 2010/2011
Vessel Type DWT LOA (m) Beam (m) Draft (m) Parcel Size
Container (Berth 1-7) Average 24,907 181 27.1 8.8 1,200TEU
Maximum 34,682 212 32.0 11.4
Container (Berth 8-11) Average 24,041 176 26.3 8.9 1,200TEU
Maximum 55,321 234 32.3 11.9
Dry Cargo Average 32,269 171 26.7 9.2 23,000t
Maximum 58,020 190 32.3 11.4
General Cargo Average 21,377 155 24.5 7.6 11,000t
Maximum 53,565 199 32.3 10.5
RoRo Average 29,217 201 31.1 9.7
Maximum 41,373 217 32.3 10.8
Car Carrier Average 17,868 191 31.3 8.3 490nos.
Maximum 36,837 232 33.0 9.7
Source: “Port of Dar es Salaam Modernizing of Berth 1-7 in 2013” by Tanzania Port Authority
Total GRT('000) 24,479 23,826 1,456 1,533 540 654 26,475 26,013
Source: TPA Statistics
DAR ES SALAAM TANGA MTWARA TOTAL Tanzanian Major Ports
Mombasa Port Master Plan including Dongo Kundu Final Report - October 2015
2. Basic Information Relevant to Logistics in Kenya
2-16
A 58,020 DWT bulk carrier was the maximum size in Dar es Salaam Port, followed by a container ship (55,321 DWT), a general cargo ship (53,565 DWT), a RoRo ship (41,373 DWT), and a car carrier (36,837 DWT).
Current TPA regulations allow a maximum length over all of only 234 m, whereas vessels with a draft of more than 9.4 m or a length over 200 m are restricted to high tides adding approximately 2 m water depth for the passage through the entrance channel. However the deepest draft ship at a TPA berth during the reporting period ending June 2011 had a draft of 11.9 m.
For reference, vessels calling in January 2015 in Tanzanian ports are shown in Table 2.2.13.
Table 2.2.13 Calling Vessels in Tanzanian Ports in January 2015
Port Vessel Type DWT LOA (m) Beam (m) Draft (m)
Dar es Salaam Car Carrier Car Carrier Tanker Container Container Container Container Bulk Bulk General Cargo
According to the above table, a 55,628 DWT bulk carrier was the maximum size in Dar es Salaam Port, followed by a tanker (45,987DWT), a container ship (35,980 DWT), a general cargo ship (23,440 DWT) and a car carrier (19,670 DWT). It is noted that the maximum size vessels are similar in both Table 4.5.12 and Table 4.5.13 even though the recorded period is one year for the prior and only one month for the latter.
Size of a bulk carrier calling into Tanzania is limited and a Handy-Bulker or Handy-Max type is the maximum size under the present port condition. A bulk carrier such as over 55,000 DWT needs to reduce its cargo to half loaded condition (or call at multiple ports in advance) to reduce its draft. Dry/liquid bulk trade business has totally different characteristics compared to the container trade business. Bulk commodities are often traded on spot market basis and carriers do not follow a schedule. Further, bulk trade business is served using dedicated carrier lines between sources and destinations. Tankers move on a regular basis to supply their own land side storage tanks without missing the supply chain under a contract basis or their own internal supply systems.
TPA has already started port development under a Master Plan in 2009 in Dar es Salaam Port with main funds being supplied through the World Bank (EATTFP). The main development is the container terminal refurbishment aiming at container handling over 650,000 TEUs. Mtwara Port also has a development plan for gas, coal and iron ore. It is expected that the above development will require more ship calls and the deployment of larger size vessels.
b) New Bagamoyo Port
It is proposed by Hamburg Port Consulting GmbH (HPC) on feasibility Study to develop a state-of-the-art port for containers and imported vehicles at Mbegani-Bagamoyo. The design is based on PostPanamax vessels, and a compact and reliable RTG (Rubber Tyred Gantry Crane) Yard System
Mombasa Port Master Plan including Dongo Kundu Final Report - October 2015
2. Basic Information Relevant to Logistics in Kenya
2-17
and high capacity road and rail connectivity. According to DFR report with volumes and pattern the recommended specification of main port components is as follows:
Access Channel: Length: 4,460 meters, Width: 230 meters, Depth:-15.5 m CD alternatively-13.5 m CD
Outer Turning Basin: Diameter: 560 meters
Container Berths: Depth Alongside: -14.5m CD, Length of one berth: 300 meters
Vehicle Carrier Berths: Depth Alongside: -12.0 m CD, Length of one berth: 220 meters
Service Berth: Depth Alongside: -4.0 m CD, Length: 200 meters
Tug Boats: Bollard Pull: 45 to 55 tons
Ship-Shore Container Crane: Type: Post-Panamax
Full Container Stacking: Rubber Tyred Gantry Cranes: 16 wheels
Stacking Height: One over five
Rows within portal: Seven plus one
Empty Container Handler: Stacking Height: Five
Based on the assessment of
the competitive situation of Tanzanian ports in the regional context, the economic perspectives of Tanzania and its landlocked transit countries, and possible transshipment activities,
container throughput of the proposed port at Mbegani-Bagamoyo are forecasted below.
According to the Terms of Reference, the forecasting horizon is 2025. However, as Mbegani-Bagamoyo port is expected to start operations by 2018 at the earliest, the resulting time span of eight years for operational planning and economic and financial feasibility analysis would be too short to arrive at realistic results. Thus, the forecasting period is extended to 2030. As requested by the ToR, three alternative developments are projected.
Phased port development schedules for each three development alternatives (high forecast/base forecast/low forecast) are shown in Table 2.2.15. The comparatively large increase in the forecast traffic volumes requires a rather tight phasing of port construction and extension. The determining element for this phasing is the quay wall that represents the most expensive single construction item apart from dredging. A three-phase development approach is proposed.
Mombasa Port Master Plan including Dongo Kundu Final Report - October 2015
2. Basic Information Relevant to Logistics in Kenya
2-18
Table 2.2.15 Phased Development Schedule for Each Case
Source: TPA Bagamayo Port Feasibility Study DFR
It is also reported that the proposed initial quay length of approximately one kilometer shall ensure successful entry into the market and shall provide sufficient capacity to sustain in the competition with neighboring ports. The following phasing might appear very tight at first site. It should, however, be kept in mind that this schedule is based on a long-term traffic projection with all its uncertainties. The timing of the proposed 2nd and 3rd phase can and will be adapted to actual traffic growth.
In order to minimize dredging, and to make best use of Luale Bay and to secure sufficient shore-line reserve for long-term port extension, it is recommended to locate the new port at the western end of the bay partly covering the site of Mbegani Fisheries Development Centre. This location is almost in line with the port position proposed in the TPMP 2009. The total area required for the development of the new port until 2030 will have a size of approximately 2 km x 0.9 km or 180 ha. The expected port development until 2030 will not require terrain presently occupied by Mlingotini Village.
Figure 2.2.12 Position of the Proposed Port at Mbegani-Bagamoyo Source: TPA Bagamayo Port Feasibility Study DFR
Mombasa Port Master Plan including Dongo Kundu Final Report - October 2015
2. Basic Information Relevant to Logistics in Kenya
2-19
(6) Mozambique
Table 2.2.16 shows ship calls at major ports in Mozambique in 2008 and 2009.
Table 2.2.16 Ship Calling at Major Ports in Mozambique in 2008 and 2009
Vessel Type Nacala Beira Maputo
2008 2009 2008 2009 2008 2009
Container 97 108 114 144 N/A N/A
General Cargo 41 37 118 139 N/A N/A
Bulk Cargo 3 10 - - N/A N/A
Tanker 58 71 98 103 N/A N/A
Others 64 73 66 152 N/A N/A
Total 263 299 396 538 761 613
Source: The Preparatory Survey on Nacala Port Development Project in the Republic of Mozambique in 2011 by JICA
Nacala Port received 299 vessels including 108 container vessels in 2009 and the average cargo handling volume per vessel call is around 4,000 tons or 480 TEUs inbound and outbound. The total number of cargo vessels calling in Beira Port in 2009 was 386 of which 27 % were container vessels. The number of container vessels increased by 26 % compared to the previous year. The number of vessels calling at Maputo Port was 761 in 2008 and 613 in 2009. Thirteen container lines called at the port in 2009, whereas only 5 lines called in 2007.
Dimensions of maximum sized vessels calling at Nacala Port are shown in Table 2.2.16. As shown in Table 4.5.15, 50,000 DWT class vessels call at the port almost every month and occasionally even larger vessels enter the port. Though all these large vessels are conventional vessels such as grain bulkers, they berth at container quays due to the shortage of water depth at general cargo quays. This mixed operation makes port traffic very complicated and hampers container operation.
Table 2.2.17 Dimensions of Maximum-Sized Vessels Calling at Nacala Port
12.1 Source: World’s Port Database Internet Service
According to Table 2.2.18, maximum size of vessels in each port is a 58,780 DWT bulk carrier, a 55,783 DWT bulk carrier and a 58,923 bulk carrier in Nacala, Beira and Maputo, respectively. It is expected that maximum size of vessels is a 50,000~60,000 DWT class for bulk carriers, a 40,000~50,000 DWT class for tankers and a 35,000~40,000 DWT class for container ships.
Nacala Port is a natural deep sea port with 15m depth and a new container terminal is planned by modification of the conventional berth. It is expected in the near future that larger size vessels, especially container ships, will call at the port after development of the terminals including Beira and Maputo.
(7) Category and type of vessels calling at major East African ports
Table 2.2.19 shows the category and type of vessels calling at major East African ports. The biggest container vessel (84,688DWT, LOA 299m, Draft 10.4m) in East African Ports can be accommodated in Djibouti Container terminal in Djibouti.
Mombasa Port Master Plan including Dongo Kundu Final Report - October 2015
2. Basic Information Relevant to Logistics in Kenya
2-21
Table 2.2.19 Category and Type of Vessels Calling at Major East African Ports
Source: Summarized by the Project Team
Moreover, Table 2.2.20 shows container ships and their shipping routes through Mombasa Port by each operator.
Country Port DWT LOA (m) Beam (m) Draft (m) Parcel Size
13,593~
29,108137~200 - 7.4~9.6
20,190 200 - 8.2
47,574~
58,105183~190 - 10.1~11.7
39,763~
84,688222~299 - 8.8~10.4
3,080TEU~
6,600TEU
45,913~
49.749183~192 - 11~12
Average 24,907 181.0 27.1 8.8 1,200TEU
Maximum 34,682 212.0 32.0 11.4
Average 24,041 176.0 26.3 8.9 1,200TEU
Maximum 55,321 234.0 32.3 11.9
Average 32,269 171.0 26.7 9.2 23,000t
Maximum 58,020 190.0 32.3 11.4
Average 21,377 155.0 24.5 7.6 11,000t
Maximum 53,565 199.0 32.3 10.5
Average 29,217 201.0 31.1 9.7
Maximum 41,373 217.0 32.3 10.8
Average 17,868 191.0 31.3 8.3 490nos.
Maximum 36,837 232.0 33.0 9.7
84,980 285.4 43.4 9.3
22,967 184.2 25.3 9.8
50,271 189.8 32.3 12.3
18,871 160.0 28.0 6.1
28,200 169.3 27.2 5.8
45,200 240 37.5 8.931,975~
32,127
177~
177.230.0
7.0~
7.2
25,985~
35,926
179.7~
208.9
27.6~
29.9
8.1~
9.7
58,780 189.9 32.3 12.614,386 127.6 20.0 6.4
47,128~
50,386
182.4~
189
32.0~
32.2
7.8~
10.0
26,361 174.0 28.2 10.513,464~
27,500
146.7~
193.0
22.3~
31.5
6.8~
8.2
53,776~
55,732
187.8~
194.0
32.0~
32.3
7.8~
9.6
12,684 138.0 21.4 8.0
13,363 184.1 30.6 8.4
5,261 106.0 17.6 5.433,796~
41,815
187.4~
199.0
22.3~
31.5
6.8~
8.2
28,200~
58,923
169.3~
197.0
27.2~
32.3
5.8~
12.1
Djibouti Port
Vessel Type
Container (Berth 1-7)
Container (Berth 8-11)
Dry Cargo
General Cargo
Car Carrier
Bulk Carrier
Full Container
(Djibouti Container Terminal)Tankers
(Djibouti Oil Terminal)
Djibouti
Tanker
LNG Tanker
Container
Bulk
Beira
RoRo
Tanker
Container
Bulk
General Cargo
Nacala
Tanga Port
Mtwara Port
LNG Tanker
Container
Tanzania
Mozambique
Car Carrier
LNG Tanker
Container
Bulk
Maputo
General Cargo
Bulk
Container
Bulk
Car Carrier
Dar es Salaam
PortGeneral Cargo
RoRo
Mombasa Port Master Plan including Dongo Kundu Final Report - October 2015
2. Basic Information Relevant to Logistics in Kenya
2-22
Table 2.2.20 Summary of Container Vessels and Shipping Routes by Operator
Source: Summarized by the Project Team
Operator Service Vesel TEU LOA(m) DWT Calling Ports Remarks
CMA-CGM S/A & ASEA2,556~
2,794
208~212
(Width 32.2)
34,248~
41,411
Mombasa~Tanga~Dar Es Salaam~Port Kelang~
Singapore~Colombo~Port Victoria~MombasaWeekly
Emirates Shipping (6 vessels)
(CMACGM) SWAX22,600~
2,650207.9~210.0
34,667~
35,924Mombasa~Khor Al Fakkan~Jebel Ali~Mombasa~ Weekly
(5 vessels) (Width 31.3) Dar Es Salaam~Zanzibar~Nacala~Mombasa
Ever Green AEF2,474~
2,733
199.85~
212.5
34,167~
41,636
Mombasa~Dar Es Salaam~Singapore~Tanjung
Pelepas~Columbo~MombasaWeekly
(EMC) (5 vessels) (W 30.1~33) by 5 vessels
IGNAZIO
MESSINARoRo+ 3,000 199.5~239.0
27,720~
45,200
Mombasa~Dar Es Salaam~Maputo~Durban~
Nakala~Dar Es Salaam~Weekly
(MESSINA) Containers (4 vessels) (W 30.1~33)~Mombasa~Jeddah~Leghorn~Barcellona~Marseille~
Mombasa Port Master Plan including Dongo Kundu Final Report - October 2015
2. Basic Information Relevant to Logistics in Kenya
2-23
2.2.2 Correlation between calling port and commodities handled
(1) Djibouti Port
Most of the inbound/outbound cargoes are destined/originated to or from Ethiopia, however, as stated in Chapter 2.2.1 there are no cargo statistics available to the public at present.
Most of the cargo to be consumed in Addis Ababa is regularly transported from the Djibouti-Addis corridor.
Livestock export is Somaliland’s second most important export as 80 vessels entered for loading livestock headed for Arabian Gulf countries.
There is no exact country wise breakdown for transit containers via Djibouti but total handling volumes at Djibouti are shown in the table below.
The total handling volume in Djibouti in 2014 was 864,027 TEU which is a little smaller than the Mombasa figure (including transit to Uganda, Rwanda, DR Congo and South Sudan) but is very close to the 2013 result. Mombasa achieved over 1 million TEUs in 2014 as growth has been more rapid than in Djibouti. There are no statistics which list cargo to/from Ethiopia,
It is noteworthy that the 50,000 tons of bagged fertilizer imported into Ethiopia annually are transported via the Somaliland port of ‘Berbera’ under a new contract signed by the Ethiopian government in 2015.
(2) Port Sudan
Most of the service trades are between China (direct service) and Middle Eastern countries, however, there are no available cargo statistics or transit cargo breakdown at present. A visit to the Sudan port authority may be useful for acquiring such data.
However there are, as stated formerly, 5 full container berths in operation which serve mostly 4,400TEU ~ 14,000TEU (Max) vessels which suggests that a large volume of the containers are handled. The website for the Port of Sudan does not work properly.
(3) Somalian Ports
As stated in section 2.2.1. Livestock exports is an important source of revenue for Somalia and they exported 3.5 million heads in 2012.
Imports are mostly food (Rice, Wheat, Vegetables) for human consumption, clothing, cigarettes, and beverages, which are mostly consumed in Hargesia, the capital of Somaliland.
a) Export -Somaliland Ministry of National Planning and Development reported the following
Total Handlings 703,617 743,273 743,793 793,317 40,361 48,190 50,938 70,710
Source;Djibouti Harbour Control Office
DPWT(Dorale) PDSA
Mombasa Port Master Plan including Dongo Kundu Final Report - October 2015
2. Basic Information Relevant to Logistics in Kenya
2-24
export figures for livestock, which is the backbone of the Somaliland economy and provides subsistence to a considerable proportion of the local population. Livestock export contributes to more than 60% of the national GDP and earnings. Livestock is now regarded as a source of cash income to Somalia.
The largest market for Somaliland livestock exists in Middle Eastern countries, especially Saudi Arabia as the largest country. On average, sheep/goats make up about 85% of the total in average and the rest are cattle and camels.
Table 2.2.22 Somaliland Export Livestock
Imports – Figures are steady and continue to be made up of products similar to those in 2013 but the figures for 2013 are still estimates as no figures have been published yet. Cigarettes and soap imports are increasing remarkably. Food imports consist of mainly Sugar, Rice, Wheat, Wheat Flour, Pasta and cooking oil.
Table 2.2.23 Somaliland Import Products
Note: Right hand column is the estimate for 2013, which was 4 times that of the Q1 figure.
Most of the import products are containerized but below container data has no breakdown by commodity at present.
Total 1,455,871 1,495,575 2,019,248 3,159,258 3,362,899 3,512,602
Source: Somaliland Statistical Buletin
(unit: tons)
Commodity 2010 2011 2012 2013 (Q1) 2013 (Prosp.)
Foods 399,966 430,577 417,978 105,579 422,316
Track Spare Parts 16,942 17,646 15,722 7,713 30,852
Construction Mtrl. 202,722 252,179 205,728 55,887 223,548
Cloths 20,514 13,792 10,861 288 1,152
Cigarettes 6,872 9,225 9,011 3,812 15,248
Soap 9,993 11,592 9,148 4,520 18,080
Others 128,988 176,598 197,715 49,579 198,316
Total 785,997 911,609 866,163 227,378 909,512
Source: Somaliland Statistical Buletin
Mombasa Port Master Plan including Dongo Kundu Final Report - October 2015
2. Basic Information Relevant to Logistics in Kenya
2-25
Figure 2.2.13 Berbera Imported Containers Source: Berbera Port Authority
b) The Ethiopia government entered into an agreement in January 2015 with Berbera port to handle 50,000 tons of fertilizer at Somalia for transport to Ethiopia by the Berbera-Addis Ababa corridor instead of Djibouti port, which is shown below.-
Figure 2.2.14 Berbera- Addis Ababa corridors Source: Berbera Port Authority
5,9506,200
8,100
10,1009,600
11,900
14,200
0
2,000
4,000
6,000
8,000
10,000
12,000
14,000
16,000
2005 2006 2007 2008 2009 2010 2011
TE
U
Year
Mombasa Port Master Plan including Dongo Kundu Final Report - October 2015
2. Basic Information Relevant to Logistics in Kenya
2-26
(4) Tanzania
Table 2.2.24 shows cargo handling volumes at ports in Tanzania.
Table 2.2.24 Cargo Handling Volume in Tanzanian Ports in 2012/2013 Unit: 1,000 tons
Port Import Bulk Export Bulk
Total Dry Break Liquid Total Break Liquid Total
Dar es Salaam 1,743 4,440 4,261 10,443 1,926 75 2,001 12,444
Tanga 250 89 6 345 113 0 113 458
Mtwara 0 65 0 65 139 0 139 204
Others 0 75 16 92 30 0 30 122
Total 1,993 4,669 4,283 10,945 2,208 75 2,283 13,228
Source: Tanzania Port Authority
Dar es Salaam Port is the largest port and handled 94 % of the total bulk cargoes in Tanzania in 2012/2013. According to data from the “International Trade Center”, the share of imported oil products accounted for nearly 40 % of the total import amount in 2013, followed by vehicles (9%), Iron & steel (4%) and cereals (3%). The share of the exported ores, slag and ash accounted for 9 % of the total export amount in 2013, followed by oil products (2 %) and sugar (2 %).
Table 2.2.25 shows transit cargo volumes to landlocked countries from Tanzanian ports.
Table 2.2.25 Transit Cargo Volumes to Landlocked Countries from Tanzanian Ports in 2012/2013
Unit: 1,000 tons
Country Import Export
Total Break/Dry Liquid Container Total Break Liquid Container
Zambia 118 1,148 313 1,580 0 0 279 1,859
DR Congo 19 312 370 702 0 0 264 965
Burundi 26 137 125 287 0 0 21 308
Rwanda 93 235 281 610 0 0 28 637
Malawi 11 27 36 75 0 0 19 93
Uganda 116 42 32 189 0 0 1 191
Others 23 27 4 53 0 0 17 70
Total 406 1,929 1,161 3,496 0 0 628 4,123
Source: Tanzania Port Authority
According to the above table, the share of the transit cargo is 33 % of the total handled volume in Tanzanian ports. This means that Dar es Salaam Port has an important role as a gateway port for landlocked countries. Zambia (45 %) is the major origin and destination of the transit traffic, followed by DR Congo (23 %) and Rwanda (15 %). Liquid bulk and containers are major transit cargoes and the share of liquid bulk in transit is nearly 45 % of the total import volume in Tanzania. A pipeline having 1,710 km in length is installed from Dar es Salaam to Indeni Refinery in Ndola (Zambia), which is operated by TAZAMA Pipeline Limited, jointly owned by the government of Zambia (66.7 %) and Tanzania (33.3 %).
The maximum size of the vessels calling at Dar es Salaam in 2010/2011 was 58,000 DWT for a bulk carrier, 53,000 DWT for a general cargo ship and 37,000 DWT for a car carrier based on the ship calling data in Dar es Salaam Port recorded by the Tanzania Port Authority (TPA). It is expected that
Mombasa Port Master Plan including Dongo Kundu Final Report - October 2015
2. Basic Information Relevant to Logistics in Kenya
2-27
future vessel size will reach 50,000~70,000 DWT due to increased cargo demand and provision of the deep-water berth in Dar es Salaam Port.
(5) Mozambique
Table 2.2.26 shows international trade in Mozambique. Total import and export amounts reached about 10 billion and 4 billion US Dollars in 2013, respectively.
According to Table 2.2.26, it is estimated that oil products, vehicles, aluminium, iron & steel and cereals for import and oil products, aluminium, ship and other floating structures, sugar and ores for export are dry/break/liquid bulk cargoes and most probably are transported over a sea route. The share of oil products (29%) to the total import amount is the largest, followed by vehicles (8%), Aluminium (5%) and Iron & Steel (4%) and cereals (4%). The share of oil products (33%) to the total export amount is the largest, followed by aluminium (26%), ships (6%), sugar (5%) and ores (4%).
Table 2.2.27 shows OD (origin and destination) of major bulk cargoes handled in Mozambican ports in 2008.
Mombasa Port Master Plan including Dongo Kundu Final Report - October 2015
2. Basic Information Relevant to Logistics in Kenya
2-28
Table 2.2.27 Origin and Destination of Major Bulk Cargoes in Mozambican Ports in 2008
Aluminum Europe (100%) Magnetite South Africa (100%) Eastern Asia (67%), Europe (33%)
Citrus South Africa (31%), Swaziland (23%) Europe (62%), Sugar South Africa (45%), Swaziland (24%) Europe (74%), Eastern Africa (12%) Coal South Africa (100%) Europe (74%), Western Asia (11%)
Ferro-Chrome South Africa (65%), Zimbabwe (35%) Eastern Asia (67%), Europe (22%) Chrome Ore South Africa (97%), Zimbabwe (3%) Eastern Asia (66%), Europe (20%)
(Import) Clinker South East Asia (57%), Southern Asia (21%) Wheat Europe (60%), Americas (40-%)
Alumina Oceania (100%) Pet Coke Southern Asia (52%), Americas (48%) Sulphur Southern Africa (100%) Fuel Oil Western Asia (55%), Southern Asia (12%)
Beira (Export)
Granite Zimbabwe (100%) (Import)
Clinker Malawi (19%) South East Asia (57%), Southern Asia (22%) Wheat Malawi (38%), Zimbabwe (19%) Europe (62%), Americas (38%)
Fertilizer Malawi (63%), Zimbabwe (16%) Western Asia (63%), Southern Asia (21%) Fuel Oil Western Asia (55%), Southern Asia (12%)
Nacala (Import)
Clinker South East Asia (54%), Southern Asia (23%) Fuel Oil Malawi (25%) Western Asia (58%), Southern Asia (8%)
Source: The Preparatory Survey on Nacala Port Development Project in the Republic of Mozambique in 2011 by JICA
According to the above table, Europe and Eastern Asia are the dominant export partners for Mozambique. As for Europe, coal and magnetite exported from South Africa via Maputo Port and aluminium produced by Mozal in Maputo are the main contributors. The main exported commodities to Eastern Asia are mineral products such as magnetite, ferro-chrome and chrome ore which are exported from South Africa or Zimbabwe via Maputo Port.
Import partners are diversified more than those of export destinations. The import volume from Western Asia is the largest followed by Oceania. Imported commodities from Western Asia are mainly oil products, while Australian alumina from Oceania which is the raw material for the Mozal aluminium smelter. Substantial amounts of wheat and clinker are imported from Europe and South East Asia respectively. Major commodities imported from Southern Africa are sulphur and oil products. It is assumed that some amount of oil products are imported by land transport. The dominant import origin for fertilizer and oil products in Beira Port is Western Asia and the port handles a substantial amount of oil products which are transported to Zimbabwe via a pipeline. The major trade partners for Nacala Port are Western Asia from which oil products are imported and South East Asia which exports clinker to Mozambique.
It is noted that cargoes are shipped from a deep-sea port adjacent to a cargo source such as a mine, an oil field and a breadbasket community to a hub port by a Cape Size or a Panamax vessel, and then transshipped to smaller feeder vessels bound for minor ports close to their final destinations. However a hub and feeder system is not adopted for bulk transport in Mozambique. For example tankers calling at Nacala Port also call at several ports in the region including Maputo and Beira, and then go back to the Middle East or South Asia. Routes of dry bulk carriers are similar to tankers. They call at several ports in the region to discharge cargoes, and then go to Durban or Richards Bay, probably to load
Mombasa Port Master Plan including Dongo Kundu Final Report - October 2015
2. Basic Information Relevant to Logistics in Kenya
2-29
cargoes in a different contract. There are two reasons for this. One reason is an absence of the appropriate hub port in the country, Maputo and Beira are shallow ports and Nacala has no deep-water bulk terminal. Richard’s Bay and Durban are not major hub ports in the region because Richard’s Bay, which has deep-water quays is focused on providing an efficient transport route for the huge amount of bulk cargoes generated in its hinterland, and Durban, which has no quay with enough water depth is a very busy port. Another reason is the limited volume of bulk cargo demands in the country.
A large quantity of coal export which will reach 5 million tons/year after 2020 is planned in Mozambique. Based on the above plan, handling volumes in Beira and Nacala Port will be 28.5 million tons/year and 18 million tons/year respectively. Four bulk berths with 300 m length in the long-term plan in Nacala Port and an extension of the multipurpose berth in the master plan in Beira Port are planned in order to cope with the increase in cargo such as coal. Further, both ports should have a deep water berth to achieve efficient transportation. As a result, large-scale bulk carriers, at least 50,000 DWT-class vessels or even larger, are also expected to be deployed in the near future. A plan for new bulk berths in Nacala Port should be given attention because it is a natural deep-sea port and has a potential to become a hub port for bulk cargoes in the region.
Mombasa Port Master Plan including Dongo Kundu Final Report - October 2015
2. Basic Information Relevant to Logistics in Kenya
2-30
2.2.3 Piracy situation and its security measures adopted by concerned countries
Piracy off the coast of Somalia has been a threat to international shipping since the second phase of the Somali Civil War in the early 21st century. Since 2005, many international organizations, including the International Maritime Organization (IMO) and the World Food Programme (WFP), have expressed concern over the rise in acts of piracy. Piracy has impeded the delivery of shipments and increased shipping expenses, costing an estimated $6.6 to $6.9 billion a year in global trade according to Oceans Beyond Piracy (OBP). According to the German Institute for Economic Research (DIW), a veritable industry of profiteers has also risen around the piracy. Insurance companies, in particular, have profited from the pirate attacks, as insurance premiums have increased significantly.
According to another source, there were 151 attacks on ships in 2011, compared with 127 in 2010 but only 25 successful hijacks compared to 47 in 2010. Pirates were holding 10 vessels and 159 hostages in February 2012.
In 2011, pirates took in a total of $146 million, an average of $4.87 million per ship. An estimated 3,000 to 5,000 pirates operated; by February 2012, 1,000 had been captured and were going through legal processes in 21 countries. According to the European Union Naval Force (EU NAVFOR), intensified naval operations had by February 2012 led to a further drop in successful pirate attacks in the Indian Ocean, with the pirates' movements in the region at large also significantly constrained. About 25 military vessels from the EU and NATO countries, the United States, China, Russia, India and Japan, patrolled approximately 8.3M km2 (3.2 million square miles) of ocean, an area about the size of Western Europe. On 16 July 2012, the European Union launched a new operation, EUCAP Nestor. An analysis by the Brussels-based Global Governance Institute urged the EU to commit onshore to prevent piracy.
By September 2012, the heyday of piracy in the Indian Ocean was reportedly over. Backers were now reportedly reluctant to finance pirate expeditions due to the low rate of success, and pirates were no longer able to reimburse their creditors. According to the International Maritime Bureau, pirate attacks had by October 2012 dropped to a six-year low, with only one ship attacked in the third quarter compared to thirty-six during the same period in 2011.
Control Risks attributed this 90% decline in pirate activity from the corresponding period in 2012 to the adoption of best management practices by vessel owners and crews, armed private security onboard ships, a significant naval presence, and the development of onshore security forces.
Below is a map showing the location of acts of Somalian piracy based on various attacks in the Indian Sea up to Seychelles near the Maldives area.
Figure 2.2.15 Piracy Threat Map Source: Piracy information via Internet
Mombasa Port Master Plan including Dongo Kundu Final Report - October 2015
2. Basic Information Relevant to Logistics in Kenya
2-31
(1) Latest Pirates Profile:
Most of the pirates are young. An official list issued in 2010 by the Somali government of 40 apprehended pirate suspects noted that 80% (32/40) were born in Somalia's southern conflict zones, while only 20% (8/40) came from the more stable northern regions. As of 2012, the pirates primarily operated from the Galmudug region in the central section of the country. In previous years, they largely ventured to sea from ports in the northeastern Puntland province, until the regional administration launched a major anti-piracy campaign and established a maritime police force (PMPF).
According to a 2008 BBC report, the pirates can be divided into three main categories:
Local fishermen, considered the brains of the pirates' operations due to their skill and knowledge of the sea.
Ex-militiamen, who previously fought for the local clan warlords, or ex-military from the former Barre government used as the muscle.
Technical experts, who operate equipment such as GPS devices.
(2) Methodology
The methods used in a typical pirate attack have been analyzed. They show that while attacks can be expected at any time, most occur during the day; often in the early hours. They may involve two or more skiffs that can reach speeds up to 25 knots. With the help of mother ships that include captured fishing and merchant vessels, the operating range of the skiffs has been increased far into the Indian Ocean. An attacked vessel is approached from quarter or stern; RPGs and small arms are used to intimidate the operator to slow down and allow boarding. Light ladders are brought along to climb aboard. Pirates then will try and get control of the bridge to take operational control of the vessel.
According to the news, pirates often jettison their equipment in the sea before arrest, as this lowers the likelihood of a successful prosecution. Piracy opportunity is decreasing but still there were 72 occurrences in 2014.
The chart below shows the number of ships that were attacked.
Although success in Pricy dramatically decreased to 202 boardings, the amount paid to the pirates was still very high at US$135 million in 2011 from January to December.
The success rate has been decreasing year to year but 16% is still an intolerably high rate.
Figure 2.2.16 Number of Ship Attacks (2009 to 2014) Sources: Somalia Piracy Statistics
410445 439
297264
72
0
50
100
150
200
250
300
350
400
450
500
2009 2010 2011 2012 2013 2014
Nu
mb
er o
f P
ira
te A
ttack
es
Year
Mombasa Port Master Plan including Dongo Kundu Final Report - October 2015
2. Basic Information Relevant to Logistics in Kenya
2-32
Figure 2.2.17 Number of Acts of Piracy in 2013 by Category Sources: Somalia Piracy Statistics
Figure 2.2.18 Amounts Paid to Pirates in 2013 (Million US Dollars) Source: Somalia Piracy Statistics-Amount
Mombasa Port Master Plan including Dongo Kundu Final Report - October 2015
2. Basic Information Relevant to Logistics in Kenya
2-33
(3) Mombasa Security Case
In Mombasa, KPA employs a GMDS (Global Marine Safety System) to monitor the seas from Somalia to Mozambique 24 hours a day.
Figure 2.2.20 Mombasa Security Zone Source: KPA home page -Mombasa Security Zone
To thwart the pirates, KPA adopted an IMO standard (Electric Chart Information System) and continually monitors a 15 mile square zone (Security Safety Zone) to provide security around Kenya/Mombasa port.
Therefore, all vessels wanting to enter into Mombasa port must wait in this security zone until clearance for berthing is obtained because the navy is patrolling 24 hours a day in this safety zone as shown in the above sketch with the AA-BB-CC-DD squares to provide full security.
Mombasa Port
Mombasa Port Master Plan including Dongo Kundu Final Report - October 2015
2. Basic Information Relevant to Logistics in Kenya
2-34
2.3 Current situation of trade and international transport
2.3.1 Trends in East African Trade Flows
It is noted that as in other ports of Africa, East African trade is mostly oriented to non-African countries. According to “Corridor Diagnostic Study of the Northern and Central Corridors of East Africa” in 2011 by Nathan Associates Inc. under USAID Contract, total East African trade was 34.5 million tons in 2008, consisting of 27 million of imports (78.4 %) and 7.5 million of exports (21.6 %). Most of its imports and exports are with non-African partners (78 % and 62 % respectively), while the rest stay within the East Africa region (30 % and 8 %) and with other African countries (8 % and 14 %). This is shown graphically in Figure 2.3.1.
Figure 2.3.1 Distribution of East African Imports and Exports in 2008 Source: “Corridor Diagnostic Study of the Northern and Central Corridors of East Africa” in 2011 by Nathan Associates Inc.
From 2005 through 2009, there was rapid growth in transit traffic for countries using the Northern and Central Corridors. Total transit imports increased from 3.4 million tons in 2005 to 5.6 million tons in 2009, corresponding to an average annual growth rate of 13.3 %. Import growth exceeded export growth in all countries except Sudan. The highest growth in imports was Rwanda (32 %), followed by Uganda (24 %) and Tanzania (19 %). Uganda (23 %) had the highest growth in exports, followed by Sudan (16 %) and Ethiopia (15 %). During this period, Kenya’s imports increased at an average annual rate of 15 % whereas exports grew by only 7 %. Tanzania imports and exports increased at an annual rate of 19 % and 16 %, respectively.
Further observations on common characteristics and trends regarding East African trade flows include:
Countries with a recent history of conflict and economic crises had very low or negative trade growth in the last decade, such as DR Congo and Burundi,
Export growth rates tend to be faster for overseas trade than those for imports, Overseas trade is higher in unit value than trade within Africa, Europe used to be a major trading partners but its share in total trade seems to be gradually
decreasing for most East African countries, East Asia is an emerging trading partner for East Africa and its imports from East Africa are
projected to increase continuously.
Mombasa Port Master Plan including Dongo Kundu Final Report - October 2015
2. Basic Information Relevant to Logistics in Kenya
2-35
2.3.2 Transportation routes to/from Kenya
(1) Transportation routes to/from Kenya
Figure 2.3.2 and Figure 2.3.3 show origin of imports and destination of exports of Kenya in 2014 using sea routes. Cargo volumes are also illustrated in the figures.
Figure 2.3.2 Import Origins and Cargo Volumes of Kenya in 2014 Source: Annual Review and Bulletin of Statistics 2014 by KPA
Figure 2.3.3 Export Destinations and Cargo Volumes of Kenya in 2014 Source: Annual Review and Bulletin of Statistics 2014 by KPA
According to the figures, major import trading partners are India (21.3 %), UAE (16.6 %), China
Mombasa Port Master Plan including Dongo Kundu Final Report - October 2015
2. Basic Information Relevant to Logistics in Kenya
2-36
(13.9 %), South Africa (6.5 %) and Saudi Arabia (5.0 %), while major export partners are India (14.8 %), China (14.2 %), Pakistan (10.7 %), UAE (7.7 %) and Saudi Arabia (5.4 %). The area of the import origin having the highest share is Asia with nearly half (49.1 %), followed by Middle East (36.0 %) and Africa (6.5 %). The import share from Europe is only 5.2 %. The area of the export destination having the highest share is also Asia with a share of 46.7 %, followed by Europe (21.0 %) and Middle East (13.1%). The export share to Africa is only 6.3 %.
Table 2.3.1 shows major import and export commodities in 2013 using sea routes.
Table 2.3.1 Major Import Origin and Export Destination by Commodity in 2013
Source: Annual Review and Bulletin of Statistics 2013 by KPA and Data on “International Trade Center”
Major import origins for POL (Petroleum, oil & lubricants) are UAE and India and nearly a half of the products are imported from UAE. More than 40 % of iron and steel is imported from South Africa. More than 50 % of tea is exported to Pakistan, UK and Egypt. Major destinations of Soda ash are South East Asia and India. In addition, nearly 80 % of coffee is exported to Europe.
On the other hand, air freight handled in Kenya is 295,000 tons and 262,000 tons in 2012 and 2013 respectively, based on data from “Kenya Facts and Figures 2014” by Kenya National Bureau of Statistics. This volume is only 1~1.5 % of the seaborne goods and negligible. It is noted that the great part of trade in Kenya has been done through sea routes.
(2) Transit Cargo to/from Landlocked Countries
Table 2.3.2 shows cargo movement to/from surrounding countries including landlocked from/to Mombasa Port in 2012.
The total transit cargo volume was about 6,626 thousand tons in 2012 and equivalent to nearly 34 % of the total cargo volume handled in Mombasa Port. Most of the important policy on transit cargo through Mombasa Port in Kenya is to concentrate on regulated traffics into Uganda, Rwanda, Burundi, DR Congo and South Sudan reciprocally and the maintenance of the traffic route into those countries, solving bottle neck of customs clearance under existing rules and regulations. The transit cargo movement during 2007 to 2013 had involved such to/from Uganda, Rwanda, Burundi, DR Congo and South Sudan and the greater part was consisted of Uganda cargoes in import and export in total (more than 70% out of the transit cargo). Figure 2.3.4 shows transit cargo flows in 2012 from/to Kenya to from surrounding countries including landlocked graphically.
Mombasa Port Master Plan including Dongo Kundu Final Report - October 2015
2. Basic Information Relevant to Logistics in Kenya
2-37
Table 2.3.2 Transit Cargo to/from Surrounding Countries from/to Mombasa Port in 2012
(To Surrounding Countries)
(Unit: ton)
Country Dry General
Dry Bulk POL Palm/Veg. &
Tallow Total
Container Non container
Rwanda 103,427 26,971 46,703 70,629 - 247,730
Burundi 1,433 147 36,136 930 270 38,916
South Sudan 433,286 28,547 28,808 245,625 - 736,266
DR. Congo 173,925 18,502 - 272,562 - 464,989
Somalia 5,595 740 10,023 - - 16,358
Tanzania 88,382 19,509 15,462 36,732 7,920 168,006
Total 2,484,161 352,064 1,276,446 1,855,211 232,802 6,200,683
(From Surrounding Countries) (Unit: ton)
Country Dry General
Dry Bulk POL Bunkers Total Container Non container
Rwanda 12,508 - - - - 12,508
Burundi 197 46 - - - 243
South Sudan 29,100 1,290 - - - 30,390
DR. Congo 17,119 250 - - - 17,368
Somalia 53 - - - - -53
Tanzania 17,332 831 - - - 18,163
Uganda 344,232 1,962 - - - 346,193
Others - 3 - - - 41
Total 420,578 4,382 - - - 424,960
Source: KPA Statistics 2013
East African Community (EAC) is composed of 5 countries (Kenya, Tanzania, Uganda, Rwanda, and Burundi). According to “Logistics Study in Southern and Eastern Africa” in 2014 by JETRO in Japan, EAC has little food import because of the major grain production area. Major imported goods in the area are oil products and capital goods. Kenya and Tanzania imported almost all the oil products (US$ 7,800 million in total) used in the area in 2011 and exported mostly to landlocked countries. A lot of capital goods were also imported by EAC including machinery and vehicle imports valued at US$ 6,200 million in 2011. This means that the manufacturing field in the area remains underdeveloped. The value of imported grains in the EAC was US$ 1,400 million in 2011 and the greater part was wheat and rice. Recently a flow of trade is moving into Asia and a commercial relationship with Asian countries has grown stronger. India and China are the main import origins for oil products and medicinal supplies and for machinery and electric products, respectively. In addition UAE as a free port is a transshipment hub on consumable imports for EAC. The scale of the commercial export in Kenya is quite large and its trade amount in the area is equivalent to 19.1 % of the total amount of trade in Kenya. This is equivalent to 8.1 % of the total amount of EAC and the largest in Africa. This is the reason why Kenya is a transshipment hub for logistics to/from landlocked and surrounding countries and a production base for consumable goods.
Mombasa Port Master Plan including Dongo Kundu Final Report - October 2015
2. Basic Information Relevant to Logistics in Kenya
2-38
Figure 2.3.4 Transit Cargo Flows in 2012 from/to Kenya to/from Surrounding Countries Source: KPA Statistics 2013
0 50 100 200km
KENYA SOMALIA
TANZANIA
BURUNDI
DRC
UGANDA
SUDAN ETHIOPIA
RWANDA
Mombasa
('000' Ton)
5,000
1,000
500
100
50
LEGEND
Nothern Coridor
Mombasa Port Master Plan including Dongo Kundu Final Report - October 2015
2. Basic Information Relevant to Logistics in Kenya
2-39
2.3.3 Liner services to/from Kenya
The liner services are summarized in Table 2.3.3.
The liner service to Kenya is concentrated at Mombasa Port for all the trade. There are two types of services among the shipping industry. One is long distance trade between Far East to Kenya/Mediterranean to Kenya and the other is feeder service along the East African coast by smaller sized vessels. 6 carriers, namely, Maersk, CMACGM, Evergreen, MSC, PIL and Messina Line, are providing fixed ay container services into Mombasa as ocean carrier. Liner services to/from Kenya are shown in Figure 2.3.5.
MSC is only carrier who operates at the East Africa coast looping Durban of South Africa, Nacala, Beira, Maputo of Mozambique from Mombasa Port in Kenya. PIL operates with different patterns such as covering the West and East Africa pendulum service. There are 70 vessels in the regular calling service within those 6 carriers at present but it is expected that some changes will be seen in 2015 in accordance with expansion of the cargo volumes and port enhancement by respective ports.
The size of the oceangoing ship is various, for example 1,900~2,700 TEU sized full container vessels (except feeder services at 1,500 TEU) or conventional general cargo services with own gears equipped including heavy lifts discharges are operating. Bulk carriers are mainly discharging wheat and clinker at the conventional berth.
Mombasa Port currently has restrictions on ship length and required water depth. At present a 3,500 TEU container ship is the largest size, Although a 4,500 TEU container ship may enter the service in the near future. Table 2.3.4 shows liner services by shipping companies.
Maersk Line is the largest shipping line as seen in the above table, having made 156 calls (or 29.4% of total calls) and handled 322,158 TEUs (or 36% of the total, which indicates they are using larger container ships).
Table 2.3.3 Summary of the Mombasa Calling Liner Services
Main Service Lines No. of Vessels
TEU Range Service Ports (Non African)
Far East Service
Maersk 7 2,496 Laem Chabang (Thailand), Tanjung Pelapas (Malaysia)
Grand Total 530 100.00 451,029 12,536 463,565 131,615 298,820 430,435 894,000 100.00
Note: Figures are including number of shifting (quay to quay) in import (full/empty) figures.
Shipping Company Calls (%) (%)
Mombasa Port Master Plan including Dongo Kundu Final Report - October 2015
2. Basic Information Relevant to Logistics in Kenya
2-41
2.3.4 Liner services to major East African ports
Major ports from the northern part of the East African coast (Mombasa, Dar es Salaam, Pemba, Nacala, Quelimane, Beira, Maputo and Durban of South Africa) are shown in Figure 2.3.6.
It depends on the carrier’s policy where main import cargoes from Far East are transshipped, such as Port Kelang, Singapore or Tanjung Pelepas. It is noted that those Asian hub ports are also key ports for Japan, Korea, Taiwan and Philippines for transshipment purpose.
There are other shipping sources from the main land China which calls directly to Mombasa Port and other ports in the African East Coast as well.
Cargo handling volumes at the three major East/South African ports are shown in Table 2.3.5.
Mombasa Port handled 21.85% of the total imports among the three ports in 2013 and 21.05% of total exports. Mombasa Port has kept the No.1 trade share in East African ports for a long term. No other large port is available at East Coast of Africa at present except Mombasa and Dar es Salaam for the ocean trade service, therefore carriers need to have feeder services either in-house or slot purchase bases.
The other East African ports are smaller or await expansion and thus are still unable to accept direct calling of larger sized vessels and cannot cope with regular container services as effectively as Mombasa Port.
Figure 2.3.6 Map of East Coast in Africa
Mombasa Port Master Plan including Dongo Kundu Final Report - October 2015
2. Basic Information Relevant to Logistics in Kenya
2-42
Table 2.3.5 Cargo Volumes in Major East/South African Ports
Source: Each Port Authority
There is another problem which must be addressed by Mombasa Port. At present, KPA needs to inspect the container contents for the transshipment from A port to B port in accordance with internal security regulations, which results in delays in moving out containers. Consequently, laden containers stay a long time at the transshipment terminal and miss the first transshipment opportunity.
For Mombasa Port to retain its Hub-Port status in East Africa, KPA needs to change its regulations on mandatory inspection of container contents (a practice not seen at most ports) to facilitate transshipment operations and also consider the introduction of modern and larger berths to accommodate larger vessels. Interviews with shipping companies revealed that delays in reaching their final destination are a major concern.
Container liner services to East African ports are shown in the following tables.
(Unit: TEU)
(Import) Year 2011 2012 2013 2013 Ratio
Mombasa 392,647 444,772 449,389 21.85%
Dar Es Salaam 221,728 266,345 282,139 13.72%
Durban 1,377,138 1,312,679 1,324,936 64.43%
Three Ports Total 1,991,513 2,023,796 2,056,464 100%
(Export) Year 2011 2012 2013
Mombasa 358,230 446,624 428,342 21.05%
Dar Es Salaam 221,728 240,840 270,913 13.32%
Durban 1,335,837 1,274,207 1,335,210 65.63%
Three Ports Total 1,915,795 1,961,671 2,034,465 100%
(G/Total TEUs) 3,907,308 3,985,467 4,090,929
Mombasa Port Master Plan including Dongo Kundu Final Report - October 2015
2. Basic Information Relevant to Logistics in Kenya
2-43
(1) Maersk Line
Table 2.3.6 Liner Services Provided by Maersk Line
Source: Maersk Line
(2) CMACGM Line
Table 2.3.7 Liner Services Provided by CMACGA
Source: CMACGM Line
Mombasa Port Master Plan including Dongo Kundu Final Report - October 2015
2. Basic Information Relevant to Logistics in Kenya
2-44
(3) MSC Line
Table 2.3.8 Liner Services Provided by MSC Line
Source: MSC Line
(4) Pacific International (PIL)
Table 2.3.9 Liner Services Provided by Pacific International
Source: PIL Line
Mombasa Port Master Plan including Dongo Kundu Final Report - October 2015
2. Basic Information Relevant to Logistics in Kenya
2-45
(5) Ever Green Line
Table 2.3.10 Liner Services Provided by Ever Green Line
Source: Ever Green Line
(6) Messina Line (RoRo & Container)
Table 2.3.11 Liner Services Provided by Messina Line
Source: Messina Line
Mombasa Port Master Plan including Dongo Kundu Final Report - October 2015
2. Basic Information Relevant to Logistics in Kenya
2-46
2.4 Current situation of domestic transport system in Kenya
2.4.1 Road
(1) Kenya road network
The Following is a citation from the web site of Kenya Roads Board;
The road network in Kenya at independence was 45,000km out of which only approximately 2000km were paved while the rest was mainly earth. In order to support the country's development objectives the country embarked on a program of upgrading roads to bitumen standards and improvement of rural roads to gravel standards. As a result, the paved road network was expanded from 2000 km in 1963 to 11,189 km in 2009.
In 2001, the Ministry of Roads, with financing from World Bank, engaged a Consultant to undertake a Road inventory and Condition Survey for the Classified Roads using Geographical Positioning Systems (RICS). The RICS study led to the establishment of a database for classified roads in a Geographical Information System. Unfortunately, the extent of the unclassified rural and urban roads remained unknown and was estimated to range from 80,000 to 130,00km making it difficult for effective maintenance and development planning.
In view of the above and in order to establish the extent of the existing road network and its condition, Kenya Roads Board, with funding from the Nordic Development Fund under the Northern Corridor Transport Improvement Project, in 2006, commissioned a Consultant to undertake a road inventory and condition survey for the hitherto unclassified road network. Based on the survey data collected, a Geographical Information Systems (GIS) database has been established at Kenya Roads Board.
Based on the RICS, the road network has been established to be 160,886km long comprising of 11,189km of paved roads and 149,689km of unpaved roads. There has been some improvement in the road network condition for the classified roads which is currently estimated at 17% good, 51% fair and 31% in poor condition. However, majority of the unclassified roads are in unmaintainable condition with only 5% good, 22% fair while 72% is in poor condition. Hence a large portion of the network is in either poor or failed condition and requires urgent rehabilitation to restore it to a maintainable condition. The government therefore, urgently needs additional funding to restore the network to a maintainable condition.
Table 2.4.1 CURRENT ROAD CLASSIFICATION
CLASS DESCRIPTION FUNCTION
A International Trunk Roads Link centers of international importance and cross international boundaries or terminate at international ports or airports (e.g. Mombasa,)
B National Trunk Roads Link nationally important centers (e.g. Provincial headquarters)
C Primary Roads Link provincially important centers to each other or to higher class roads (e.g. District headquarters)
D Secondary Roads Link locally important centers to each other, or to more important centers or to a higher class road (e.g. divisional headquarters)
Source; Kenya Road Board; http://www.krb.go.ke/road-conditions.html
Mombasa Port Master Plan including Dongo Kundu Final Report - October 2015
2. Basic Information Relevant to Logistics in Kenya
2-47
Table 2.4.2 SUMMARY OF CURRENT ROAD CLASSIFICATION IN KM
ROAD CLASS PAVED UNPAVED TOTAL
A 2,772 816 3,588
B 1,489 1,156 2,645
C 2,693 5,164 7,857
D 1,238 9,483 10,721
E 577 26,071 26,649
SPR 100 10,376 10,476
U 2,318 96,623 98,941
TOTAL 11,189 149,689 160,886
Source; Kenya Road Board; http://www.krb.go.ke/road-conditions.html
Figure 2.4.1 Road Network in Kenya
Mombasa Port Master Plan including Dongo Kundu Final Report - October 2015
2. Basic Information Relevant to Logistics in Kenya
2-48
(2) Corridor diagnostic study of the Northern and Central Corridors of East Africa
The following is an excerpt from the main report of Action Plan for the subject study:
The Northern Corridor, anchored by Mombasa Port in Kenya, and the Central Corridor, anchored by Dar-es-Salaam port in Tanzania are the principal transport routes for national, regional, and international trade of the five East African Community countries
Modernization of transport infrastructure and removal of nontariff barriers along these corridors are critical for trade expansion and economic growth as well as regional integration, the creation of wealth, and poverty alleviation in these countries.
The Heads of State in the Common Market for Eastern and Southern Africa (COMESA), the East African Community (EAC) and the Southern African Development Community (SADC), the Tripartite, have determined that the transport inefficiencies are among the biggest impediments to realizing their vision to lead their countries out of poverty. Transport costs are prohibitively high and are a barrier to trade and investment, which form the cornerstone for economic growth and regional prosperity.
Having had the experience of successful development of an action plan to eliminate transport bottlenecks on the North-South Corridor, the Tripartite has ordered the preparation of a similar action plan for the key trade routes of Eastern Africa. As a technical foundation for the action plan, regional stakeholders in March 2009 agreed to carry out a corridor diagnostic study (CDS) with funding from the U.S. Agency for International Development (USAID) and the U.K. Department for International Development (DFID). EAC sponsored by USAID and DFID appointed an American Firm to carry out the subject study.
Figure 2.4.2 Trans-African Highways Source; Corridor Diagnostic Study of the Northern and Central Corridors of East Africa
Mombasa Port Master Plan including Dongo Kundu Final Report - October 2015
2. Basic Information Relevant to Logistics in Kenya
2-49
2.4.2 Railway
The following is an excerpt from the web site of Kenya Railway Cooperation;
(1) Kenya Railway Cooperation
Kenya Railways is a State Corporation established under the Kenya Railways Corporation Act (Cap 397) of the Laws of Kenya. Vision, Mission and Mandate are show below;
Vision; To be the preferred provider of rail transport services
Mission; To provide a customer focused efficient and sustainable rail transport system
Our Mandate;
-Provide skills and technology for the railway sector -Provide efficient and effective railway services -Leverage our assets to grow business -Promotion, facilitation and participation in national and metropolitan railway network
development
(2) Railway Master Plan
Kenya Railways is committed to providing the country with reliable and efficient railway transport services. This will be achieved through the construction of the proposed Standard Gauge Railway line which is expected to be fully rolled out by the year 2050.
The Project will involve:
Construction of a Standard Gauge Railway line from Mombasa to Malaba with a branch line to Kisumu
Construction of the Standard Gauge Railway line for Northern Kenya region under the Lamu Port Southern Sudan Ethiopia transport corridor (LAPSSET) project
This will include a railway line from
Lamu to Isiolo to Nakdok onward to Juba in South Sudan Lamu to Isiolo to Wajir and onward to Addis Ababa in Ethiopia The two lines will branch to Nairobi at Archer’s Post in Isiolo
Progress:
The governments of Uganda, Rwanda and Kenya have signed an agreement for the construction of the Standard Gauge Railway line for the region.
The governments of South Sudan, Ethiopia and Kenya have signed a bilateral agreement for the construction of Standard Gauge Railway line under the LAPSSET project.
Construction on the Nairobi to Mombasa section has begun. Nairobi to Malaba and the branchline to Kisumu feasibility study is ongoing.
Feasibility study for the Lamu-Isiolo- Nakdok and Nairobi-Isiolo-Moyale sections is complete.
Government of Kenya has identified funds for the Mombasa to Nairobi section.
(3) Launch of LAPSSET Project
Kenya is on the starting line for the development of the Lamu – South Sudan – Ethiopia Transport (LAPPSET) corridor. The economic and transport corridor will open up vast parts of Kenya and stimulate economic and social development. The project will also create vital links with Ethiopia and South Sudan, thereby increasing trade and investment in our region.
The long distance Standard Gauge Railway (SGR) project under LAPPSET will comprise building a total of 3,250 kilometers of SGR within Kenya and connected to the region;
Lamu Isiolo Nakdok; 1,250 kilometers form the Great Equatorial Bridge to be extended to
Mombasa Port Master Plan including Dongo Kundu Final Report - October 2015
2. Basic Information Relevant to Logistics in Kenya
2-50
Juba in -Southern Sudan and to Douala in Cameroon Nairobi Isiolo Moyale; 700 kilometers to be extended to Addis Ababa Mombasa Malaba; 1,300 kilometers to be extended to Kampala with a branch line to Kisumu
The LAPSSET project is one of the largest transport and infrastructure projects in East Africa and was launched on 2nd March 2012 by Presidents Mwai Kibaki of Kenya, General Silva Kiir of Southern Sudan and Ethiopian Prime Minister Menes Zenawi. Part of the project involves the development of a modern high speed, high capacity standard gauge railway for passengers and freight within the proposed Lamu Corridor. The development will open up Northern Kenya for exploitation of stranded resources and will provide the landlocked Republic of Southern Sudan and Ethiopia with access to the sea.
(4) Standard Gauge Railway Project to Mombasa Port
Please refer to the Section 4.4.2.
(5) Rift Valley Railways (RVR)
The following is an excerpt from the web site of Rift Valley Railways;
As the region's oldest socio-economic binding asset, Rift Valley Railways currently operates a total of 2541.44 kilometers of track network linking the shores of the Indian Ocean to the agriculturally rich hinterland of the Kenya Highlands and into Kampala, Uganda on the shores of Lake Victoria in a 25-year concession agreement originally signed in 2006.
The Concession Agreement sealed between Kenya and Uganda governments commits the Concessionaire (RVR) to provide freight service for a period of 25 years, and passenger services, in Kenya only, for five years. Under this Agreement, both the Kenya and Uganda governments still own the railway
infrastructure and facilities while RVR operates trains and maintains the infrastructure.
The key objective of RVR is to improve the Management, Operation and Financial performance of the two railway networks in a coordinated manner.
The other objectives of the concession are to:-
Standardize infrastructure maintenance and operations Increase market share for the railways in freight traffic by providing reliable service to
customers Foster regional economic integration and growth Improve the competitiveness of the Northern Corridor and the port of Mombasa.
RVR is predominantly a freight transporting company with this segment constituting 95% of all volumes and revenue. The percentage ratio of the remaining is as shared by the commuter business (4%) and the passenger business (1 %.)
Our main customers in the freight business are categorized as Logistics Service Providers (42%), Cargo Owners (39% of total volumes moved) and Shipping Companies (19%) of total volumes moved. The company has put in mechanism to further improve its freight business. For instance, RVR posted a 21% increase in freight business (250,000 tons) in H1 of 2011/2012 over the same period in 2010/2011 (206,240 tons).
Figure 2.4.3 Route Map of RVR
Mombasa Port Master Plan including Dongo Kundu Final Report - October 2015
2. Basic Information Relevant to Logistics in Kenya
2-51
RVR Freight Services is your flexible partner for overland transport by rail. We run freight trains or goods trains on a regular schedule to various destinations in Kenya and Uganda.
The movement involves groups of freight cars or goods wagons hauled by locomotives on railway lines, ultimately transporting cargo between two points as part of the logistics chain. The trains haul bulk material, intermodal containers, general freight or specialized freight in purpose-designed cars. These include flat wagons for containerized cargo, covered wagons for conventional cargo, Tallow Tank Bogies for Vegetable Oil, White/Black Tanks for white and black oils respectively.
Mombasa Port Master Plan including Dongo Kundu Final Report - October 2015
2. Basic Information Relevant to Logistics in Kenya
2-52
2.4.3 Air
The followings are excerpts from web site of Kenya Airport Authority, Civil Aviation Authority and ICAO;
(1) Air transportation system
Most airports in Kenya are used for domestic flights. The largest airport is Jomo Kenyatta International Airport (NBO) located in Nairobi (the capital of Kenya). The second largest is Moi International Airport (MBA) located in Mombasa.
Airports in Kenya are managed by three authorities, the Ministry of Transport and Infrastructure (MOTI), Kenya Airports Authority (KAA) and Kenya Civil Aviation Authority (KCAA).
In Kenya, there are 4 international airports, 7 local airports and 150 airstrips. Majors are shown in the next map and table.
Figure 2.4.4 Major Airport Locations in Kenya
(2) Kenya Airports Authority (KAA)
-Mandate
The Kenya Airports Authority (KAA), established in 1991 under KAA Act, Chapter 395 of the Laws
Mombasa Port Master Plan including Dongo Kundu Final Report - October 2015
2. Basic Information Relevant to Logistics in Kenya
2-53
of Kenya, provides facilitative infrastructure for aviation services between Kenya and the outside world. Its main functions are;
Administer, control and manage aerodromes, Provide and maintain facilities necessary for efficient operations of aircrafts Provide rescue and firefighting equipment and services Construct, operate and maintain aerodromes and other related activities Construct or maintain aerodromes on an agency basis on the request of any Government
Department Provide such other amenities or facilities for passengers and other persons making use of the
services or facilities provided by the Authority as may appear to the Board necessary or desirable
Approve the establishment of private airstrips and control of operations thereof
The main airports we manage are in the table below.
Table 2.4.3 Major Airports in Kenya
International Airports Domestic Airports Airstrips
Jomo Kenyatta International Airport Wilson Airport Ukunda Airstrip
Moi International Airport Malindi Airport Manda Airst
Eldoret International Airport Lokichoggio Airport
Kisumu Airport Wajir Airport
(3) Kenya Civil Aviation Authority (KCAA)
Kenya Civil Aviation Authority (KCAA) was established on 24th October 2002 by the Civil Aviation (Amendment) Act, 2002 with the primary functions towards; Regulation and oversight of Aviation Safety & Security; Economic regulation of Air Services and development of Civil Aviation; Provision of Air Navigation Services, and Training of Aviation personnel KCAA; as guided by the provisions of the convention on international civil aviation, related ICAO Standards and Recommended Practices (SARPs), the Kenya Civil Aviation Act, 2013 and the civil aviation regulations.
Mandate
To plan, develop, manage, regulate and operate a safe, economically sustainable and efficient civil aviation system in Kenya, in accordance with the provisions of the Civil Aviation Act, 2013.
Vision
To be a model of excellence in civil aviation
Mission
To develop, regulate and manage a safe, efficient and effective civil aviation system in Kenya.
Core Values
Commitment to Safety and Security: We endeavor to maintain a safe and secure environment in all areas of our operations and entire civil aviation industry within our jurisdiction.
Strategic Achievements
Achieved an effective and sustainable safety and security oversight system. Developed an effective and sustainable air transport system and established a modern
CNS/ATM Systems. Ensured safe, orderly and expeditious flow of air traffic. Attracted and retain competent, motivated and performance driven human capital.
Mombasa Port Master Plan including Dongo Kundu Final Report - October 2015
2. Basic Information Relevant to Logistics in Kenya
2-54
Became a financially sustainable Authority by ensuring collection and appropriate usage of revenue.
Enhanced Customer Service through publication of KCAA Corporate Service Charter. Established an international aviation training center of excellence by revamping the facilities
and capacity at the East African School of Aviation by acquisition of training simulators and achieving ICAO trainer plus status.
Became ISO certified to ensure quality service provision.
The Establishment of a vibrant and highly competitive civil aviation industry is critical for the development of any country. In recognition of the foregoing role, KCAA encourages investments from both domestic and international air operators. In so doing, KCAA is fully implementing Vision 2030 which aims to make Kenya a middle income country by the year 2030.
(4) Nairobi - Jomo Kenyatta International Airport
Jomo Kenyatta International Airport (JKIA) is the biggest Airport in East and Central Africa, and is the focal point for major aviation activity in the region. Its importance as an aviation center makes it the pacesetter for other airports in the region. JKIA, located 18 kilometers to the East of Nairobi, is served by 49 scheduled airlines. JKIA has direct flight connections to Europe, the Middle East, Far East and the African Continent.
Express Airways, Air India, Air Madagascar, Air Malawi, Air Mauritius, Air Zimbabwe, Astral Aviation, British Airways, Brussels Airlines, Daallo Airlines, East African Safari Air, Egyptair, Emirates, Ethiopian Airlines, Jet Link, KLM, Kenya Airways, Precision Air, Qatar Airways Cargo, Rwandair Express, SWISS, Saudi Arabian Airlines, Sudan Airways, Virgin Atlantic Airways
Cargo Facilities:
Capacity 250 000tonnes (551 150,000lbs), Warehouse 12 351m² (132 945sq ft), Bonded Warehouse, Transit Zone, EU Border Post, Aircraft Maintenance, Mechanical Handling, Air-Conditioned Storage, Refrigerated Storage, Deep Freeze Storage, Animal Quarantine, Fresh Meat Inspection, Livestock Handling, Health Officials, X-Ray Equipment, Decompression Chamber, Security for Valuables, Dangerous Goods, Radioactive Goods, Very Large/Heavy Cargo, Express/Courier Centre, 401m² Animal holding compound, Fresh produce export zone. 1000m² dedicated to perishables inspection and re-packing area, Cargo Handling Agents:African Cargo Handling Ltd, Cargo Service Center East Africa BV, Kenya Airfreight Handling Ltd
Mombasa Port Master Plan including Dongo Kundu Final Report - October 2015
2. Basic Information Relevant to Logistics in Kenya
2-55
Passenger Facilities:
Annual Capacity 2 500 000, 30 check-in desks, 13 gates, 8 air bridges, 4 baggage claim belts, 900 short term parking spaces, 100 long term parking spaces, 2 Airport Hotels, Min. Connection Times Intl-Intl: 60mins, Dom-Intl: 60mins, Post Office, Bank, Bureau de Change, Auto Exchange Machine, Restaurants, Cafeterias, Bars, VIP Lounge, Duty Free Shop, Newsagent/Tobacconist, Chemist Shop, Gift Shop, Travel Agent, Tourist Help Desk, Car Rental, Taxi Service/Rank, First Aid, Baby/Parent Room, Disabled Access/Facilities, Business Centre
Additional Information:
The airport is currently under major rehabilitation for a new terminal in line with our plan to turn Jomo Kenyatta into a hub center within Africa.
Second Runway;
A new instrument landing system-equipped runway 5,500 meters (18,000 ft.) in length has been approved for construction at a cost of 12.8 billion Kenyan shillings (US$146.5 million). An airport official has stated that the second runway will allow for continuous airport operations should an aircraft incident render the existing runway unusable. The runway also will enable direct long haul flights to destinations such as New York City, carrying up to 32 tones. Construction is scheduled to begin in January 2016 and be completed in December 2017.
Figure 2.4.5 Airport Facilities and International Network
Table 2.4.4 Traffic of Jomo Kenyatta International Airport
Mombasa Port Master Plan including Dongo Kundu Final Report - October 2015
2. Basic Information Relevant to Logistics in Kenya
2-56
Figure 2.4.6 Jomo Kenyatta International Terminal
(5) Mombasa - Moi International Airport
Moi International Airport serves the city of Mombasa and surrounding communities. It lies approximately 425 kilometers (264 mi), by air, southeast of Jomo Kenyatta International Airport, the largest and busiest airport in the country. Mombasa Airport is operated by Kenya Airports Authority. It was named after former Kenyan President Danielarap Moi during his tenure.
Moi International Airport handles tremendous traffic with more than eighteen airlines flying directly from and to Europe, and offering connections to over twenty cities in the region. Mombasa region has remained attractive to tourist and it has eventually required that the airport be developed to handle long haul international flights.
At 61 meters (200 ft) above sea level, the airport has two runways: Runway 1 measures 3,350 meters (10,990 ft) in length and Runway 2 measures 1,260 meters (4,130 ft) in length.[3] Runway 1 is also known as Runway 03/21, while Runway 2 is also known as Runway 15/33. Runway 1 is equipped with an ILS (Instrument Landing System).
Annual Capacity 901 194, 19 check-in desks, 4 gates, 3 air bridges, 6 short term parking spaces, 4 long term parking spaces, 4 Airport Hotels, Min. Connection Times Intl-Intl: 10mins, Dom-Intl: 15mins, Dom-Dom: 10mins, Post Office, Bank, Bureau de Change, Restaurants, Cafeterias, Bars, VIP Lounge, Duty Free Shop, Gift Shop, Travel Agent, Car Rental, Taxi Service/Rank, First Aid, Disabled Access/Facilities, Business Centre
Additional Information:
The airport is 12km from the railway station. Terminals I and II have 10 aircraft stands. Terminal III (General Aviation) has 22 stands.
This airport was built during the Second World War by the Engineer Corps of the South African Army. During that war it was used by the Fleet Air Arm as a land base of the British Eastern Fleet which was based at nearby Kilindini Harbor from 1942, by the Royal Air Force (RAF) which operated anti-submarine Catalina flying boats off the East Africa coast and by the South African Air Force which was engaged in the war against Italy in Abyssinia. It was originally known as Port Reitz Airport.
Mombasa Airport was expanded to an international airport in 1979. Aircraft Maintenance facilities for private and light- to medium-size commercial aircraft are provided from government and private hangars by Benair Aircraft Engineering, licensed by the Kenya Civil Aviation Authority (KCAA) as an approved maintenance organization (AMO).
From July to September 1994, Moi International Airport was used almost continuously as a refueling station during the Operation Support Hope humanitarian mission into Rwanda. Empty C-141 and C-5 freighter jets returning to Europe flew to Mombasa due to the scarcity of fuel in the African interior. The airlift through Mombasa was ceased by October due to runway expansion work financed by Japanese ODA loan. The project including runway/taxiway expansion and terminal building expansion was completed in October 1996.
Table 2.4.5 Traffic of Moi International Airport
Mombasa Port Master Plan including Dongo Kundu Final Report - October 2015
2. Basic Information Relevant to Logistics in Kenya
2-58
Figure 2.4.7 Moi International Airport and Costal Line Nearby
The aerial restriction area of runway for small air crafts covers the future port area of Port Riz. The height of ships and cranes should be carefully examined.
(6) Other Airports
Eldoret International Airport
The airport is located some 16 kilometers south from Eldoret Town on the Eldoret-Kisumu road. The airport is open from Monday to Sunday from 0330hours to 1730hours GMT, but the hours can be extended on request. Currently the airport has three scheduled international cargo flights and several ad hoc freighters per week.
Wilson Airport
Wilson Airport is located 5 kilometers south of Nairobi. Wilson Airport is mainly used for domestic flights with light aircrafts. It is used for cargo transport and to fly passengers to popular tourist attractions in Kenya. Wilson Airport also has flights to Tanzania, Somalia and the Democratic Republic of Kongo.
Malindi Airport
Malindi Airport is 2.5 Km west of Malindi Town. It is by the Mombasa road on it's southern side, where the access road is connected. Eastwards the suburbs of Malindi are developing in the proximity of the Airport boundary. In particular two schools are located along the Eastern boundary fence. Westwards some land is used for a coconut plantation.
Figure 2.4.8 Aerial Restriction of Airport.
Mombasa Port Master Plan including Dongo Kundu Final Report - October 2015
2. Basic Information Relevant to Logistics in Kenya
2-59
According to Kenya Airports Authority (KAA) Malindi International Airport has an annual passenger handling capacity of 300,000 passengers. Plans are underway to extend the runway from 1.4 km to 2.9 km and to increase the size of the apron to accommodate more aircraft.
Kisumu Airport
Kisumu is the the most Westernly city in Kenya Located on the shores of Lake Victoria, The largest fresh water lake in Africa. It is a center of trade between the East African countries due to its proximity to their borders. The airport is located to the North West of Kisumu town. The site is bordered on the Western and the Southern sides by Lake Victoria and on the Eastern and Northern sides by the main road to Uganda. It has two terminals and a 3.3 kilometers runway.
Wajir Airport
The Airport is located about 5km West of Wajir town. The Airport which opens daily operations at 0630hours and closes at 1830 hours is open to propeller aircraft at its current state due to loose chips on the runways, taxiways and apron, and its restricted to jet engined aircraft for safety purposes. .
Lokichoggio Airport
Lokichoggio airport is located 370 nautical miles North West of Nairobi and 214 Km North West of Lodwar Town, 24 Km to border of South Sudan. The Government took over the running of this Airport in 1999 and this saw the deployment of officers from key Government departments and the Kenya Airports Authority to spearhead the core functions of the airport.
Ukunda Airstrip
Ukunda Airsterip is a feeder Airstrip that deals mostly with tourists from south coast hotels taking them to and from national parks, lodges, airports and privately owned Airstrip. The main air operators are the charter companies on scheduled chartered basis, depending on tourism season. Their clients are mostly tourist who would like to go on air safaris to the national parks, lodges and other airports.
Manda Airstrip
Manda airstrip is situated on Manda Island in the Lamu Archipelago. The airstrip was established between 1962 and 1963 as landing strip for the colonial administrators.
(7) JICA support for airport development in Kenya
a) Jomo Kenyatta International Airport (JKIA) Expansion Projects
Package 1 – Construction of the terminal T1A passenger apron, the taxiways and associated civil and electrical works which was completed in April 2008.
Package 2 – Construction of terminal T1A, the multi-storey car park and the grade parking which was completed in 2014.
Package 3a – Construction of Arrivals Hall in T1A to increase capacity to handle arriving passengers, and scheduled for completion by April 2015.
Package 3b – Renovation and re-organization of terminal T1B, T1C, T1D and arrivals building including construction of new infill building to commence in August 2015 and be completed in June 2018.
Package 4a – Rehabilitation and upgrading of aircraft pavements and upgrading of ILS system from CAT I to II to increase capacity to runway and to improve on safety of operation on the runway, construction to commence in March 2015 and be completed in October 2016.
Package 4b – Construction of 16 no. CAT C remote stands including fuel hydrant to increase capacity for parking of aircraft, construction which is due for completion early 2015.
Package 5 – Construction of the New Domestic Terminal T2, which is due for completion in December 2014.
Mombasa Port Master Plan including Dongo Kundu Final Report - October 2015
2. Basic Information Relevant to Logistics in Kenya
2-60
Package 6 – Construction of the New Green Field Terminal Complex and Associated Facilities – construction having commenced in December 2013 and scheduled for completion in 2018.
b) Kisunu Airport Expansion
Kisumu Airport Expansion Phase 1
Kisumu Airport is being upgraded to an international airport. The upgrading works in progress include: runway reconstruction, runway extension by 300 Meters to accommodate bigger planes, a new terminal building and relocation of Uyoma Primary School to create room for new works. Funding is from GOK. Works completed in March 2012.
Kisumu Airport Expansion Phase 2
Kisumu Airport phase 2 includes structural strengthening of the full runway, new taxiway, cargo apron and extensive landscaping. Funding is from GOK. Works due for completion in 2015.
c) Airstrips rehabilitation
Our vision is to provide aviation facilities evenly all over the country by way of developing and maintaining at least one airstrip within each county. Rehabilitation works are ongoing at Nyeri (Nyaribo), Embu, Kitale, Kakamega, Isiolo and Lodwar airstrips. We intend to complete works at these airstrips within this financial year. Funding is from GOK.
d) JKIA commuter rail service
The government intends to introduce commuter train services in Nairobi in its efforts to ease congestion in the city. The proposed project will link the city with places such as Jomo Kenyatta International Airport (JKIA) through Syokimau. The 2.2 Km spur line from Embakasi intermodal railway station to Syokimau is already complete and operational.
KR and RVR jointly rehabilitated old locomotives and coaches previously in disuse which kicked off the JKIA Interim Service.
e) KCAA CAT I status – Institutional strengthening
For Kenya Civil Aviation Authority (KCAA) to achieve Federal Aviation Administration’s International Aviation Safety Assessment (IASA) Category 1, they were required to recruit and retain qualified and experienced Flight Safety Inspectors.
Through technical support, Foreign Inspectors were brought on board as a temporary stop gap vides the Sofreavia / Egisavia contract which ended in January 2010. During the period, KCAA recruited local experts some of who have since left due to low remuneration. The only option is institutional strengthening (Flight Safety Oversight) of KCAA through the following:
A new organizational structure Enhanced grading and salary structure Separation of their Regulatory Functions from Service Provision
This process of institutional strengthening is ongoing.
f) KCAA improvement of CNS aids from CAT I to CAT II status
The Kenya Civil Aviation Authority (KCAA) is also investing in new and modern Communication, Navigation and Surveillance Aids. This will enhance management of our airspace and also make it easier for pilots to see, identify and interact in the sky.
Coupled together with airspace aids, we are also improving the Instrument Landing Systems from Category I to the higher Category II by replacing/installing the following:
New approach lights Runway Centre Line Lights , Runway Touch Down Zone Lights ,
Mombasa Port Master Plan including Dongo Kundu Final Report - October 2015
2. Basic Information Relevant to Logistics in Kenya
2-61
Runway Threshold/End Lights and Wing Bar Lights, Taxiway Edge Lights and Centre line lights ATC Centre System, Recorders, Voice Control System, VOR/DME, Digital ATIS, Radar –
Mombasa Port Master Plan including Dongo Kundu Final Report - October 2015
3. Existing Port Plans and Relevant Information
3-1
3. Existing Port Plans and Relevant Information
3.1 National Development Plan and other plans in the related Sectors
3.1.1 Kenya Vision 2030
Kenya Vision 2030 is the country’s new development blueprint covering the period 2008 to 2030. It aims to transform Kenya into a newly industrializing, “middle-income country providing a high quality life to all its citizens by the year 2030”. The Vision is based on three “pillars”: the economic, the social and the political. The economic pillar aims to improve the prosperity of all Kenyans trough an economic development program, covering all the regions of Kenya, and aiming to achieve an average Gross Domestic Product (GDP) growth rate of 10% per annum beginning in 2012. The social pillar seeks to build a just and cohesive society with social equity in a clean and secure environment. The political pillar aims to realize a democratic political system founded on issue-based politics that respects the rule of law, and protects the rights and freedoms of every individual in Kenyan society.
The Kenya Vision 2030 is to be implemented in successive five-year Medium-Term Plans, with the first such plan covering the period 2008-2012. For that reason, the reader will find frequent references to projects and programs scheduled for implementation between 2008 and 2012. While the “flagship” projects are expected to take the lead in generating rapid and widely-shared growth, they are by no means the only projects the country will be implementing. At an appropriate stage, another five-year plan will be produced covering the period 2012 to 2017, and so on till 2030.
The economic, social and political pillars of Kenya Vision 2030 are anchored on macroeconomic stability; continuity in governance reforms; enhanced equity and wealth creation opportunities for the poor; infrastructure; energy; science; technology and innovation (STI); land reform; human resources development; security as well as public sector reforms. Regarding infrastructure, the 2030 Vision aspires for a country firmly interconnected through a network of roads, railway, ports, airports, water and sanitation facilities, and telecommunications. By 2030, it will become impossible to refer to any region of our as “remote”. Furthermore, to ensure that the main projects under the economic pillar are implemented, investment in the nation’s infrastructure will be given the highest priority. Development projects recommended under Vision 2030 will increase demand on Kenya’s energy supply. Currently, Kenya’s energy costs are higher than those of her competitors. Kenya must, therefore, generate more energy at a lower cost and increase efficiency in energy consumption. The Government is committed to continued institutional reforms in the energy sector, including a strong regulatory framework, encouraging more private generators of power, and separating generation from distribution. New sources of energy will be found through exploitation of geothermal power, coal, renewable energy sources, and connecting Kenya to energy-surplus countries in the region.
Regarding the economic vision and strategy, the six key sectors described below have been given priority in acting as key growth drivers in the journey to 2030. Flagship projects for these sectors are:
a) Tourism
3 resort cities: two new resorts cities at the coast (one in north and the other at south coast). The third one will be located in Isiolo.
Better marketing of little-visited parks so as to bring more tourists to game parks that have not been receiving many visitors, and which are located in all parts of the country.
The premium parks initiative: this will provide more high-end tourists with a unique experience in popular destinations, such as Maasai Mara and Nakuru.
The under-utilized parks initiative: this aims to upgrade the standards of attractive but seldom visited e.g. Ruma and Marsabit.
The niche products initiative: this will provide 3,000 beds in high cost accommodation for tourists interested in cultural and eco-tourism, as well as in water-based sports and related
Mombasa Port Master Plan including Dongo Kundu Final Report - October 2015
3. Existing Port Plans and Relevant Information
3-2
activities. It will initially target four key sites in Western Kenya. The certification of 1,000 home-stay sites to promote cultural tourism in Kenyan homes. The business visitors’ initiative: this will attract five additional international hotels to
Nairobi, Mombasa and Kisumu, and also leverage Isiolo as a new high-end tourist destination.
b) Agriculture
Preparation and passage of consolidated agricultural policy reform legislation. Development and implementation of a 3-tiered fertilizer cost reduction program. Improving the value gained in the production and supply chain through branding Kenyan
farm products. The planning and implementation of 4-5 Disease Free Zones and livestock processing
facilities to enable Kenyan meat, hides and skins to meet international marketing standards. There will be more domestic processing of these products for regional and international markets.
The creation of publicity accessible land registries, under an improved governance framework.
Development of an Agriculture Land Use Master Plan. Tana River Basin Agriculture development Scheme.
c) Wholesale and retail trade sector
Creation of at least 10 wholesale hubs and 1,000~1,500 Producer Business Group (starting with a pilot project in Maragua, Central Province, that is to be extended to other regions).
Building of at least 10 ‘Tier 1’ retail markets (starting with a pilot project in Athi River). The building of one free trade port at the coast in order to “bring Dubai to Kenya”. This
port will serve eastern and central Africa.
d) Manufacturing
The development of a strategy for the establishment of at least 2 special “economic clusters”, that is, related industries located together to gain from economies.
The development and creation of at least 5 Small and Medium Enterprise (SME) Industrial Parks.
e) Business process offshoring
The flagship BPO project for 2012 is to design and establish one major BPO park in Nairobi (possibly in Athi River) that will have world class infrastructure developed by top international IT suppliers. Kenya will offer competitive incentive packages for companies to locate in the park, provide a-one-stop shop for administration and talent and serve as a “show-case’” park to attract more top foreign IT companies.
f) Financial services
Facilitate the transformation of the banking sector to bring in fewer stronger, larger scale banks.
Develop and execute a comprehensive model for pension reform. Pursue a comprehensive remittances strategy. Formulate a policy for the issuing of benchmark sovereign bonds. Implement legal and institutional reforms required for a regional financial center.
3.1.2 First Medium Term Plan (2008-2012)
The First Medium Term Plan (MTP) of Vision 2030 identifies key policy actions, reforms, programs and projects that the Government will implement in the 2008-2012 period. It is the foundation for the first phase of implementing Kenya Vision 2030, Kenya’s new, long term policy blueprint. The overall objective is to realize a higher and sustainable growth of the economy in a more equitable environment,
Mombasa Port Master Plan including Dongo Kundu Final Report - October 2015
3. Existing Port Plans and Relevant Information
3-3
accompanied by increased employment opportunities. The MTP incorporates the activities identified in the report of “the National Accord Implementation Committee on National Reconciliation and Emergency Social and Economic Recovery and Country’s One-Year Economic and Social Recovery Plan”, all of which target a quick economic and social recovery, following the destructive aftermath of the December 2007 general elections.
a) Economic growth target
The MTP aims at increasing real GDP growth from an estimated 7 per cent in 2007 to 7.9~8.7 per cent by the years 2009-2010; and to 10 per cent by 2012. Over the next five years, savings and investment levels are targeted to increase at a high rate in order to support the high economic growth and employment creation envisaged under the Plan.
b) Tourism
The overall strategy for the tourism sector is to treble national earnings by increasing international arrivals from 1.6 million to 3 million, while also increasing the average spending per visitor from Kshs. 40,000 to 70,000. In this regard, three tourist resort cities will be established in the next five years: one in Isiolo and two at the coast to entrance bed capacity and improve the standards of tourist accommodation and facilities.
c) Agriculture
Agriculture contributes directly to over a quarter of the GDP and provides a source of livelihood to the majority of Kenyans. It is expected to grow at a pace of about 6-8 per cent as a result of various measures to be implemented under the MTP, including a reduction in the cost of farm inputs such as fertilizer; improving farm prices; providing higher value addition; improved marketing and the implementation of policies to revitalize the sector, while increasing overall agricultural productivity.
d) Manufacturing, wholesale and trade
The sector is targeted to increase from the current 5 per cent to 10-12 per cent by 2012. To meet this target, two Special Economic Clusters will be set up in Mombasa and in Kisumu for manufacturing establishments. Additionally, at least five Small and Medium Enterprises (SMEs), industrial Parks and Specialized Economic Zones will be set up.
e) Financial Services
In order to implement the Flagship Project in the six economic sectors falling under the Economic pillar of Plan, an estimated Kshs. 500 billion will need to be invested. The government will invest Kshs. 250 billion in the next five years to ensure the implementation of these projects, with the remaining half expected to be financed by both local and foreign private investors, and many through PPP arrangements. The Financial Services sector is thus expected to play a key role in mobilizing the savings and investments required to implement the Medium Term Plan.
f) Physical Infrastructure
The development of high quality national physical infrastructure is a critical foundation for this Medium Term Plan. The strategies and measures to be pursued in the medium term period include the strengthening of the institutional framework for infrastructure development; raising the efficiency and quality of infrastructure as well as increasing the pace of implementation of infrastructure projects so that they are completed within the specified time frames. A National Spatial Plan to optimize the development and utilization of infrastructure facilities and services will therefore be developed. The operationalization of the PPP policy will also be expedited to facilitate private sector participation in infrastructure facilities and services strategically complemented by public sector interventions.
The five-year target is to have 64,500 km of well-maintained and motor roads with a total of Kshs. 186 billion spent on road construction and upgrade during the 2008-2012 period. Over the same period, the government will concession many toll roads to be built by the private sector. A new transport corridor
Mombasa Port Master Plan including Dongo Kundu Final Report - October 2015
3. Existing Port Plans and Relevant Information
3-4
linking Ethiopia, Southern Sudan and Somalia to a second port to be constructed at Lamu will be developed and implemented through Build, Own, Operate and Transfer (BOT) arrangements at a cost of USD 15-20 billion while a free port at Dongo Kundu in Mombasa will also be developed. The other major transport infrastructure projects will be the development of a rapid bus and light rail system in the Nairobi Metropolitan area, which is expected to serve as a prototype for the other main urban areas in the country.
g) Energy
An Energy Access Scale-up Program will be implemented through which a million households will be connected with energy in the next five years at a cost of Kshs. 84 billion. A major project to connect Kenya to the Southern Africa power pool through Tanzania at a cost of USD 110 million will also be implemented in two years, while other projects in the power sector will include geothermal, solar and wind power.
3.1.3 Second Medium Term Plan (MTP2) (2013-2017)
The Second Medium Term Plan (MTP) of Vision 2030 identifies key policy actions, reforms, programs and projects that the Government will implement in the 2013-2017 period in line with its priorities, the Kenya 2010 constitution and the long-term objective of Vision 2030. Accordingly, the theme of this MTP is “Transforming Kenya: Pathway to Devolution, Socio-Economic Development, Equity and National Unity”. The second MTP also aims to build on the successes of the first MTP (2008-2012), particularly in increasing the scale and pace of economic and social pillars of Vision 2030. Under this MTP, transformation of the economy is pegged on rapid economic growth on a stable macro-economic environment, modernization of infrastructure, diversification and commercialization of agriculture, food security, a higher contribution of manufacturing to GDP, wider access to African and global markets, wider access for Kenyan to better quality education and health care, job creation targeting unemployed youth, provision of better housing and provision of improved water sources and sanitation to Kenyan households that presently lack these. The overall aim of the plan is that by 2018 Kenyan families will have experienced a positive transformation in their earnings and quality of their livelihoods, and Kenya will be a more united, more prosperous society commanding respect in African and the world.
In the initial year of the first MTP, a number of projects aimed at national healing and reconciliation following the post-election violence were implemented. Repair of damaged infrastructure; assistance to affected small-scale businesses; and resettlement of IDPs were all undertaken in order to raise GDP growth (which fell to 1.5 per cent in 2008) and to promote national reconciliation. Up to the year 2012, progress achieved under the first MTP included the following:
Enrollment in early childhood education increased by 40% from 1.72 million in 2008 to 2.4 million,
Transition rate from primary to secondary education increased from 64% in 2008 to 77%, The number of students enrolled in university education increased by 103% from 118,239
in 2008 to 240,551, A total of 2,200 km of roads were constructed exceeding the MTP target of 1,500 km, Three undersea submarine fiber optic networks linking Kenya to the global internet
networks were completed including 5,500 km of terrestrial fiber optic network, Total installed capacity for generation of electricity increased by 22 %, and The Constitution of Kenya (2010) was enacted.
Despite the achievements made during the first MTP Kenya still faces significant development challenges which need to be addressed during the second MTP. These include:
Low domestic savings and investments: Kenya’s saving rate was 13 per cent of GDP during the last MTP period, just half of the average for low income countries, and less than the 17 per cent of sub Saharan Africa average,
Mombasa Port Master Plan including Dongo Kundu Final Report - October 2015
3. Existing Port Plans and Relevant Information
3-5
Low-per capita income growth: Real per-capita income grew by 7.8 % in the last 5 years, High levels of unemployment and poverty: The last published rate of unemployment by the
Kenya National Bureau of Statistics is 12.7per cent based on the 2005/6 Kenya Integrated Household Budget Survey. Recent estimates by non-Bureau sources puts the youth unemployment rate at 25 per cent which suggest almost doubling of the unemployment over the last 8 years,
High energy costs: 21 US cents per Kwh compared to approximately 6 US cents per Kwh in India and China,
High costs of finance: high bank lending rates and wide interest rates spread, Inefficiencies in rail and port operations, inhibiting regulations and procedures to business
and investors, Major economic and social disparities across regions of the country, A rapid population growth rate, proliferation of informal settlements, governance problems
and insecurity, High dependence of the country on rail-fed agriculture and low agricultural productivity,
remain problems in the sector which employs more Kenyan than any other, Slow structural transformation exemplified by low and declining share of manufacturing to
GDP and low share of export to GDP, Narrow range of exports and the slow growth in their value compared to the growth of
imports, Upsurge in non-communicable diseases across the country and global pandemics, Cyber-crime, and Threats emanating from climate change.
The key priority areas that Government will implement over the second MTP period are described below.
(1) Macroeconomic framework
Macro-economic stability will continue to be a key objective in national economic management. The second MTP aims at sustained growth in agriculture, manufacturing, and service sectors in order to achieve an overall GDP growth rate of 10 per cent by 2017. To sustain and increase the growth momentum inherited from the first MTP, this plan aims to increase local savings and foreign direct investment in all the sectors. The second MTP also aims at an enhanced regional and international trade strategy to grow and diversify exports, in order to improve balance of payments position and ensure exchange rate stability.
(2) Foundations of the economy and society
The second MTP will sustain and expand physical infrastructure to ensure that it can support a rapidly-growing economy, the demands imposed on it by higher rural and urban incomes, and by new economic activities. A national spatial plan and country specific spatial plans will be developed in order to rationalize utilization of space for economic and social development. In addition, air transport facilities will be expanded within the country, and Kenya will strengthen its position as the air transport hub in the region. Priority will also be given to improving the efficiency of ports, and the implementation of the single window clearance system. With the construction of the standard gauge railway line from Mombasa to Malaba, rail transport will be expected to handle 50 per cent of the freight cargo throughput, thus easing the pressure on roads, lowering the cost of doing business, and enhancing trade and regional integration in Eastern Africa. The new Lamu port and the LAPSSET corridor will be implemented as part of upgrading the national transport framework in collaboration with other countries in Eastern Africa. To relieve congestion in main urban areas, planned mass rapid transit systems will be constructed. Expansion of roads will be continued, aiming at achieving a road network with 75-80 per cent of the classified roads in good condition and construction or rehabilitation of 5,500 km of roads.
With regard to energy, a strategy in place for modernizing the energy infrastructure network, increasing the share of energy generated from renewable energy sources, and providing energy that is
Mombasa Port Master Plan including Dongo Kundu Final Report - October 2015
3. Existing Port Plans and Relevant Information
3-6
affordable and reliable to businesses and homes. This will ensure that energy supply is adequate and efficient in order to support increased use in manufacturing, agriculture, services, public facilities and households. The plan aims at increasing installed capacity for electricity generation by 5,538 MW in 2017.
(3) Economic pillar
The economic pillar in the second MTP consists of six priority sectors. The overall strategy for the tourism sector is to turn the country into a top 10 long haul tourist destination in the world. This will be achieved through growth and diversification of tourist sources from the traditional areas (i.e. Western Europe and North America), and from non-traditional sources in the Middle East and East Asia. The sector will also market new high-end tourist segments like business, cultural and ecological tourism. Tourist arrivals are expected to double from an average of 1.5 million in recent years, to 3 million each year by the end of the plan period. Construction of two coastal resort cities and three upcountry tourist resort cities in Isiolo, Lamu and Lake Turkana will be initiated, and measures to increase bed capacity, to open more five-star hotels, and improve the standards of tourist accommodation and facilities will be taken.
(4) Agriculture and livestock
The second MTP will give top priority to increasing acreage under irrigation in order to reduce the country’s dependence on rain fed agriculture. A total of 404,800 hectares will be put under irrigation during the plan period. Measures will be taken to mechanize agricultural production, revive cooperatives and farmers unions, and subsidize farm inputs to raise productivity.
The foreign policy will aim at increasing international trade and international economic partnerships. This policy will encourage Kenyan products and the private sector to open new product lines to meet demand in new African and global markets that will be identified. The government will also intensify reforms to improve the overall climate of doing business in Kenya.
The second MTP will give additional attention to growth and diversification in the manufacturing sector with the aim of increasing the sector’s contribution to the GDP and foreign exchange earnings. To achieve this, three special economic zones targeting manufacturing in Mombasa, Kisumu and Lamu will be established. Other initiatives in the sector will include building clusters for meat and leather products, a stronger dairy sector, and the development of industrial and SME parks that will provide linkages to other sectors like agricultural and services.
(5) Oils and other mineral resources
Oils and other mineral resources is a new priority sector under the economic pillar of this plan given the continued discovery of oil and other minerals in Kenya. In the plan period, the government will develop the policy, legal, and institutional framework for the exploitation and management of Kenya’s natural resources (oil, gas and other minerals) for the maximum economic benefit of the country and local communities in a transparent and accountable manner. It will also ensure that legislation for transparency and fair sharing of the revenue generated is enacted, and safeguards erected to protect the environment and to avoid risks usually associated with huge inflows of resource-based external earnings.
(6) Trade
The country will focus on expanding trade to increase its share in the fast expanding regional and other emerging markets. Trade in the broader region will be backed by joint infrastructural investments with neighboring countries. During the plan period, the government will facilitate research in business development and entrepreneurship under a new entity called “Biashara Kenya” to provide funding and leverage investment from local banks. This will develop capacity and productivity of local manufacturing geared to competitively priced quality exports to Africa and the global market.
(7) Regional and National Economic Environment
Growth in the sub-Saharan Africa region is projected to remain robust at about 5 percent in 2013 and 6
Mombasa Port Master Plan including Dongo Kundu Final Report - October 2015
3. Existing Port Plans and Relevant Information
3-7
percent in 2014, backed by continuing investment in infrastructure and productive capacity. It is projected to rise gradually to more than 5.5 percent over the plan period. Global headwinds moderately lowered sub-Saharan Africa’s growth in 2013, but the pace is expected to pick up in 2014. Strong investment demand continues to support growth in most of the region. Softening and increasingly volatile global economic conditions are expected to have only a moderate downward impact on sub-Saharan Africa this year and over the plan period.
The economic outlook for the EAC (East African Community) region remains favorable, driven by increased infrastructure investments and an expected surge in private-sector lending. East Africa is expected to post strong growth in 2014, but falling commodity prices and the region’s mounting debt burden could offer the greatest challenge to its 136 million citizens. The region’s growth is expected to average six percent in 2014, up from about 5.5 percent in 2013 and grow by between 5.5 and 6 percent over the plan period.
Kenya’s Gross Domestic Product (GDP) expanded by 4.7 percent in 2013 compared to 4.6 percent in 2012 (according to the latest Economic Survey 2014, released in April). This performance was supported by;
A stable macroeconomic environment for the better part of the year, Low and stable inflation supported by improved supply of basic foods, lower international
oil prices and lower costs of electricity, Infrastructural development, and A vibrant construction sector.
This growth is expected to reach 6.1 percent in 2014 and 6.7 percent in the outer years, reflecting continued normal weather and strong growth in the sub-region. Going forward, the macroeconomic outlook remains favorable although risks remain. The main sectors that drive the economy recorded positive growths of varying magnitudes, as indicated below:
Table 3.1.1 Economic Sector Performance in 2012 and 2013
Sector Year 2012 (%/year) Year 2013 (%/year)
Agriculture & Forestry 4.2 2.9
Transport & Communication 4.7 6.0
Manufacturing 3.2 4.8
Financial Intermediation 6.5 7.2
Construction 4.8 5.5
Wholesale and Retail Trade, Repairs 9.0 7.5
Electricity & Water 10.3 5.9
Source: Economic Survey 2014
Mombasa Port Master Plan including Dongo Kundu Final Report - October 2015
3. Existing Port Plans and Relevant Information
3-8
3.2 Transport Policy and Master Plan
3.2.1 Integrated National Transport Policy
The transport sector is recognized as a key pillar and a critical enabler in achievement of the “Kenya’s Long Term Development Strategy, Vision 2030”. It will be important not only in improving the competitiveness of products from Kenya and the region, but also serve as a significant basis upon which the economic, social and political pillars of this long term development strategy will be built. Further, the sector is expected to remain a key component in tackling such challenges as reduction of poverty by half by the year 2015 and overall improvement in the general welfare of the population.
(1) Road transport
a) Road transport infrastructure
The significance of road transport in the national economy is illustrated by the fact that during the period 1998-2008, output in road transport averaged over 30 per cent of total output annually in the transport and communication sector. This mode accounts for over 93 per cent of the total internal freight and passenger traffic in the country with the remainder being mainly carried by rail and air. The Northern Corridor is important as a freight transport corridor for both import and export for the countries in the eastern and central Africa. The following statements are described in the "Integrated National Transport Policy" in May 2009.
Mission
“To provide an integrated, efficient, reliable, and sustainable road transport infrastructure that meets national and regional passenger and freight transportation goals and supports the government’s socio-economic development strategies to promote accessibility to services and the safe movement of people and goods, while being environmentally and economically sustainable”
The desired scenario for road transport infrastructure is to:
Make Kenya the hub for road transport in the East African region, Promote sustainable economic development by removing constraints on demand in
development regionally and provide the catalyst role for private investment, Be structured to encourage public passenger transport and discourage excessive use of
private passenger road transport, Allow for a seamless inter-modalism through flexibility and interconnectivity with other
transport modes, Be financed through a combination of user charges and private/public sector investment, Provide adequate accessibility together with safety and security within the constraints of
social affordability, Incorporate technological advances, which promote and enhance the role of transport in the
economy and in development, Be structured to ensure environmental sustainability and internationally accepted standards.
b) Institutional framework for roads sub-sector coordination
With the enactment of the Kenya Roads Act 2007, three new Road Agencies have been established namely, the Kenya National Highways authority (KeNHA) responsible for Class A, B and C roads; Kenya Rural Roads Authority (KeRRA) responsible for Class D, E and other roads and Kenya Urban Roads Authority (KURA) responsible for urban roads. The Kenya Roads Board (KRB) is now responsible for financing the maintenance of roads and undertaking technical audits.
The critical challenge is operationalization of the new agencies and capacity building for the subsector to perform optimally. The new agencies should come up with new strategies to address governance issues in the road sector.
Mombasa Port Master Plan including Dongo Kundu Final Report - October 2015
3. Existing Port Plans and Relevant Information
3-9
Policy
Appropriate linkage/working mechanisms between the Ministry responsible for Roads, Road Agencies, Kenya Roads Board and Development Partners shall be established within the Roads Sub-Sector to enhance service delivery,
Stakeholders’ participation shall be encouraged at all levels where road development, rehabilitation and maintenance is undertaken,
Deliberate efforts will be made to build capacities (both institutional and human) in the Roads Sector, and
The Ministry will endeavor to register all road reserves with a view to protecting them from encroachment.
c) Development and maintenance of road transport infrastructure to enhance service delivery
There is urgent need to integrate road transport infrastructure planning with overall economic planning, to take into account the changing local and regional economic activities and population issues. The rate of road deterioration has tended to exceed that of road maintenance/rehabilitation despite the adoption of various road Development and maintenance strategies. This situation has been aggravated particularly by inadequate finances, low contractor capacity and poor supervision mechanisms in force.
There is an imbalance in road transport infrastructure development in the country. The Northern, Eastern and Southern Parts of the country are poorly served by roads, with North Eastern being the worse hit. The North Eastern province, which covers approximately 30 per cent of the country’s land mass, has less than one per cent of its roads network paved. There is a need to embrace “corridor development approach” to improve road conditions to enhance urban and regional linkages, facilitate service delivery and efficient mobility of both people and goods.
Policy
A strategic approach on long term, integrated and sustainable planning and provision of the road transport infrastructure consistent with the needs of the country shall be developed to respond to various regional land use and road transport demand management,
Where road transport is identified as the major constraint to the stimulation of economic development, the GoK shall take the lead in establishing necessary road transport infrastructure by promoting the participation of other public and private sector institutions in its development and maintenance in order to facilitate and accelerate the development process.
The development of main road corridors and access links will enhance both internal and regional mobility while facilitating the movement of inputs and outputs between production and market centers, particularly to rural areas. In particular, the development and improvement of roads in Northern region and other arid and semi-arid lands of the country would facilitate the establishment of livestock based industries and enhance the development of irrigation agriculture in the region.
A comprehensive management information system, based on performance indicators and models that enable the provision of an integrated demand and supply driven road transport infrastructure shall be established.
On road maintenance, the government shall adopt the most appropriate and efficient contracting methods, which provide for input-based and performance-based contracting for maintenance works. The process will involve private sector participation while reducing current excessive and cumbersome contracting process.
To ensure that the quality for delivery mechanism is constant, standards for development and maintenance shall be adhered to with a view to ensuring efficient road transport infrastructure.
Mombasa Port Master Plan including Dongo Kundu Final Report - October 2015
3. Existing Port Plans and Relevant Information
3-10
d) Development of multi institutional financing for the development and maintenance roads
e) Environmental protection and resource conservation relating to transport infrastructure
f) Advancement of human resource development in the provision of transport infrastructure
g) Non-motorized and intermediate means of transport policy (NMIMTs)
h) Road passenger transport services
i) Road freight transport
j) Trade and competitiveness
k) Road traffic and safety
(2) Railway transport
Railway network in Kenya comprises a one-meter gauge total truck of 2,765 km owned by Kenya Railway (KRC). Magadi Railways, a subsidiary of Magadi Soda Co. Ltd., owns and operates 146 km of the railway truck under a 25-year lease agreement with the government, for the exports of its soda ash from Konza to Mombasa. From November 1, 2006 the Kenya Government and KRC concessioned the management and operations of railway services to Rift Valley Railways (RVR). Under this agreement, freight services were conceded for a period of 25 years while the passenger services were conceded for 5 years from the concession commencement date.
Freight services are offered on almost all routes for both domestic and regional markets while passenger services are provided three times a week in the up and down direction between Nairobi and Mombasa and between Nairobi and Kisumu and once a week between Nairobi and Nanyuki. Current business levels and operations at the railways have not been able to fully utilize the excess capacity of the workshop.
Mission
The mission in railway transport sub-sector is to provide efficient, reliable, safe and secure railway transport services that are integrated with national and regional railway, road, water, pipeline and air transport services for the transportation of goods and passengers on a sustainable and competitive basis.
Railway transport is the most suitable mode for haulage of goods over long distance on land, i.e. beyond 4,000 km. The performance of railway transport has over the years declined considerably due to lack of investment among other factors and hence the restructuring and concessioning of its management and operations. GoK through the KRC will closely monitor the concessionaire to meet the obligations and targets set in the concession contract. The challenges and constraints facing the railways are:
Stiff competition from road and pipeline transport, Tax policies that result in the railways subsidizing road transport which is its major
competitor through payment of the road maintenance fuel levy, An unreliable and aging infrastructure and rolling stock capacity particularly the single
track, bridge, telecommunication, signaling and other facilities, Lack of investment by the Government, KRC and the Concessionaire.
The above problems have resulted in poor operational and financial performance in the sub-sector. The GoK will ensure that the railway capacity is developed and exploited fully. The following key policy areas and critical issues will be addressed.
a) Legal, institutional and regulatory framework
The legal and institutional environment in which KRC operates is not conductive for flexibility in decision making. For instance it receives directions from various government agencies, including the
Mombasa Port Master Plan including Dongo Kundu Final Report - October 2015
3. Existing Port Plans and Relevant Information
3-11
Office of the President, the Treasury, the Ministry of Transport and the Inspectorate of State Corporations. There is therefore,
Need for a review of the KRC and State corporations Acts to reduce or eliminate restrictive regulations that do not allow fast response to changes in the market environment,
Need to establish a policy that allows institutions to streamline business processes and to respond effectively to market changes.
Policy
The Government will review the KRC and State corporations Acts to facilitate managerial autonomy for KRC and flexibility in decision making.
b) Infrastructure development and financing
The network is not well integrated with major urban centers within the country and other neighboring countries. The current railway track is old and unreliable. It has sharp curves and high gradient in certain sections that limit train speeds and haulage. The telecommunication and signaling systems used for train operations are also old and unreliable. The current infrastructure in its present state cannot be expected to fully provide effective services to industry and people and to contribute to national and regional economic development. Critical issues are:
Need to promote multi modal transport through integration of railway systems with other transport modes,
Need to improve the current infrastructure facilities, Need to construct new modern standard gauge railway networks linking the port of
Mombasa and the proposed port of Lamu to the neighboring countries, Need to closely monitor the railway concession to ensure the concessionaire meets the
minimum investment set in the agreement, The funding of railways infrastructure is expensive and the Government may not have
adequate funds for railway infrastructure development.
Policy
Gok will:
Spearhead infrastructure provision and development, Continue to monitor the implementation of the Concession Agreement to ensure that the
anticipated objectives are achieved, Facilitate the construction of a railway line connecting the Central Business District to
JKIA, Initiate a long-term railway development program aimed at phasing out the present railway
system and replacing it with a modern railway network system Finance railways infrastructure development, Encourage private sector investment in railway development and rehabilitation on a
competitive basis, Utilize the land along the track to generate more revenue.
c) Railway operations
The railway services in the country are provided by a private operator (RVR) and Magadi Soda Company whose services are limited to transporting its own products. Critical issues are:
The freight and passenger services offered in the country do not fully meet the demand by the industry and the public. The freight services offered do not provide “just-in-time” services as required by the industry,
Operational performance is affected by poor infrastructure and rolling stock, Weak enforcement of operations and procedures,
Mombasa Port Master Plan including Dongo Kundu Final Report - October 2015
3. Existing Port Plans and Relevant Information
3-12
Need to ensure that operations are well integrated with other transport modes, Need to ensure that operations are spread in the country in order to improve the quality of
life and achieve regional development, Need to provide an efficient passenger railway services especially in urban areas that are
accessible to all.
Policy
Ensure that public service obligations offered where necessary are compensated for. This is to ensure that railway operations do not lead to undue losses for the operator,
Ensure that freight charges and passenger fares charged by railway operators are competitive,
Provide railway infrastructure for mass rapid transport in Nairobi and its environs, undertake and implement feasibility studies for the provision of similar services in other local authorities and urban centers,
Ensure that railway infrastructure and rolling stock are maintained at levels capable of supporting effective operations and the national economy. The distribution of traffic among modes shall be improved to ensure the optimum utilization of resources for the benefit of the economy.
d) Land use planning and management
e) Information and communication technology
f) Safety
g) Establishment of a level playing ground
h) Human resource development
i) Regional and international integration
j) Environmental and energy issues
(3) Maritime transport
Maritime transport plays a significant role in the social and economic development of Kenya. In view of the fact that over 95 per cent of Kenta’s international trade is conveyed by sea, maritime transport continues to play a pivotal role in the development of the national economy since maritime transport is the most economical mode of transport especially for bulky goods. This mode of transport enhances the competitiveness of Kenya’s exports in the international markets and helps attract foreign direct investment to the country. An efficient and affordable maritime transport will support increased economic activities as envisaged in Kenya’s Vision 2030, Kenya’s long-term national planning and development strategy. Developments in the maritime sector have to be in tandem with this Vision.
The policy addresses maritime transport issues relating to economic principles, international trade, domestic participation, ship financing, ownership and registration, commercial maritime support services, shipping operations, ports, safety of life and property at sea, training, certification and employment of seafarers, prevention and control of marine pollution, search and rescue services, security of ships and port facilities and the institutional and regulatory framework.
Mission
“To promote an efficient safe, secure, and environmentally sound maritime transport system that supports the integration of the global network of the maritime supply chain, expansion of the productive capacity of the economy and the improvement of the quality of life and well-being of Kenyans”
Objectives
To realize this mission the Government will pursue the following objectives:
Mombasa Port Master Plan including Dongo Kundu Final Report - October 2015
3. Existing Port Plans and Relevant Information
3-13
Develop the maritime transport sector in support of the economy in general and Kenya’s international trade in particular,
Develop the port of Mombasa as a main gateway to Kenya and the hinterland serving the Great Lakes region,
Develop the port of Lamu as an alternative commercial port with emphasis on developing links to Sudan, Ethiopia and Somalia (second transport corridor),
Develop a Free Trade zone at Dongo Kundu, Restructure the Kenya National Shipping Line as a national carrier, Enhance the legal framework within which to ensure safety and security of life and
property, the prevention and control of pollution of the sea and of the inland waters, Promote public/private partnerships in maritime transport operations and infrastructure
development, Develop an awareness of maritime transport issues in Kenya amongst the policy makers,
the stakeholders and the general public, Ensure provision of globally competitive, quality maritime education and training for
seafarers and other workers in the maritime industry, Strengthen the framework for the co-ordination of activities of service providers in line
with the established policies, rules and regulations targeting among others code of conduct, cost and quality of services,
Enact and expedite the implementation of the Merchant Shipping Bill, 2008, Ratify and domesticate international and regional conventions, agreements and protocols, To strengthen the Kenya Maritime Authority and Kenya Ferry Services to fully deliver their
mandates, Develop and enhance cruise tourism, To promote the appropriate use of Incoterms by Kenyan shippers in a way that will give
Kenya maximum economic benefits in the international transport industry.
a) Legal, Regulatory and Institutional Framework
b) Admiralty Jurisdiction
c) Ports Infrastructure
Critical issues
The port’s entrance approach channel is shallow thus restricting entry of large ships such as post-Panamax vessels. There is a need for the port to accommodate all types of ships, including post-Panamax vessels,
The existing container terminal was designed to handle a throughput of 250,000 TEUs per annum through three berths i.e. 16, 17 and 18. The terminal has since surpassed this capacity as evidenced by the fact that in 2008 a total of 605,000 TEUs were handled through the terminal. This growth in container traffic has put a strain on the existing facilities and compounded the congestion. A second container terminal is being developed by KPA at the port of Mombasa which will have an additional throughput of 1.2 million TEUs. The proposed development of the port of Lamu as a second commercial port in Kenya, however, will enhance the country’s capability to service the region’s seaborne trade. Lamu is endowed with deep natural waters and adequate space which will facilitate the handling of larger vessels and more traffic. The project is aimed at creating a second transport corridor emanating from Lamu to serve Southern Sudan, Ethiopia and Somalia and will include the construction of a standard gauge railway line and a modern highway from the port to the hinterland. This will alleviate the growing pressure on space and capacity available at the port of Mombasa.
The port of Mombasa has not fully exploited its position as a logistics center which can be used to support the development of industry and the export trade, although it has adequate room for development of export processing and assembly facilities to support free port services, all of which would add value to the operations of KPA. Although land has over
Mombasa Port Master Plan including Dongo Kundu Final Report - October 2015
3. Existing Port Plans and Relevant Information
3-14
the years been set aside at Dongo Kundu in the south-western part of the port for the development of a Free Trade Zone with the accompanying transport infrastructure, the GoK has been slow in implementing this project.
The three Inland ICDs owned and operated by KPA at Nairobi, Kisumu and Eldoret were set up to ease congestion at the port; bring services closer to the hinterland and to customers in the neighboring countries and to divert bulky from road to railway, taking advantage of inter-modal transportation. These ICDs which are rail-served and connected to the Mombasa container terminal by rail have not performed well and hence have not been able to live up to their objective of diverting cargo from road to rail. This has been due to poor railway services by Kenya Railways, and more recently, RVR.
The port of Mombasa lacks purpose-built cruise ship reception facilities which are essential for attracting more cruise ships and contribute to the development of cruise tourism in Kenya despite the fact that this is one of the fastest growing forms of tourism in the world. Kenya must endeavor to tap this business by ensuring the port has adequate facilities.
Policy
The GoK shall:
Develop Dongo Kundu area as a Free Trade Zone. This will transform the port to an international logistics center generating traffic in terms of shipping and creating employment,
Expedite plans to construct the second container terminal facility at the port of Mombasa to cater for the growing business in container traffic and introduce public private participation for its operation and management,
Expedite plans to construct a new port at Lamu, Develop Cruise ship reception facilities at the port to promote cruise tourism, Promote development and use of ICDs by revamping railway transport services.
d) Ship financing and registration
e) Port operations and administration
Critical issues
Over the years the port of Mombasa has been beleaguered by inefficient cargo clearance processes causing delays and rendering the port expensive and uncompetitive. This scenario caused by cumbersome documentation and cargo clearance procedures has contributed to the high costs of maritime transport logistics along the Northern Corridor and increased the cost of doing business in Kenya and the region as a whole. The situation has also contributed to an average cargo dwell time of 12 days at the port an aspect which also contributes to the perennial congestion at the port.
Although Kenya Revenue Authority and KPA have introduced computerized systems in their operations, the delays are still prevalent due to lack of complete integration between the two systems and the fact that the other clearance agencies are not integrated. The solution to this has been identified as the introduction of a single window electric platform which will enable electronic lodging and processing of cargo clearance documentation and integration of relevant GoK agencies and other stakeholders involved in the process. The system will reduce cargo dwell time to a maximum of 3 days at the port.
Cumbersome and expensive Customs procedures have also increased the cost of transit traffic passing through the port and hence hampered the growth in this traffic. The port of Mombasa competes with the port of Dar es Salaam for transit traffic to the landlocked countries. It is important therefore to introduce policies which will help Mombasa to maintain the lead in this business.
Efforts by KPA to serve the port’s hinterland efficiently have been hampered by the poor off-take of cargo from the port by the railway operator. Despite efforts to run dedicated container trains the operator has not been able to provide the optimal level of service and capacity.
Mombasa Port Master Plan including Dongo Kundu Final Report - October 2015
3. Existing Port Plans and Relevant Information
3-15
The road infrastructure is also not adequate to serve the level of traffic demand emanating from the port. The poor transport infrastructure has contributed to delays in cargo off-take from the port. This is due to poor turnaround of railway wagons and trucks along the northern corridor route. There is need therefore for transport infrastructure to be in tandem with port development in order to cope with the ever growing port traffic.
Policy
The GoK shall:
Expedite the implementation of the Port Community Based System, Ensure timely upgrading of the infrastructure emanating from the port to the hinterland in
order to cope with increasing traffic from the port, Liaise with the Governments of the neighboring countries to ensure upgrading of the
infrastructure in those countries in order to cope with the increasing traffic from the port, Streamline customs procedures at the port to encourage business growth at the port.
f) Port reform
Critical issues
Currently KPA plays the roles of both a landlord and a service provider at the port of Mombasa. Apart from managing the port KPA also provides stevedoring and shore handling services. To some extent this dual role has contributed to inefficiencies in port operations. There is therefore the need to inculcate efficiency in port operations by transforming the port into a landlord port in order to facilitate the involvement of the private sector in port operations such as stevedoring, storage, and shore handling activities. The involvement of private sector in the crucial cargo handling activities will enable quick decision making by eradicating bureaucracy and political interference in crucial issues like equipment acquisition and engender discipline in port operations. This is the trend in ports administration world over.
Further KPA will privatize the stevedoring, storage and shore handling of conventional cargo operations followed by the container handling operations with priority given to companies with majority Kenyan shareholding through a transparent public bidding process. This will be done by outstanding through licensing, leasing, concession and build operate and transfer arrangement where appropriate hence making KPA a Landlord Port Authority.
Policy
GoK shall:
Transform the port into a landlord port status and promote regulated private sector participation in stevedoring, storage and shore handling operations at the port,
KPA will be restructured through private sector participation in stevedoring, shore handling of conventional cargo operations, container handling operations; companies with majority Kenyan shareholding will be selected to participate in this process, i.e. through appropriate provisions of the privatization Act,
Ensure that revenues derived from port operations are dedicated to the improvement of port infrastructure.
g) Greenhouse gas emissions – Marine and inland waterways air pollution
h) Ferry transport
i) Commercial maritime services
j) Maritime safety and security
k) Human resource development, management and research
Mombasa Port Master Plan including Dongo Kundu Final Report - October 2015
3. Existing Port Plans and Relevant Information
3-16
3.2.2 National Transport Master Plan (Transport Sector Plan for Vision 2030)
Transport Sector Plan for the 2008-2012 has been prepared in order to provide guidance on policy measures, transport reforms, projects and programs that will be implemented to enable the country achieve the Vision 2030.
(1) Challenges in the transport sector
The Transport Sector Plan identifies the following key challenges that will be addressed during the plan period:
The challenge for the Port of Mombasa is that of attracting and servicing increased traffic from the hinterland within Kenya and from the neighboring countries. However this is constrained since only small sized vessels are call at the port while larger post-panamax vessels cannot access the port due to its shallow channel,
The ferries being operated are quite old while the ferry services on Lake Victoria, which were being offered by KRC and now transferred to RVR, have been suspended due to lack of insurance cover,
The existing railway track is still a one meter gauge whose capacity is limited. Therefore, the capacity of the rail operations may not be enhanced beyond a certain point given the poor state of the existing infrastructure and lack of rail extensions into economic zones, which need to be served by rail lines, which is a pre-requisite for upcoming economic areas,
The over-reliance on one transport corridor, the Northern Corridor, is also a source of concern as noticed during the post-election crisis in January and February 2008 when transport to the neighboring countries was cut off. The one corridor has also left most parts of the country and the hinterland of the neighboring countries such as North Eastern, Eastern; Southern Sudan and Ethiopia without a good road and rail network link to the sea,
Apart from the increasing demand for an efficient public transport system in the City of Nairobi, the prevailing traffic congestion and environmental pollution in the City still remains a major challenge in the transport sector,
The rapidly growing aviation industry in Kenya faces major challenges including inadequate funding, oversight capacity; regulations and enforcement, accident investigation capacity, air transport infrastructure and limited capacity in local training institutions. The aircraft accidents that have occurred in the recent past and the real threat to aviation security that is faced today make it more compelling for the country to work harder towards improving the safety of the airspace and aviation security in order to sustain the growth,
In addition to fragmented transport systems, the low investment in transport infrastructure is a major challenge to be addressed if the country will be expected to have in place adequate transport systems that support all the economic activities envisaged in the Vision 2030,
Existence of conflict of interest as some Agencies undertakes both regulatory and service provision roles.
(2) Strategies for the transport sector
In order to address the challenges to ensure there is efficient and affordable transport that supports increased economic activities envisaged in the Vision 2030, the following are some of the strategies which will be adopted:
Expansion and upgrading of the railway gauge from Mombasa to Kampara, Uganda from one meter to standard gauge,
Construction of the 35 km rail by-pass around Kibera and Mukuru slum areas in addition to the removal of encroachers away from the track to create a safety zone for fast moving trains,
Mombasa Port Master Plan including Dongo Kundu Final Report - October 2015
3. Existing Port Plans and Relevant Information
3-17
Expansion of training capacity at the Railway Training Institute to offer quality and relevant railway training to the industry,
Develop a second Transport Corridor comprising a highway, rail network, an oil pipeline, airport at Lamu and Isiolo and second port of Lamu linking Southern Sudan, Ethiopia and Northern Eastern Kenya to the sea to reduce over-reliance on one transport corridor to Mombasa,
Besides, the deepening of the Mombasa channel to 16 meters to accommodate large post-panamax vessels, expansion of container handling facilities, comprehensive computerization of port services, effective restructuring and commercialization of port operations and facilitation of the development of a free zone will be undertaken. In addition, modernization of port facilities and establishment of a Free Port at Dongo Kundu and Lamu will be undertaken. A road by-pass will also be constructed to provide a link to the Free Port from the Mombasa-Nairobi Highway,
Improvement of marine safety and security through enactment of the merchant and shipping bill and implementation of the integrated security system at the port,
Expansion of training capacity at the Bandari College to offer quality and relevant maritime training to the industry,
Separation of regulation role from provision of training services, air navigation services and port services,
Modernization of Motor Vehicle Inspection Facilities to ensure compliance, Development of Rapid Mass Transit System and Light Rail within Nairobi Metropolitan to
reduce traffic congestion, Build capacity for monitoring the compliance and enforcement of all traffic laws, Development of Driving School curriculum to provide guidelines for standardized training
will be completed during the plan period, The Integrated National Transport Policy through presentation of a Sessional Paper in
Parliament will be operationalized, Expansion and rehabilitation of Airport and Airstrip facilities to increase passenger
handling capacity and improve connectivity into and out of the country and to other parts of the world to enhance JKIA’s position as a hub of Arica,
Improvement of aviation safety through implementation of the Kenya Airspace Master plan and capacity to provide effective oversight,
Expansion of training capacity at the East Africa School of Aviation to offer quality and relevant aviation training to the industry,
Negotiations and review of existing Bilateral Air Services Agreements for strategic and beneficial air transport routes will be pursued to enable airlines from Kenya penetrate most parts of the world,
Regulations related to all the relevant ICAO annexes to make the Airspace will be developed to ensure compliance and as well improve the regulatory and air accident capacity through training and recruitment,
A comprehensive framework for funding and management of aviation infrastructure will also be developed,
In recognition of the low investment by the private sector in the transport systems and the dwindling government resources toward development of the new infrastructure due to completing needs, Legal Framework to support Private Public Partnerships in the Transport Sector will be developed to encourage private sector resources in the sector.
(3) Policies and programs for 2008-2012
The Ministry identified the following policies, projects and programs that will be implemented during the next five years through own resources or a private public partnerships in the rail and road sub-sector; maritime sub-sector and aviation subsector.
Mombasa Port Master Plan including Dongo Kundu Final Report - October 2015
3. Existing Port Plans and Relevant Information
3-18
Table 3.2.1 Rail and Road Sector
Project Summary
1. Second Transport Corridor The idea is to develop another Transport Corridor with Lamu as a second port providing sea access to Southern Sudan, Ethiopia and Somalia.
(1) Lamu Free Port The Port has following options except the above: -Supplementary port for Mombasa Port, -Alternative port for the Port of Dar-es-salaam, -The great equatorial land bridge to Douala in Cameroon, -Transportation route to Kinshasa in DRC.
(2) The Lamu-Addis-Juba Railway Line Component
Construction of a standard gauge railway lines from ①Rongai to Juba to link
up Southern Sudan to Kenya/Uganda rail, and ②Nairobi-Addis Ababa to link Ethiopia to the port of Mombasa.
(3) The Southern Sudan -Lamu Oil Pipeline
Southern Sudan is expected to be exporting a lot of crude oil. It is therefore proposed that the pipeline be constructed alongside the railway line thus linking the oil field to Lamu Free Port and a second pipeline going to the opposite way could be constructed from the Lamu Rifinery to Addis Ababa to transport oil products to Ethiopia.
(4) The Lamu Oil Refinery A second oil refinery is proposed as part of this regional initiative to serve, not only the Kenyan and sub-regional market, but rather to be set up as a Merchant Refinery.
(5) The Lamu/Addis/Juba Super Highway (Road)
It is proposed that a super highway be constructed alongside the railway and the pipeline as an integrated part of the sub-regional transport and communication corridor. An access road would be constructed from Mombasa to Lamu.
(6) Fibre Optic Cable A cable similar to a fiber optic cable which is currently being laid along the coastline of the African continent is proposed to be laid along the transport and communication corridor linking the sub-region to the rest of the world. The cable will also be an integral part of the security management system, particularly for monitoring the pipeline.
(7) Airport at Lamu Once the Lamu Free Port is established, the Lamu Town will become a nuclear city even for tourists and business people. It is proposed that an airport also be developed at Lamu to serve the busy city.
(8) Resort Cities It is expected that resort cities will be developed at Lamu and Isiolo.
2. Mass Transit System This will comprise of two components namely: ①Development of a Bus
Rapid Transit System and ②Development of a Light Rail Transit System.
(1) Bus Rapid Transit System The Bus Transit System is defined as a flexible, rubber-tired rapid transit mode that combines stations, vehicles, services, running ways, and Intelligent Transportation Information Systems (ITIS) elements into an integrated system with a strong positive identify that evokes a unique image.
(2) Right Rail Transit System The Study on Master Plan for Urban Transport in the Nairobi Metropolitan Area (March 2006) acknowledges improvement of existing railway network into four lines. The area expected to be served by the Light Rail stretches from Nairobi Railway Station, situated in the Central Business District to Embakasi/JKIA to areas bordering the heavily populated industrial area.
3. Lake View Resort Kisumu The project will entail development of the idle Kenya Railways Land on the shores of Lake Victoria into income generating venture with classic hotels, business centers and recreational facilities that could become tourist’s destinations.
4.Development of the Kibera By-Pass
The project involves development of a 35 km by pass standard gauge railway from Mombasa road along Nairobi national park outside the Kibera slums all the way to Dagoretti.
5.Upgrading of the Existing Railway Track to Standard
The Project involves provision of a regional standard gauge railway network. Currently, the line is operated by a meter gauge line which is dilapidated and
Mombasa Port Master Plan including Dongo Kundu Final Report - October 2015
3. Existing Port Plans and Relevant Information
3-19
Project Summary
Gauges over 100 years old. The objectives of upgrading the current track is: (a) To increase the capacity of the railway line from 14 rains to 30 rains a day; (b) To reduce tariff charges from KSH 2.5 to 0.7 per ton-km; (c) shorten transit time from 12 hours to 4 hours from Mombasa to Malaba and increase annual tonnage from 5 million to 29 million.
6.Golf City Project The project will focus on conversion of the underutilized Kenya Railway land into a revenue generating Golf City with five star hotels, conference center and recreational facilities on 18 acres piece of land.
The maritime sub-sector plays a critical role in the transportation link as it provides not only the gateway at the ports to the rail and road sub-sector but also a cheap means of transportation of bulky cargo in and out of the country. In this regard, the Sector Plan places great emphasis on improvement of the port handling capacity and development of new container terminals, redevelopment of berths into container terminals, development of free ports as well as port dredging.
Table 3.2.2 Maritime Sub-Sector
Project Summary
1.Second Container Terminal The project entails the construction of a new container terminal covering an area of 100 ha west of Kipevu Oil Terminal and will have a capacity to handle 1.2 million TEUs per annum.
(1) Phase 1 (2008-2013) -Construction of 2 Main Berths (No.20, No.21 & Small Berth) -Construction of Apron, Container Yard and Yard Roads -Construction of Inner Roads behind the terminal -Construction of Access Road from Road No. C110 to the new terminal and Parking Areas -Construction of Main Buildings and Utilities -Dredging Works (new basins and channel) -Procurement of Equipment (Ship to Shore Gantry Cranes and Rubber Tired Gantry Cranes)
(2) Phase 2 (2013-2017) -Construction of Berth No.22 -Construction of Yard behind Berth No. 22 & 23 -Procurement of Equipment (4SSG & 8 RTG) -Dredging Works (Turning Basin at Berth No. 22 & 23
(3) Phase 3 (2017-2022) -Construction of Berth No. 24 -Procurement of Equipment -Dredging Works of Turning Basin and Approach Channel
2.Re-develop Berth No. 12-14 into Container Berths
The objective of the project is to increase container traffic from 666,000 TEUs in 2008 to 840,000 TEUs in 2012. The project entails the following: -Procurement of Equipment (6SSG & RTG etc) -Reconstruction and Reinforcement of the existing Berths No. 12-14 -Dredging Works
3.Development of Small Ports The proposed infrastructure development will include: (a) construction of new landing sites; (b) construction of access roads; (c) dredging works; (d) construction of utilities and miscellaneous works; (e) provision of requisite equipment and other facilities.
4.Port Dredging/Deepening Program
The draft and relatively sharp bends of the channel entrance at the port of Mombasa impose restrictions on large vessels and preclude post Panamax vessels from entering the port. This restriction is mainly due to the “S” bend in the outer channel between Ras Serani and Ras Mzime where the radius of curvature of the bend is about 1,000 meters on the inside bend and the restricted width of 300 meters on the “Florida gap”. Solution to this problem is to deepen the channel to 16 meters. In view of the above, dredging of the
Mombasa Port Master Plan including Dongo Kundu Final Report - October 2015
3. Existing Port Plans and Relevant Information
3-20
Project Summary
main channel to accommodate both small and large vessels is the most compelling capital project that KPA has prioritized.
5.Development of a Free Port in Mombasa
KPA has proposed that a Free Port be established at Dongo Kundu in the south mainland. A study was done by Dravo Van Houten in 1984 that recommended the establishment of an FTZ zone at Dongo Kundu in the south mainland on 3,000 acres of land. There will need for a fixed crossing connecting the area to the mainland south and the main Nairobi-Mombasa Highway.
6.Ferry Service in Lake Victoria
The scope of the project comprises the following: -Rehabilitation of Kisumu Port (wharves and dredging of basin and channel) -Rehabilitation of the port workshop, dry dock and slipways -Improvement of landing facilities (landing ramps etc) -Procurement of vessels and navigational aids
7.Cruise Ships and Floating Hotels
The development of Floating Hotels/Markets along the Creeks and Coastline will entail: -The floating markets/hotels where tourists can be transformed into the creeks will be constructed and equipped with landing facilities for the small ferries, -Procurement of cruise ships for long cruise journeys to Lamu/Shimoni, Building of Cruise Terminals in areas identified, Development of navigational aids along the creeks trough hydrographical surveys.
8.Others -Great Mombasa Ferry Services -Strengthening the Capacity of Regulatory Framework within the Transport Sector -Maritime Search and Rescue -Regulatory Framework for Maritime Human Resource Capacity Building
Mombasa Port Master Plan including Dongo Kundu Final Report - October 2015
3. Existing Port Plans and Relevant Information
3-21
3.3 Existing port development plans
3.3.1 Review and update of Port Master Plan Study of the Port of Mombasa including Development of Free Trade Zone (2009)
(1) Introduction
This reports the 2004 Mombasa Port Master Plan prepared by Royal Haskoning. Since 2004 there have been several changes which require the Master Plan to be updated. These include:
Pronouncement of Vision 2030 by the Government Faster than expected traffic growth The decision to build a new Japanese-funded container terminal at Kipevu West, with a
capacity of 1.1m TEU p.a. The first phase of this development is expected to become operational in 2013.
The decision to dredge the channel to -15.0m CD as far as the new container terminal, allowing container ships of up to 4,500 TEU to use the port.
The Government’s intention to construct a Free Trade Zone on the other side of the creek at Dongo Kundu.
Although KPA is making progress with the modernization of its infrastructure, it still faces major challenges:
The principal problems continue to be the shortage of storage space for containers. Most Kenyan import containers are now stored and cleared at private off-dock CFS depots, although containers for the transit countries are still handled within the port. The new terminal provides only temporary relief, as large numbers of containers will continue to be handled across the existing container berths.
There is still generally enough quay line for the handling of dry bulks and general cargoes, although handling rates for some commodities remain disappointing. However the open storage space behind Berths 1 to 10 is very congested because of the large number of containers stacked there, and some of the infrastructure is in poor condition and in need of repair.
The failure of the national railway system to provide an adequate service for the transfer of cargoes to and from the port has resulted in a large increase in truck movements and vehicle circulation and parking.
Continuing failure to resolve inland storage and pipeline constraints has resulted in high berth utilization rates at the two oil jetties. These are now so high that any stoppage due to an accident could seriously disrupt oil supplies to Kenya and neighboring countries.
Strong traffic growth and improvements to the business environment have increased private sector interest in the development of new port facilities, as demonstrated by:
A proposal by African Gas & Oil Company Ltd to construct a new single buoy mooring in Port Reitz for LPG and compressed natural gas imports.
A proposal by GBHL to install new bulk handling equipment and conveyors on Mbaraki Wharf.
Requests for permission to install grain handling and conveying equipment leading to new silos just outside the port boundary.
Shipping line interest in developing Berths No. 12-14 as a privately-operated container terminal.
A proposal by Tiomin to build a new berth for titanium ore exports.
(2) Review of traffic forecasts
At the beginning, the traffic forecasts were based on Vision 2030 GDP growth assumptions (10% p.a. from 2012-2020). After discussions with KPA about the amount of physical infrastructure that would
Mombasa Port Master Plan including Dongo Kundu Final Report - October 2015
3. Existing Port Plans and Relevant Information
3-22
be required to support the Vision 2030 growth rates, and the risk that these will not be achieved because of the global recession, a more modest GDP growth rate of 7% p.a. between 2012-2020 was agreed for port planning purposes and is referred to in this report as the “base case”. This is still slightly above the GDP rates that have been achieved in the recent past.
Table 3.3.1 shows the growth rate of the 1st MTP (2008-2012) Macro-Fiscal targets and actual performance. During the period, the actual growth rate slowed down with a nearly half of the target rate and showed a big fall compared to the target.
Table 3.3.1 Growth Rate of MPT 2008-2012 Targets and Actual Performance
GDP Growth (%) 2008/09 2009/10 2010/11 2011/12 2012/13
Target 6.2 8.3 9.1 9.7 10.0
Actual 2.1 4.2 5.1 4.1 5.4
Source: VISION 2030 “Second Medium Term Plan (2nd MTP) 2013-2017”
The Government projects growth to continue gathering momentum from about 6.1 per cent in 2013 to 10.1 per cent in 2017 as shown in Table 3.3.2. The higher growth is premised on increased investment which is targeted to reach 30.9 per cent of GDP in 2017 from 24.7 per cent in 2013 and mainly contributed to by the private sector including foreign direct investments. The above projections based on the increased investment is rather optimistic considering the past investment level from 19.6 per cent of GDP in 2008 to 20.5 per cent in 2012 and as a result the growth rate of 5 to 7 per cent estimated by IMF is quite reasonable for GDP from 2013 to 2017.
Table 3.3.2 Real GDP Growth Targets 2013-2017
GDP Growth (%) 20013/14 2014/15 2015/16 2016/17 2017/18
Growth Projection 6.1 7.2 8.7 9.1 10.1
IMF Forecast 4.6 5.3 6.2 6.4 6.5
Source: VISION 2030 “Second Medium Term Plan (2nd MTP) 2013-2017” and IMF Database, Oct. 2014
Table 3.3.3 shows summary of base case traffic forecasts reported in “Review and update of Port Master Plan Study of the Port of Mombasa including Development of Free Trade Zone (2009)” and comments on the traffic forecasts after reviewing are shown in Table 3.2.4.
Mombasa Port Master Plan including Dongo Kundu Final Report - October 2015
3. Existing Port Plans and Relevant Information
3-23
Table 3.3.3 Summary of Base Case Traffic Forecasts (‘000 tons)
Source: Review and Update of Port Master Plan Study of the Port of Mombasa including Development of Free Trade Zone (2009)
Mombasa Port Master Plan including Dongo Kundu Final Report - October 2015
3. Existing Port Plans and Relevant Information
3-24
Table 3.3.4 Comments on the Traffic Forecasts
Commodity Comments
(Import)
Wheat and Other Cereals Per capita consumption of wheat has increased by more than 3 %/year for the last decade (2003-2013), while per capita consumption of maize has remained with a volume of 70-100 kg/year for the last decade. Further local wheat production is dependent on the weather and has fluctuated with a production volume of minimum 219,000 tonnes in 2009 and maximum 512,000 tonnes in 2010 for the last five years. As a result, it should be expected that much more volumes will be imported in the future.
Fertilizers According to “Kenya Fertilizer Assessment in 2012” by International Fertilizer development Centre (IFDC), the total fertilizer requirement for cereals and non-cereals is estimated using two scenarios below: -Scenario 1: the minimum level of fertilizer needed to close the gap between current and target production levels (= 662,000 tonnes). -Scenario 2: fertilizer requirement using the DSSAT model to derive a more refined set of initial conditions and estimates of production potentials (=910,000 tonnes). Based on the above scenarios, it should be expected that fertilizer volumes close to the above figures will be imported in the future.
Titanium Ore According to KPA statistics, 363,000 tonnes of Totanium was exported in 2014. Tiomin, a Canadian company, plans to export 450,000 tonnes p.a. of titanium, zircon etc. as a target.
Rice According to “National Rice Development Strategy (2008-2018)” by Ministry of Agriculture in Kenya, production volumes up to 2030 are projected, for example 136,389 tonnes in 2015 and 518,416 tonnes in 2030. Rice forecast should be estimated using the above figures (import volumes = consumption volumes – production volumes).
(Export)
Tea Tea should be considered as one of major export commodities. It is recommended that future export volumes of tea are calculated based on the relation between export volumes and GDP of export partners.
Soda Ash It is recommended that future export volumes of soda ash are calculated based on the relation between export volumes and GDP of export partners.
Coffee Coffee should be considered as one of major export commodities. It is recommended that future export volumes of coffee are calculated based on the relation between export volumes and GDP of export partners.
(Container)
Container cargoes Generally the containerized ratio tends to increase in the future for developed countries having relatively small ratios. So it is recommended that the containerized ratio should be incorporated into the container volume forecast, especially for import containers. Because an increase of the containerized ratio in the future will bring more container cargo volumes compared to no consideration of the ratio.
Source: JICA Study Team
Mombasa Port Master Plan including Dongo Kundu Final Report - October 2015
3. Existing Port Plans and Relevant Information
3-25
(3) Future shortfall in port capacity
After 2013 there will be a temporary surplus of ground slots, but the Kipevu West terminal is likely to be full by 2020, when additional capacity will be needed. A further 1,100m of quay with around 400-500m of back up spaces will then be required to meet the growth in container traffic up to 2030.
For dry bulks and general cargoes there is currently a surplus of around 800m of berth length on Mbaraki Wharf and Berths No. 1 to 10. However Mbaraki Wharf does not have enough capacity to handle all of the dirty bulks traffic, some of which will have to use Berth No. 1-10. If clinker, coal and fertilizers are handled over Berths No. 1 to 10, additional berth length will not be required until about 2022. The latter could be developed jointly by KPA and the Ministry of Energy, which is considering building a new coal jetty for a proposed power station at Dongo Kundu. If there is no development at Dongo Kundu and Berth No. 11 is not used for general cargoes, there will be a berth shortfall for dry bulks and general cargoes of about 815m by the end of the study period (2030).
The traffic forecasts do not take into account any additional traffic that might be generated by the Free Trade Zone at Dongo Kundu, and the Master Plan does not include the construction of additional berths at Dongo Kundu to kick-start the Free Trade Zone development.
(4) Review of Port Master Plan proposals
Projects to be included in the Revised Port Master Plan have been divided into two groups: short-term (for completion by 2013) and long-term (projects which may be started in the next five years but will not be completed until 2013, and longer term development up to the end of the planning period in 2028.
a) Short-term proposals
The short-terms proposals include: Investigation of further improvements to the entrance channel and the channel within the
port, to determine if it would be possible to accommodate container ships of 6,000+ TEU capacity.
Transfer of most of the dirty dry bulk operations to Mbaraki Wharf, combined with the construction of wider access bridges and dredging of the wharf to 12.5m CD.
Repairs to buildings in the Dockyard which are needed for safety reasons. Clearing of all of the old buildings from Area G, and conversion of the area into two
separate open storage areas, one for vehicles and the other for containers.
This part of the port can be made accessible to the public without putting port security at risk, and developed for commercial uses:
Improvements in handling efficiency on general cargo Berth 1-10. The need to retain all of the transit sheds should be reviewed, as open storage space for containers and subsequently vehicles would be more useful.
At Berth 4 GBHL is proposing to install a third grain unloader once there is sufficient demand. Alternatively a second grain operator could be allowed to install unloading equipment at Berth 5, with an elevated conveyor to off-dock silos.
At Berth 9 Magadi Soda is proposing to upgrade its loading equipment for soda ash. As handling rates for this commodity are very low, this will increase the capacity of the berth.
Transfer of LPG from Shimanzi Oil Terminal to a new single buoy mooring to be built at Port Reitz by the African Gas and Oil Company Ltd.
Extension of Berth 14 to join Berth 16, rearrangement of the stockyard area behind Berth 11-15, and improvements to the traffic circulation pattern. This provides an extra 206m of quay and 300 TEU of additional ground slots.
Construction of Berth 19, rearrangement of the stockyard area behind Berths 16-19, and improvements to the traffic circulation pattern. This provide an extra 160m of quay and 2,050 TEU of additional ground slots, and will allow a further three ships to shore gantries
Mombasa Port Master Plan including Dongo Kundu Final Report - October 2015
3. Existing Port Plans and Relevant Information
3-26
to be installed in addition to the four in use. Enlargement of Gate 19 to provide three additional check-out booths, and widening of the
truck waiting area near the gate to avoid long queues of vehicles impeding other port operations.
Widening of the road behind Berths 16-19 to improve access to the Kipevu West container terminal.
A study of the need for new hydrocarbons berths (LPG, compressed natural gas and petroleum products). If productivity improvements at KOT cannot be achieved quickly, a new oil berth will be needed in the short-term.
Upgrading of the incoming power supply to 132 kV and provision of a second power line. Other power-related improvements include the purchase of three new generators to provide back-up power to communications equipment.
Construction of a new water pipeline and upgrading of the sewage system.
Table 3.3.5 shows lists of the short-term proposals for the revised Master Plan for the port of Mombasa where the planning and design should be started in 2009 or 2010 and the work completed by 2012, and the present status of these proposals.
Table 3.3.5 Short Term Proposal and Present Status
Short term proposal Present status
Entrance channel improvements
The project was divided into two phases. Phase 1 covered the navigational channel, turning basin, the proposed berths 20-23 at the second container terminal and the ancillary works. The first phase commenced in February 2011 and was completed in April 2012. Further dredging for Phase 2 is required to accommodate the development of Dongo Kundu Freeport, Relocation of KOT and the LNG jetty for the Gas Fired Electricity Generation plant. The Government is expected to avail more funds and explore other funding opportunities for the Phase 2 project.
Extension of Mbaraki Wharf
The project is under planning and expected to obtain the external funding source.
G-Section-Holding ground for cars
The project is not determined yet.
Development of additional bulk grain facility
The project is embarked for development under PPP arrangement, in which the private sector will construct, equip, market and operate the proposed facility. A detailed feasibility study has been completed and funding for due diligence and transaction advisory services will be needed to facilitate PPP in the project. Presently the project is pending.
Conversion of berth 11-14 into Container Berths
The project entails infrastructural modification to berths 11 to 14 to support loadings from modern container handling equipment and procurement of handling equipment. The project will be conducted by the PPP scheme and is under planning.
Relocation of Kipevu Oil Terminal
The development of berth 19 and the development of the container terminal West of KOT necessitate re-location of KOT. Niras Port Consultant of Denmark have carried out a feasibility study and further activities require undertaking detailed design study, determine the financing options and funding, and re-location of the terminal facility.
Source: JICA Study team
b) Long-term proposals
The long-term proposals expand the port further westwards into the Port Reitz area, and across to the other side of the creek at Dongo Kundu. They include:
Construction of another 1,100m of container berths, either as an extension of the 1.1m TEU p.a. container terminal to be built at Kipevu West or as a new container terminal at Dongo Kundu.
Construction of a common user terminal for dirty bulks at Dongo Kundu, capable of
Mombasa Port Master Plan including Dongo Kundu Final Report - October 2015
3. Existing Port Plans and Relevant Information
3-27
handling Panamax size vessels. Deepening of Berths No. 1-5 at the existing port to allow the use of larger grain and RoRo
ships. This would also allow general cargo ships to carry larger consignments of steel, and would be of benefit to the dirty dry bulks (clinker, coal and fertilizers) until the new facility at Dongo Kundu would be built. Berths 1-2 would be deepened to -12.5m CD, and berths 3-5 to -14.5m CD.
Development of a car import terminal at Dongo Kundu by 2023. Construction of a new cruise terminal close to the proposed southern by-pass connecting
Dongo Kundu to the north shore of Port Reitz. Although KPA intends to convert the buildings on Berth 1 into a cruise terminal.
The proposal by Tiomin Kenya Ltd to build a privately-funded berth for mineral exports 500m west of the Likoni Ferry on the south side of Kilindini Harbor.
Further widening of the entrance channel to allow container ships of 6,000+ TEU and large bulk carriers to enter the port.
Table 3.3.6 shows lists of the long-term proposals and present status including the Consultant’s comment.
Table 3.3.6 Long Term Proposal and Present Status
Long term proposal Present status/Comments
MPDP Phase 4 & 5 A further 1,100 meters of the container berth will be required to provide enough capacity to meet demand in 2030. The project will be studied in “The Project for Technical Assistance to Kenya Ports Authority on Dongo Kundu Port, Mombasa Master Plan” whether additional container berths will be built at Kipevu West or as a new container terminal at Dongo Kundu
Freeport at Dongo Kundu The project is one of the flagship projects to be implemented during the first Medium Term Plan (2013-2017) under Vision 2030. Development of the container berth, the bulk berth for dirty dry bulk and the car import terminal has been proposed in the revised Master Plan. The feasibility study by JICA is under way and expected to be studied on the berth type to be developed. The immediate handicap to the development is inaccessibility to the area and its development is dependent on the construction of a fixed sea crossing bypass to the south with a bridge/causeway combination from Miritini Station to Dongo Kundu.
Cruise Ship Terminal As a short term measure limited rehabilitation of the Shed No.1 has been undertaken to provide basic facilities. Conversion of berth No.1 & 2 into a passenger terminal has been carried forward. Though the Port Master Plan has recommended the development of a cruise liner terminal at the western end of Port Reitz, it is advised that its development should be reconsidered due to piracy and security concerns thus adversely affecting the port of Mombasa.
Titanium Ore Terminal Tiomin, a Canadian company, plans to export 450,000 tonnes p.a. of titanium, zircon etc. from a site at the south of Mombasa port. Though the project was delayed, about 363,000 tonnes of titanium was exported in 2014.
Widening of Entrance Channel Bends
If the study proposed in the short term plan demonstrates that it would be possible to bring container vessels larger than 4,500 TEU capacity safely into the port, there may be a demand from shipping companies to carry out some widening of the entrance channel bends. It is therefore recommended by the revised Master Plan that KPA should carry out further simulations to assess whether or not larger vessels up to 6,000 to 6,500 TEU capacity can enter and leave if the bends in the channel are dredged to allow a larger radius of curvature of the bends. Presently KPA doesn’t list up the above project in “The Port Investment Programme 2013-2030”. It is advised that environmental impacts should be identified before the project is going on.
Source: JICA Study team
Mombasa Port Master Plan including Dongo Kundu Final Report - October 2015
3. Existing Port Plans and Relevant Information
3-28
3.3.2 SAPROF Review Report (2013)
(1) Purpose of SAPROF Review
SAPROF Review was originally intended to provide a basis for designing the concession plan for the Second Container Terminal, through understanding the background of Mombasa Port Development Project (MPDP) and updating necessary data and information for required assessments, such as demand forecast, cost estimate, and financial modeling, for concession.
However, it is anticipated that SAPROF Review Report will also serve as a part of a feasibility study report under the process stipulated in PPP Act 2013. Therefore, the Consultant additionally provided economic and financial evaluations, which were originally not included in the Review Report.
It should be noted that the SAPROF study evaluated the feasibility of the Project wherein no separate feasibility evaluation for KPA and for Concessionaire was made. Hence, this SAPROF Review Report only provided the feasibility of the entire Project.
(2) Review of Demand Forecast
a) Socio-economic Framework in SAPROF Review
Table 3.3.7 shows Socio-economic framework in SAPRO Review. The latest indices obtained from IMF and WB is introduced.
Table 3.3.7 Socio-economic Frameworks in SAPROF Review
Item Specified Figure Source
GDP (Kenya) [%] 6.0 (2013-2018) 5.0 (2019-2024) 4.0 (2025-2030)
IMF “World Economic Outlook” Based on a possible slowdown in Kenya's economy after 2018.
Based on the demand forecast and the design capacity for containerized cargo at Mombasa Port, it is estimated that container terminals of Phase II and Phase III should be operational by 2018 and 2021, respectively, if conventional cargo terminals (berth Nos. 1-8) are not used and CFSs are not utilized. However, the Port will need to continue using conventional berths and CFSs until 2016 to meet the increasing demand, and it may not be realistic to completely stop using them after 2016. Phase II and Phase III projects also need more comprehensive approaches, taking into consideration of other factors, such as phasing implementation or possible design change in Phase III, which has shorter berth length and shallower water depth, in accordance with the direction of Master Plan of the Port.
(3) Cost Estimate
The latest total cost is estimated at JPY35.956 million, compared with JPY19.365 million in SAPROF. Major increase was due to inflation for 6 years (from 2006 to 2012) and lower than actual unit rates in
Mombasa Port Master Plan including Dongo Kundu Final Report - October 2015
3. Existing Port Plans and Relevant Information
3-30
SAPROF. KPA has implemented capital dredging for channel and basin by utilizing domestic funds (from Central Government) at US$ 71.67 million, so two (2) cases, with and without capital dredging, are shown in the table below:
Table 3.3.11 Estimated Cost
For the purpose of comparison, costs are shown only in JPY. Source: SAPROF Review Report (2013)
(4) Legal and Institutional Framework
There are some legal issues that should be clarified by the relevant authorities, or that require amendments to the relevant laws or regulations, including the following:
The application of the PPP Act to the Project, which should be clarified by an official interpretation from the relevant authorities.
The power and authority of KPA to enter into and execute the Concession Agreement, which should be clarified by an amendment to the KPA Act or, at least, by an official interpretation from the relevant authorities.
Section 16 of the Merchant Shipping Act, from which the Project should be carefully reviewed and an amendment of the Act or exemption of an application to this project needs to be considered to increase competitiveness of bidding.
(5) Environmental Aspects
Environmental survey/monitoring has been being implemented in accordance with the Environmental Management Plan (EMP) stipulated in the Environmental Impact Assessment (EIA) Report for MPDP, May 2007. There have been no specific issues reported so far.
Terminal operator (Concessionaire) should be responsible for any environmental issues relating to the operation of Second Container Terminal and water area in front of the terminal. Environmental responsibilities of the Concessionaire will cover garbage and litter, accidental spills, dry cargo release, sanitary wastes, noise and vibration, dust and other airborne emissions and traffic burden.
(6) Facilities and Equipment for Containerized Cargo
Current facilities and operation for containerized cargo were reviewed and updated. KPA has been improving facilities and equipment, as well as operational productivity. Major expansion was realized with the construction of new berth No. 19 which has been operational since April 2013. KPA also procured additional container handling equipment, three (3) ship to shore gantry cranes (STS) and
Unit: Million JPY
LA (KE-P25)
2007
Detailed Design
2010
Actual Contract
2011
with Dredge 12,623
w/o Dredge 11,686 20,058 18,637 23,498
2. Procurement of Equipment 2,280 2,605 3,443 2,605
with Dredge 14,903
w/o Dredge 13,966 2,605 22,080 26,103
3. Consultancy Services 1,937 2,572 2,572 2,685
4. Contingenty 2,526 1,476 1,476 0
with Dredge 19,365 35,956 w Capital Dredge
w/o Dredge 18,429 26,711 26,128 28,788 w/o Dredge
@1.117JPY/KS
1. Civil and Building Works
Grand Total
SAPROF
2006
@120JPY/$
Category
Total of Construction
Mombasa Port Master Plan including Dongo Kundu Final Report - October 2015
3. Existing Port Plans and Relevant Information
3-31
rubber tired gantry cranes (RTG) in 2011, and introduced a computerized terminal operating system (CATOS) in 2008.
(7) Handling Capacity for Containerized Cargo at Mombasa Port
KPA has been increasing the port capacity for containerized cargo by introducing the measures mentioned above, as well as utilizing/cooperating with private Container Freight Stations (CFSs) to shorten dwell time of containers at the port. SAPROF estimated handling capacity for containerized cargo at 535,000 TEUs/year, but the design handling capacity is calculated at 720,000 TEUs/year without using conventional berths No.1 to No.8 and CFSs which are acting as off-dock container yard.
It is expected that Mombasa Port will be able to handle the increasing container traffic until the completion of the Phase I of the Second Container Terminal, scheduled for the beginning of 2016, by using conventional berths No.1 to No.8 and CFSs.
(8) Economic Evaluation
The economic internal rate of return (EIRR) based on a cost-benefit analysis was used to appraise the economic feasibility of the Project. The EIRR is the discount rate that makes the costs and benefits of a project equal during the project life. The resulting EIRR of the Phase I Project is 40.6% compared with 51.2% in SAPROF. Difference mainly came from: (a) increased construction cost, and (b) decreased economic benefit by removing optimistic components in SAPROF.
The leading view is that the Project is feasible if the EIRR exceeds the opportunity cost of capital. It is generally considered that a project with an EIRR of more than 12% is economically justifiable for infrastructure or social service projects.
Net Present Value is estimated at 809 million USD by adopting an opportunity cost of 12%. Benefit-Cost Ratio is estimated at 5.35.
(9) Financial Evaluation
The financial internal rate of return (FIRR) has been used to appraise the financial feasibility of the Project (Phase I). The resulting FIRR is 18.4 %, exceeding 1.38% of Weighted Average Cost of Capital (WACC). Hence, the Project (MPDP Phase I) has been judged to be financially viable.
The FIRR estimated in the SAPROF study was 12.5%, while the estimated FIRR in SAPROF Review is higher than SAPROF. Compared with the stage of SAPROF study, demand forecast yielded higher figures and container handling volume at Second Container Terminal reaches its capacity from the initial year of operation (2016) as shown in the figure below.
(10) Timing of Phase II and Phase III Projects
Based on the demand forecast and the design capacity for containerized cargo at Mombasa Port, it is estimated that container terminals of Phase II and Phase III should be operational by 2018 and 2021, respectively, if conventional cargo terminals (berth Nos. 1-8) are not used and CFSs are not utilized. However, the Port will need to continue using conventional berths and CFSs until 2016 to meet the increasing demand, and it may not be realistic to completely stop using them after 2016. Phase II and Phase III projects also need more comprehensive approaches, taking into consideration of other factors, such as phasing implementation or possible design change in Phase III, which has shorter berth length and shallower water depth, in accordance with strategic direction of the Port.
Mombasa Port Master Plan including Dongo Kundu Final Report - October 2015
This strategic plan will guide the Authority to focus its resources on offering a unique value proposition based on modern infrastructure that supports efficiency, economies of scale and fast, consistent access to its markets. It is expected to align the Port’s development priorities and outcomes, as well as serve as a roadmap to ensure the Port remains competitive in the coming years and consistently meets its customer demands. The Plan is also anchored on the Vision 2030 and the Second Medium-Term Plan, whose themes is “Transforming Kenya’s Pathway to Devolution, Socio-Economic Development, Equity and National Unity”.
The strategic plan, which outlines the feasibility programs and projects that will be undertaken to meet the short and medium term demands and progressively position the Port as the obvious port of choice in East and Central Africa, builds on the current strategic road map for 2010-2015 and takes cognizance of the Constitution, the broad Integrated Transport Sector Policy and Vision 2030, whose aim is to transform Kenya into an industrialized nation by the year 2030.
(1) Review of Previous Strategic Plan
The previous Plan covered the period 2010-2015. This was, however, not fully adopted and implemented, thus most of its proposals rolled over to the present planning period. Main projects and programs for the Strategic Roadmap 2010-2015 are shown below.
Table 3.3.12 Previous Strategic Roadmap Projects
Project Key Strategy Status at End 2013
1.Optimizing performance of the Container Terminal
Corporatization as a first step towards full privatization
Pending. Carried forward using new strategy
2.Increase container handling capacity
Construction Berth 19 & back fill Conversion of Berths 11-14 trough BOT arrangements Construct a new Container Terminal West of KOT
Completed & operationalized Converted but under KPA operations In progress and ahead of schedule Done
Mombasa Port Master Plan including Dongo Kundu Final Report - October 2015
3. Existing Port Plans and Relevant Information
3-33
Project Key Strategy Status at End 2013
Use of private CFSs Equipment acquisition
Done
3.Enhance efficiency of Conventional Cargo operations
Concessioning of stevedoring services Pending. Carried forward through revised strategy
4.Reform Marine Services Develop new organizational structure, aimed at remaining with residual KPA-Landlord port
On-going. Carried forward
5.Reform Bandari College Rehabilitation of infrastructure and acquisition of additional land Make it Autonomous
Done Pending
6.Cruise Passenger Terminal Conversion of Berth No.1 & 2 into a passenger terminal by KPA Rehabilitation of berth and Shed 1
Pending. Carried forward Done
7.Improve Dockyard operations Concessioning of dockyard operations Pending. Strategy revised
8.Revitaliza ICDs Concessioning of ICD operations Pending. Carried forward through new Business Plan
9.Support the development of Free Port and Special Economic Zones (Vision 2030 targets)
Avail Dongo Kundu for consideration Set aside land for waterfront development
Land availed Done
10.Attain e-Port status Improve efficiency through use of IT Upgrade coverage of VTMIS Implement the NSWS ERP upgrade KWATOS full implementation Implement ISS
Done Done Done Done Done Done
11.Reposition Mombasa as a regional hub
Dredge to widen and deepen the navigation channel & turning basins
Pending
12.Develop an LPG common user facility
Issue 30 year license to Africa Gas Oil Company Limited
Pending
13.Relocation of KOT Build new terminal to increase crude oil handling capacity and safety of oil terminal
Pending. Carried forward in new Strategic Plan
14.Development of additional bulk grain facility
Licensing of additional capacity for bulk grains
Pending
Source: Strategic Plan 2013-2017 by KPA
(2) Strategic Model
The focal areas identified and the planned outcomes are also designed in a manner to achieve the broader national objectives of deploying world class infrastructure facilities and services, as enlisted in the Second Medium Term Plan of the Vision 2030.
Strategic Objective 1- To Be a Competitive Regional Hub
The Port of Mombasa needs to revamp and position itself as a competitive regional hub. The competitiveness will be realized by improving efficiency in port services. This will entail among other things, investment in infrastructure and facilities.
(Strategies)
Expand berths, yards and gates Invest in and maintain modern port equipment Reduce cargo dwell time Improve documentation processes
Mombasa Port Master Plan including Dongo Kundu Final Report - October 2015
3. Existing Port Plans and Relevant Information
3-34
Harmonize and integrate KPA systems and other cargo intervening systems Establish corporate social responsibility programs targeting key existing and
potential/upcoming clients.
(Planned Outcomes)
Increased berth, yard and gate capacity Reduced ship waiting time Reduced service time Improved traffic flow Increased throughput Reduced cost of doing business Enhanced corporate image High levels of customer satisfaction Interface with the National Single Window System (NSWS), KRA amd transit market
Revenue Authorities’ systems
Strategic Objective 2 – To Promote Principles of Good Corporate Governance
The constitution of Kenya 2010 introduces devolution, leadership and integrity which will be considered in the implementation of this Strategic Plan. Leadership capacity must continually be enhanced for good corporative governance and management. The act will therefore be aligned to the current international standards in shipping and with the Constitution with local community for public participation.
Strategic Objective 3 – To Enhance Partnerships, Collaborations and Linkages
The business involves diverse players including government agencies and the private sector. Mechanism for collaboration and cooperation with stakeholders will be established to bring about synergy that will accelerate the achievements of KPA goals.
(Strategies)
Establish mechanisms to enhance cooperation and collaboration with cargo interveners Enhance media engagement Grow regional markets Develop a platform for growth in trade volumes for transit business, especially in the EAC
region, through specialized approaches and customer focus mechanisms Enhance collaboration with partners in the transport sector including Kenya Railways;
RVR; Kenya Pipeline; Kenya Roads Board; among others, to develop seamless transport connectivity from the Port to the hinterland
Enhance collaboration with the local community for public participation Establish a positive and lasting port-city relationship Identify key players and partners for the Authority, such as the drivers of new growth areas
identified, including international mining companies operating in the region
(Planned Outcomes)
Improved stakeholder engagement Quality exchange of ideas and information on port development Increased cargo fluidity Increased market share for transit countries Increased cargo throughput Enhanced corporate image Enhanced flow of domestic cargo from the port to the hinterland and transit cargo from the
port to other countries Increased awareness on the role of the Port Streamlined processes Increased presence
Mombasa Port Master Plan including Dongo Kundu Final Report - October 2015
3. Existing Port Plans and Relevant Information
3-35
Harmonized port and city development plans Enhanced port-city relationship
Strategic Objective 4 – To Manage Business Risks
The risks relate to potential revenue loss, low throughput and profitability arising from negative externalities such as: Stiff competition from neighboring ports, frequent breakdowns in machinery and equipment, poor talent management and industrial unrests, among others. Corruption is also another risk that hinders full attainment of corporate goals.
Strategic Objective 5 – To Enhance Financial Sustainability
Provision of efficient port services is dependent on availability of sufficient financial resources as well as their optimal use. The policy and legal framework is limited to traditional sources of funding. These sources have remained inadequate especially for capital projects. In this regard policy and legal review will be necessary to enable KPA diversify its revenue base as well as resources.
Strategic Objective 6 – To Realize the Workforce for Enhanced Labor Productivity
The Authority needs to implement strategies to increase labor productivity, inculcate positive organizational culture, accountability, and foster industrial harmony. KPA has reviewed and rationalized its organizational structure to align it with its business model. Results-based performance management and core skills training will be given priority in enhancing productivity. Bandari College which offers relevant capacity building, including training in port management will be transformed to enable it contribute to productivity enhancement programmes.
Strategic Objective 7 – To Revitalize Inland Container Depots (ICDs)
The ICDs house Customs and other agencies, competent to clear goods for domestic use, warehousing, temporary admissions, re-export, temporary storage for onward transit and outright export. Transshipment of cargo can also take place from ICDs. Currently, Nairobi ICD has registered poor performance, coupled with high operational costs that reduce its commercial viability. Kisumu ICD has also been greatly affected by the discontinued RVR services to the Nyanza region, which was the main means of transportation from the port of Mombasa.
(Strategies)
Develop a Business Plan to refocus growth and efficiency of ICDs Increase operational independence of the Nairobi ICD, with clear oversight functions over
the Kisumu and Eldoret ICDs Support infrastructure development and repairs of damaged equipment and machinery,
including yard expansion, provisions for quick access to spares and parts required for maintenance, among others.
Improve the security and surveillance system and ensure linkages to the system at the port headquarters in Mombasa
Provide adequate communication and other equipment to facilitate operations Consider identification of new sites for additional ICDs to serve the growing hinterland
market Create close collaboration with the Rift Valley Railways in order to develop a working
mechanism for rail freight to and from the Port of Mombasa Strategically align ICDs to effectively and efficiently serve existing customers, as well as
enable the Authority to grow its customer base Support the construction of the Standard Gauge Railway, which will greatly improve
operations of the ICDs
(Planned Outcomes)
Clearly defined and well-structured path to recovery and growth of ICDs Improved operational efficiency enhanced by quick decision making Better and faster receipt and dispatch/delivery of cargo
Mombasa Port Master Plan including Dongo Kundu Final Report - October 2015
3. Existing Port Plans and Relevant Information
3-36
Expanded transit operations by rail/road to and from serving ports Improved security for both personnel and infrastructure Increased space for temporary storage of cargo and containers Increased revenues and cargo handling capacity Well maintained and repaired facilities Increased customer loyalty and growth in customer numbers, coupled with increased
revenue generation and profitability
Strategic Objective 8 – To Develop a Growth Strategy for Small Ports
A small port master plan which takes cognizance of the long term development framework in Vision 2030 was developed. Generally, the port developments in the master plan can be categorized as:
Local fish ports (with small trade) Tourist ports Semi-industrial fish & cargo ports
Strategic Objective 9 – To Develop and Operationalize the Port of Lamu
The Authority is implementing the development of the Port of Lamu under the LAPSSET initiative. The proposed port will have 32 berths, a capacity to handle 23.9 million tons per annum and chartered depths of 18 meters to accommodate bigger ships. The first phase of the port development involves construction of three berths expected to take three years from 2014. The Port will handle container, conventional and bulk cargo vessels, as well as liquid and bulk minerals, coal, livestock and fish, in both imports and exports.
Once completed the port will complement the Port of Mombasa and will especially serve the emerging markets of Ethiopia, South Sudan and Somalia, as well as the transshipment market.
(Strategies)
Construct the first three berths Operationalize the Port Position and market the port for transshipment cargo destined for the northern parts of
Africa
(Planned Outcomes)
Second commercial port operational by 2016 Increased transshipment cargo Accommodation of bigger vessels
(3) Strategic Goals
KPA’s target, in the medium to long term, is to have a full complement of the following strengths that will define its success in the development, execution and evaluation of this Strategic Plan.
To have a multi-skilled and committed workforce To be consistently achieving: ship turnaround time of less than 48 hours; container dwell
time of 72 hours; handle 1.6 million TEUs and 28.5 million tons of cargo To become a lean E-Port that is Green and has the right staff levels To be able to provide 130 % capacity in space, equipment and infrastructure To achieve a return on Investment of 10 to 15 % To have a more diversified client base that is satisfied with its services To have reliable/adequate equipment and infrastructure To be in a position to increase profitability consistently, above 25 % of revenue
Mombasa Port Master Plan including Dongo Kundu Final Report - October 2015
3. Existing Port Plans and Relevant Information
3-37
3.4 Development of Northern Corridor from Mombasa to Nairobi and surrounding countries
Figure 3.4.1 Northern Corridor full view
3.4.1 Outline of Northern Corridor
The landlocked countries in East Africa are fully dependent on the Northern Corridor transit route and Port of Mombasa as its sole gateway port. Efficiency and cost competitiveness of the Port and Corridor are critical for the economies of the countries. The corridor traffic has been experiencing numerous barriers including longer/unpredictable transit time and high/unclear cost of transportation.
In order to overcome transit transport constraints affecting them, the government of Burundi, Kenya, Rwanda and Uganda decided to negotiate a treaty, the Northern Corridor Transit Agreement, with a view to promoting an efficient, cost-effective and reliable transit transport system. The agreement was signed in 1985 and came into force in 1986 after the necessary ratification. The Democratic Republic of Congo became the fifth member in 1987.
The objectives of the Northern Corridor Transit Agreement are:
Ensure freedom of transit among the member states Safeguard right to access to/from the sea for landlocked countries Develop and integrate the regional transport facilities and services Facilitate inter-state and transit trade
The agreement provides the legal framework for collaboration among those countries on matters related to transit transport, customs control, documentation and procedures and development of infrastructure and facilities relating to sea ports, road, railways, pipelines and border crossings.
Mombasa Port Master Plan including Dongo Kundu Final Report - October 2015
3. Existing Port Plans and Relevant Information
3-38
Northern Corridor Transit Transport Coordination Authority (TTCA-NC) is the responsible institution for the management of the Northern Corridor based on the inter-governmental Northern Corridor Transit Agreement. The overall mandate of the TTCA-NC is the removal of all obstacles to the flow of trade and services along the Northern Corridor. Permanent Secretariat Office, based in Mombasa, is responsible for coordinating implementation of the Northern Corridor Agreement and any other institutional decisions and resolutions of the organization. Due to recurring challenges faced by the users and regulators along the Northern Corridor transport system, TTCA-NC conducts periodical surveys to identify and address the obstacles along the Corridor under the program of Corridor Observatory.
The East African Community (EAC) members, including signatories of the Northern Corridor Transit Agreement, adopted a regional approach for reducing border-crossing delays by setting up the concept of “One Stop Border Post (OSBP)”. Further step is going to be implemented under the concept of “Single Customs Territory”, whereby the goods are cleared at the port of entry (Port of Mombasa) to eliminate multiple documentary processes at every border.
Principal mode of transport in the Northern Corridor is road and rail. However, rail service is not widely utilized due to deterioration of aged railway infrastructure, coupled with a lack of maintenance and service. About 95% of the corridor traffic relies on road. According to Corridor Diagnostic Study (2011), modal split of the Northern Corridor is as follows.
Table 3.4.1 Northern Corridor Traffic by type of mode (2009)
(unit: 1,000 tons)
Type of Traffic Road Rail Total
quantity share quantity Share quantity
Transit 5,509 93% 417 7% 5,926
Regional 2,974 95% 151 5% 3,125
Domestic 11,817 95% 622 5% 12,439
Total 20,300 94% 1,190 6% 21,490
Source: Nathan & Associates, Corridor Diagnostic Study 2011
Mombasa Port Master Plan including Dongo Kundu Final Report - October 2015
The entire Northern Corridor road network extends approximately 8,800 km across Kenya, Uganda, Rwanda, Burundi and the DR Congo. Key transit transport routes are from Mombasa to Bujumbura, Burundi covering a distance of about 2,000 km and from Mombasa to Kisangani, DR Congo which stretches for about 3,000 km.
From Kenya to Uganda, Mombasa-Malaba-Kampala road (1,170km) is the main trunk line.
From Uganda to Rwanda, Kampala-Kagitumba-Kigali is the principal route.
Bujumbura, Burundi can be reached from Kampala through Rwanda.
About two thirds of the road network is paved, although the condition is generally poor due to inadequate resources for rehabilitation and maintenance. Overloaded trucks and poor enforcement of axle load regulations further deteriorate the quality of the road network and reduce road life spans.
a) Roads in Kenya
Total road network in Kenya is 160,886 km. Out of the total road network, 61,936 km is classified road. Total length of paved road is 11,189 km. Details of road system in Kenya is described in 2.3.1.
The entire segment of A109 and the northern segment of A104 comprise the main parts of the Northern Corridor. This is the busiest route in the country as it is the trunk line used to carry most of export and import traffic through Mombasa Port for Kenya, Uganda and other landlocked countries.
b) Roads in Uganda
Total national road network in Uganda is about 149,800 km. Total length of paved road is 5,917 km. National road network comprises four types of roads (National, District, Urban and Community
Mombasa Port Master Plan including Dongo Kundu Final Report - October 2015
3. Existing Port Plans and Relevant Information
3-40
Access Road). Dual carriageways account for about 20 km, and are mainly found in the urban areas of Kampala and Jinja.
Table 3.4.2 National Road Network in Uganda
(unit: km)
Road Class Paved Un-paved Total
National Roads 3,795 17,205 21,000
District Roads - 33,000 33,000
Urban Roads 2,122 8,678 10,800
Community Access Road - 85,000 85,000
Total 5,917 143,883 149,800
Source: National Development Plan 2015/16-2019/20, Uganda National Road Authority
Uganda National Road Authority (UNRA) is responsible for the management of National Roads. Since its formation in 2008, 1,527 km of new National Roads have been built. Project for another 1,563 km is ongoing and an additional 1,872 km is planned in future.
Figure 3.4.3 Road Network in Uganda Source: UNRA
c) Axle load control
In order to prevent road destruction due to overloaded trucks, axel load limitation policy and
Mombasa Port Master Plan including Dongo Kundu Final Report - October 2015
3. Existing Port Plans and Relevant Information
3-41
regulations have been established by North Corridor governments to regulate the weight of transport vehicles moving on the highways. In the case of Kenya, the following axle load limit and maximum gross vehicle weight are set in the Traffic Act (Cap. 403):
Table 3.4.3 Permissible Maximum Axle Loads
Axle Group (with Pneumatic Tyres) Max. Axle Load (Kg)
A Single Steering Axle (2 wheels-single tyres) 8,000
C Vehicle and semi-trailer with total of 3 axles 28,000
D Vehicle with 4 axles 30,000
E Vehicle and semi-trailer with total of 4 axles 36,000
F Vehicle and drawbar trailer with total of 4 axles 36,000
G Vehicle and semi-trailer with total of 5 axles 44,000
H Vehicle and drawbar trailer with total of 5 axles 44,000
I Vehicle and semi-trailer with total of 6 axles 50,000
J Vehicle and drawbar trailer with total of 6 axles 52,000
K Vehicle and drawbar trailer with total of 7 axles 56,000
Source: KeNHA website: October 2014
d) Weighbridges
Axle load control is implemented through the use of weighbridges.
In Kenya, there are nine weighbridges along the national highways. Seven of them are operated along the main Northern Corridor route between Mombasa and Malaba border.
Table 3.4.5 List of weighbridges in Kenya
Weighbridge location Road name
1 Mariakani (30km from Mombasa) A109
2 Mtwapa B8
3 Athi River (Mollongo, outskirt Nairobi) A104
4 Gilgil A104
5 Webuye A104
6 Rongo A1
7 Juja A2
8 Busia B1
9 Ishiya A104
Source: KeNHA website: October 2014
Mombasa Port Master Plan including Dongo Kundu Final Report - October 2015
3. Existing Port Plans and Relevant Information
3-42
Mariakani and Athi River weighbridges are the busiest along the entire Northern Corridor route due to its location close to Mombasa and Nairobi respectively. Weighbridges tend to be the cause of delay in transit transport due to long lines at the weighing location. Mariakani weighbridge implemented “High Speed Weigh in Motion” system to mitigate the congestion.
e) Border crossing
At most of the border crossing points of the region, transit traffic suffers excessively heavy traffic. Factors affecting the efficient operations of the border crossing points range from administrative and legal issues to the lack of infrastructure investment and maintenance.
One stop border post (OSBP) operations are being introduced on the Northern Corridor borders to solve this long standing problem. Construction of OSBP is ongoing at many border posts including the busiest one, the Malaba border point between Kenya and Uganda. EAC OSBP Bill has come into effect which gives each country the legal right to address this issue. Under the OSBP, service will be harmonized with incoming traffic jointly cleared by officers from both countries from one side of the border and the same arrangement is provided for outgoing traffic.
At the Malaba border point, traffic from Kenya to Uganda is handled at the OSBP established on the Ugandan side of the border and traffic from Uganda to Kenya is handled at the OSBP established on the Kenyan side of the border. Construction of infrastructure on the Ugandan side is in final stage while infrastructure on the Kenyan side has already been completed as of December 2014.
Time required to cross the border varies from hours to days depending on the cargo commodity and readiness of necessary documents. Basic industrial materials and cargoes regularly crossing the border all through the year are enjoying faster clearance at the border. An experienced forwarding agent stated that it takes on average 2 days for their trucks to cross the border for general cargo.
Customs clearance of Ugandan cargo is done either at the border crossing point or customs controlled area (bonded warehouse) in Kampala depending on consignee’s choice. In case of clearing at border, all Ugandan tax payments should be finished prior to truck arrival at the border. In case of clearing at customs controlled area in Kampala, a Ugandan transit bond should be lodged prior to truck arrival at the border. All necessary information is electronically transmitted from URA head quarter to border office. However, URA information system does not function well and there are frequent down times which increase the time required for border procedures.
For enhancement of international and intra-regional trade, East African Community agreed to work towards “Single Customs Territory (SCT)”. Under the scheme, a single customs system in the region will be established which will handle all customs revenue. For Ugandan transit cargo, the taxes are paid while the cargo is in Mombasa and once the cargo is cleared, the cargo can be directly moved to the final destination; thus no entry processing is required at the border. In future, this will significantly reduce time and cost for transit cargo transportation including elimination of transit bond. Government of Uganda has started to implement SCT in phases for selected commodities.
Mombasa Port Master Plan including Dongo Kundu Final Report - October 2015
Railway route in the Northern Corridor links Mombasa, Kenya and Kampala, Uganda. There is no further extension to Rwanda, Burundi and other NCTA countries. Kenya Railways Corporation (KRC) and Uganda Railways Corporation (URC) are the government-owned corporations in the respective countries. The original railway lines in East Africa (Uganda, Kenya and Tanganyika) were run by the East African Railways and Harbours Corporation (EAR&H) since World War I. Following the break-up of the EAR&H in 1977, Kenya Railways and Uganda Railway were established to take over the railway lines of each country.
The total length of the Kenyan Railway network is 2,210 km. The main line links Mombasa to Malaba stretching a distance of 1,080 km. A branch line of 217 m is going from Nakuru to Kisumu, where it links with the ferry service on Lake Victoria. There are other branch lines which total 618 km in length, including the line connecting main line to Magadi where a soda ash factory is located.
The total length of the Ugandan Railway network is 1,240 km. The only active line of the network runs from Tororo (Uganda/Kenya border, a counterpart of Malaba) to Kampala over a distance of 250 km. There is a small 10 km branch line linking Kampala to the ferry terminal on Lake Victoria at Port Bell. The remaining part of the railway network is dormant due to deterioration of the infrastructure. The dormant part includes the 500 km Tororo-Pakwach line and the 332 km Kampala-Kasese line.
The overall railway infrastructure is very old and no significant maintenance has been carried out from the days of EAR&H. The railways were built to meter gauge (1,000 mm). Investment in rail infrastructure and equipment has been inadequate for a long time. As a result, the general condition of the railway network from Kenya to Uganda is poor for normal service and in need of rehabilitation. According to the survey conducted by Northern Corridor Infrastructure Master Plan Study, condition of the railway tracks is as follows:
Mombasa Port Master Plan including Dongo Kundu Final Report - October 2015
3. Existing Port Plans and Relevant Information
3-44
Table 3.4.6 Condition of Northern Corridor Railways Tracks
Section Length (km) Condition of the tack Needed intervention KENYA Mombasa – Nairobi Nairobi – Malaba Nakuru – Kisumu
530
550
217
Good/Fair
Good/Fair
Fair/Poor
Spot rehabilitation Replacement of rails and slippers Replacement of rails and slippers Reconstruction of culverts Improvement of track for 160 Km Reconstruction of culverts and viaducts
UGANDA Makaba – Kampala Kampala – Port Bell Kampala - Kasese
250 10
332
Fair/Poor
Good Poor
Rehabilitation of the line including bridge Rehabilitation
Source: Northern Corridor Infrastructure Master Plan Study 2011
In 2006, the Government of Kenya/KRC and Government of Uganda/URC signed two separate concession agreements for management and operations of railway services with Rift Valley Railways (RVR) for 25 years with the objective to revive the railway transport services along the Northern Corridor. The main railway lines of Kenya and Uganda are now under the single operatorship of RVR.
In order to strengthen the role of railway transport in Northern Corridor, the completely new Standard Gauge Railway (SGR) construction project has started. This is one of the flagship projects in Kenya Vision 2030. The official commissioning of the construction was made at Mombasa on November 28, 2013. According to the plan, the SGR will be developed in 3 phases. Phase 1 involves Mombasa to Nairobi portion which will be completed in 2018. It is estimated that SGR would transport 6.15 million tons in 2020 (SGR modal split 23.1%), 11.89 million tons in 2025 (33.56%), 20.20 million tons in 2035 (44.5%). Phase 2 connects Nairobi to Malaba which will be completed in the 2020s. Progress of oil production in Uganda would be one of key factors for development of SGR of this part. A feasibility study and preliminary design of Phase 3 covering Malaba to Kampala is currently being carried out.
a) Time and cost of transit traffic
Time
Time required for moving the goods from gateway port Mombasa along the Northern Corridor to the final destination depends on various factors. Specifically, the overall transport time will be affected by the cargo handling process at the port, necessary documentation work before leaving the port, transportation by truck or rail from the port to the border, border crossing procedure, and transportation after passing the border to the final destination and so on. Various reports present a wide range of transit times and various calculation methods. Based on the available information, it is judged that the best estimate of transit time for the representative Northern Corridor transit passage, Mombasa/Kampala, would be 10 days by truck and 15 days by rail.
Table 3.4.7 Transit Time Mombasa/Kampala by truck
Transit Time Remark Source and Date 3.4 days Including weighbridge, road block, border crossing CPCS 2010 4.5 days Total 13.5 days minus 9 days in port Nathan 2011 6-8 days Including port and transit clearance A forwarder in Mombasa 2014 7-10 days Including port and transit clearance A forwarder in Kampala 2014 (5.8 days) (Truck turn-round time starting from Mombasa to
Kampala and return to Mombasa) SCEA 2014
2.8 days Truck GPS data Mombasa to Malaba (Added 0.5day by consultants)
TTCANC 2014
10 days Customs electronic data Mombasa to Malaba (Added 0.5day by consultants)
TTCANC 2014
Mombasa Port Master Plan including Dongo Kundu Final Report - October 2015
3. Existing Port Plans and Relevant Information
3-45
Table 3.4.8 Transit Time Mombasa/Kampala by rail
Transit Time Remark Source and Date 4-7 days A large clearing and forwarding agency CPCS 2010 5 days RVR’s own target CPCS 2010
8-14 days Best estimate CPCS 2010 10.3 days Total 19.3 days minus 9 days in port Nathan 2011 10 days From the time when the cargo loaded onto the wagon SCEA 2014
12-14 days Including port and transit clearance A forwarder in Mombasa 2014 14-20 days Including port and transit clearance A forwarder in Kampala 2014
14 days Current average required time KRC in Nairobi 2014 Sources for above 2 tables CPCS: Analytical Comparative Transport Cost Study Along th Northern Corridor Region (October 2010) Nathan: Corridor Diagnostic Study of the Northern & Central Corridors of East Africa (April 2011) SCEA: Shippers Council East Africa Logistics Performance Survey (July 2014) TTCANC: Northern Corridor Transport Observatory Report (April 2014) A forwarder: Interview in Mombasa (September 2014), in Kampala (December 2014) KRC: Kenya Railways Corporation interview in Nairobi (November 2014)
Cost
According to the recent survey by the Shippers Council of East Africa (SCEA) and Transit Observatory Project by Transit Transport Coordination Authority of the Northern Corridor (TTCANC), prevailing rates for transit container by road and by rail are as follows:
Table 3.4.9 One 40’ Container Road Freight Rates from Mombasa (unit: US$)
City Nairobi Kampala Kigali Bujumbura Goma Juba
Country Kenya Uganda Rwanda Burundi DR Congo S. Sudan
Source: East Africa Logistics Performance Survey 2014 and 2012 by SCEA, Transit Observatory Report April 2014 by TTCANC
Table 3.4.10 One 20’ Container Rail Freight from Mombasa (unit: US$)
City Nairobi Kampala Kigali Bujumbura Goma Juba
Country Kenya Uganda Rwanda Burundi DR Congo S. Sudan
distance 530km 930km
2013 1,450 2,400 - - - -
2012 1,110 N/A - - - -
Source: East Africa Logistics Performance Survey 2014 and 2012 by SCEA
Mombasa Port Master Plan including Dongo Kundu Final Report - October 2015
3. Existing Port Plans and Relevant Information
3-46
(3) Pipeline
Figure 3.4.5 Pipeline Network in Kenya Source: KPC
The Kenya Pipeline Company Ltd (KPC) operates a pipeline network in the Northern Corridor.
Total length of existing pipeline is 896 km with following network:
Table 3.4.11 KPC Pipeline Network
Line Section Length (km) Pipe Diameter
(inches)
Mombasa-Nairobi (Line 1) 450 14”
Nairobi-Eldoret (Line 2) 325 8” & 6”
Nairobi-Eldoret (Line 4) 325 (parallel to Line 2) 14”
Sinednet-Kisumu (Line 3) 121 10” Source: KPC
Mombasa-Nairobi section was commissioned in 1978. A larger pipeline (from 14” to 20”) is currently being introduced in this section. The renewal work is scheduled to be completed in 2016. Nairobi-Eldoret and Sinednet-Kisumu sections (The Western Kenya Pipeline Extension: WKPE) was commissioned in 1994.In order to match the rising demand in Western Kenya, additional line of 14” diameter was constructed in Nairobi-Eldoret section (Line 4). From the terminals of the pipeline (Eldoret and Kisumu), the products are transported mainly by road to destinations in the landlocked countries.
The governments of Kenya and Uganda have signed a Memorandum of Understanding in 2004 to
Mombasa Port Master Plan including Dongo Kundu Final Report - October 2015
3. Existing Port Plans and Relevant Information
3-47
promote the extension of the pipeline from Eldoret to Kampala.
The kind of products transported through the pipeline is refined products, such as motor vehicle fuel oil, gas oil, jet fuel and kerosene. Current modal split of oil products is Pipeline 90% and Railway 10%.The volume of products transported through the KPC pipeline system in the past five years is shown in the table below. Mombasa/Nairobi section carries about 60% of the total volume.
Table 3.4.12 KPC Pipeline Throughput
Year 2009 2010 2011 2012 2013
Total throughput (1,000 m3)
4,326 4,204 4,257 4,856 5,167
Source: KPC
There are new oil recoveries in Hoima area of the Lake Albert region in Uganda. Total reserve of two billion barrels has been verified. Several oil companies are participating in this new oil project. This situation may impact the development plan of the pipeline in Uganda.
Feasibility study is currently being conducted for the new pipeline to transport the Ugandan crude oil from Hoima to Lamu Port through Lokichar.
Two pipeline projects are planned in Uganda. One project is a pipeline from Eldoret, Kenya to Kampala (12” line) and the other project is a pipeline from Kampala to Kigali, Rwanda (14” line). Both projects are aiming at 2017 for start-up operation.
3.4.3 Corridor cargo movement
Corridor cargo consists of domestic cargo moving within Kenya and transit cargo moving beyond the border through Kenya. Kenyan domestic cargo accounts for about 70% of total corridor cargo. There is also inter-regional cargo movement between corridor countries such as Kenya and Uganda and Uganda and Rwanda. The cargo volume is minimal at the moment but expected to grow in future in line with the development of inter-regional market. The total cargo volume of domestic and transit has been growing at an average rate of 6.5% per annum over the past five years. Transit traffic shows steady growth during the past five years, rising from 4,981 thousand tons in 2009 to 6,708 thousand tons in 2013, representing an average annual growth rate of 6.8% during the same period.
Table 3.4.13 Mombasa Port Total Throughput (Domestic and Transit)
(unit: 1,000 tons) 2009 2010 2011 2012 2013 Average
growth p.a.
Domestic 13,976 13,395 14,131 15,153 15,425 7.2%
Transit 4,981 5,381 5,595 6,624 6,708 6.8%
Transship 105 158 227 143 174 0.8%
Total 19,062 18,934 19,953 21,920 22,307 6.5%
Source: KPA
Destination/Origin Countries of transit cargo through Mombasa Port and the Northern Corridor includes all the EAC countries and South Sudan, DR Congo and Somalia as well. Uganda is by far the largest among those countries in terms of traffic volume in and out. In 2013, out of 6,708 thousand tons of total transit traffic, 4,912 thousand tons were the cargo to/from Uganda, which represents 73.2% of total transit traffic of Mombasa Port. Rapid growth of South Sudan cargo is also notable.
Mombasa Port Master Plan including Dongo Kundu Final Report - October 2015
3. Existing Port Plans and Relevant Information
3-48
Table 3.4.14 Mombasa Port Transit Traffic by Country
Northern Corridor traffic (including both Domestic and Transit) mainly flows one-way. In 2013, 85.8% of the total traffic was inbound traffic. Inbound traffic includes massive movements of dry bulk cargo and liquid oil cargo which flows only one-way as basic materials for economic activities in Kenya and other hinterland countries. Principal import bulk commodities include; Petroleum oil and products, wheat in bulk and clinker.
Table 3.4.15 Mombasa Port Total Throughput (Import & Export)
Import GC in Container GC conventional Dry Bulk Liquid Bulk
4,086 1,359 4,641 6,431
4,591 1,397 3,827 6,386
5,226 1,298 3,807 6,807
5,954 1,298 3,807 6,607
5,974 1,726 4,913 6,537
(GC 40%) (Bulk 60%)
Import Total 16,507 16,201 16,938 18,732 19,150 85.8%
Export GC in Container GC conventional Dry Bulk Liquid Bulk
1,952
269 62
167
2,218
192 70 95
2,337
171 122 158
2,626
153 106 160
2,690
128 65
100
Export Total 2,450 2,575 2,788 3,045 2,983 13.4%
Transship Total 105 158 227 143 174 0.8%
Grand Total 19,062 18,934 19,953 21,920 22,306 100%
Source: KPA
Same trend is observed for container traffic (fully loaded). In the case of transit full container movement, 85% of total containers are import/inbound containers on average over the past five years. The volume of outbound/export general cargo from the hinterland landlocked countries is inadequate to be packed in containers. Thus the majority of containers delivered at the hinterland countries are returned to Mombasa in empty condition.
Table 3.4.16 Transit full containers (Import & Export)
Total 131,849 138,710 166,415 188,414 191,908 100%
Source: KPA
Mombasa Port Master Plan including Dongo Kundu Final Report - October 2015
3. Existing Port Plans and Relevant Information
3-49
3.4.4 Lamu Port and New Transport Corridor Development to Southern Sudan and Ethiopia (LAPSSET)
Figure 3.4.6 LAPSSET Corridor full view Source: LCDA
(1) Introduction
“Study for LAPSSET Corridor FS & Lamu Port MP & DD” contains the feasibility study and master
Mombasa Port Master Plan including Dongo Kundu Final Report - October 2015
3. Existing Port Plans and Relevant Information
3-50
plan of New Lamu Port and all components necessary for the LAPSSET Corridor. The project is defined as one of the flagship projects in the government long-term policy program “Kenya Vision 2030”.
Under the project, a new transport corridor from the new port of Lamu stretching through the northern part of Kenya and branching at Isiolo to Ethiopia and South Sudan will be developed. The main towns along the Corridor’s Lamu-Nakodok and Isiolo-Moyale routes will include; Nakodok, Lokichokio, Lodwar, Maralal, Isiolo, Mardsbit, Laisamis and Moyale.
The project was initially conceived in the 1970s but is only now beginning to materialize.
The official ground-breaking ceremony was held in March 2012 in Lamu attended by the Presidents of Kenya and South Sudan and the Prime Minister of Ethiopia.
The LAPSSET Corridor Development Authority (LCDA) was established in March 2013 through the Presidential Order. The Authority is domiciled under the Presidency. The functions of the Authority include followings:
Plan, coordinate and sequence the Project in collaboration with implementing ministries and agencies
Provide leadership, direction and guidance in operations and implementation of the Project Mobilize funds to project components using various resources including government
budget, donor loans, infrastructure bonds and private finance Promote the competitiveness and use of the Corridor for the transport of goods and people
a) LAPSSET Corridor Feasibility Study
According to the Terms of Reference for the services, there are seven subsectors involved in the services, i.e. port, railway, highway, oil pipeline, oil refinery, resort city, and airport. The port implies the new Lamu Port at Manda Bay. The railway and highway are the lines connecting Lamu Port and the Sudan border, i.e. Nakodok, and the Ethiopian border, i.e. Moyale. The oil pipeline is from Southern Sudan to Lamu Port. The oil refinery is to be located at Lamu.
The objectives of the LAPSSET Corridor Study are:
To identify and concretely define the dimensions of a new transport corridor complete with the above basic transport infrastructure meant to initially improve access and connectivity of transport between Kenya and Southern Sudan and between Kenya and Southern Ethiopia, stimulate economic activity in the Northern Province as well as in the neighboring countries and beyond.
To evaluate and assess the future trade and transport needs and projected demand and define the strategic network of transport routes and modes that will optimally satisfy the expected demand.
To undertake a full technical, economic and financial feasibility study on the development of the proposed Port of Lamu at Manda Bay and Lamu-Southern Sudan-Ethiopia Transport Corridor components.
To propose public-private partnership (PPP) options for its development and implementation.
To advise the Government on appropriate regulatory and institutional framework to support the operationalization of the components of the Lamu-Southern Sudan-Ethiopia Transport Corridor, the Lamu Port at Manda Bay and will provide proposals on at least three investment models, their costs, and their financing options.
b) Lamu Port Detailed Design Study
Following objectives are included:
To prepare a Master Plan for Development of the Lamu Port at Manda Bay, To prepare Detailed designs of the First Three Berths and Associated Infrastructure, and
Mombasa Port Master Plan including Dongo Kundu Final Report - October 2015
3. Existing Port Plans and Relevant Information
3-51
To prepare tender documents for the First Three Berths and Associated Infrastructure.
The required berths to be designed in DD at the new Lamu Port are a bulk berth for 100,000 DWT bulk ships, a container berth for 100,000 DWT container ships and a general cargo berth for 30,000 DWT general cargo ships. Three additional sub-sectors are indispensable to be incorporated in the services, i.e. electricity supply, water supply and communication network, as the basic infrastructure which enables the other sub-sector facilities to be operational.
The target year of the plans in the services is set at 2030. It is noted that the study area is limited in the territory of Kenya.
(2) Conceptual Plan of LAPSSET Corridor Development
a) Concept of Transport Corridor
A new transport corridor to the northern region has been proposed in order to meet requirements from Southern Sudan and Ethiopia who have sought suitable transportation routes including seaport outlets and Kenya who has also planned to develop the northern part of the country through the establishment of new transportation routes and other infrastructures. This new corridor is planned to be comprised of railway, highway and oil pipeline. The target year for all components of the LAPSSET Corridor will be year 2020 in tandem with the Government’s “Kenya Vision 2030”.
Lamu Port has been planned as a new gateway of the proposed Corridor to complement the existing Mombasa Port. It will afford added convenience for the movement of people and goods for Southern Sudan, Ethiopia as well as Kenya. The port must also be designed with adequate capacity to be able to respond to the high volume of cargoes for export and import anticipated by the year 2030.
The Figure 3.4.7 shows a tentative implementation schedule for the Corridor (Railway, Highway and Oil Pipeline), Airport, Resort Cities and Oil Refinery.
Figure 3.4.7 Implementation Schedule of LASSET Corridor Source: Study for LAPSSET Corridor FS & Lamu Port MP & DD by JPC & BAC/GKA JV
Total project cost is estimated at around US$ 17 billion. Outline of Project Infrastructure Components is as follows:
Infrastructure/Year
Lamu Port
Railway
Lamu to Isiolo
Isiolo to Nakodok
Isiolo to Moyale
Isiolo to Nairobi
Highway
Pipeline
Others (Airport, Resort & Oil Refinery)
2017 2018 2019 20202011 2012 2013 2014 2015 2016
Mombasa Port Master Plan including Dongo Kundu Final Report - October 2015
3. Existing Port Plans and Relevant Information
3-52
Table 3.4.17 LAPSSET Project Components
Component Quantity
Cost estimate (million US$)
1 Lamu Port 32 berths 3,095 2 Railway 1,710 km 7,100 3 Highway 880 km 1,396 4 Crude Oil Pipeline 1,320 km 3,060 5 Product Pipeline 990 km 885 6 Resort Cities 3 places 1,212 7 Airports 3 places 188
Total Cost Estimate 16,936 Source: LCDA
b) Demand Forecast
The cargo demand forecast has been undertaken substantially based on the projections of diversion of port cargoes from Djibouti that currently serves as the main port for Ethiopia trade and Port Sudan that serves as the main port for Southern Sudan trade. It is also based on the projections of diversion of local products currently transported through the Northern Corridor transport system to Lamu and on projected diversion of goods expected to be transported from Lamu to the Central region of Kenya to meet local demand.
The cargo volume for each country that directly relates to the LAPSSET transport corridor and its gateway port New Lamu Port by target year 2020 and 2030 is projected and summarized as shown in Table 3.4.19.
Almost half of the cargo demand in Kenya is assumed to be derived from the large-scale agricultural development and increased output of agricultural products comprising mainly cash crops, i.e. fruits and vegetable along the entire area of eastern part of the Tana River basin. This implies that this section of the LASSET Corridor will contribute directly to the economy of Kenya.
The total port cargo demand forecast is summarized in Table 3.4.20. The forecasted cargo volume in the New Lamu Port accounts for around 30-40% of the total forecasted cargo volumes in Kenya. Around 60% of the total forecasted cargo volumes in the New Lamu Port comprise import and export cargoes to/from Ethiopia and South Sudan. The major reason why the forecasted cargo volumes in the New Lamu Port are large is that this port can accommodate larger sized vessels than at Mombasa Port due to its greater water depth.
Table 3.4.18 Cargo Demand Forecast 2010, 2020, and 2030
Total 4,417,000 4,200,000 8,617,000 5,521,000 9,723,000 23,861,000
Source: Study for LAPSSET Corridor FS & Lamu Port MP & DD by JPC & BAC/GKA JV
Table 3.4.20 Total Cargo Demand Forecast of Kenya
(Unit: Million tonnes per year)
Port/Year 2020 2030
New Lamu Port 13.5 (27%) 23.9 (40%)
Mombasa Port 25.7 (53%) 34.8 (60%)
Total 49.2 (100%) 58.7 (100%)
Source: Study for LAPSSET Corridor FS & Lamu Port MP & DD by JPC & BAC/GKA JV
c) Recommendation
New Lamu Port as the Terminal Port of Important Regional Transport Corridor
The cargo demand forecast for the New Lamu Port suggests that Kenya will have another port similar in scale to that of Mombasa Port. However, the New Lamu Port functions as the terminal port of the international/regional transport corridor. The port will be a key regional port for the transport corridor in the African continent.
New Lamu Port as an Alternative Port of Mombasa Port
The capacity of land transport infrastructure need to be expanded to deal with the increasing cargo levels at Mombasa Port and the Northern Corridor or transport cost will increase to prohibitive levels due to transport congestion and port road conditions. The new Lamu Port will function as an alternative port of Mombasa Port when the linkage with domestic highway and railway network with the port is realized.
Stepwise Development of Railway Network
Mombasa Port Master Plan including Dongo Kundu Final Report - October 2015
3. Existing Port Plans and Relevant Information
3-54
Stepwise Development of New Lamu Airport
Highway Network
The highway network needs to be completed regardless of the development scenario. Prior to the completion of Phase 1 of the New Lamu Port Development Project the highway connecting the New Lamu Port and Mombasa or any connecting point with the Northern Corridor is imperative.
Establishment of Multimodal Transport Linking Facility
Isiolo will become the point of junction for various regional transport infrastructure and transport mode. The estimated cargo passing through this junction can be estimated at around 29.5 million tonnes in 2020 and 34.5 million tonnes in 2030, respectively. The cargo is mixed with international and domestic cargoes. Thus, it is justifiable to establish the inland port or inland container depot for container cargoes.
(3) New Lamu Port
The design vessels can be defined by specifying type of cargoes to be handled and size of the vessels. In the case of Lamu Port, the forecasted commodities consist of the following five kinds:
Break bulk such as general cargoes to/from neighboring countries, construction materials, livestock, and others.
Containerized cargoes such as machinery, consumables, and others. Dry bulk such as fertilizer, grain, and coal. Liquid bulk such petroleum, LNG, and edible oil, and Others such as refrigerated cargoes (mostly containerized).
Special cargoes such as crude oil for export and coal and LNG for import are to be handled at designated offshore buoys and specialized berths in the Manda Bay, respectively. The other ordinary cargoes are to be handled at the commercial port, including general cargoes berths for break bulk cargoes, container berths for containerized cargoes, and bulk berths for dry bulk cargoes. Edible oil should be handled at specialized berths in the commercial port.
Size of the design ships corresponding to the above three types of cargoes are determined to be 30,000 DWT for general cargoes, 100,000 DWT for containerized cargoes, and 100,000 DWT for dry bulk cargoes, taking into consideration of the following factors:
Expected role and competitive position of Lamu Port in the region, Expected cargo volumes and necessary capacity of ships at the target year 2030, Ship sizes actually calling at the present Mombasa Port, Number and composition of ship sizes commissioned in the world shipping, Trend of shipbuilding, especially for container ships, which has been enlarging
continuously, and Capacity and efficiency of the port.
The dimensions and required number of the berths are shown in Table 3.4.21. It is proposed to construct 32 berths by the year 2030.
Mombasa Port Master Plan including Dongo Kundu Final Report - October 2015
3. Existing Port Plans and Relevant Information
3-55
Table 3.4.21 Dimension and Proposed Number of Berths
Ship Type Ship Dimension (m) Berth Dimension (m) 2015
Berth No. 2030
Berth No. Loa/Lpp Breadth Draft Length Depth
Container 100,000DWT
350/335 42.8 14.7 400 16.0 400m x 1 400m x 6 =2,400m
General Cargo 30,000DWT
182/171 28.3 10.5 240 12.0 240m x 1 240m x 21 =5,040m
Bulk Cargo 100,000DWT
258/246 39.8 15.5 330 17.5 330m x 1 330m x 4 =1,320m
Source: Study for LAPSSET Corridor FS & Lamu Port MP & DD by JPC & BAC/GKA JV
Figure 3.4.8 Lamu Port 2030 stage Source: JPC
Lamu Port is situated in Manda Bay which is well sheltered from the outer ocean and has deep waters along the main channel. Lamu Port is the key pull factor for all the LAPSSET corridor project components.
The Port Master Plan includes 32 berths with a total quay length of over 9,000m. By the target year 2030, twenty (20) berths will be developed while another twelve (12) berths can be considered during the long term plan beyond 2030. In August 2014, the construction contract of the first three berths was signed between KPA and the contractor, China Communications Construction Company (CCCC). The contract price is US$ 488 million. The construction work started following the signing of the contract.
Mombasa Port Master Plan including Dongo Kundu Final Report - October 2015
3. Existing Port Plans and Relevant Information
3-56
Project timeline is 3 years from the date of construction commencement.
It is anticipated that development of the first three berths will trigger the subsequent development of all other corridor systems such as main highway, oil pipeline and railway which feeds in and out of the port. KPA intends to develop the first three berths as an incentive to attract private sector participation in Lamu port operations and investment in the rest of the 29 berths. A Bulk Berth (length: 400m, depth: -17.5m), Container Berth (400m, -16.0m), and General Cargo Berth (400m, -16.0m) have been designed for the initial stage.
Figure 3.4.9 Initial three berths of Lamu Port Source: JPC
Construction works on the port building and port police station building have been commenced prior to the construction of berths and are scheduled to be completed shortly.
(4) Corridor
The LAPSSET Corridor consists of three major transport infrastructure components, the railway, highway and pipeline. The three components are designed to run in parallel to one another in view of the need for road transport in the construction and maintenance of all the other components. The cross section of the Corridor is planned to have a total width of 200m at standard sections where the width of the corridor is shared by the three transport infrastructure components. The width allowance for each component is designed as follows; railway (60m), Subsidiary (10m), highway (100m) and pipeline (30m).
Mombasa Port Master Plan including Dongo Kundu Final Report - October 2015
3. Existing Port Plans and Relevant Information
3-57
Figure 3.4.10 Corridor Standard Cross Section (1) Source: JPC
Figure 3.4.11 Corridor Standard Cross Section (2) Source: JPC
(5) Railway
A railway line will run from Lamu to Juba, a distance of 1,710 km.
The railway construction plan is made based on standard gauge railing for the following segments:
Table 3.4.22 LAPSSET Railway Project
Segment Section Length
Segment 1& 2 Lamu Main Section (Lamu – Isiolo) 532km
It is estimated that number of freight trains on the main Lamu Section will reach 78 trains per day at the busiest section between Lamu – Isiolo in 2030. Until the target year of 2030, the railway will be comprised of a single track line and shall be operated by diesel driven system.
According to the plan, the share of railway transportation volume constitutes more than 90% of long-hauling cargo movement between Lamu and South Sudan/Ethiopia.
(6) Highway
LAPSSET road project will run from Lamu to Isiolo and onwards to Nakodok and Moyale. This 2- lane highway and will cost an estimated US$ 1.4 billion. The highway construction plan is made for the following segments:
Mombasa Port Master Plan including Dongo Kundu Final Report - October 2015
3. Existing Port Plans and Relevant Information
3-58
Table 3.4.23 LAPSSET Road Project
Segment Section Length
Segment 1 Lamu – Garissa 252km
Segment 2 Garissa - Isiolo 280km
Segment 3 Isiolo – Lokichar 345km
Some LAPSSET road construction works have already commenced. Construction and upgrading of a 136 km section between Isiolo and Merile River, part of Isiolo – Moyale Section (Segment 5), was commenced in 2007 and completed in 2011. The road was upgraded into a 2 lane tarmac road. The construction of remaining portion of Isiolo – Moyale Section, from Mrile River upto Moyale, is currently in progress.
Crude Oil Pipeline for sending crude oil from South Sudan to Lamu via Isiolo is planned parallel to the highway routes at flat areas, and via a separate route at hilly areas with a capacity of 500,000 barrels per day.
The governments of South Sudan, Uganda and Kenya are currently holding negotiations on the Inter-Governmental Agreement regarding the crude oil pipeline connecting the countries and leading to Lamu Port. The project will be developed through a BOOT scheme to enable the private sector to take the lead in the delivery of the project. Expression of interest for the tender for the development of the pipeline will be announced in due course.
Product Oil Pipeline for refined oil (diesel, kerosene and gasoline) is also planned with a capacity of 97,900 barrels per day. The pipeline will be used supply Kenyan domestic demand as well as 30% of consumption of Ethiopia.
(8) Resort cities
The development of resort cities is planned at Lamu, Isiolo and Lake Turkana near Lodwar in an effort to create a new tourism corridor. In 2012, the Isiolo County Council was asked to set 6,500 acres of land aside for establishment of the resort city. The local government officials, legislators and
Mombasa Port Master Plan including Dongo Kundu Final Report - October 2015
3. Existing Port Plans and Relevant Information
3-59
professionals were briefed by the central government officials on the importance of the resort city. A PPP scheme will be adopted for the development.
(9) Airports
In the LAPSSET project, airports at Lamu, Isiolo and Lokichokio are earmarked as main airports of the region. The government has embarked on improving existing facilities at the three airports to provide for air travel services to enhance accessibility to the corridor.
Extension of the runway from 1,100m to 2,300m has already been completed at Lamu Airport. Improvement work for the airport terminal building has also been completed. The construction of the new Lamu International Airport is proposed in the FS. Isiolo Airport will have a 1,500 m runway; construction work of the terminal building is being planned. The existing Lokichokio Airport which has an 1,800 m runway is undergoing rehabilitation and improvement works.