Momentary Interruptions Can Derail the Train of Thought
Erik M. AltmannMichigan State University
J. Gregory TraftonNaval Research Laboratory, Washington, District of Columbia
David Z. HambrickMichigan State University
We investigated the effect of short interruptions on performance of a task that required participants tomaintain their place in a sequence of steps each with their own performance requirements. Interruptionsaveraging 4.4 s long tripled the rate of sequence errors on post-interruption trials relative to baselinetrials. Interruptions averaging 2.8 s long—about the time to perform a step in the interrupted task—doubled the rate of sequence errors. Nonsequence errors showed no interruption effects, suggesting thatglobal attentional processes were not disrupted. Response latencies showed smaller interruption effectsthan sequence errors, a difference we interpret in terms of high levels of interference generated by theprimary task. The results are consistent with an account in which activation spreading from the focus ofattention allows control processes to navigate task-relevant representations and in which momentaryinterruptions are disruptive because they shift the focus and thereby cut off the flow.
Understanding the mechanisms of cognitive control is one of themain aims of cognitive psychology, with consequences for under-standing human abilities and brain–behavior relationships in awide range of domains and populations. Cognitive control isexpressed in many ways, one of which involves selecting the nextthought to focus on when there are multiple options and wheninterruptions or distractions can intervene. An example is a con-versation, which generally follows a coherent thread. If an inter-ruption occurs, such as an interlocutor’s cell phone ringing, thethread may get lost, leading to a “Where were we?” moment (e.g.,Trafton, Jacobs, & Harrison, 2012).
An important question for practical and theoretical reasons isjust how minimal such an interruption can be and still affect thetrain of thought. For the cell phone example, the question iswhether the interlocutor need only attend to his or her phone for acouple of seconds—to shut it off, for example, rather than toactually take the call. In safety-critical contexts, the question iswhether it is safe to interrupt someone even for a few seconds inthe middle of a procedure without increasing the chance of error.
To operationalize “train of thought,” we used a task in whichsubtasks—or what we call steps—have to be performed in aparticular sequence, and correct performance depends on remem-bering one’s place in this sequence. In behavioral research, se-quential tasks like this arise mainly in two domains, one focusedon errors in sequential action selection, and the other on effects oftask interruption. In the error domain, the focus has been on“routine” tasks (Norman & Shallice, 1986), like coffee-making(Botvinick & Bylsma, 2005; Botvinick & Plaut, 2004; Cooper &Shallice, 2000, 2006), packing a lunch (Cooper, Schwartz, Yule, &Shallice, 2005), or cleaning the house (Botvinick & Plaut, 2004).However, routine tasks are generally performed with high accu-racy, so the error data they generate are sparse. Reason (1990) useddiary methods to collect errors in routine tasks over long periods,and others have focused on neurological patients for whom routinetasks are difficult (Schwartz, Reed, Montgomery, Palmer, &Mayer, 1991). In the task interruption domain, sequential taskswith “post-completion” steps (Byrne & Bovair, 1997; Li, Bland-ford, Cairns, & Young, 2008; Trafton, Altmann, & Ratwani, 2011)generate elevated error rates on those steps, but by design thosesteps are still a small proportion of the total. In a study ofinterrupted routine performance, Botvinick and Bylsma (2005) hadto have their participants make 50 actual cups of coffee to generateenough errors to analyze.
We therefore saw a need for a procedure that generates rich andinterpretable data on sequence errors, from healthy populationsperforming under controlled laboratory conditions. To meet thisneed, we developed a sequential task that combines a routinesequencing component with relatively complex individual steps.An important criterion was that every participant should effec-tively be a trained expert on the step sequence, so that sequenceerrors could be attributed to on-line control mechanisms ratherthan lack of knowledge about the sequence. We therefore built the
This article was published Online First January 7, 2013.Erik M. Altmann, Department of Psychology, Michigan State Univer-
sity; J. Gregory Trafton, Naval Research Laboratory, Washington, Districtof Columbia; David Z. Hambrick, Department of Psychology, MichiganState University.
This research was supported by grants from the Office of Naval Re-search to Erik M. Altmann (N000140910093) and J. Gregory Trafton(N0001412RX20082, N0001411WX30014). The authors thank Rick Coo-per and Dave Plaut for their comments during the review process, MarkBecker and Amber Markey for comments on earlier drafts, and AmberMarkey for collecting the data.
Correspondence concerning this article should be addressed to Erik M.Altmann, Department of Psychology, Michigan State University, EastLansing, MI 48824. E-mail: [email protected]
task around a word functioning as an acronym, with each letter ofthe word identifying a step and the word itself specifying the stepsequence. The operations for each step were mnemonically linkedto the letter for that step but were themselves “nonroutine” (Nor-man & Shallice, 1986) in that the stimulus was randomly con-structed and therefore had to be newly parsed each time a step wasperformed. The task rules and responses also differed for eachstep, requiring an explicit shift of mental focus in the transitionfrom one step to the next, and making for a task representationwith many elements; both sequential focusing and large taskrepresentations have been identified as potentially taxing generalcognitive ability (Duncan et al., 2008). In all, the task is more likeapplying a well-learned statistical procedure to new data, forexample, than it is to coffee making—with the proviso that allliterate adults are in effect trained experts in its sequential struc-ture.
In the remainder of the article, we first describe our task andthen present two experiments. Experiment 1 includes a manipula-tion to examine the influence of the kind of material processedduring the interruption, and Experiment 2 tests effects of especiallyshort interruptions; the methods are the same otherwise, so wereport the experiments together. In the four sets of analyses thatfollow we (a) examine effects of interruption on different behav-ioral measures (sequence errors, nonsequence errors, and responselatencies); (b) ask whether these effects interact with differences inthe difficulty of individual steps in the step sequence; (c) examinedistributions of sequence errors as a function of distance from thecorrect step; and (d) examine the reliability of sequence errors asa measure of individual differences. In the general discussion, wedevelop a theoretical perspective on the suite of empirical results.
The Experimental Task
The primary task—the one that was periodically interrupted—isdefined by the acronym UNRAVEL. Each letter identifies a step,and the letter sequence defines the order in which the steps are tobe performed. The sequence is performed in a cycle, with Lfollowed immediately by U, producing continuous performancethat can be interrupted many times.
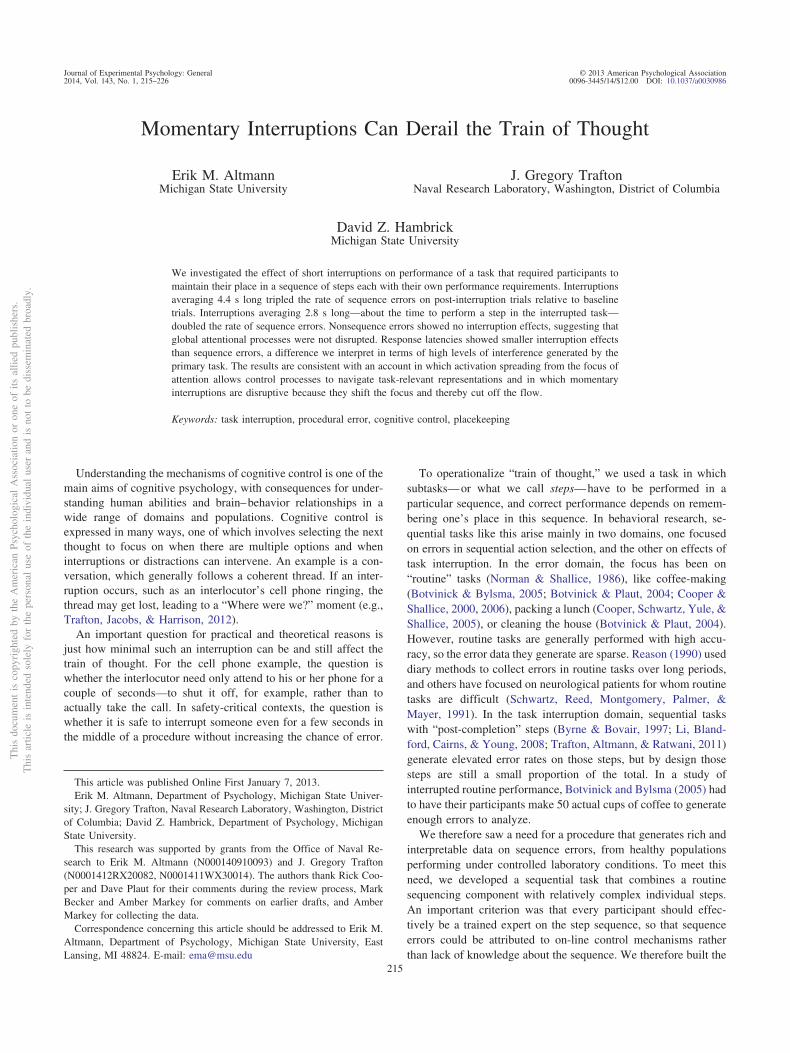
Figure 1a shows two sample stimuli that illustrate the nature ofthe task. Each stimulus has various features: two characters (aletter and a digit), a font style applied to one character (underlineor italic), a color applied to one character (red or yellow), and onecharacter outside the gray outline box (above or below). (The boxappears in the same fixed location on each trial.) Each step of theUNRAVEL sequence requires a two-alternative forced choiceapplied to one feature. For example, the U step involves choosingwhether the font style is underline or italic, and the R step involveschoosing whether the color is red or yellow. Not all the steps arethis directly perceptual; the N step, for example, requires a choiceabout whether the letter in the stimulus is near to or far fromthe start of the alphabet. For each step, its letter in the sequencemnemonically relates to one of the two candidate responses (e.g.,“u” for underline, “n” for near to, “r” for red; their opposites are“i” for italic, “f” for far, and “y” for yellow, respectively).
Figure 1b shows the choice rules and responses for all sevensteps. The candidate responses are all unique, meaning that aresponse made by a participant tells us which step he or shethought was correct on that trial, and thus lets us score sequence
errors. We can also score nonsequence errors, meaning trials onwhich the selected step was correct, but the response was incorrectgiven the stimulus.
Constructing the stimulus for a given trial involves randomlyselecting a letter and a digit and randomly assigning them a left-rightorder, then randomly and independently assigning a font style, color,and vertical location to one character or the other.1 This method ofconstruction meant that perceptual search was always required toisolate the correct feature for the current step, because the location ofthe feature was never predictable, and different features were nevercorrelated. This perceptual search always occurred in a context ofinterference from features relevant to other steps, because each stim-ulus afforded performance of all steps.
The task imposed various kinds of load. There were severalcognitive and perceptual operations involved on each step, includ-ing placekeeping operations to select the step to perform, opera-tions to focus on the choice rule for that step, perceptual search forthe associated feature, and response selection. Sources of interfer-ence included the many stimulus features and responses that werenot currently relevant; stale working memory contents, such asplacekeeping information and stimulus and response elementsfrom previous trials; and the multiple meanings of task elements.An example of these multiple meanings is that the letter U repre-sents, at various stages and times, a step in the sequence, one oftwo possible responses for that step, and a stimulus feature requir-ing an “f” response when the step is N (see Figure 1b). Thus, theletter U in the stimulus could prime several different conflictingelements of the task representation.
Interruptions occurred every six trials on average (a trialbeing a performed step). For a given run of trials following aninterruption, the length of the run was computed as the sum of3 and a rounded sample from an exponential distribution withmean 3. The purpose of the exponential sample was to producea relatively flat hazard function for the onset of the interruption,starting after the first three trials. The average of six trials perrun was one less than the length of the UNRAVEL sequence, sothat interruptions would not always occur at the same point inthe sequence.
An interruption was triggered by the response to a trial. Theinterruption began with the interruption stimulus immediatelyreplacing the primary-task stimulus. Figure 1c shows a sampleinterruption stimulus, made up of a set of characters to type(letters, in this case) and a box to type them into. The partici-pant’s task was simply to type the characters (the “code”) andpress the Return key (meaning that the temporal duration of theinterruption was self-paced). The number and type of charactersin the set (letters or digits) varied between groups, as described
1 Formally, for purposes of stimulus construction, a stimulus has fiveattributes, each with four candidate values (in parentheses): letter (A, B, U,X), digit (1, 2, 8, 9), font style (left-underline, left-italic, right-underline,right-italic), color (left-red, left-yellow, right-red, right-yellow), and height(left-above, left-below, right-above, right-below). For font style, color, andheight, the “left” and “right” constituents of the candidate values refer tothe left and right character positions, and the “above” and “below” con-stituents are relative to the box. On a given trial, the left-right order of theletter and digit attributes is randomly determined, then a value is randomlysampled for each attribute, subject to the constraint that a value cannotrepeat between trials. For example, Stimulus 1 in Figure 1a has values 9,B, left-underline, left-red, and right-below.
Thi
sdo
cum
ent
isco
pyri
ghte
dby
the
Am
eric
anPs
ycho
logi
cal
Ass
ocia
tion
oron
eof
itsal
lied
publ
ishe
rs.
Thi
sar
ticle
isin
tend
edso
lely
for
the
pers
onal
use
ofth
ein
divi
dual
user
and
isno
tto
bedi
ssem
inat
edbr
oadl
y.
216 ALTMANN, TRAFTON, AND HAMBRICK
below. The cursor began in the box, so mouse movements werenot required, and the characters typed into the box remainedvisible so they could be compared to the presented set. If theparticipant typed the set correctly, pressing Return ended theinterruption and triggered immediate onset of the next trial ofthe primary task. If the participant made any errors typing theset, no feedback was given after individual errors, but pressingReturn cleared the box and displayed a new set of characters forthe participant to type.
Experiments 1 and 2
Our two experiments were identical except for the numberand type of characters presented for typing during interruptions.In Experiment 1, there were four characters per set, with char-acter type manipulated between participants. For the lettersgroup, the characters for each set were sampled randomlywithout replacement from the 14 responses to the UNRAVELtask (Figure 1b). For the digits group, the characters for each set
Figure 1. a. Two sample stimuli for the UNRAVEL task (the 9 is red and the X is yellow). b. Responsemappings for the UNRAVEL task, and responses for the two sample stimuli in Panel a. c. Sample stimulus forthe interrupting task, after two letters have been typed.
Thi
sdo
cum
ent
isco
pyri
ghte
dby
the
Am
eric
anPs
ycho
logi
cal
Ass
ocia
tion
oron
eof
itsal
lied
publ
ishe
rs.
Thi
sar
ticle
isin
tend
edso
lely
for
the
pers
onal
use
ofth
ein
divi
dual
user
and
isno
tto
bedi
ssem
inat
edbr
oadl
y.
217MOMENTARY INTERRUPTIONS
were selected randomly without replacement from the digits1–9. We expected that interruption effects would be greater forthe letters group because participants would find it more diffi-cult to use external memory for placekeeping. That is, weexpected that participants would generally touch type the char-acters, given that typing is generally automatized in the popu-lation we were sampling, and that touch typing would make itdifficult to keep a finger on the key corresponding to the mostrecently performed step (or the correct next step, depending onthe hypothetical strategy).
In Experiment 2, we asked if interruptions could be even shorterthan four characters and still be disruptive. Accordingly, therewere two letters per set, sampled as in Experiment 1.
Method
Participants
Participants were undergraduates from Michigan State Univer-sity. There were 100 in each group of Experiment 1 and 100 inExperiment 2, for a total of 300. Nine additional participants werereplaced because their accuracy was below a threshold, as de-scribed below.
Procedure
Participants were tested individually. A session began with astep-by-step introduction to the UNRAVEL step sequence. Theintroduction emphasized the acronym, showing how each step inturn corresponded to a constituent letter, and then presented asummary screen showing the choice rules for each step and theletters spelling out the word. After this, to ensure that participantsunderstood the task, there were 16 trials during which the com-puter required the participant to make the correct response on eachtrial before allowing the participant to move on. This 16-trialsequence was interrupted twice, to illustrate for participants howthey were supposed to pick up after an interruption where they hadleft off. The experimenter remained present during this period tohelp if necessary. A sheet of paper with the choice rules for theUNRAVEL sequence remained visible to the side of the computerthroughout the session.
In preparation for the experimental phase of the session, partic-ipants were reminded to “please try to keep your place in theUNRAVEL sequence,” and to “please try to pick up in the se-quence where you left off” after an interruption. The experimentalphase consisted of four blocks, each with 10 interruptions and thusabout 66 trials. A session took about 30 min to complete.
Sequence errors were coded with respect to the previous step.For example, if steps U, R, and A were performed in succession,R would be a sequence error, because N was skipped, but A wouldbe correct, because A follows R in the UNRAVEL sequence.
After each block the participant was given his or her score,computed as the percentage of trials that block for which the stepand response were both correct. If the score was above 90%, theparticipant was asked to go faster. If the score was below 70%, theparticipant was asked to be more accurate and that block wasexcluded from analysis (six cases: two in Experiment 1 letters,three in Experiment 1 digits, one in Experiment 2). If a participantscored below 70% on two or more blocks (eight cases: three in
Experiment 1 letters, one in Experiment 1 digits, four in Experi-ment 2) or did not score significantly above chance on the first trialafter an interruption (one additional case, in Experiment 1 letters),he or she was replaced. No feedback was given after individualtrials.
Analyses
We analyze the results in four sections, and here give a briefpreview of each. Analysis 1 examines interruption effects bycomparing performance across successive trials following an in-terruption (the first five). To preview, interruption effects regis-tered on the first trial after the interruption, with later trials notdiffering from one another, and the effects registered most stronglyfor sequence errors, with nonsequence errors showing no effectand response latencies a weak effect.
Analysis 2 examines differences across the steps of theUNRAVEL sequence. Step difficulty varied widely, as reflected inlarge differences in nonsequence errors and response latencies, butdid not interact strongly with interruption effects, suggesting thatthe latter are reasonably general and not tied to specific choicerules.
Analysis 3 examines sequence errors as a function of distancefrom the correct step (i.e., the number of steps skipped backwardor forward in the sequence). The distributions followed gradients,with fewer errors at greater distances, though the gradients weremost clearly defined on trials other than the first after an interrup-tion. The gradients also showed asymmetries that promise to helpconstrain models of the underlying mechanisms.
Finally, Analysis 4 examines the reliability of sequence errors asa measure of individual differences. Reliability was as high forsequence errors as for other measures of cognitive control, sug-gesting that our task could be used in conjunction with others tomeasure sequential control at the latent level, for example, orpossibly to predict individual differences in general ability (Dun-can et al., 2008).
Analysis 1: Interruption Effects
In this analysis we examined the effects of interruption on threemeasures of interest. The first measure was sequence errors, de-fined as the proportion of trials on which the performed step wasnot the immediate successor in UNRAVEL to the step per-formed on the previous trial. The second measure was nonse-quence errors, defined as the proportion of trials on which thecorrect step was selected but the incorrect choice was made giventhe stimulus. The third measure was response latencies, measuredon trials on which the step and response were both correct. We didnot trim response latencies, and simply took the mean for eachparticipant for each cell of the design (the results were qualita-tively unchanged with participant medians). In this analysis wealso report mean interruption duration and the effect on this of thegroup factor in Experiment 1 (letters vs. digits).
In this analysis we separate the data by position (1, 2, 3, 4, 5) ofa trial after an interruption, where Position 1 is the first trial afterthe interruption, Position 2 is the second, and so on. Although runscould be longer than five trials, we stop at Position 5 becausevariability on later positions begins to increase with fewer obser-vations. (Under the method for determining run length that we
Thi
sdo
cum
ent
isco
pyri
ghte
dby
the
Am
eric
anPs
ycho
logi
cal
Ass
ocia
tion
oron
eof
itsal
lied
publ
ishe
rs.
Thi
sar
ticle
isin
tend
edso
lely
for
the
pers
onal
use
ofth
ein
divi
dual
user
and
isno
tto
bedi
ssem
inat
edbr
oadl
y.
218 ALTMANN, TRAFTON, AND HAMBRICK
noted earlier, more than half of all runs extended to five trials, andfewer than half extended to six trials.)
In this analysis we collapse over the factor step (U, N, R, A, V,E, L), because when both position and step are included in thedesign there are missing cases (i.e., not every Position � Step �Participant cell contains trials). Nevertheless, the step factor ismeaningful, and we examine its influence in Analysis 2 (to fore-shadow, step does not strongly interact with interruption effects).
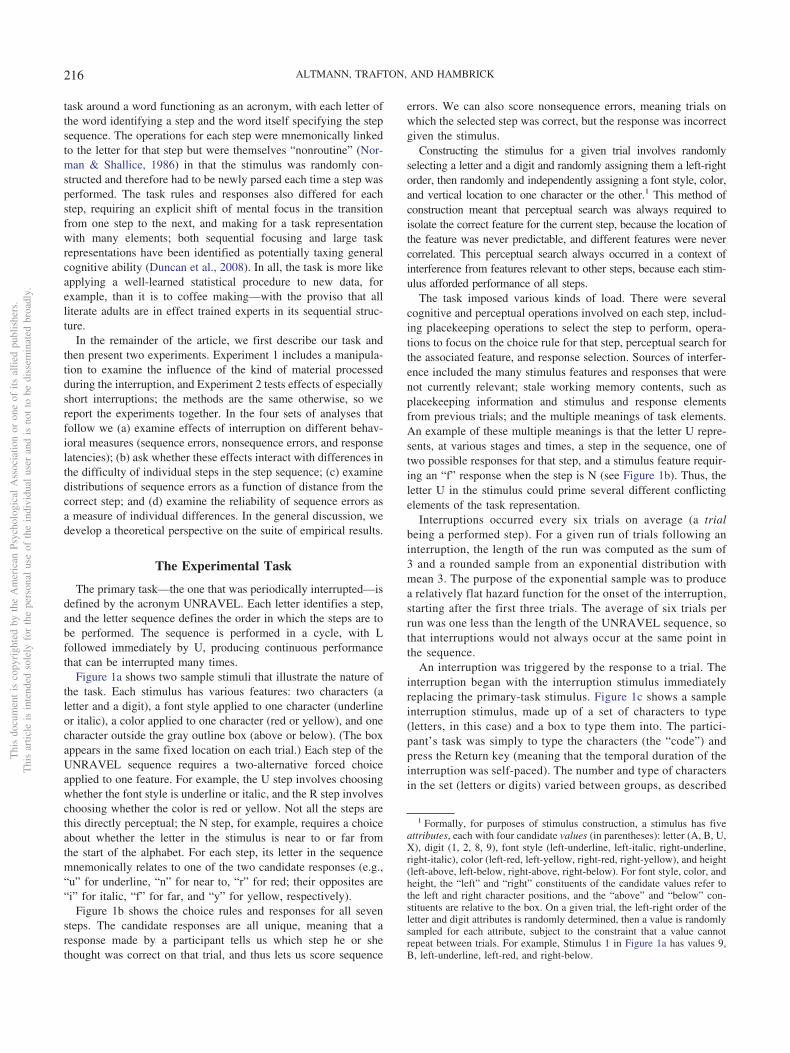
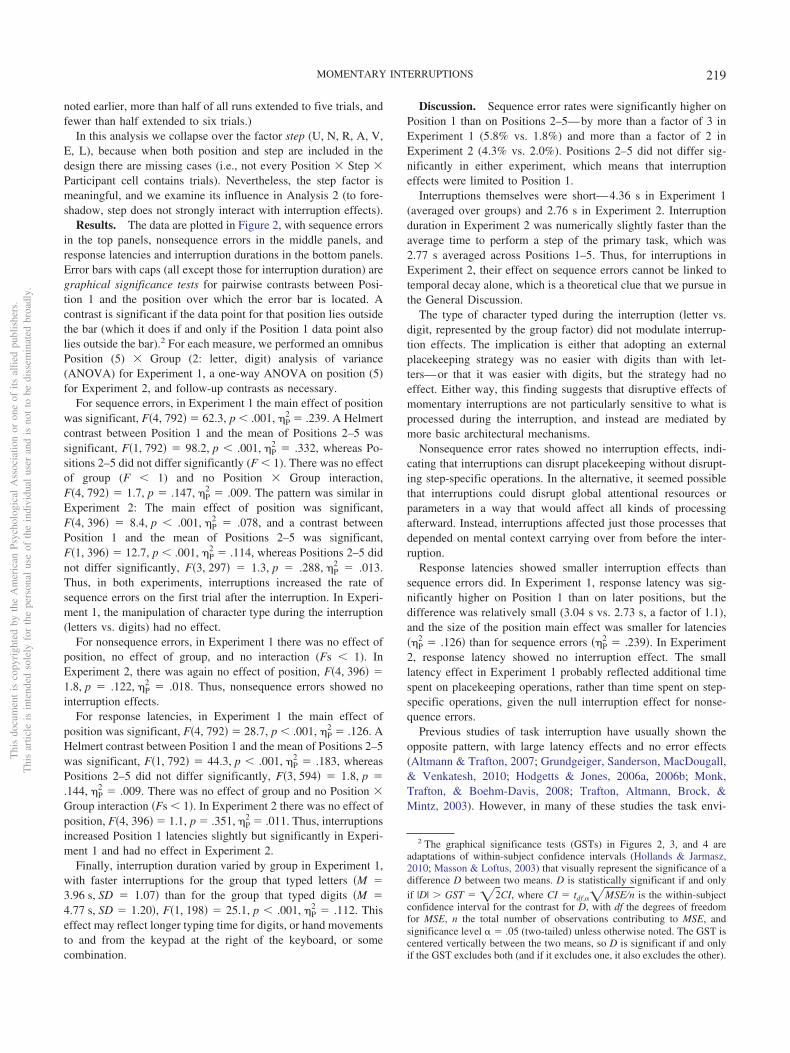
Results. The data are plotted in Figure 2, with sequence errorsin the top panels, nonsequence errors in the middle panels, andresponse latencies and interruption durations in the bottom panels.Error bars with caps (all except those for interruption duration) aregraphical significance tests for pairwise contrasts between Posi-tion 1 and the position over which the error bar is located. Acontrast is significant if the data point for that position lies outsidethe bar (which it does if and only if the Position 1 data point alsolies outside the bar).2 For each measure, we performed an omnibusPosition (5) � Group (2: letter, digit) analysis of variance(ANOVA) for Experiment 1, a one-way ANOVA on position (5)for Experiment 2, and follow-up contrasts as necessary.
For sequence errors, in Experiment 1 the main effect of positionwas significant, F�4, 792� � 62.3, p � .001, �P
2 � .239. A Helmertcontrast between Position 1 and the mean of Positions 2–5 wassignificant, F�1, 792� � 98.2, p � .001, �P
2 � .332, whereas Po-sitions 2–5 did not differ significantly (F � 1). There was no effectof group (F � 1) and no Position � Group interaction,F�4, 792� � 1.7, p � .147, �P
2 � .009. The pattern was similar inExperiment 2: The main effect of position was significant,F�4, 396� � 8.4, p � .001, �P
2 � .078, and a contrast betweenPosition 1 and the mean of Positions 2–5 was significant,F�1, 396� � 12.7, p � .001, �P
2 � .013.Thus, in both experiments, interruptions increased the rate ofsequence errors on the first trial after the interruption. In Experi-ment 1, the manipulation of character type during the interruption(letters vs. digits) had no effect.
For nonsequence errors, in Experiment 1 there was no effect ofposition, no effect of group, and no interaction (Fs � 1). InExperiment 2, there was again no effect of position, F�4, 396� �
1.8, p � .122, �P2 � .018. Thus, nonsequence errors showed no
interruption effects.For response latencies, in Experiment 1 the main effect of
position was significant, F�4, 792� � 28.7, p � .001, �P2 � .126. A
Helmert contrast between Position 1 and the mean of Positions 2–5was significant, F�1, 792� � 44.3, p � .001, �P
2 � .183, whereasPositions 2–5 did not differ significantly, F�3, 594� � 1.8, p �
.144, �P2 � .009. There was no effect of group and no Position �
Group interaction �Fs � 1�. In Experiment 2 there was no effect ofposition, F�4, 396� � 1.1, p � .351, �P
2 � .011. Thus, interruptionsincreased Position 1 latencies slightly but significantly in Experi-ment 1 and had no effect in Experiment 2.
Finally, interruption duration varied by group in Experiment 1,with faster interruptions for the group that typed letters �M �
3.96 s, SD � 1.07� than for the group that typed digits �M �
4.77 s, SD � 1.20�, F�1, 198� � 25.1, p � .001, �P2 � .112. This
effect may reflect longer typing time for digits, or hand movementsto and from the keypad at the right of the keyboard, or somecombination.
Discussion. Sequence error rates were significantly higher onPosition 1 than on Positions 2–5—by more than a factor of 3 inExperiment 1 (5.8% vs. 1.8%) and more than a factor of 2 inExperiment 2 (4.3% vs. 2.0%). Positions 2–5 did not differ sig-nificantly in either experiment, which means that interruptioneffects were limited to Position 1.
Interruptions themselves were short—4.36 s in Experiment 1(averaged over groups) and 2.76 s in Experiment 2. Interruptionduration in Experiment 2 was numerically slightly faster than theaverage time to perform a step of the primary task, which was2.77 s averaged across Positions 1–5. Thus, for interruptions inExperiment 2, their effect on sequence errors cannot be linked totemporal decay alone, which is a theoretical clue that we pursue inthe General Discussion.
The type of character typed during the interruption (letter vs.digit, represented by the group factor) did not modulate interrup-tion effects. The implication is either that adopting an externalplacekeeping strategy was no easier with digits than with let-ters—or that it was easier with digits, but the strategy had noeffect. Either way, this finding suggests that disruptive effects ofmomentary interruptions are not particularly sensitive to what isprocessed during the interruption, and instead are mediated bymore basic architectural mechanisms.
Nonsequence error rates showed no interruption effects, indi-cating that interruptions can disrupt placekeeping without disrupt-ing step-specific operations. In the alternative, it seemed possiblethat interruptions could disrupt global attentional resources orparameters in a way that would affect all kinds of processingafterward. Instead, interruptions affected just those processes thatdepended on mental context carrying over from before the inter-ruption.
Response latencies showed smaller interruption effects thansequence errors did. In Experiment 1, response latency was sig-nificantly higher on Position 1 than on later positions, but thedifference was relatively small (3.04 s vs. 2.73 s, a factor of 1.1),and the size of the position main effect was smaller for latencies��P
2 � .126� than for sequence errors ��P2 � .239�. In Experiment
2, response latency showed no interruption effect. The smalllatency effect in Experiment 1 probably reflected additional timespent on placekeeping operations, rather than time spent on step-specific operations, given the null interruption effect for nonse-quence errors.
Previous studies of task interruption have usually shown theopposite pattern, with large latency effects and no error effects(Altmann & Trafton, 2007; Grundgeiger, Sanderson, MacDougall,& Venkatesh, 2010; Hodgetts & Jones, 2006a, 2006b; Monk,Trafton, & Boehm-Davis, 2008; Trafton, Altmann, Brock, &Mintz, 2003). However, in many of these studies the task envi-
2 The graphical significance tests (GSTs) in Figures 2, 3, and 4 areadaptations of within-subject confidence intervals (Hollands & Jarmasz,2010; Masson & Loftus, 2003) that visually represent the significance of adifference D between two means. D is statistically significant if and onlyif |D| � GST � �2CI, where CI � tdf,��MSE ⁄n is the within-subjectconfidence interval for the contrast for D, with df the degrees of freedomfor MSE, n the total number of observations contributing to MSE, andsignificance level � � .05 (two-tailed) unless otherwise noted. The GST iscentered vertically between the two means, so D is significant if and onlyif the GST excludes both (and if it excludes one, it also excludes the other).
Thi
sdo
cum
ent
isco
pyri
ghte
dby
the
Am
eric
anPs
ycho
logi
cal
Ass
ocia
tion
oron
eof
itsal
lied
publ
ishe
rs.
Thi
sar
ticle
isin
tend
edso
lely
for
the
pers
onal
use
ofth
ein
divi
dual
user
and
isno
tto
bedi
ssem
inat
edbr
oadl
y.
219MOMENTARY INTERRUPTIONS
ronment had richer perceptual displays, which may have allowedparticipants to spend time reconstructing their mental context toresume more accurately. Errors also do not always directly mea-sure the representations disrupted by interruptions, as illustrated bythe null effect of interruptions here on nonsequence errors. Indeed,interruptions can actually lower error rates, if they trigger changesin arousal (Speier, Vessey, & Valacich, 2003) or performancestrategy (Zijlstra, Roe, Leonora, & Krediet, 1999), or if perfor-mance would otherwise show a “vigilance decrement” (Ariga &Lleras, 2011). Ariga and Lleras (2011) argued that the vigilancedecrement reflects habituation to the primary task and that aninterruption forces the primary task to be reactivated when theinterruption is over. Thus, the processes reflected in interruptioneffects vary widely across task environments. In our procedure, therelatively low sensitivity of response latencies to interruption
effects may indicate a high activation of interfering as well astarget elements of the task representation, a possibility we explorein the General Discussion.
Analysis 2: Step Effects
In this analysis we examine the effect of step (U, N, R, A, V,E, L) on the three measures examined in Analysis 1. Subjec-tively the steps are very different in terms of difficulty ofapplying the choice rules, and one question is whether thesesubjective differences are borne out behaviorally. A more spe-cific theoretical question is whether any difficulty differencesinteract with interruption effects. Conceivably, a step that in-volves more processing and/or more representational elementsmay leave behind more residual traces in episodic memory
0
1
2
3
4
5
6
7
8
Int. 1 2 3 4 5
0
1
2
3
4
5
6
7
8
2
3
4
Int. 1 2 3 4 5
0
1
2
3
4
5
6
7
8
Int. 1 2 3 4 5
0
1
2
3
4
5
6
7
8
2
3
4
Int. 1 2 3 4 5
Position after int. Position after int.
R)
%( srorre
ecne
uqe
S) s( yc
n eta l es
no
pseN
onse
quen
ce e
rrors
(%
)
2 tnemirepxE1 tnemirepxE
Figure 2. Performance as a function of trial position after interruption. Capped error bars are graphicalsignificance tests for contrasts between Position 1 and the position at which the error bar is located. Uncappederror bars are 95% confidence intervals. Int. � interruption.
Thi
sdo
cum
ent
isco
pyri
ghte
dby
the
Am
eric
anPs
ycho
logi
cal
Ass
ocia
tion
oron
eof
itsal
lied
publ
ishe
rs.
Thi
sar
ticle
isin
tend
edso
lely
for
the
pers
onal
use
ofth
ein
divi
dual
user
and
isno
tto
bedi
ssem
inat
edbr
oadl
y.
220 ALTMANN, TRAFTON, AND HAMBRICK
(Altmann, in press; Altmann & John, 1999) that, in turn, couldmake that step easier to remember having performed, thusmodulating the frequency of sequence errors.
We evaluate step effects separately from the position effectsin Analysis 1, because there are missing cases when both stepand position are included in the design. To address this issuehere, while still measuring interruption effects, we restructurethe position factor from Analysis 1 and refer to it now (and inthe rest of the article) as context, with levels post-interruptionand baseline. The post-interruption context is simply Position 1,which is where all interruption effects registered in Analysis 1.The baseline context collapses over Positions 2 and later, in-cluding those beyond 5, which were excluded in Analysis 1(where position was a fixed factor). With the data aggregatedthis way there are only two missing cases (both in the digits
group of Experiment 1, as reflected in the degrees of freedomfor Experiment 1 ANOVAs).
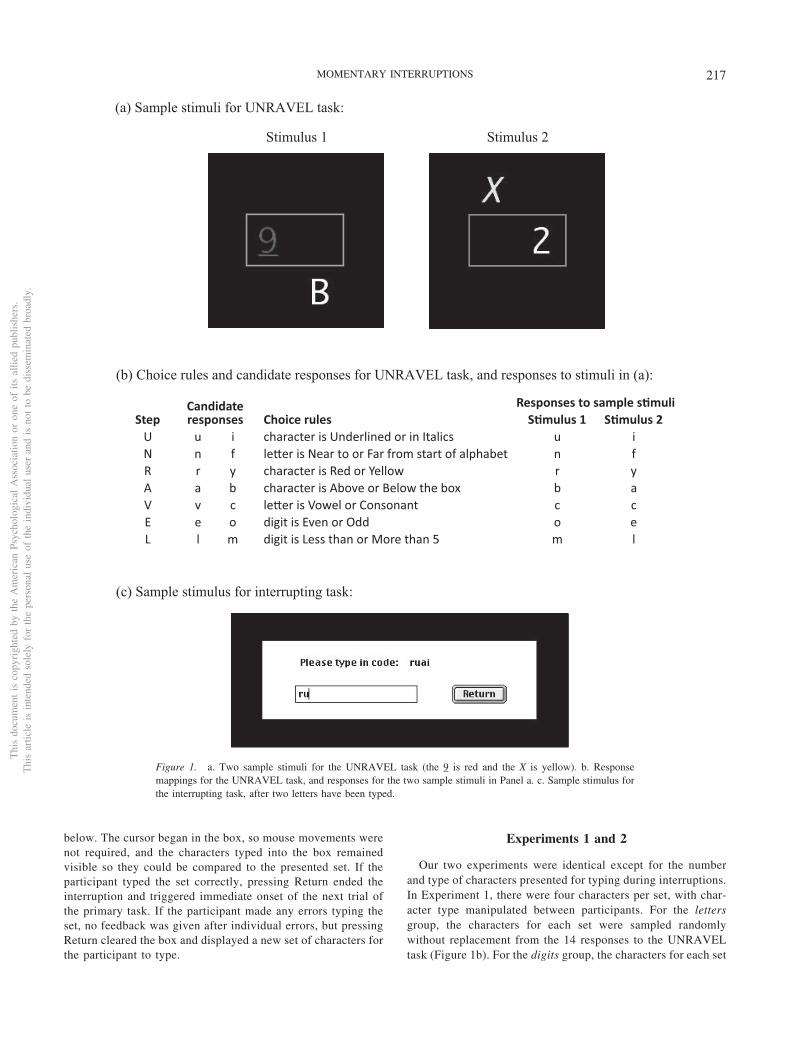
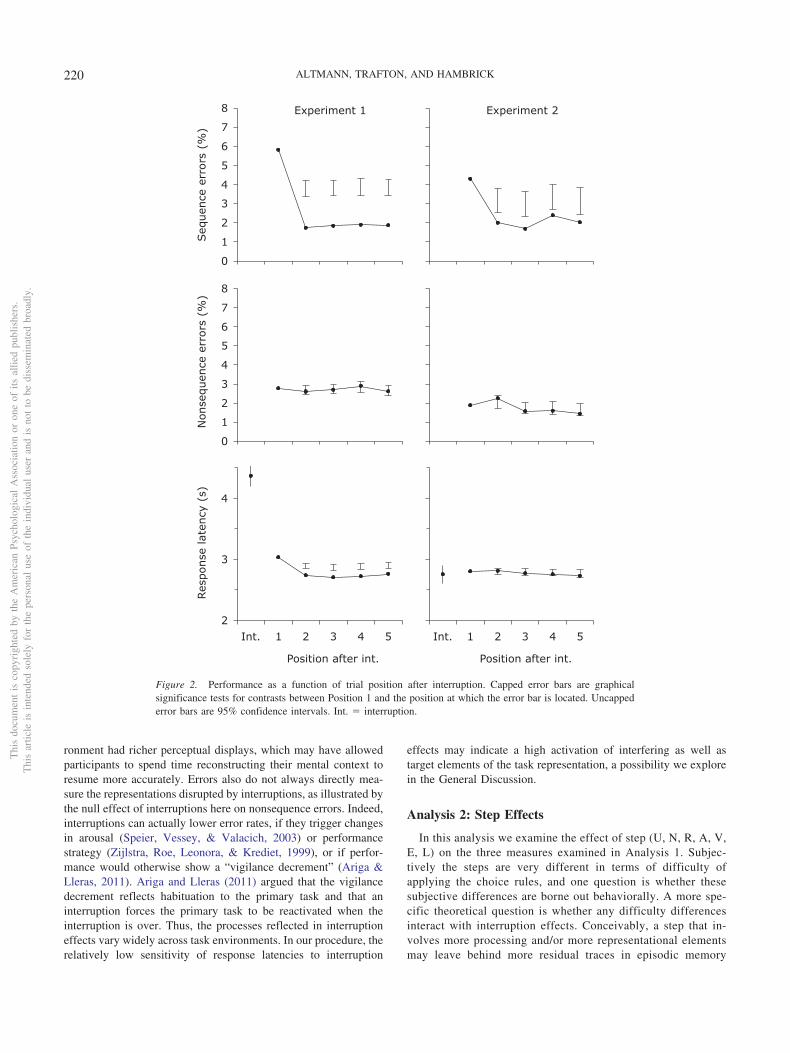
Results. The data are plotted in Figure 3, with step on theabscissa and context as separate lines. Sequence errors are again inthe top panels, nonsequence errors in the middle panels, andresponse latencies in the bottom panels. Error bars are againgraphical significant tests, here for pairwise contrasts between thepost-interruption and baseline contexts at each step. A contrast issignificant if the data points at that step lie outside the bar. Foreach measure, we performed a Step (7) � Context (2) � Group (2)ANOVA for Experiment 1 and a Step (2) � Context (2) ANOVAfor Experiment 2.
For sequence errors, in Experiment 1 there were significantmain effects of step, F�6, 1176� � 10.8, p � .001, �P
Figure 3. Performance as a function of step within the UNRAVEL sequence. Error bars are graphicalsignificance tests for contrasts between the post-interruption and baseline contexts at each step.
Thi
sdo
cum
ent
isco
pyri
ghte
dby
the
Am
eric
anPs
ycho
logi
cal
Ass
ocia
tion
oron
eof
itsal
lied
publ
ishe
rs.
Thi
sar
ticle
isin
tend
edso
lely
for
the
pers
onal
use
ofth
ein
divi
dual
user
and
isno
tto
bedi
ssem
inat
edbr
oadl
y.
221MOMENTARY INTERRUPTIONS
interaction, F�6, 1176� � 3.4, p � .003, �P2 � .017. The main
effect of group was not significant, F�1, 196� � 1.5, p �
.229, �P2 � .007. There was a marginally significant Step � Group
interaction, F�6, 1176� � 2.0, p � .068, �P2 � .010, which we do
not try to interpret. No other interactions involving group weresignificant �Fs � 1.2�. In Experiment 2 there were again signifi-cant main effects of step, F�6, 594� � 4.9, p � .001, �P
2 � .129, but here theinteraction was not significant (F � 1). Thus, in Experiment 2there was no evidence that interruption effects differed by step. InExperiment 1 there was, but the simple effect of context washighly significant for all steps, as indicated by the graphicalsignificance tests in the top left panel of Figure 3.
For nonsequence errors, in Experiment 1 there was a significantmain effect of step, F�6, 1176� � 15.8, p � .001, �P
2 � .075, butno main effect of context (F � 1) and no interaction,F�6, 1176� � 1.1, p � .351, �P
2 � .006. In Experiment 2 there wasagain a significant main effect of step, F�6, 594� � 5.7, p �
.001, �P2 � .055, and no effect of context (F � 1). The interaction
in Experiment 2 was marginally significant, F�6, 594� �
2.0, p � .061, �P2 � .020, probably reflecting the difference be-
tween the contexts at the V step, but this effect had no counterpartin Experiment 1, and we do not try to interpret it. Thus, there wassubstantial variability in the step factor, but this affected the twocontexts in similar ways.
For response latencies, in Experiment 1 there were significantmain effects of step, F�6, 1176� � 58.1, p � .001, �P
2 � .184, and there was amarginally significant interaction, F�6, 1176� � 2.0, p �
.069, �P2 � .010. Neither the main effect of group nor its interac-
tions with other factors were significant �Fs � 1�. In Experiment2 there was a significant main effect of step, F�6, 594� �
34.8, p � .001, �P2 � .264, no effect of context (F � 1), and a
significant interaction, F�6, 594� � 2.7, p � .014, �P2 � .027. In
both experiments, step effects for latencies were more similar tothose for nonsequence errors than to those for sequence errors(Figure 3). Also in both experiments, context effects for laten-cies mirrored those in Analysis 1, with the post-interruptioncontext (Position 1) showing an interruption effect in Experi-ment 1 but not Experiment 2.
Discussion. Step had a large effect on performance, but thenature of the effect differed by dependent measure. For sequenceerrors, step effects seem to reflect effects of the word boundaries—middle steps in the sequence showed higher error rates than end steps,as seen clearly in the baseline contexts (Figure 3, top panels). Thispattern may indicate a role for hierarchical representations in place-keeping, with a full pass through the sequence—as defined by theword, here—serving as a task boundary (Botvinick & Bylsma, 2005).
For nonsequence errors and response latencies, step effectsseemed to track differences in the difficulty of individual steps.The N and R steps best illustrate the pattern. N requires judgingwhether a letter is near to or far from the start of the alphabet,which involves search through a mental representation of thealphabet, and somewhat opaque names for the relevant responsecategories. In contrast, R requires a simple color judgment, and thecolor names (red and yellow) map transparently to responses (“r”and “y”). Nonsequence errors and response latencies were corre-spondingly high for N and low for R (Figure 3, middle and bottom
panels). However, the two steps had similar rates of sequenceerrors (Figure 3, top panels), suggesting that the amount of pro-cessing involved in performing a step does not bear much on theaccuracy of remembering whether that step was performed.
There were Step � Context interactions for sequence errors inExperiment 1 (with a similar trend in Experiment 2) and responselatencies in Experiment 2 (with a similar trend in Experiment 1).The effects were relatively weak and can be at least partiallyattributed to a speed–accuracy tradeoff specifically on the U step.There, compared to other steps, the context effect was numericallysmallest for sequence errors and numerically largest for responselatencies (Figure 3, top vs. bottom panels). What mechanismwould drive a speed–accuracy tradeoff on this step is unclear,though it may be related to U being the first step of the sequence.Regardless, the simple effect of context on sequence errors wassignificant on all steps in Experiment 1 (as indicated by thegraphical significance tests), and in Experiment 2 the Step �Context interaction was not significant. Thus, all steps were stillsubject to an interruption effect on sequence errors, even if theeffect was smaller on some steps than others.
In the end, although step difficulty varied widely, this factor didnot interact strongly with interruption effects. Together with thenull effect of interruptions on nonsequence errors, this patternsuggests that sequential control is a modular process that is rela-tively independent of step-specific operations. This finding sug-gests that different steps could be substituted into the se-quence—or that the sequence itself could be replaced—andproduce similar results, making the overall architecture of ourprocedure potentially adaptable to different applications.
Analysis 3: Sequence Error Distributions
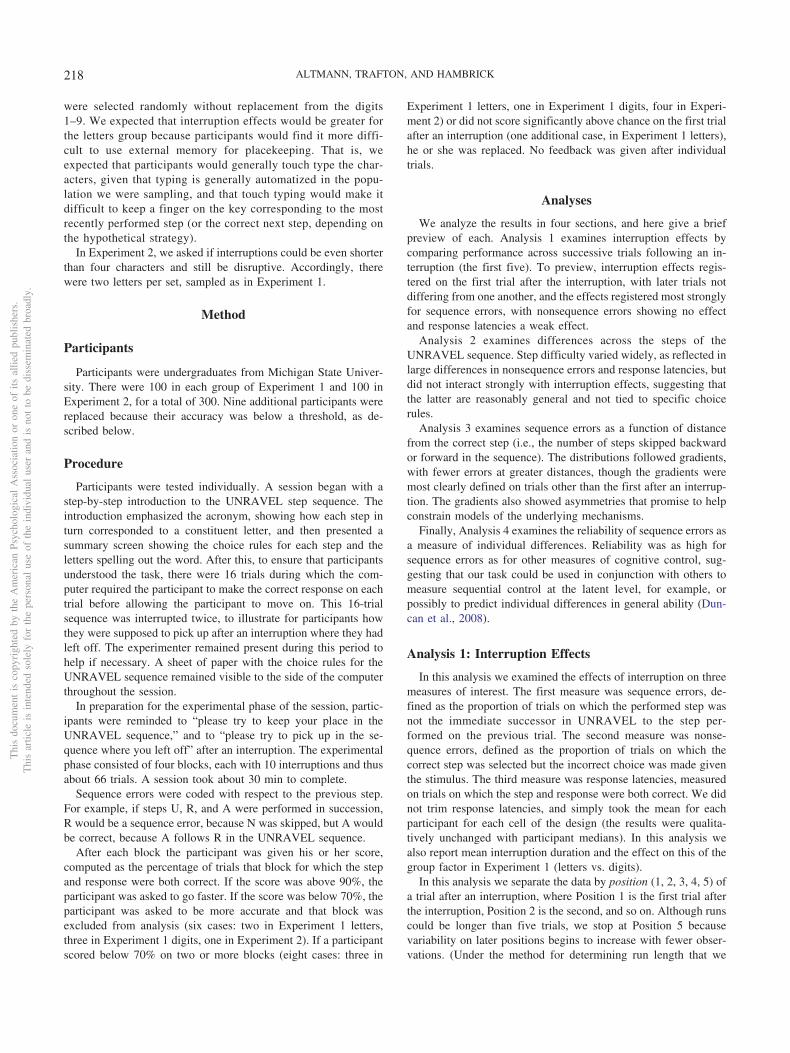
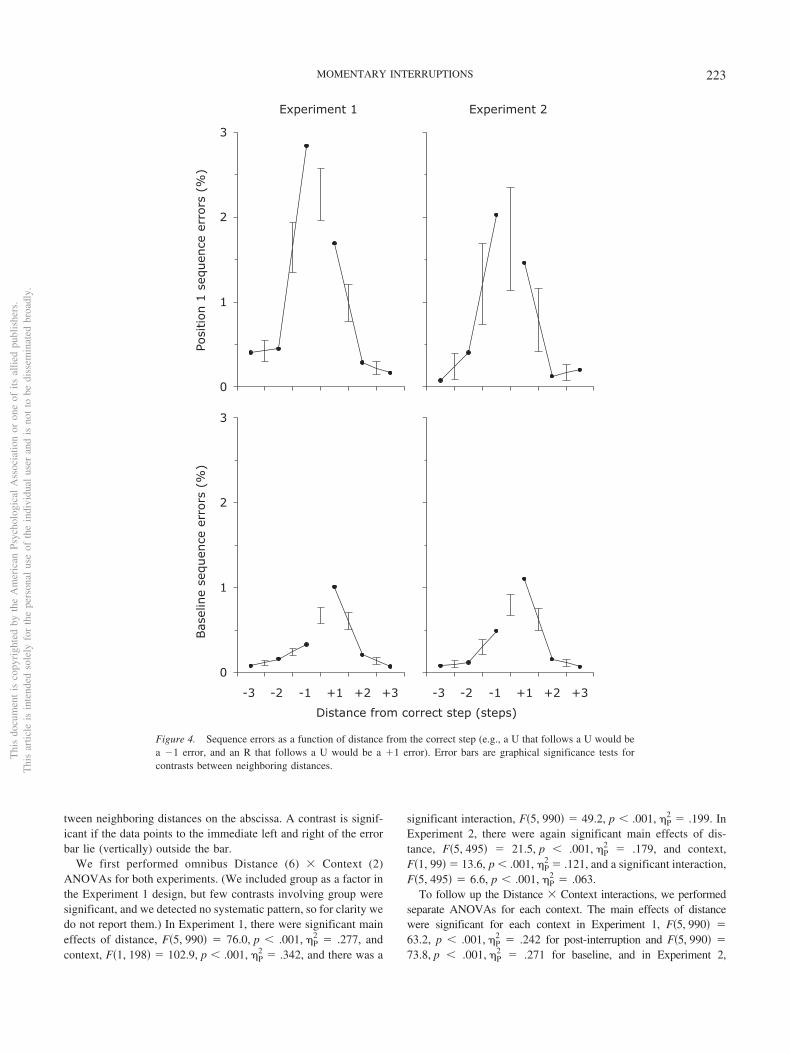
In this analysis we examine the distribution of sequence errorsover distance (–3, –2, –1, �1, �2, �3), the number of stepsrepeated or skipped within the sequence when a sequence erroroccurs. For example, a U trial after a U trial would be a –1 error,and an R trial after a U trial would be a �1 error. In keeping withprevious work (Cooper & Shallice, 2000; Trafton et al., 2011), werefer to “�” errors as perseverations and “�” errors as anticipa-tions. When we refer to a distance without a sign, this denotes aparticular number of steps from the correct step in either direction(perseveration, anticipation).
Sequence error distributions are likely to be an important theo-retical constraint, but, as we noted earlier, sequence errors havebeen difficult to generate in numbers large enough to assessdistributions, and only one study to date has done so (Trafton et al.,2011). That study found evidence for a gradient distribution (errorrate decreasing as distance increased) for perseveration errors ontrials after interruptions. However, there were not enough errors toestablish whether there was also an anticipation gradient afterinterruptions, or whether there were gradients in either directionduring baseline performance. Thus, the aim here is to evaluate theevidence for gradients in both directions and in both contexts.
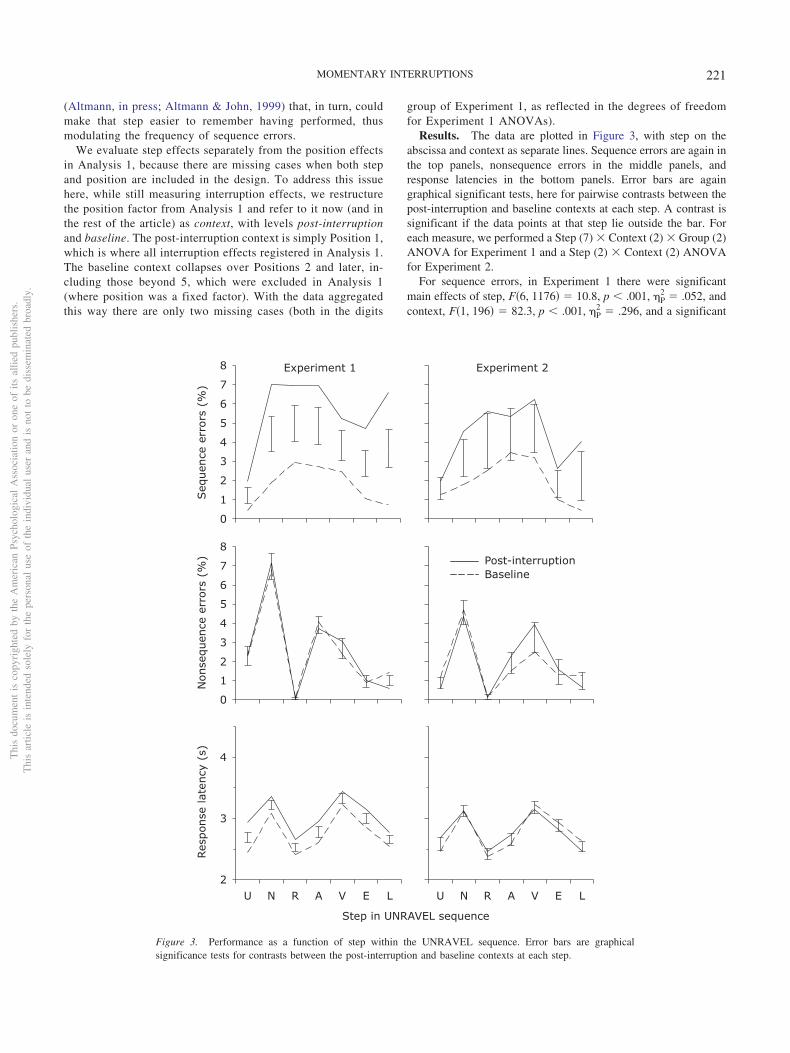
Results. The data are plotted in Figure 4, with post-interruption distributions in the upper panels and baseline distri-butions in the lower panels (we reuse the context factor fromAnalysis 2). Error bars are graphical significance tests (with sig-nificance level � � .025; see below) for pairwise contrasts be-
Thi
sdo
cum
ent
isco
pyri
ghte
dby
the
Am
eric
anPs
ycho
logi
cal
Ass
ocia
tion
oron
eof
itsal
lied
publ
ishe
rs.
Thi
sar
ticle
isin
tend
edso
lely
for
the
pers
onal
use
ofth
ein
divi
dual
user
and
isno
tto
bedi
ssem
inat
edbr
oadl
y.
222 ALTMANN, TRAFTON, AND HAMBRICK
tween neighboring distances on the abscissa. A contrast is signif-icant if the data points to the immediate left and right of the errorbar lie (vertically) outside the bar.
We first performed omnibus Distance (6) � Context (2)ANOVAs for both experiments. (We included group as a factor inthe Experiment 1 design, but few contrasts involving group weresignificant, and we detected no systematic pattern, so for clarity wedo not report them.) In Experiment 1, there were significant maineffects of distance, F�5, 990� � 76.0, p � .001, �P
significant interaction, F�5, 990� � 49.2, p � .001, �P2 � .199. In
Experiment 2, there were again significant main effects of dis-tance, F�5, 495� � 21.5, p � .001, �P
2 � .179, and context,F�1, 99� � 13.6, p � .001, �P
2 � .121, and a significant interaction,F�5, 495� � 6.6, p � .001, �P
2 � .063.To follow up the Distance � Context interactions, we performed
separate ANOVAs for each context. The main effects of distancewere significant for each context in Experiment 1, F�5, 990� �
63.2, p � .001, �P2 � .242 for post-interruption and F�5, 990� �
73.8, p � .001, �P2 � .271 for baseline, and in Experiment 2,
0
1
2
3
0
1
2
3
0
1
2
3
0
1
2
3
3+3- +2+1-2 -1
Distance from correct step (steps)
Experiment 1 Experiment 2
Bas
elin
e se
quen
ce e
rrors
(%
)Po
sition 1
seq
uen
ce e
rrors
(%
)
3+3- +2+1-2 -1
Figure 4. Sequence errors as a function of distance from the correct step (e.g., a U that follows a U would bea �1 error, and an R that follows a U would be a �1 error). Error bars are graphical significance tests forcontrasts between neighboring distances.
Thi
sdo
cum
ent
isco
pyri
ghte
dby
the
Am
eric
anPs
ycho
logi
cal
Ass
ocia
tion
oron
eof
itsal
lied
publ
ishe
rs.
Thi
sar
ticle
isin
tend
edso
lely
for
the
pers
onal
use
ofth
ein
divi
dual
user
and
isno
tto
bedi
ssem
inat
edbr
oadl
y.
223MOMENTARY INTERRUPTIONS
F�5, 495� � 12.5, p � .001, �P2 � .112 for post-interruption and
F�5, 495� � 51.8, p � .001, �P2 � .344 for baseline.
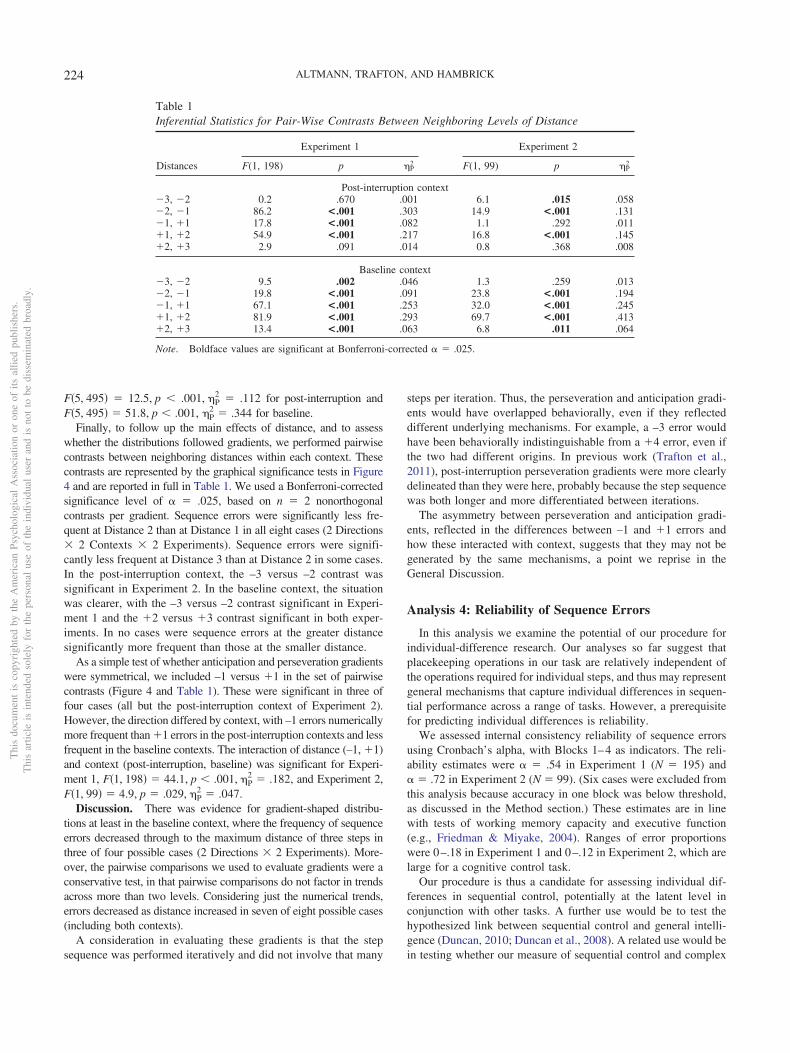
Finally, to follow up the main effects of distance, and to assesswhether the distributions followed gradients, we performed pairwisecontrasts between neighboring distances within each context. Thesecontrasts are represented by the graphical significance tests in Figure4 and are reported in full in Table 1. We used a Bonferroni-correctedsignificance level of � � .025, based on n � 2 nonorthogonalcontrasts per gradient. Sequence errors were significantly less fre-quent at Distance 2 than at Distance 1 in all eight cases (2 Directions� 2 Contexts � 2 Experiments). Sequence errors were signifi-cantly less frequent at Distance 3 than at Distance 2 in some cases.In the post-interruption context, the –3 versus –2 contrast wassignificant in Experiment 2. In the baseline context, the situationwas clearer, with the –3 versus –2 contrast significant in Experi-ment 1 and the �2 versus �3 contrast significant in both exper-iments. In no cases were sequence errors at the greater distancesignificantly more frequent than those at the smaller distance.
As a simple test of whether anticipation and perseveration gradientswere symmetrical, we included –1 versus �1 in the set of pairwisecontrasts (Figure 4 and Table 1). These were significant in three offour cases (all but the post-interruption context of Experiment 2).However, the direction differed by context, with –1 errors numericallymore frequent than �1 errors in the post-interruption contexts and lessfrequent in the baseline contexts. The interaction of distance (–1, �1)and context (post-interruption, baseline) was significant for Experi-ment 1, F�1, 198� � 44.1, p � .001, �P
2 � .182, and Experiment 2,F�1, 99� � 4.9, p � .029, �P
2 � .047.Discussion. There was evidence for gradient-shaped distribu-
tions at least in the baseline context, where the frequency of sequenceerrors decreased through to the maximum distance of three steps inthree of four possible cases (2 Directions � 2 Experiments). More-over, the pairwise comparisons we used to evaluate gradients were aconservative test, in that pairwise comparisons do not factor in trendsacross more than two levels. Considering just the numerical trends,errors decreased as distance increased in seven of eight possible cases(including both contexts).
A consideration in evaluating these gradients is that the stepsequence was performed iteratively and did not involve that many
steps per iteration. Thus, the perseveration and anticipation gradi-ents would have overlapped behaviorally, even if they reflecteddifferent underlying mechanisms. For example, a –3 error wouldhave been behaviorally indistinguishable from a �4 error, even ifthe two had different origins. In previous work (Trafton et al.,2011), post-interruption perseveration gradients were more clearlydelineated than they were here, probably because the step sequencewas both longer and more differentiated between iterations.
The asymmetry between perseveration and anticipation gradi-ents, reflected in the differences between –1 and �1 errors andhow these interacted with context, suggests that they may not begenerated by the same mechanisms, a point we reprise in theGeneral Discussion.
Analysis 4: Reliability of Sequence Errors
In this analysis we examine the potential of our procedure forindividual-difference research. Our analyses so far suggest thatplacekeeping operations in our task are relatively independent ofthe operations required for individual steps, and thus may representgeneral mechanisms that capture individual differences in sequen-tial performance across a range of tasks. However, a prerequisitefor predicting individual differences is reliability.
We assessed internal consistency reliability of sequence errorsusing Cronbach’s alpha, with Blocks 1–4 as indicators. The reli-ability estimates were � � .54 in Experiment 1 (N � 195) and� � .72 in Experiment 2 (N � 99). (Six cases were excluded fromthis analysis because accuracy in one block was below threshold,as discussed in the Method section.) These estimates are in linewith tests of working memory capacity and executive function(e.g., Friedman & Miyake, 2004). Ranges of error proportionswere 0–.18 in Experiment 1 and 0–.12 in Experiment 2, which arelarge for a cognitive control task.
Our procedure is thus a candidate for assessing individual dif-ferences in sequential control, potentially at the latent level inconjunction with other tasks. A further use would be to test thehypothesized link between sequential control and general intelli-gence (Duncan, 2010; Duncan et al., 2008). A related use would bein testing whether our measure of sequential control and complex
Table 1Inferential Statistics for Pair-Wise Contrasts Between Neighboring Levels of Distance
Note. Boldface values are significant at Bonferroni-corrected � � .025.
Thi
sdo
cum
ent
isco
pyri
ghte
dby
the
Am
eric
anPs
ycho
logi
cal
Ass
ocia
tion
oron
eof
itsal
lied
publ
ishe
rs.
Thi
sar
ticle
isin
tend
edso
lely
for
the
pers
onal
use
ofth
ein
divi
dual
user
and
isno
tto
bedi
ssem
inat
edbr
oadl
y.
224 ALTMANN, TRAFTON, AND HAMBRICK
span measures typically used as indices of executive attention(e.g., operation span; Engle, 2002; Kane & Engle, 2002) capturethe same latent factor representing interference control. Finally, asimplified version of our procedure may help to characterizedevelopmental and neuropsychological deficits in sequential con-trol, such as action disorganization syndrome, more precisely thanhas been possible with existing measures (Cooper et al., 2005).
General Discussion
Short interruptions increased the rate of sequence errors on thepost-interruption trial (Figure 2, top panels). Interruptions averaging4.4 s (Experiment 1) increased the error rate by more than a factor of3 relative to baseline, and interruptions averaging 2.8 s (Experiment 2)increased the error rate more than a factor of 2 relative to baseline.Nonsequence errors showed no interruption effects (Figure 2, middlepanels), indicating that interruptions selectively affected the mentalrepresentations used in sequential control and did not affect perfor-mance on individual steps. Response latencies showed interruptioneffects only in Experiment 1 (Figure 2, lower panels), and theseeffects were smaller than those on sequence errors.
Here we address three theoretical questions: why very shortinterruptions should increase the rate of sequence errors, whatmechanisms might lead to the gradient distributions in Figure 4,and why sequence errors were more sensitive to interruptioneffects than response latencies were.
Theoretical accounts of interruption effects have often rested ondecay of task-relevant representations during the interruption (Alt-mann & Trafton, 2002; Hodgetts & Jones, 2006a, 2006b). Decayis arguably a pervasive architectural process (Altmann & Gray,2008; Altmann & Schunn, 2012) and can be quite rapid (Campoy,2012; Muter, 1980). Here, however, decay must have interactedwith other factors to cause the interruption effects we observed,given that interruptions in Experiment 2 took no more time, onaverage, than a step of the primary task. One candidate factor issimply that processing during the interruption was focused oninformation not related to the primary task.
A second candidate factor is that the primary task involvedsubstantial interference from irrelevant representations competingfor a role in any given operation. Under such conditions, thechallenge for executive processes is to focus on the correct elementfor each operation, and to navigate to the next element when thatbecomes relevant (see, e.g., Kane & Engle, 2002). We suggest thatthis navigation is supported by activation spreading from the focusof attention through links connecting the elements of the task-relevant representation—a mechanism that plays a core role inarchitectural models of working memory (e.g., Anderson & Leb-iere, 1998; Cowan, 1997). To account for sequential control spe-cifically, we assume that activation spreads from the current stepin the sequence to its successor when the current step is in thefocus of attention. When an interruption displaces the current stepfrom the focus of attention, the flow of activation spreading to thenext step is cut off, allowing the next step to decay.
Spreading activation could account for anticipation gradients, ifit spreads to some extent beyond a single step forward in thesequence (Altmann & Trafton, 2007). A pending step would thenbe primed by its predecessors as its turn approaches, graduallybecoming more active and thus more likely to intrude on the stepselections leading up to it. A different mechanism may account for
perseveration gradients. In a model developed by Trafton et al.(2011), the system selects the next step based on memory for thelast step it performed, and perseveration gradients arise becausememories for performed steps decay and thus intrude less often theolder they are. The possibility that different mechanisms are re-sponsible for anticipation and perseveration gradients is consistentwith the various asymmetries in their empirical forms in Figure 4.
In contrast, a single mechanism usually accounts for error gra-dients in serial recall and related tasks. The most common mech-anism is a “context signal” that fluctuates such that neighboringitems occasionally swap positions (e.g., Brown, Preece, & Hulme,2000; Burgess & Hitch, 1999). Another mechanism is the blurringof item representations that occurs with a recurrent network (Bot-vinick & Plaut, 2006). For any single mechanism to account forour data, the challenge might be whether it can reproduce thedifferent asymmetries evident in Figure 4.
A remaining question is why response latencies were less sen-sitive to interruption effects than sequence errors were. A similardissociation arises in task-switching procedures, where “switchcost” registers in terms of errors but not latencies under conditionsin which the current task must be retrieved from memory (Alt-mann, 2004; Altmann & Gray, 2008). In a model that reproducesthis effect (Altmann & Gray, 2008), retrieval latency depends onthe activation of the most active item, whether or not this is thetarget, whereas retrieval accuracy depends on the activation dif-ference between the target and distractors. Thus, under conditionsof high interference, with many active distractors, retrieval latencyis relatively insensitive to a decrease in activation of just the target.On this account, when all steps in the sequence are active—due torecent use, priming from overlapping meanings of task elements,and perhaps other factors—and an interruption cuts off priming tothe correct step, retrieval accuracy will be the main casualty.
This theoretical account of our data is largely assembled fromexisting constructs, including attentional focus, spreading activa-tion, and decay and interference. However, the proposed configu-ration of these components is new and has many moving parts topotentially interact, and our empirical data offer some strongconstraints. Thus, an important step in future work will be todevelop an integrated representation of this account and test itssufficiency to reproduce behavioral measures through computa-tional and/or formal modeling.
In conclusion, our core empirical finding is that when someone ismomentarily interrupted or distracted and then returns to their task,they may do so without obvious hesitation, but with an increasedchance of resuming at a different point in their train of thought thanthey might have otherwise. This contextual jitter—being taken out ofthe moment and landed back in a slightly different place—may bewhy even momentary interruptions can seem jarring when they occurduring a cognitively engaging activity.
References
Altmann, E. M. (2004). Advance preparation in task switching: What workis being done? Psychological Science, 15, 616–622. doi:10.1111/j.0956-7976.2004.00729.x
Altmann, E. M. (in press). Fine-grain episodic memory processes incognitive control. Zeitschrift für Psychologie.
Altmann, E. M., & Gray, W. D. (2008). An integrated model of cognitivecontrol in task switching. Psychological Review, 115, 602–639. doi:10.1037/0033-295X.115.3.602
Altmann, E. M., & John, B. E. (1999). Episodic indexing: A model ofmemory for attention events. Cognitive Science, 23, 117–156. doi:10.1207/s15516709cog2302_1
Altmann, E. M., & Schunn, C. D. (2012). Decay versus interference: Anew look at an old interaction. Psychological Science, 23, 1435–1437.doi:10.1177/0956797612446027
Altmann, E. M., & Trafton, J. G. (2002). Memory for goals: An activation-based model. Cognitive Science, 26, 39 – 83. doi:10.1207/s15516709cog2601_2
Altmann, E. M., & Trafton, J. G. (2007). Timecourse of recovery from taskinterruption: Data and a model. Psychonomic Bulletin & Review, 14,1079–1084. doi:10.3758/BF03193094
Anderson, J. R., & Lebiere, C. (1998). The atomic components of thought.Hillsdale, NJ: Erlbaum.
Ariga, A., & Lleras, A. (2011). Brief and rare mental “breaks” keep you focused:Deactivation and reactivation of task goals preempt vigilance decrements.Cognition, 118, 439–443. doi:10.1016/j.cognition.2010.12.007
Botvinick, M. M., & Bylsma, L. M. (2005). Distraction and action slips inan everyday task: Evidence for a dynamic representation of task context.Psychonomic Bulletin & Review, 12, 1011–1017. doi:10.3758/BF03206436
Botvinick, M. M., & Plaut, D. C. (2004). Doing without schema hierar-chies: A recurrent connectionist approach to normal and impaired rou-tine sequential action. Psychological Review, 111, 395– 429. doi:10.1037/0033-295X.111.2.395
Botvinick, M. M., & Plaut, D. C. (2006). Short-term memory for serialorder: A recurrent neural network model. Psychological Review, 113,201–233. doi:10.1037/0033-295X.113.2.201
Brown, G. D. A., Preece, T., & Hulme, C. (2000). Oscillator-based mem-ory for serial order. Psychological Review, 107, 127–181. doi:10.1037/0033-295X.107.1.127
Burgess, N., & Hitch, G. J. (1999). Memory for serial order: A networkmodel of the phonological loop and its timing. Psychological Review,106, 551–581. doi:10.1037/0033-295X.106.3.551
Byrne, M. D., & Bovair, S. (1997). A working memory model of acommon procedural error. Cognitive Science, 21, 31–61. doi:10.1207/s15516709cog2101_2
Campoy, G. (2012). Evidence for decay in verbal short-term memory: Acommentary on Berman, Jonides, and Lewis (2009). Journal of Exper-imental Psychology: Learning, Memory, and Cognition, 38, 1129–1136.doi:10.1037/a0026934
Cooper, R. P., Schwartz, M. F., Yule, P., & Shallice, T. (2005). The simulation ofaction disorganisation in complex activities of daily living. Cognitive Neu-ropsychology, 22, 959–1004. doi:10.1080/02643290442000419
Cooper, R. P., & Shallice, T. (2000). Contention scheduling and the controlof routine activities. Cognitive Neuropsychology, 17, 297–338. doi:10.1080/026432900380427
Cooper, R. P., & Shallice, T. (2006). Hierarchical schemas and goals in thecontrol of sequential behavior. Psychological Review, 113, 887–916.doi:10.1037/0033-295X.113.4.887
Cowan, N. (1997). Attention and memory: An integrated framework.Oxford, England: Oxford University Press.
Duncan, J. (2010). How intelligence happens. New Haven, CT: YaleUniversity Press.
Duncan, J., Parr, A., Woolgar, A., Thompson, R., Bright, P., Cox, S., . . .Nimmo-Smith, I. (2008). Goal neglect and Spearman’s g: Competingparts of a complex task. Journal of Experimental Psychology: General,137, 131–148. doi:10.1037/0096-3445.137.1.131
Engle, R. W. (2002). Working memory capacity as executive attention.Current Directions in Psychological Science, 11, 19–23. doi:10.1111/1467-8721.00160
Friedman, N. P., & Miyake, A. (2004). The relations among inhibition andinterference control functions: A latent-variable analysis. Journal of
Experimental Psychology: General, 133, 101–135. doi:10.1037/0096-3445.133.1.101
Grundgeiger, T., Sanderson, P. M., MacDougall, H. G., & Venkatesh, B.(2010). Interruption management in the intensive care unit: Predictingresumption times and assessing distributed support. Journal of Experi-mental Psychology: Applied, 16, 317–334. doi:10.1037/a0021912
Hodgetts, H. M., & Jones, D. M. (2006a). Contextual cues aid recoveryfrom interruption: The role of associative activation. Journal of Exper-imental Psychology: Learning, Memory, and Cognition, 32, 1120–1132.doi:10.1037/0278-7393.32.5.1120
Hodgetts, H. M., & Jones, D. M. (2006b). Interruption of the Tower of Londontask: Support for a goal activation approach. Journal of Experimental Psychol-ogy: General, 135, 103–115. doi:10.1037/0096-3445.135.1.103
Hollands, J. G., & Jarmasz, J. (2010). Revisiting confidence intervals forrepeated measures designs. Psychonomic Bulletin & Review, 17, 135–138. doi:10.3758/PBR.17.1.135
Kane, M. J., & Engle, R. W. (2002). The role of prefrontal cortex inworking-memory capacity, executive attention, and general fluid intel-ligence: An individual-differences perspective. Psychonomic Bulletin &Review, 9, 637–671. doi:10.3758/BF03196323
Li, S. Y. W., Blandford, A., Cairns, P., & Young, R. M. (2008). The effectof interruptions on postcompletion and other procedural errors: Anaccount based on the activation-based goal memory model. Journal ofExperimental Psychology: Applied, 14, 314–328. doi:10.1037/a0014397
Masson, M. E. J., & Loftus, G. R. (2003). Using confidence intervals forgraphically based data interpretation. Canadian Journal of ExperimentalPsychology, 57, 203–220. doi:10.1037/h0087426
Monk, C. A., Trafton, J. G., & Boehm-Davis, D. A. (2008). The effect ofinterruption duration and demand on resuming suspended goals. Journal ofExperimental Psychology: Applied, 14, 299–313. doi:10.1037/a0014402
Muter, P. (1980). Very rapid forgetting. Memory & Cognition, 8, 174–179.doi:10.3758/BF03213420
Norman, D. A., & Shallice, T. (1986). Attention to action: Willed andautomatic control of behavior. In R. J. Davidson, G. E. Schwartz, & D.Shapiro (Eds.), Consciousness and self-regulation (Vol. 4, pp. 1–18).New York, NY: Plenum Press.
Reason, J. (1990). Human error. New York, NY: Cambridge UniversityPress. doi:10.1017/CBO9781139062367
Schwartz, M. F., Reed, E. S., Montgomery, M. W., Palmer, C., & Mayer,N. H. (1991). The quantitative description of action disorganisation afterbrain damage: A case study. Cognitive Neuropsychology, 8, 381–414.
Speier, C., Vessey, I., & Valacich, J. S. (2003). The effects of interruptions,task complexity, and information presentation on computer-supporteddecision-making performance. Decision Sciences, 34, 771–797. doi:10.1111/j.1540-5414.2003.02292.x
Trafton, J. G., Altmann, E. M., Brock, D. P., & Mintz, F. E. (2003).Preparing to resume an interrupted task: Effects of prospective goalencoding and retrospective rehearsal. International Journal of Human-Computer Studies, 58, 583–603. doi:10.1016/S1071-5819(03)00023-5
Trafton, J. G., Altmann, E. M., & Ratwani, R. (2011). A memory for goalsmodel of sequence errors. Cognitive Systems Research, 12, 134–143.doi:10.1016/j.cogsys.2010.07.010
Trafton, J. G., Jacobs, A., & Harrison, A. M. (2012). Building and veri-fying a predictive model of interruption resumption. Proceedings of theIEEE, 100, 648–659. doi:10.1109/JPROC.2011.2175149
Zijlstra, F. R. H., Roe, R. A., Leonora, A. B., & Krediet, I. (1999).Temporal factors in mental work: Effects of interrupted activities. Jour-nal of Occupational and Organizational Psychology, 72, 163–185. doi:10.1348/096317999166581
Received April 4, 2012Revision received October 26, 2012