Whether measured in terms of employment or value added, the service sector by far dominates the econo- mies of industrialized countries. The positive connection between tertiarization and per capita income is confirmed in both country cross-section and time series analyses. This development can be explained by demand factors (e.g. the growing proportion of female employees) and supply factors (e.g. cost disease in the service sector). This paper analyzes data on 23 service activities, grouped into four subsectors (distribution, business, social and personal services). The analysis of each subsectorȓs contribution to the development of employment and productivity between 1983 and 2003 illuminates the prevailing productivity gap between the EU-15 and the U.S.A. The corresponding investigation of four new EU Member States during their transformation processes points to an employment potential in the tertiary sector that has not yet been fully utilized. The study further identifies four tertiarization models (dynamic, lagging, managed and catching-up) that can be associated with different geographic regions. The process of tertiarization is compatible with growth in both employment and productivity. Different combinations of production- and consumption-oriented services can have a positive effect on growth. The concluding section discusses the role of the European Unionȓs Lisbon strategy in enhancing the productivity of the service sector. JEL classification: O14, O52, O57, F15, L80, P20 Keywords: sectoral change, productivity, country comparison in the EU. 1 Introduction The service sector is by far the most important sector in industrialized economies. The International Labour Organization (ILO, 2006) estimates the service sectorȓs share of total employment in the European Union (EU) and other developed economies to have totaled 71.4% in 2005, having grown from 66.1% in 1995. Over the same period, the industry sector shrunk from 28.7% to 24.9%. Although services account for more than two-thirds of employment and value added, economic analyses and policies continue to focus on industrial production. Services are, of course, extremely heterogeneous; they are dif- ficult to define, differentiate and cate- gorize. Despite these difficulties, the tertiary sector is finally attracting increased national and international attention (for example through the EU Services Directive or the WTOȓs GATS negotiations). The increasing importance of the service sector raises a number of signif- icant questions: Is the structural change from agriculture to industry and on to services an unavoidable, nat- ural phenomenon? Is there a distinct pattern of different phases that all countries must go through in their development processes? What are the underlying reasons and determining factors? Which subsectors are particu- larly important? What are the conse- quences of tertiarization for employ- ment, productivity and the economy as a whole? Can and should this process be influenced? The purpose of this study is to sum- marize the key aspects of sectoral change and to review the findings obtained so far for the EU, including some of its new Member States. It is structured around the following two central working hypotheses: 1. The process of tertiarization is compatible with growth in both employment and productivity. 2. Different combinations of produc- tion- and consumption-oriented services can have a positive effect on growth. In the following sections, the authors investigate the long-term growth trends observed in the tertiary sector and analyze the share of the individual subsectors in total employment and productivity in the EU as compared to the U.S.A. This comparison mainly Andreas Breitenfellner, Antje Hildebrandt Refereed by Robert Stehrer, Vienna Institute for International Economic Studies. High Employment with Low Productivity? The Service Sector as a Determinant of Economic Development 110 Monetary Policy & the Economy Q1/06 ȕ
Transcript
Whether measured in terms of employment or value added, the service sector by far dominates the econo-mies of industrialized countries. The positive connection between tertiarization and per capita income isconfirmed in both country cross-section and time series analyses. This development can be explained bydemand factors (e.g. the growing proportion of female employees) and supply factors (e.g. cost disease inthe service sector). This paper analyzes data on 23 service activities, grouped into four subsectors(distribution, business, social and personal services). The analysis of each subsector�s contribution tothe development of employment and productivity between 1983 and 2003 illuminates the prevailingproductivity gap between the EU-15 and the U.S.A. The corresponding investigation of four new EUMember States during their transformation processes points to an employment potential in the tertiarysector that has not yet been fully utilized. The study further identifies four tertiarization models (dynamic,lagging, managed and catching-up) that can be associated with different geographic regions. The processof tertiarization is compatible with growth in both employment and productivity. Different combinations ofproduction- and consumption-oriented services can have a positive effect on growth. The concludingsection discusses the role of the European Union�s Lisbon strategy in enhancing the productivity of theservice sector.
JEL classification: O14, O52, O57, F15, L80, P20Keywords: sectoral change, productivity, country comparison in the EU.
1 IntroductionThe service sector is by far the mostimportant sector in industrializedeconomies. The International LabourOrganization (ILO, 2006) estimatesthe service sector�s share of totalemployment in the European Union(EU) and other developed economiesto have totaled 71.4% in 2005, havinggrown from 66.1% in 1995. Over thesame period, the industry sectorshrunk from 28.7% to 24.9%.Although services account for morethan two-thirds of employment andvalue added, economic analyses andpolicies continue to focus on industrialproduction. Services are, of course,extremely heterogeneous; they are dif-ficult to define, differentiate and cate-gorize. Despite these difficulties, thetertiary sector is finally attractingincreased national and internationalattention (for example through theEU Services Directive or the WTO�sGATS negotiations).
The increasing importance of theservice sector raises a number of signif-icant questions: Is the structuralchange from agriculture to industryand on to services an unavoidable, nat-ural phenomenon? Is there a distinct
pattern of different phases that allcountries must go through in theirdevelopment processes? What are theunderlying reasons and determiningfactors? Which subsectors are particu-larly important? What are the conse-quences of tertiarization for employ-ment, productivity and the economyas a whole? Can and should this processbe influenced?
The purpose of this study is to sum-marize the key aspects of sectoralchange and to review the findingsobtained so far for the EU, includingsome of its new Member States. It isstructured around the following twocentral working hypotheses:1. The process of tertiarization is
compatible with growth in bothemployment and productivity.
2. Different combinations of produc-tion- and consumption-orientedservices can have a positive effecton growth.
In the following sections, the authorsinvestigate the long-term growthtrends observed in the tertiary sectorand analyze the share of the individualsubsectors in total employment andproductivity in the EU as comparedto the U.S.A. This comparison mainly
High Employment with Low Productivity?The Service Sector as a Determinant
of Economic Development
110 Monetary Policy & the Economy Q1/06�
uses the data of the Groningen Growthand Development Centre (GGDC,2005), which provides a comprehen-sive dataset for the EU and the U.S.A.between 1979 and 2003 and for theCzech Republic, Hungary, Polandand the Slovak Republic from 1995 to2003.1 The database subdivides theeconomy into 57 industries (activities),of which 23 are allocated to the servicesector.
This study is organized as follows:Section 2 provides a summary of thetertiarization trends prevailing in theOECD region and analyzes the varioustheoretical approaches to sectoralchange. Section 3 investigates and cate-gorizes the individual segments withinthe service sector with regard to theirshares of total employment and pro-ductivity in the EU and the U.S.A.Box 2 provides details on the develop-ment in the four largest new EU Mem-ber States. Section 4 attempts to ana-lyze country-specific changes along dif-ferent development paths. Finally, theauthors draw first conclusions for theEU and its new Member States.
2 Sectoral Change:Developments and InitialExplanations
The process of economic developmentis connected with systematic structuralchange in most countries: As per capitaincome rises, the primary sector losesin importance, while the manufactur-ing industry initially gains momentumbut is eventually surpassed by the con-stantly growing service sector.
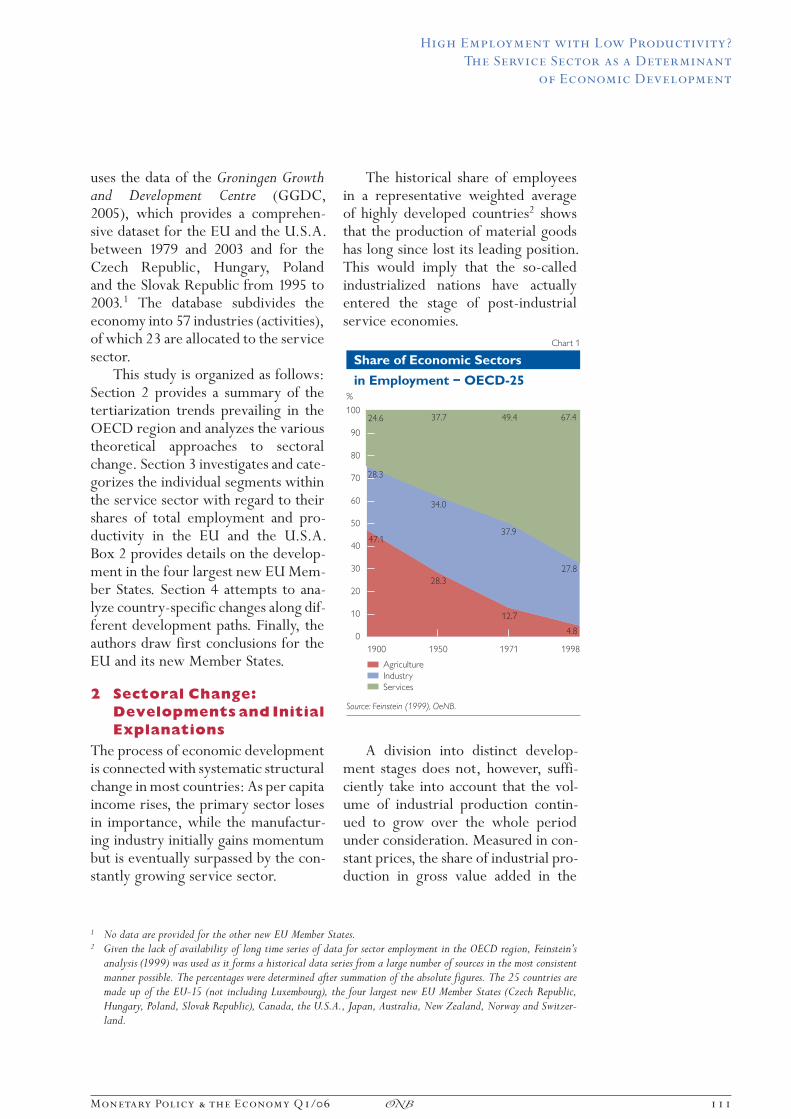
The historical share of employeesin a representative weighted averageof highly developed countries2 showsthat the production of material goodshas long since lost its leading position.This would imply that the so-calledindustrialized nations have actuallyentered the stage of post-industrialservice economies.
A division into distinct develop-ment stages does not, however, suffi-ciently take into account that the vol-ume of industrial production contin-ued to grow over the whole periodunder consideration. Measured in con-stant prices, the share of industrial pro-duction in gross value added in the
1 No data are provided for the other new EU Member States.2 Given the lack of availability of long time series of data for sector employment in the OECD region, Feinstein�s
analysis (1999) was used as it forms a historical data series from a large number of sources in the most consistentmanner possible. The percentages were determined after summation of the absolute figures. The 25 countries aremade up of the EU-15 (not including Luxembourg), the four largest new EU Member States (Czech Republic,Hungary, Poland, Slovak Republic), Canada, the U.S.A., Japan, Australia, New Zealand, Norway and Switzer-land.
�;
:�
�:
�;��;<
���
;:
:�
';��<��;;�'
�<�� �<�� �<;� �<<:
�������
'����������������'������
���
<�
:�
;�
'�
��
��
��
�
��
�
9����"#�"��/��"���&
�����������������1)+++2������
3�������
�������4����A�:���,*=
High Employment with Low Productivity?
The Service Sector as a Determinant
of Economic Development
Monetary Policy & the Economy Q1/06 111�
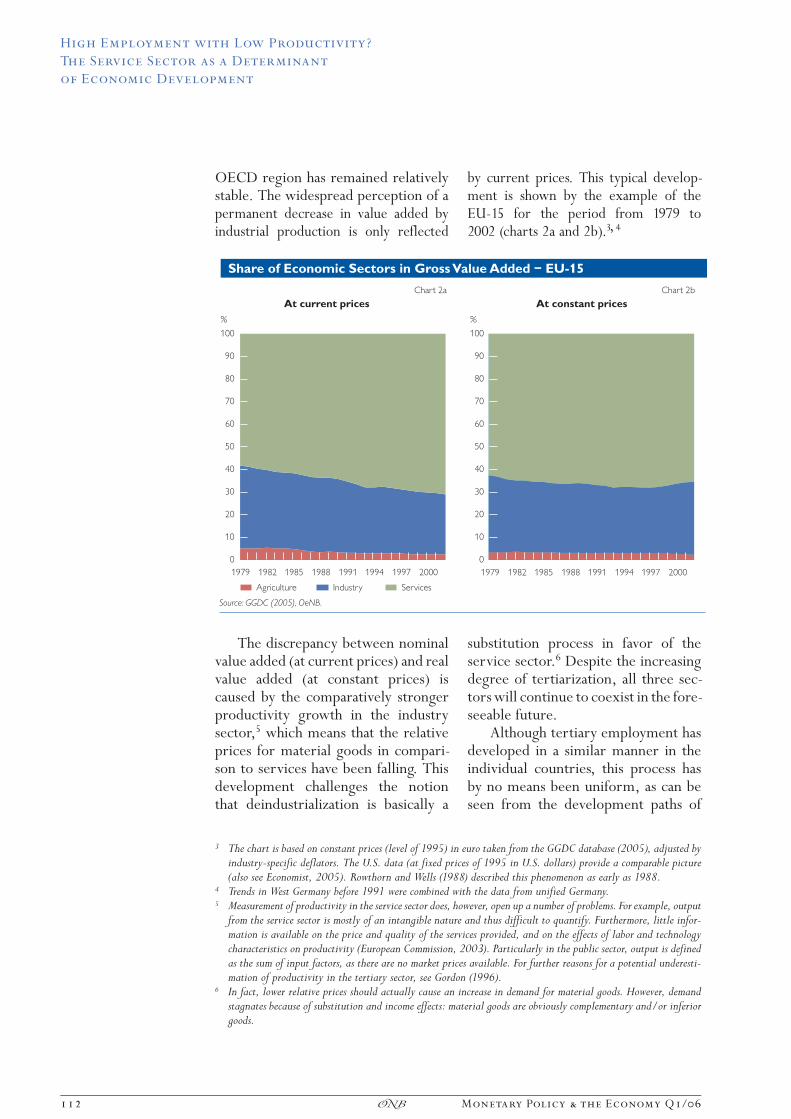
OECD region has remained relativelystable. The widespread perception of apermanent decrease in value added byindustrial production is only reflected
by current prices. This typical develop-ment is shown by the example of theEU-15 for the period from 1979 to2002 (charts 2a and 2b).3, 4
The discrepancy between nominalvalue added (at current prices) and realvalue added (at constant prices) iscaused by the comparatively strongerproductivity growth in the industrysector,5 which means that the relativeprices for material goods in compari-son to services have been falling. Thisdevelopment challenges the notionthat deindustrialization is basically a
substitution process in favor of theservice sector.6 Despite the increasingdegree of tertiarization, all three sec-tors will continue to coexist in the fore-seeable future.
Although tertiary employment hasdeveloped in a similar manner in theindividual countries, this process hasby no means been uniform, as can beseen from the development paths of
3 The chart is based on constant prices (level of 1995) in euro taken from the GGDC database (2005), adjusted byindustry-specific deflators. The U.S. data (at fixed prices of 1995 in U.S. dollars) provide a comparable picture(also see Economist, 2005). Rowthorn and Wells (1988) described this phenomenon as early as 1988.
4 Trends in West Germany before 1991 were combined with the data from unified Germany.
5 Measurement of productivity in the service sector does, however, open up a number of problems. For example, outputfrom the service sector is mostly of an intangible nature and thus difficult to quantify. Furthermore, little infor-mation is available on the price and quality of the services provided, and on the effects of labor and technologycharacteristics on productivity (European Commission, 2003). Particularly in the public sector, output is definedas the sum of input factors, as there are no market prices available. For further reasons for a potential underesti-mation of productivity in the tertiary sector, see Gordon (1996).
6 In fact, lower relative prices should actually cause an increase in demand for material goods. However, demandstagnates because of substitution and income effects: material goods are obviously complementary and/or inferiorgoods.
High Employment with Low Productivity?
The Service Sector as a Determinant
of Economic Development
112 Monetary Policy & the Economy Q1/06�
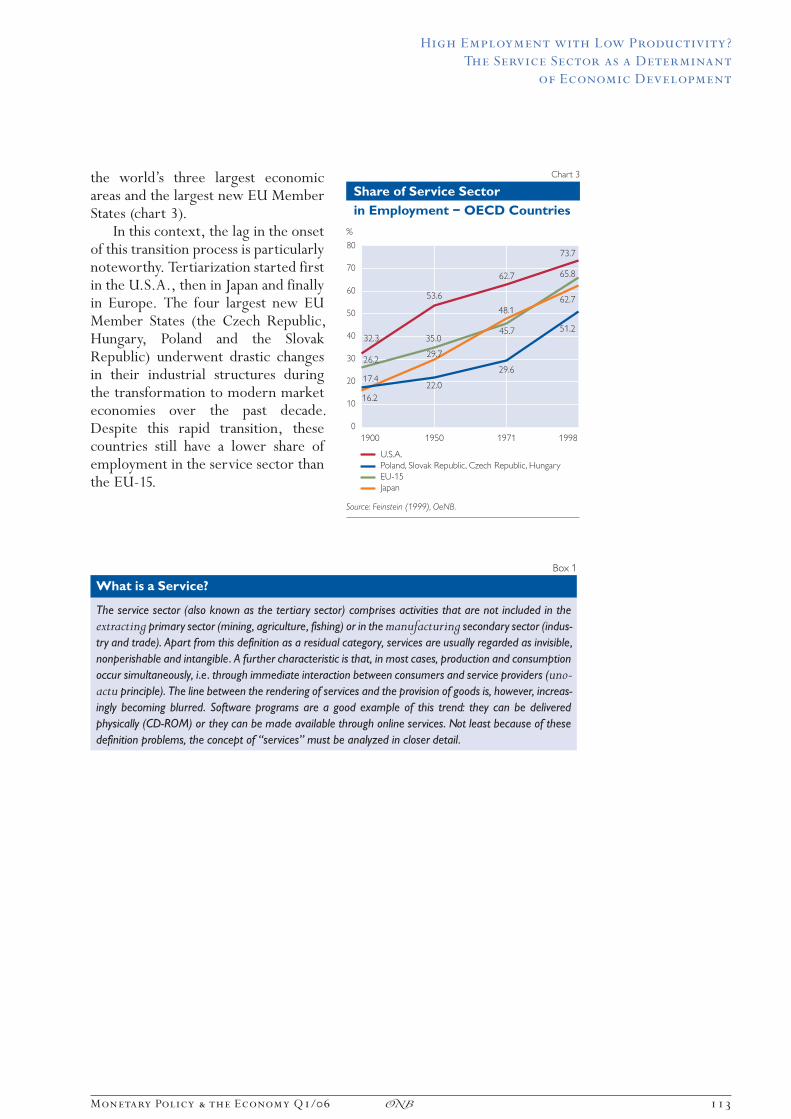
the world�s three largest economicareas and the largest new EU MemberStates (chart 3).
In this context, the lag in the onsetof this transition process is particularlynoteworthy. Tertiarization started firstin the U.S.A., then in Japan and finallyin Europe. The four largest new EUMember States (the Czech Republic,Hungary, Poland and the SlovakRepublic) underwent drastic changesin their industrial structures duringthe transformation to modern marketeconomies over the past decade.Despite this rapid transition, thesecountries still have a lower share ofemployment in the service sector thanthe EU-15.
Box 1
What is a Service?
The service sector (also known as the tertiary sector) comprises activities that are not included in theextracting primary sector (mining, agriculture, fishing) or in the manufacturing secondary sector (indus-try and trade). Apart from this definition as a residual category, services are usually regarded as invisible,nonperishable and intangible. A further characteristic is that, in most cases, production and consumptionoccur simultaneously, i.e. through immediate interaction between consumers and service providers (uno-actu principle). The line between the rendering of services and the provision of goods is, however, increas-ingly becoming blurred. Software programs are a good example of this trend: they can be deliveredphysically (CD-ROM) or they can be made available through online services. Not least because of thesedefinition problems, the concept of �services� must be analyzed in closer detail.
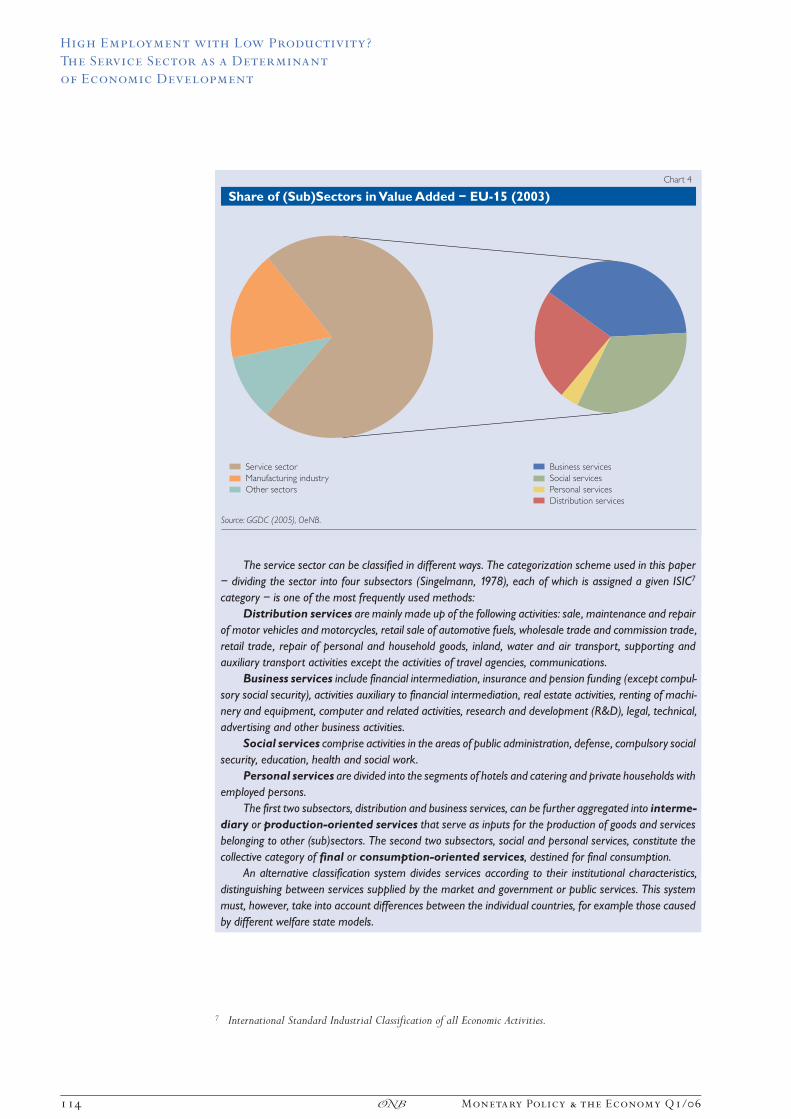
The service sector can be classified in different ways. The categorization scheme used in this paper— dividing the sector into four subsectors (Singelmann, 1978), each of which is assigned a given ISIC7
category — is one of the most frequently used methods:Distribution services are mainly made up of the following activities: sale, maintenance and repair
of motor vehicles and motorcycles, retail sale of automotive fuels, wholesale trade and commission trade,retail trade, repair of personal and household goods, inland, water and air transport, supporting andauxiliary transport activities except the activities of travel agencies, communications.
Business services include financial intermediation, insurance and pension funding (except compul-sory social security), activities auxiliary to financial intermediation, real estate activities, renting of machi-nery and equipment, computer and related activities, research and development (R&D), legal, technical,advertising and other business activities.
Social services comprise activities in the areas of public administration, defense, compulsory socialsecurity, education, health and social work.
Personal services are divided into the segments of hotels and catering and private households withemployed persons.
The first two subsectors, distribution and business services, can be further aggregated into interme-diary or production-oriented services that serve as inputs for the production of goods and servicesbelonging to other (sub)sectors. The second two subsectors, social and personal services, constitute thecollective category of final or consumption-oriented services, destined for final consumption.
An alternative classification system divides services according to their institutional characteristics,distinguishing between services supplied by the market and government or public services. This systemmust, however, take into account differences between the individual countries, for example those causedby different welfare state models.
7 International Standard Industrial Classification of all Economic Activities.
High Employment with Low Productivity?
The Service Sector as a Determinant
of Economic Development
114 Monetary Policy & the Economy Q1/06�
The theory of sectoral change canbe divided into demand8- and supply-oriented approaches (Schettkat andYocarini, 2003):Demand ApproachesThe three-sector hypothesis, whichwas first introduced by Fisher (1935)and Clark (1940), states that a gradualshift in employment and value addedfrom the primary to the tertiary sectoris inherent in the process of economicdevelopment. This hypothesis wasbased on the observation that mostservices have higher income and lowerprice elasticities than agricultural orindustrial products. Consequently, sec-toral change can be characterized asa demand phenomenon. With risingincome levels, the demand for inferiorgoods will inevitably be saturated even-tually, while the demand for superiorservices will continue to grow.
As postulated by Adolph Wagnerback in 1863, in industrialized coun-tries government expenditures willgrow at a faster rate than the outputof goods and services (law of increasingstate activity). The fact that more col-lective services are provided asincomes rise reflects voter preferencesand politicians� interests, but also thefact that individual demand does notsufficiently take into account the posi-tive external effects of social services.9
Demographic factors must also benamed as further demand-orienteddeterminants of structural change,although rising rates of participationby women influence not only the
demand for services but also their sup-ply. A reduction in average householdsize also plays a role, as this reducesthe economies of scale for the provi-sion of services within families (Pohl,1970). A high level of service employ-ment goes hand in hand with a high rateof female participation in the labormarket, as is evidenced by a compari-son of OECD countries (Pilat, 2005).Furthermore, the increasing depend-ence ratio of people not gainfullyemployed — reflecting, above all, thechanging age structure of the popula-tion — leads to a greater demand forservices.10
Supply ApproachesFourastie« (1954) interprets structuralchange similar to the Fisher-Clarkmodel, but places primary focus onthe changes in labor productivitycaused by technological progress.According to Fourastie«, the servicesector is a �catch basin� for the laborforce released from agriculture andindustry.
Baumol (1967) takes a more pessi-mistic view of the phenomenon ofbelow-average productivity develop-ment in the tertiary sector. Becauseof their technological structure, lim-ited capital intensity, and a lack ofreturns to scale, the productivity ofservices can only be raised sporadically.To guarantee the required level of qual-ity it is necessary to employ a minimumamount of labor, as Baumol illustratesby the example of a quintet concert.As, however, wages in all sectors are
8 We are speaking of long-term structural determinants of demand. Rowthorn and Wells (1988) also observe an anti-cyclical component in deindustrialization.
9 Section 3 demonstrates, however, that the EU-15 figures for employment in public administration and defense havefallen over the recent years (catchwords: administrative reform, peace dividend). Furthermore, anecdotal evidenceof the outsourcing or privatization of social services suggests that Wagner�s theory might not have the character of adefinite law.
10 Income differentiation represents a further factor, the level of which displays a positive correlation with the volumein consumption-oriented (personal) services, but correlates negatively with that of the sector as a whole (Bosch andWagner, 2003).
High Employment with Low Productivity?
The Service Sector as a Determinant
of Economic Development
Monetary Policy & the Economy Q1/06 115�
oriented toward the technologicallyprogressive manufacturing sector — pre-suming intersectoral labor mobility —the costs in the technologicallyunchanging sector rise. Consequently,an increasing proportion of labor mustbe channeled into low-growth activi-ties (services), which in turn causesthis cost disease to spread to the econ-omy as a whole, successively slowingdown economic growth.
The growing share of the servicesector in employment and value addedcan also be understood as a result ofcorporate strategies. Such changes inindustrial organization are not exclu-sively aimed at outsourcing jobs yield-ing low productivity or lacking strate-gic importance. On the one hand, spe-cialized service companies satisfydemand at lower prices by exploitingreturns to scale. On the other hand,organizational economies, synergiesand learning effects (Landesmann andPetit, 1995), market developments,and institutional factors (tax or envi-ronmental laws) contribute to the ris-ing importance of (complementary)business services (Mesch, 1997).
The growing popularity of out-sourcing strategies may correlate withdecreasing transaction costs, techno-logical change and a rise in competitivepressure. It is certainly also connectedto globalization tendencies that them-selves affect the size of the servicesector. The acceleration of worldwidedirect investments and the increasedintensity of global trade go hand inhand with the (international) outsourc-ing of production and service functions.The effective management of theseoutsourcing activities requires addi-tional capacities in the service sector(R&D, design, marketing, logistics,
legal and tax consultancy, informationand communication technology (ICT)).In this context, the liberalization offormerly heavily regulated serviceindustries should be mentioned as afactor that might stimulate employ-ment and productivity.
While advanced economies enjoy ahistorically developed comparativeadvantage as market pioneers in theglobalization of (financial and corpo-rate) services, the international out-sourcing of ancillary service inputs isa relatively new trend. The prerequi-sites for this process are technologicalinnovations, such as the developmentof broadband networks, regulatoryreforms and trade liberalization, aswell as the creation of a global marketfor highly qualified employees. Coun-tries like India, but also Ireland andthe Czech Republic, profit from thisdevelopment. The feared negativeeffects on employees in high-wagecountries could only be observed incase studies (Pilat, 2005).
3 The Service Sector as anEngine for Employmentand Productivity?
Apart from the importance of theservice sector for employment andvalue added in the economy as a whole,questions arise about the role servicesplay in the growth of employmentand productivity. In the EU-15, thetotal number of persons employedin the period from 1993 to 2003 roseby approximately 10%, with almost13 percentage points resulting fromemployment growth in the service sec-tor. In other words, the remaining sec-tors made a negative contribution ofalmost 3 percentage points.11 A quitedifferent picture emerges, however,
11 Growth contribution figures indicate the extent to which each sector contributed to total growth (in percentagepoints). The sum of growth contributions thus equals the growth rate of total employment within the service sector.The same applies for contributions to growth in labor productivity (also see OECD, 2003).
High Employment with Low Productivity?
The Service Sector as a Determinant
of Economic Development
116 Monetary Policy & the Economy Q1/06�
when looking at the service sector�simpact on labor productivity growth.Between 1993 and 2003 overall laborproductivity (measured in value addedper employee12) rose by more than40% in the EU-15, but the servicesector contributed just under 7 per-centage points to this increase. Theservice sector as a whole thus madean above-average contribution to thegrowth of employment in the EU-15,but only a below-average contributionto productivity growth. In the sameperiod, the U.S.A. recorded a slightlyhigher employment growth at almost15%, with the service sector alsoaccounting for the largest contribu-tion. Labor productivity rose by morethan 80%, and the service sector con-tributed almost 18 percentage pointsto this figure. These figures reveal theproductivity gap that emerged betweenthe EU-15 and the U.S.A. in thisperiod, a gap that also exists withinthe service sector.
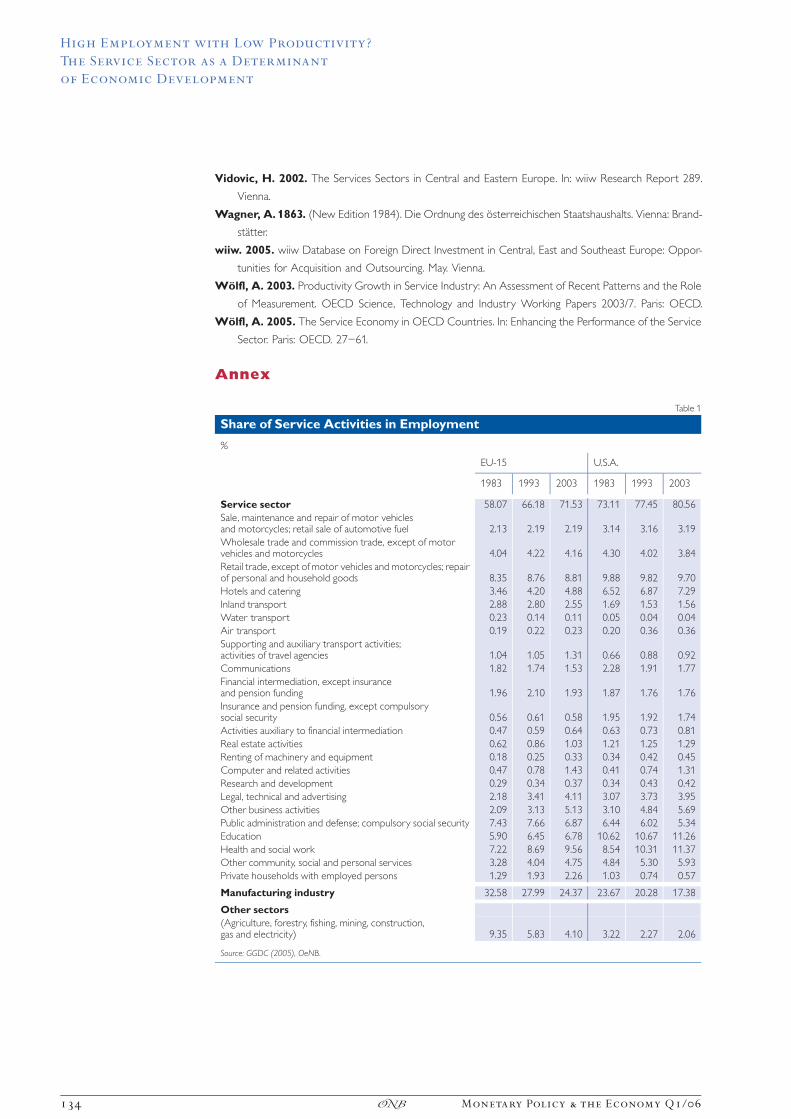
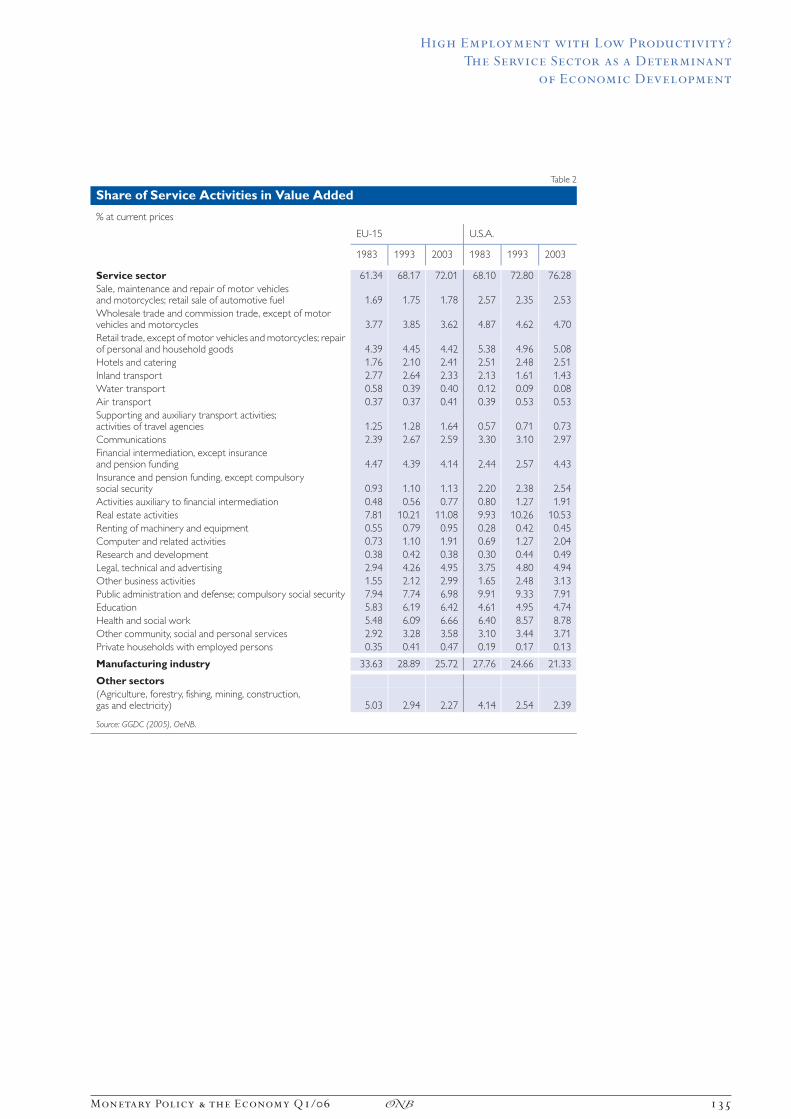
The broad spectrum of the servicesector includes such heterogeneousfields as biotechnology research, graveltransportation, catering services andtelecommunications. Such a diversityrequires a differentiated approach inorder to assess the impact of the indi-vidual activities on growth in employ-ment and productivity. In this analysis,we focus on the EU-15 and use figuresfrom the U.S.A. for comparison pur-poses. The service sector is dividedinto 23 activities in accordance withthe ISIC classification (revision 3, two-and three-digit level; also see tables inthe appendix). These tables not onlypresent the shares of the individual
activities in employment and valueadded, but also show how these shareshave changed over time.
3.1 Employment
Employment in the service sectorgrew by more than 21% in the EU-15between 1983 and 1993, with thegrowth rate slowing down somewhat,to just over 19%, in the period from1993 to 2003. In the U.S.A., by compar-ison, employment increased by morethan 28% in the first period, but itsgrowth rate also declined to approxi-mately 19% between 1993 and 2003.
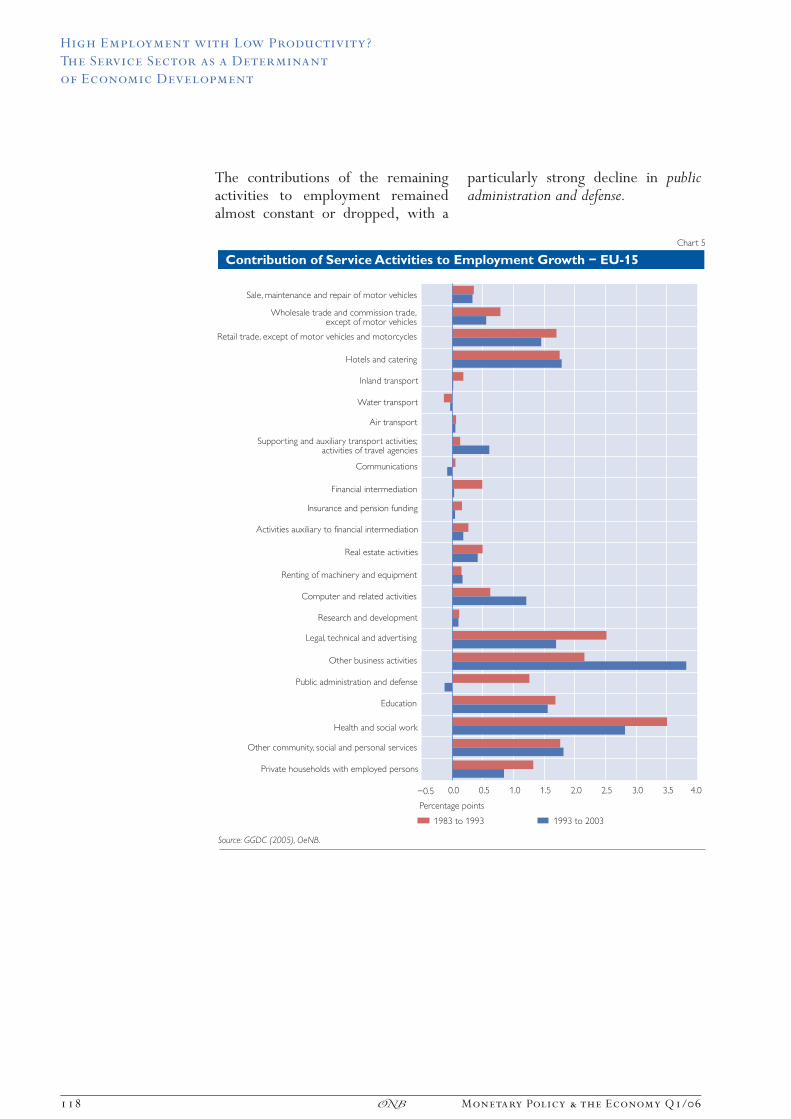
The contributions to growth varyacross individual activities in the EU-15 (chart 5) and lead us to conclude thatrobust growth in employment can beattributed primarily to particularlystrong demand for small range of activ-ities.13 In the period from 1983 to 1993,the labor-intensive field of health andsocial work made the greatest contribu-tion to growth, followed by legal, tech-nical and advertising and other businessactivities. Some fields, such as waterand air transport and communicationseither made a very small or even anegative contribution to employmentgrowth. In the second period (1993to 2003), the contribution of other busi-ness activities increased strongly. Thissegment, which comprises produc-tion-related business services, makesup a substantial proportion of employ-ment and will definitely require a moredetailed statistical analysis in the future.Positive development continues to beseen in the fields of auxiliary transportactivities and activities of travel agencies,as well as computer and related activities.
12 In the calculation of labor productivity, labor input is based on the more common measure of persons employedrather than hours worked. Wo‹lfl (2003) found the choice of input variable to have but a marginal effect onthe result. In the case of the service sector, moreover, there is no conclusive evidence as to which of the two inputfactors results in higher labor productivity growth.
13 In the following section, we will only briefly outline the developments in the service sector, as a detailed analysis ofindividual activities or countries would go beyond the scope of this study.
High Employment with Low Productivity?
The Service Sector as a Determinant
of Economic Development
Monetary Policy & the Economy Q1/06 117�
The contributions of the remainingactivities to employment remainedalmost constant or dropped, with a
particularly strong decline in publicadministration and defense.
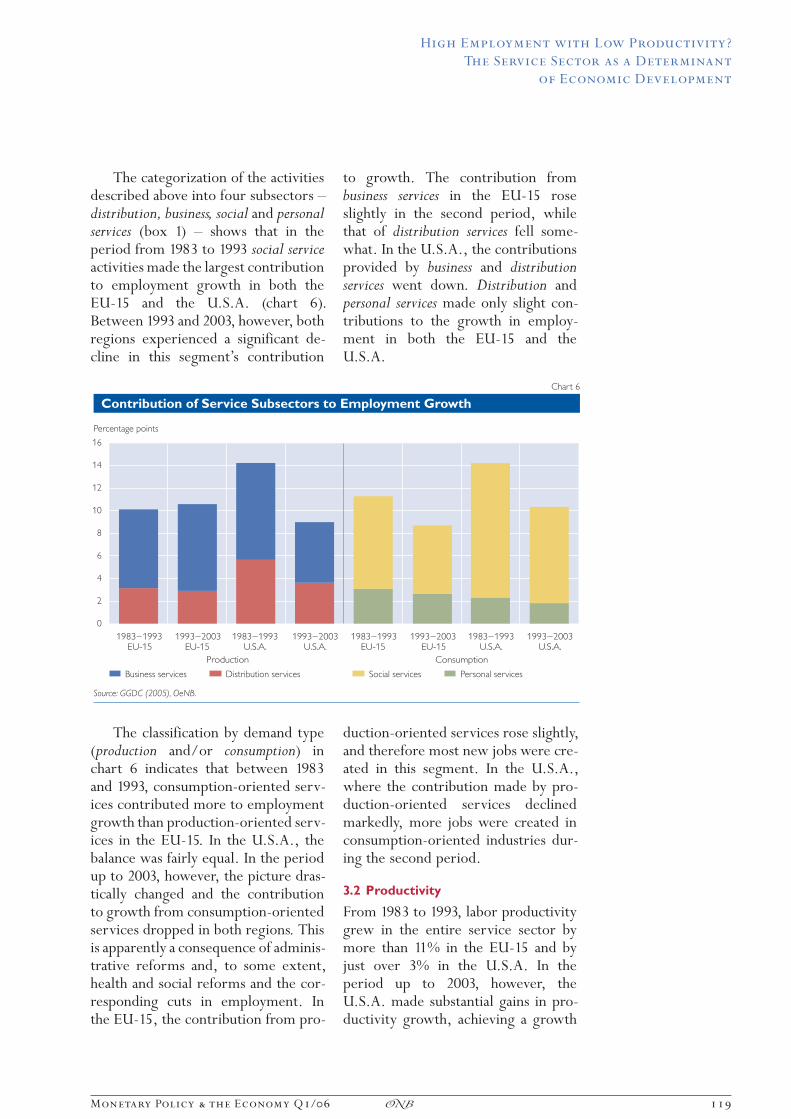
The categorization of the activitiesdescribed above into four subsectors —distribution, business, social and personalservices (box 1) — shows that in theperiod from 1983 to 1993 social serviceactivities made the largest contributionto employment growth in both theEU-15 and the U.S.A. (chart 6).Between 1993 and 2003, however, bothregions experienced a significant de-cline in this segment�s contribution
to growth. The contribution frombusiness services in the EU-15 roseslightly in the second period, whilethat of distribution services fell some-what. In the U.S.A., the contributionsprovided by business and distributionservices went down. Distribution andpersonal services made only slight con-tributions to the growth in employ-ment in both the EU-15 and theU.S.A.
The classification by demand type(production and/or consumption) inchart 6 indicates that between 1983and 1993, consumption-oriented serv-ices contributed more to employmentgrowth than production-oriented serv-ices in the EU-15. In the U.S.A., thebalance was fairly equal. In the periodup to 2003, however, the picture dras-tically changed and the contributionto growth from consumption-orientedservices dropped in both regions. Thisis apparently a consequence of adminis-trative reforms and, to some extent,health and social reforms and the cor-responding cuts in employment. Inthe EU-15, the contribution from pro-
duction-oriented services rose slightly,and therefore most new jobs were cre-ated in this segment. In the U.S.A.,where the contribution made by pro-duction-oriented services declinedmarkedly, more jobs were created inconsumption-oriented industries dur-ing the second period.
3.2 Productivity
From 1983 to 1993, labor productivitygrew in the entire service sector bymore than 11% in the EU-15 and byjust over 3% in the U.S.A. In theperiod up to 2003, however, theU.S.A. made substantial gains in pro-ductivity growth, achieving a growth
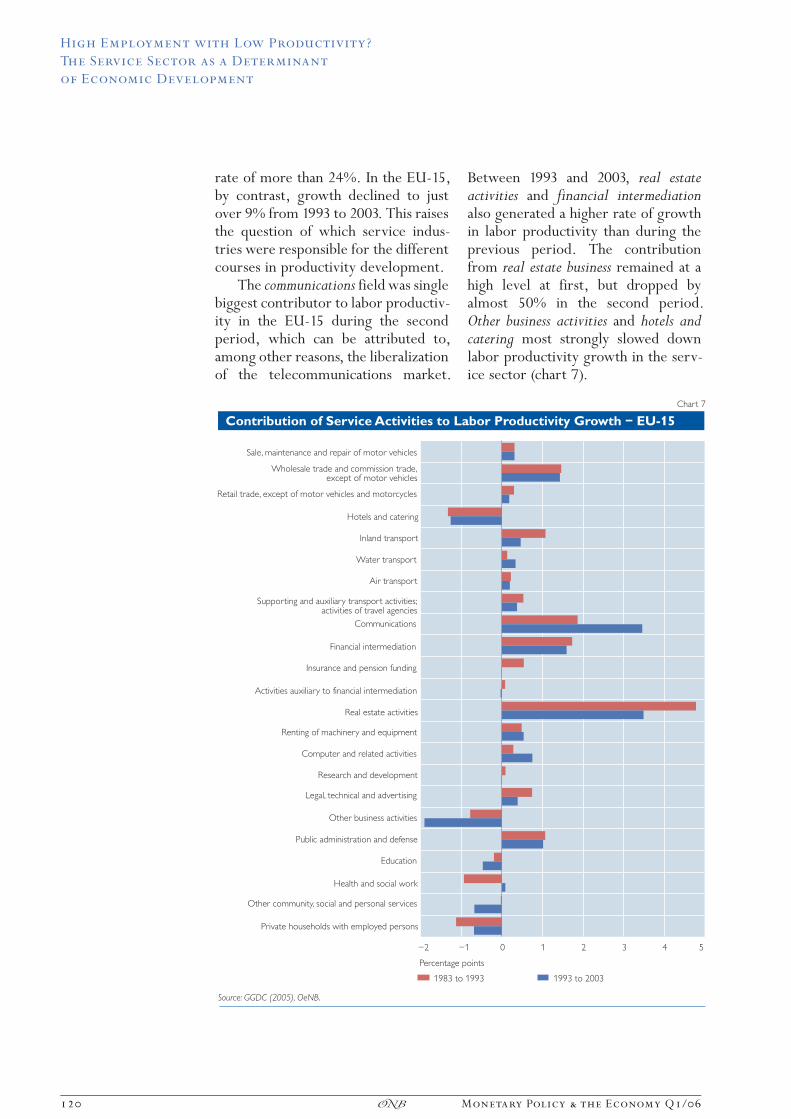
rate of more than 24%. In the EU-15,by contrast, growth declined to justover 9% from 1993 to 2003. This raisesthe question of which service indus-tries were responsible for the differentcourses in productivity development.
The communications field was singlebiggest contributor to labor productiv-ity in the EU-15 during the secondperiod, which can be attributed to,among other reasons, the liberalizationof the telecommunications market.
Between 1993 and 2003, real estateactivities and financial intermediationalso generated a higher rate of growthin labor productivity than during theprevious period. The contributionfrom real estate business remained at ahigh level at first, but dropped byalmost 50% in the second period.Other business activities and hotels andcatering most strongly slowed downlabor productivity growth in the serv-ice sector (chart 7).
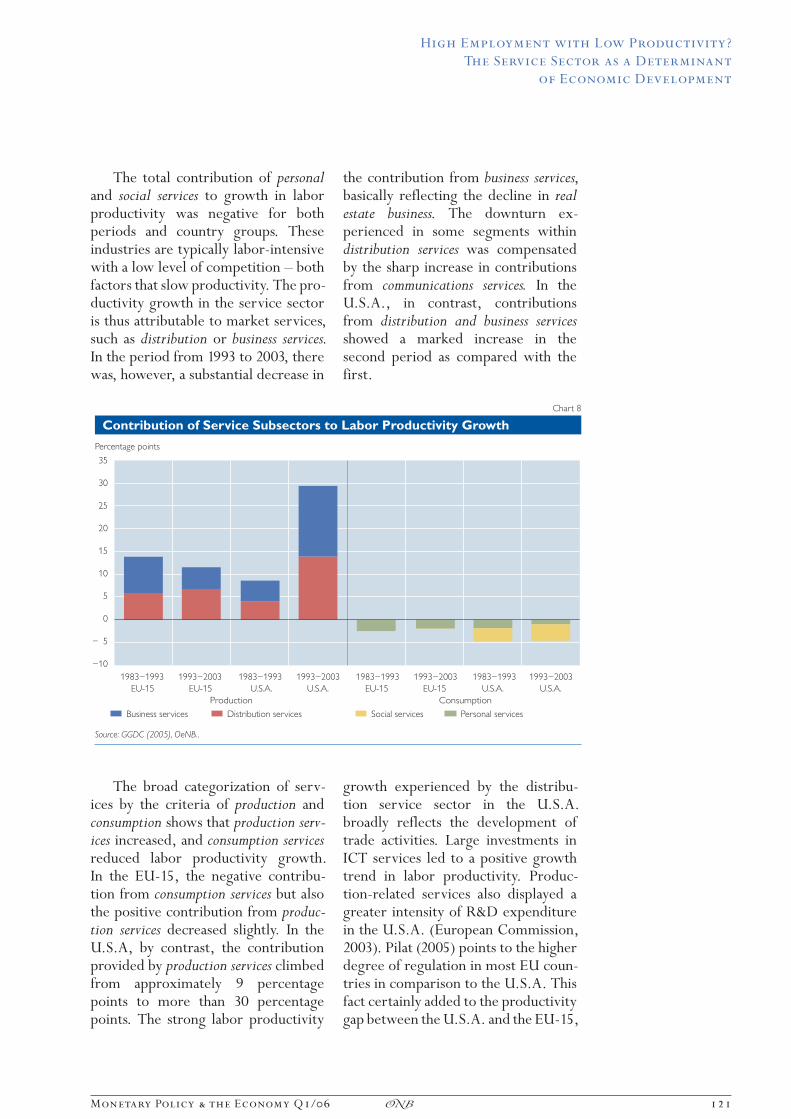
The total contribution of personaland social services to growth in laborproductivity was negative for bothperiods and country groups. Theseindustries are typically labor-intensivewith a low level of competition — bothfactors that slow productivity. The pro-ductivity growth in the service sectoris thus attributable to market services,such as distribution or business services.In the period from 1993 to 2003, therewas, however, a substantial decrease in
the contribution from business services,basically reflecting the decline in realestate business. The downturn ex-perienced in some segments withindistribution services was compensatedby the sharp increase in contributionsfrom communications services. In theU.S.A., in contrast, contributionsfrom distribution and business servicesshowed a marked increase in thesecond period as compared with thefirst.
The broad categorization of serv-ices by the criteria of production andconsumption shows that production serv-ices increased, and consumption servicesreduced labor productivity growth.In the EU-15, the negative contribu-tion from consumption services but alsothe positive contribution from produc-tion services decreased slightly. In theU.S.A, by contrast, the contributionprovided by production services climbedfrom approximately 9 percentagepoints to more than 30 percentagepoints. The strong labor productivity
growth experienced by the distribu-tion service sector in the U.S.A.broadly reflects the development oftrade activities. Large investments inICT services led to a positive growthtrend in labor productivity. Produc-tion-related services also displayed agreater intensity of R&D expenditurein the U.S.A. (European Commission,2003). Pilat (2005) points to the higherdegree of regulation in most EU coun-tries in comparison to the U.S.A. Thisfact certainly added to the productivitygap between the U.S.A. and the EU-15,
as did the different courses of eco-nomic development.
The service sector not onlyaccounts for the largest proportion ofemployment and value added but alsocreates the most jobs. This is particu-larly the case for business servicesand, to a lesser extent, for social ser-vices. In the EU-15, however, the ser-vice sector shows lower rates of pro-ductivity growth than in the U.S.A.14
Of the multitude of different indus-tries, it is primarily business and distri-bution services that drive productivity.This is also where the lag behind theU.S.A. is most noticeable during themost recent period observed. This pro-ductivity gap can be explained, as hasbriefly been discussed above, by a com-
bination of different factors and sector-specific effects.
As a general rule, the limits of pro-ductivity growth can be attributed tostructural factors, such as the necessityfor individual care (social services). Alow level of capital intensity with a cor-respondingly modest growth potentialis a further factor. Services are gener-ally limited to regional or domesticmarkets that are not open to competi-tion and thus only develop a low levelof R&D activities, if at all. Finally, theservice sector is traditionally moreheavily regulated than other sectors(Wo‹lfl, 2005). The experience in theU.S.A. shows, however, that not allof these obstacles to productivity areinsurmountable.
Box 2
Employment and Productivity Growth in Four New EU Member States
Employment GrowthThe Czech Republic, Hungary, Poland and the Slovak Republic displayed similar yet different economicstructures at the beginning of the transformation process from planned economies to market economies.In Poland, for example, the proportion of employees in the agricultural sector was substantially higher thanin the other countries, while in the Czech Republic the manufacturing sector accounted for the highestshare of employment. The service sector pattern was also mixed. While the tertiary sector was of relativelylittle importance in Poland, its share in total employment was already comparatively high at the beginningof the transformation process in the Czech Republic, Hungary and the Slovak Republic. It also grew morestrongly in those three countries than in Poland, where a relatively high number of the labor force is stillemployed in the agricultural sector.
Despite the partially heterogeneous initial situation, the economic convergence of these countrieswith western industrialized nations fostered a process of deindustrialization, coupled with a strengtheningof the tertiary sector. Between 1995 and 2003, the service sector provided a substantial above-averagecontribution to employment growth in all four countries, while farming and manufacturing had a negativeor only slightly positive effect on employment.15
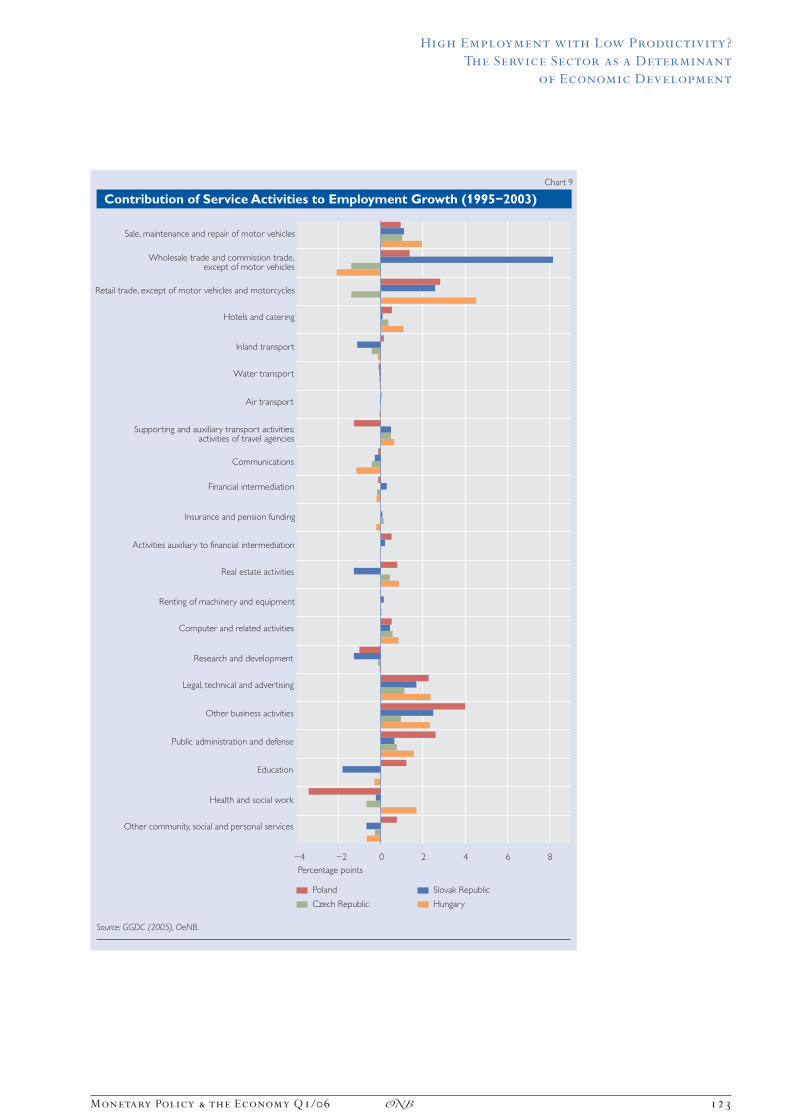
In detail, the following picture emerges for the service sector (chart 9). In all four countries, industriessuch as sale, repair and maintenance of motor vehicles, hotels and catering, legal, technical,advertising and public administration made positive contributions to employment growth. Thedevelopment of some segments, however, showed significant differences. Retail trade, for exam-ple, had a clearly negative effect on employment growth in the Czech Republic, while making a
14 The tertiary sector plays a crucial role in overall productivity growth, not only because of its large share in totalemployment and value added. Moreover, services also impact on the value added in other sectors, as not only goodsbut also, increasingly, services become integral parts of manufacturing processes.
15 From 1995 to 2003, total employment dropped by approximately 11% in Poland, 2% in the Slovak Republic and5% in the Czech Republic. In Hungary, employment increased by more than 8%. The service sector made a positivecontribution to employment growth in all four countries. The remaining sectors had a negative effect on employmentgrowth, with the exception of Hungary, where these sectors made a slightly positive contribution.
positive contribution in Hungary, Poland and the Slovak Republic. Health and social work, on the otherhand, led to an increase in employment in Hungary but had a negative impact on employmentgrowth in the other three countries.
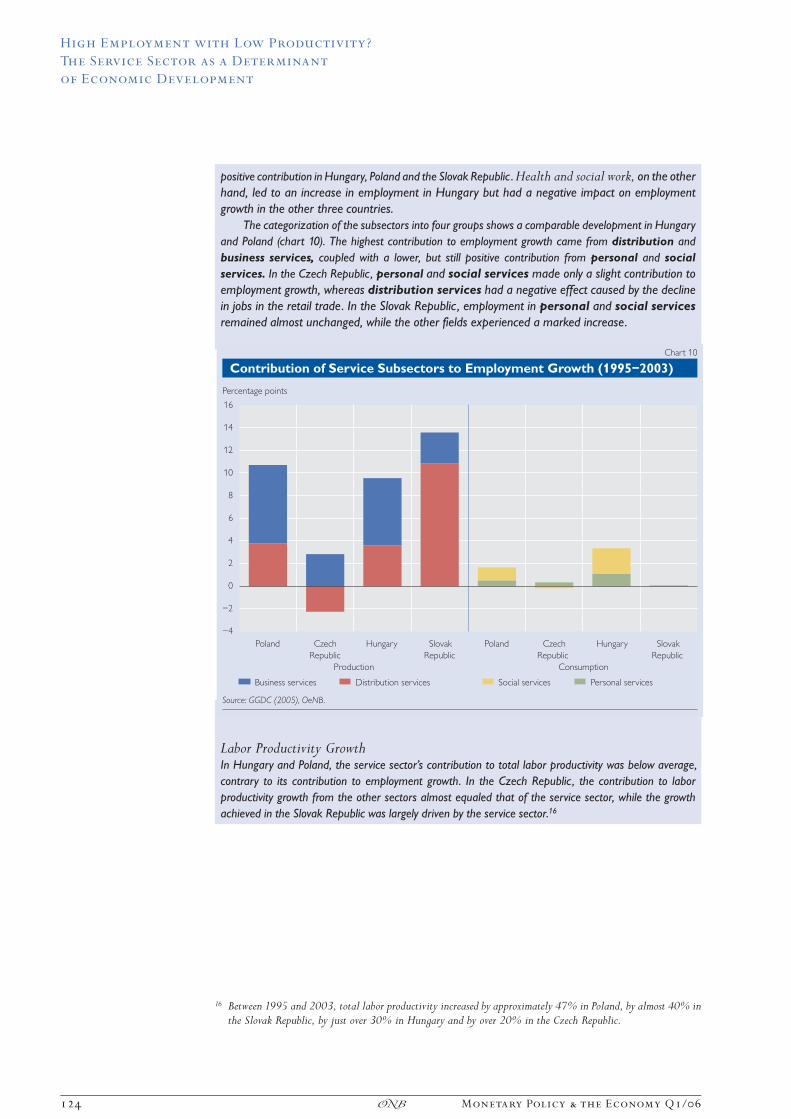
The categorization of the subsectors into four groups shows a comparable development in Hungaryand Poland (chart 10). The highest contribution to employment growth came from distribution andbusiness services, coupled with a lower, but still positive contribution from personal and socialservices. In the Czech Republic, personal and social services made only a slight contribution toemployment growth, whereas distribution services had a negative effect caused by the declinein jobs in the retail trade. In the Slovak Republic, employment in personal and social servicesremained almost unchanged, while the other fields experienced a marked increase.
Labor Productivity GrowthIn Hungary and Poland, the service sector�s contribution to total labor productivity was below average,contrary to its contribution to employment growth. In the Czech Republic, the contribution to laborproductivity growth from the other sectors almost equaled that of the service sector, while the growthachieved in the Slovak Republic was largely driven by the service sector.16
16 Between 1995 and 2003, total labor productivity increased by approximately 47% in Poland, by almost 40% inthe Slovak Republic, by just over 30% in Hungary and by over 20% in the Czech Republic.
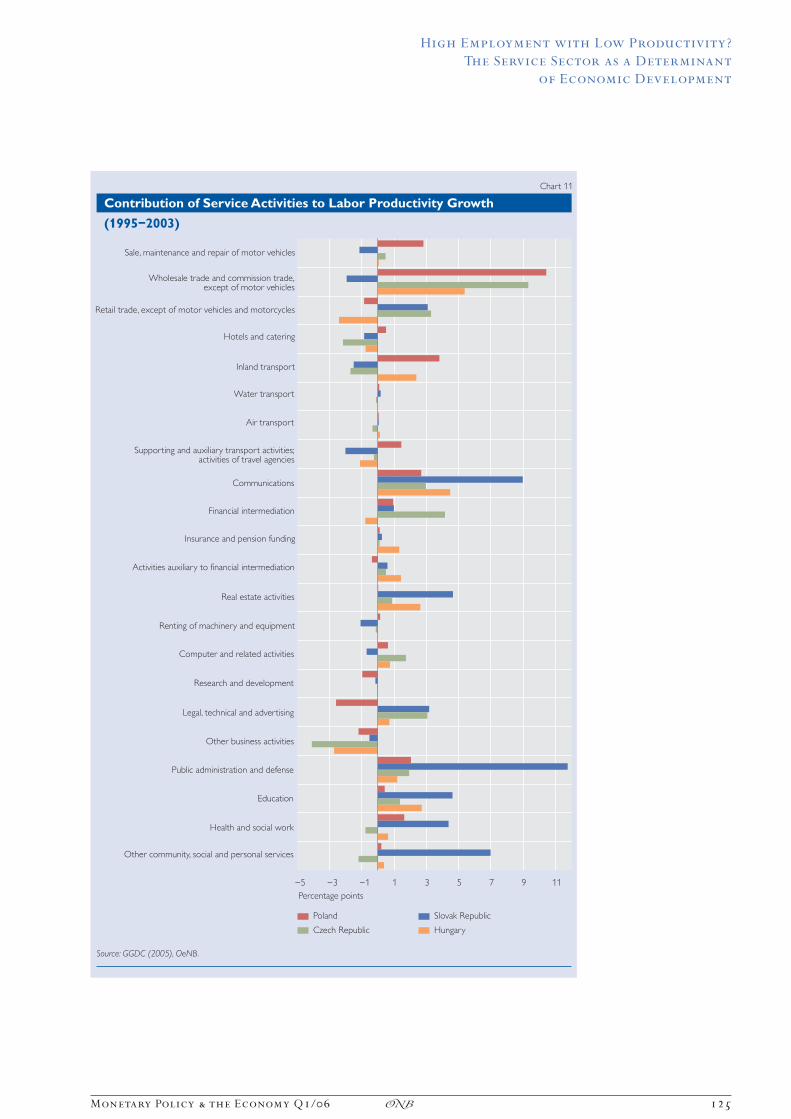
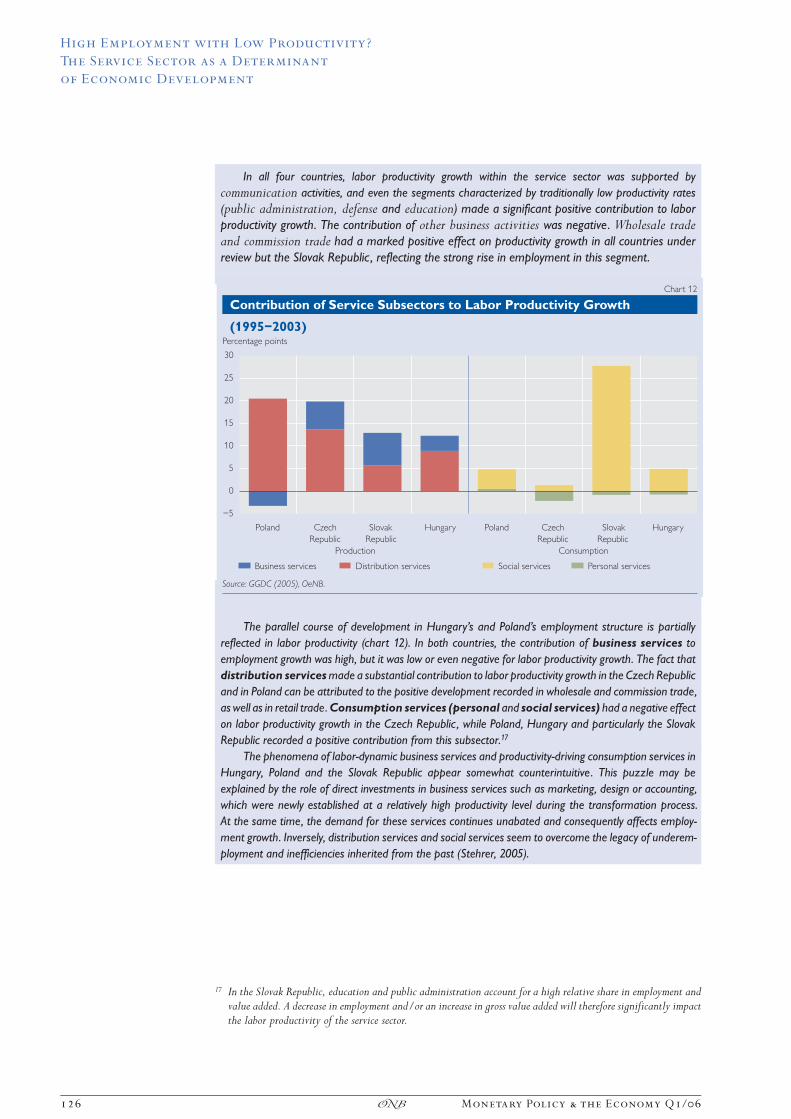
In all four countries, labor productivity growth within the service sector was supported bycommunication activities, and even the segments characterized by traditionally low productivity rates(public administration, defense and education) made a significant positive contribution to laborproductivity growth. The contribution of other business activities was negative. Wholesale tradeand commission trade had a marked positive effect on productivity growth in all countries underreview but the Slovak Republic, reflecting the strong rise in employment in this segment.
The parallel course of development in Hungary�s and Poland�s employment structure is partiallyreflected in labor productivity (chart 12). In both countries, the contribution of business services toemployment growth was high, but it was low or even negative for labor productivity growth. The fact thatdistribution services made a substantial contribution to labor productivity growth in the Czech Republicand in Poland can be attributed to the positive development recorded in wholesale and commission trade,as well as in retail trade. Consumption services (personal and social services) had a negative effecton labor productivity growth in the Czech Republic, while Poland, Hungary and particularly the SlovakRepublic recorded a positive contribution from this subsector.17
The phenomena of labor-dynamic business services and productivity-driving consumption services inHungary, Poland and the Slovak Republic appear somewhat counterintuitive. This puzzle may beexplained by the role of direct investments in business services such as marketing, design or accounting,which were newly established at a relatively high productivity level during the transformation process.At the same time, the demand for these services continues unabated and consequently affects employ-ment growth. Inversely, distribution services and social services seem to overcome the legacy of underem-ployment and inefficiencies inherited from the past (Stehrer, 2005).
17 In the Slovak Republic, education and public administration account for a high relative share in employment andvalue added. A decrease in employment and/or an increase in gross value added will therefore significantly impactthe labor productivity of the service sector.
High Employment with Low Productivity?
The Service Sector as a Determinant
of Economic Development
126 Monetary Policy & the Economy Q1/06�
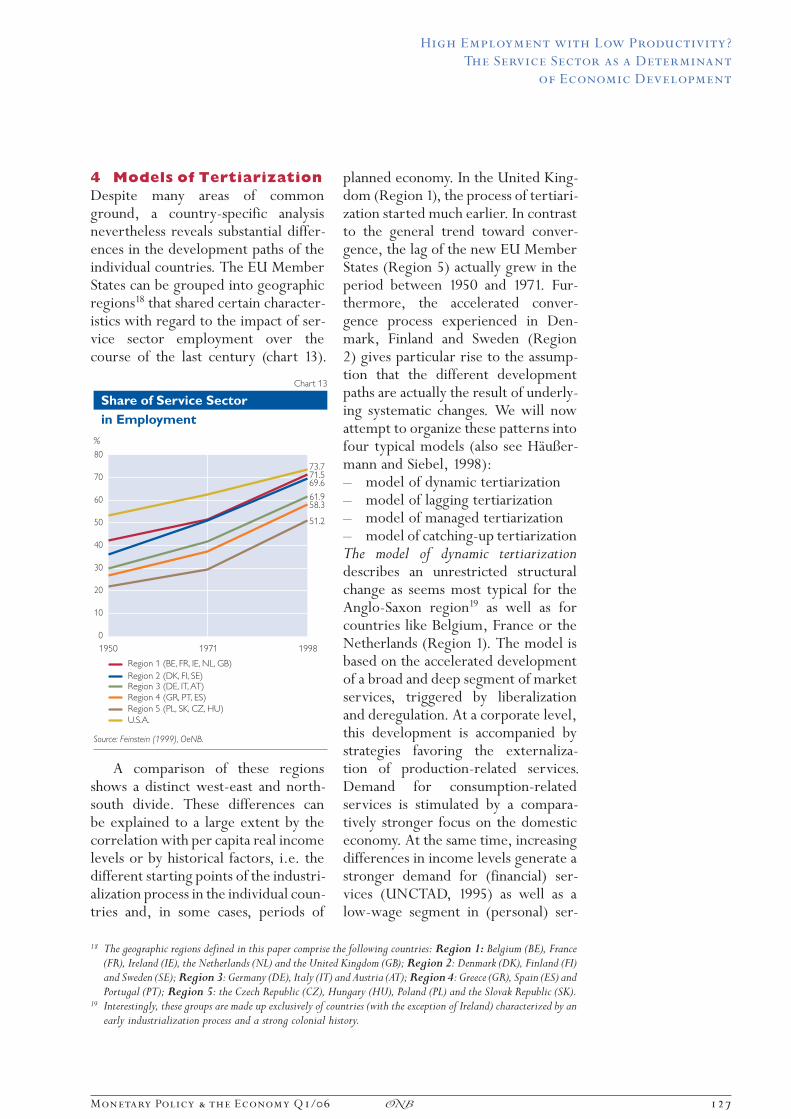
4 Models of TertiarizationDespite many areas of commonground, a country-specific analysisnevertheless reveals substantial differ-ences in the development paths of theindividual countries. The EU MemberStates can be grouped into geographicregions18 that shared certain character-istics with regard to the impact of ser-vice sector employment over thecourse of the last century (chart 13).
A comparison of these regionsshows a distinct west-east and north-south divide. These differences canbe explained to a large extent by thecorrelation with per capita real incomelevels or by historical factors, i.e. thedifferent starting points of the industri-alization process in the individual coun-tries and, in some cases, periods of
planned economy. In the United King-dom (Region 1), the process of tertiari-zation started much earlier. In contrastto the general trend toward conver-gence, the lag of the new EU MemberStates (Region 5) actually grew in theperiod between 1950 and 1971. Fur-thermore, the accelerated conver-gence process experienced in Den-mark, Finland and Sweden (Region2) gives particular rise to the assump-tion that the different developmentpaths are actually the result of underly-ing systematic changes. We will nowattempt to organize these patterns intofour typical models (also see Ha‹u§er-mann and Siebel, 1998):— model of dynamic tertiarization— model of lagging tertiarization— model of managed tertiarization— model of catching-up tertiarizationThe model of dynamic tertiarizationdescribes an unrestricted structuralchange as seems most typical for theAnglo-Saxon region19 as well as forcountries like Belgium, France or theNetherlands (Region 1). The model isbased on the accelerated developmentof a broad and deep segment of marketservices, triggered by liberalizationand deregulation. At a corporate level,this development is accompanied bystrategies favoring the externaliza-tion of production-related services.Demand for consumption-relatedservices is stimulated by a compara-tively stronger focus on the domesticeconomy. At the same time, increasingdifferences in income levels generate astronger demand for (financial) ser-vices (UNCTAD, 1995) as well as alow-wage segment in (personal) ser-
18 The geographic regions defined in this paper comprise the following countries: Region 1: Belgium (BE), France(FR), Ireland (IE), the Netherlands (NL) and the United Kingdom (GB); Region 2: Denmark (DK), Finland (FI)and Sweden (SE); Region 3: Germany (DE), Italy (IT) and Austria (AT); Region 4: Greece (GR), Spain (ES) andPortugal (PT); Region 5: the Czech Republic (CZ), Hungary (HU), Poland (PL) and the Slovak Republic (SK).
19 Interestingly, these groups are made up exclusively of countries (with the exception of Ireland) characterized by anearly industrialization process and a strong colonial history.
High Employment with Low Productivity?
The Service Sector as a Determinant
of Economic Development
Monetary Policy & the Economy Q1/06 127�
vices. Literature initially took a criticalstance toward the deindustrializationassociated with this model (Baumol,1967; Cohen and Zysman, 1987). Thisperception has, however, changed overtime, and this type of deindustrializa-tion is now considered positive deindus-trialization (Rowthorn and Wells,1988), as long as it reflects the degreeof trade specialization on serviceexports and an economy�s level ofmaturity rather than the impact of arecession.
Lagging tertiarization can beviewed as a representative model ofthe structural development observedin long-term EU Member States suchas Germany, Italy and Austria (Region3), which is characterized by a compa-ratively stable position of the industrysector. This is, on the one hand, causedby the tendency of many manufactur-ing companies to internalize services,for example to maintain the qualitystandards of high-value material goods.On the other hand, this phenomenon isalso a result of industrial policy inter-vention for the sake of vested interests.The protection of the secondary sectoris frequently justified by the assump-tion that productivity growth can bebest generated in this sector. Further-more, lagging tertiarization is alsocharacterized by the high share of man-ufacturing exports in GDP. This ismostly the result of a historically deter-mined pattern of specialization in theinternational division of labor: a proc-ess in which original factor endow-ment, returns to scale, synergies andreputation effects play a role (�Madein Germany,� Italian design, etc.).Another reason for lagging tertiariza-tion lies in the corporatist system ofsocial partnership, which tends to givehigher priority to the competitivenessof industrial locations than to otherpolicy goals.
The model of managed tertiariza-tion is associated primarily with Den-mark, Finland and Sweden (Region 2).Some elements can also be found in theNetherlands (Region 1). This modelembodies a strategy, followed moreor less consciously, to promote thedevelopment of knowledge-based andsocial services. Despite their relativelylate start at industrialization, thesecountries very soon evolved intoservice societies. The post-war Scandi-navian welfare state was characterizedby a highly productive manufacturingsector and a well-developed system ofpublic and social services, combinedwith significant rates of female laborparticipation. The structural crisis ofthe late 1980s prompted a transitiontoward a knowledge society, accompa-nied by adjustments to the welfare statesystem, which was, however, basicallykept in place. In this model, the publicsector decreases only slightly in impor-tance, remaining the most importantemployer for the female workforceand experiencing competition fromthe private sector particularly in thearea of household-related services.The liberalized, production-orientedservice sector, which is marked bystrong cross-links to the modernizedand export-oriented manufacturingsector, remains the main source ofemployment growth. The promotionof human capital development andinnovation plays a central role in themodel of managed tertiarization(Aring, 2003).
Catching-up tertiarization describesthe transition process experienced bycountries that joined the EU at a laterstage: during the southern enlarge-ment round — Greece, Spain and Portu-gal (Region 4) — or, most recently, inthe eastern enlargement round — theCzech Republic, Hungary, Polandand the Slovak Republic (Region 5).
High Employment with Low Productivity?
The Service Sector as a Determinant
of Economic Development
128 Monetary Policy & the Economy Q1/06�
This model reflects the general shifttoward the tertiary sector that is associ-ated with rising per capita income. Afurther notable phenomenon is thatdeindustrialization and deagriculturali-zation in the countries of Region 5 notonly occurred with a time lag, but alsoto a far stronger degree than in Region4, particularly during the first recessiveyears of transformation until 1995.This is not surprising if we take intoaccount the overly strong emphasisthe former centrally planned econo-mies put on the manufacturing indus-try. Employment in the service sectorwas considered unproductive for ideo-logical reasons and the function of thissector in the economy was neglected(Vidovic, 2002). A large number ofservices were also integrated into the
agricultural or industrial conglomer-ates. These countries� transformationinto market economies is thereforeaccompanied by a tertiarization proc-ess that takes place �in fast-forwardmode,� at least if including the firstyears of recession. This developmentdoes not, however, follow the samepattern across all industries (box 2).In several areas, a high proportion offoreign direct investments (wiiw,2005) unquestionably contributed tothe rise in productivity. Employmentin the service sector is thus not yet ina position to fully compensate for thedecline in jobs experienced in theother two sectors. Comparisons withsimilar developments observed inGreece, Spain and Portugal should,however, give cause for optimism
because a mainly long- and medium-term trend of convergence can bedetected not only among all countriesand groups of countries (or models),but also within the individual groupsof countries (or models).20
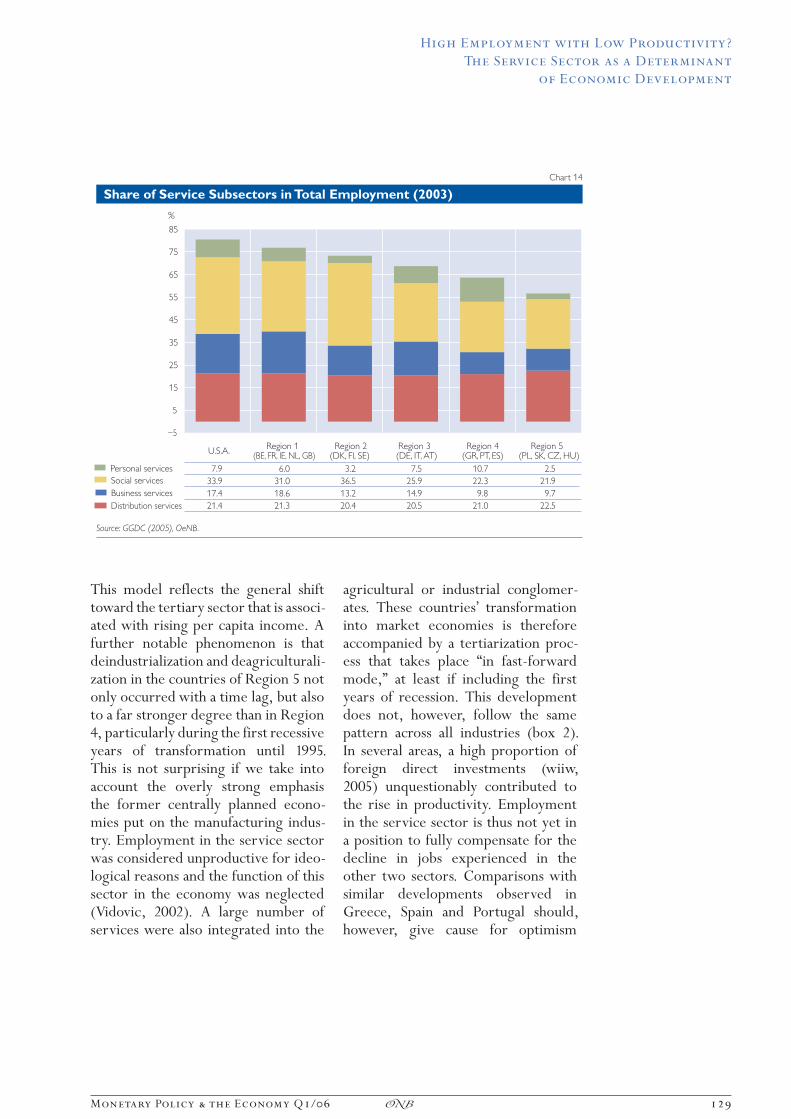
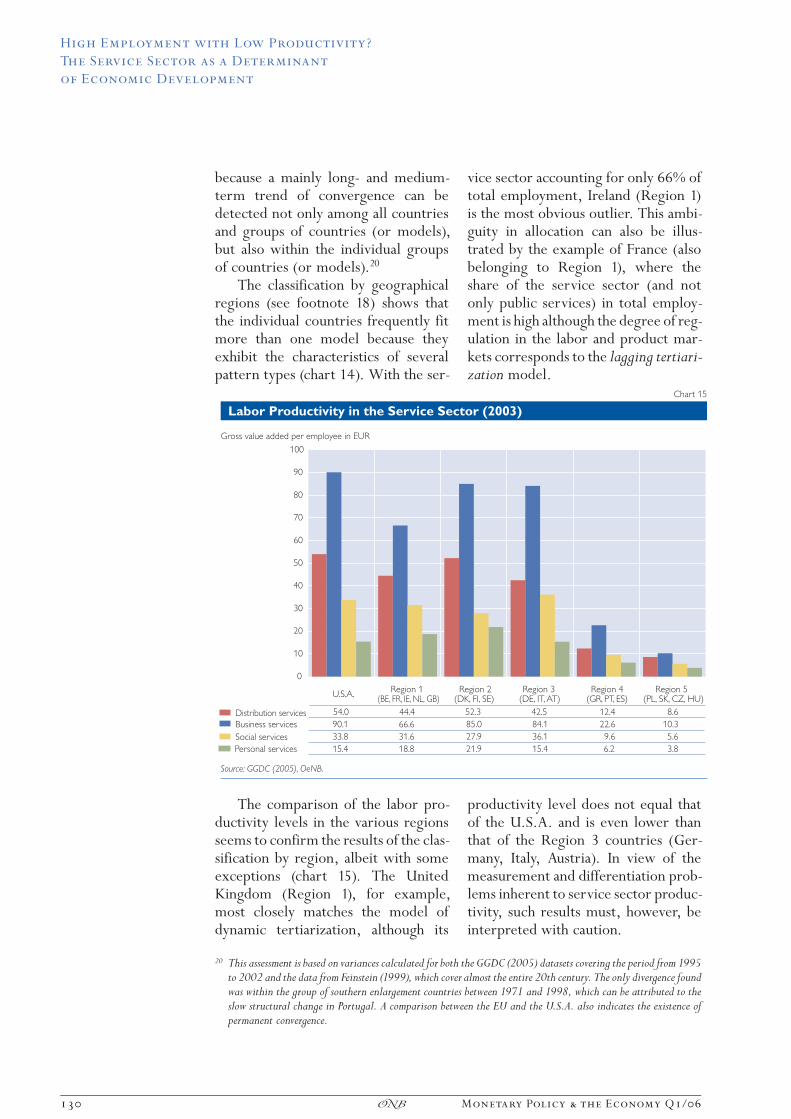
The classification by geographicalregions (see footnote 18) shows thatthe individual countries frequently fitmore than one model because theyexhibit the characteristics of severalpattern types (chart 14). With the ser-
vice sector accounting for only 66% oftotal employment, Ireland (Region 1)is the most obvious outlier. This ambi-guity in allocation can also be illus-trated by the example of France (alsobelonging to Region 1), where theshare of the service sector (and notonly public services) in total employ-ment is high although the degree of reg-ulation in the labor and product mar-kets corresponds to the lagging tertiari-zation model.
The comparison of the labor pro-ductivity levels in the various regionsseems to confirm the results of the clas-sification by region, albeit with someexceptions (chart 15). The UnitedKingdom (Region 1), for example,most closely matches the model ofdynamic tertiarization, although its
productivity level does not equal thatof the U.S.A. and is even lower thanthat of the Region 3 countries (Ger-many, Italy, Austria). In view of themeasurement and differentiation prob-lems inherent to service sector produc-tivity, such results must, however, beinterpreted with caution.
20 This assessment is based on variances calculated for both the GGDC (2005) datasets covering the period from 1995to 2002 and the data from Feinstein (1999), which cover almost the entire 20th century. The only divergence foundwas within the group of southern enlargement countries between 1971 and 1998, which can be attributed to theslow structural change in Portugal. A comparison between the EU and the U.S.A. also indicates the existence ofpermanent convergence.
��������
6��������! ���"��4�������'��"����'������<,--8=
�������#"�������������!�#�&������(70
������� 00/��1%&&'2������
+"���������������>�����*"�������������
�������#���������3����#���������
���<����:���
���'''��'�::
��:��;<�<
��:���'����
��'<''
:'����'�:
739 0��������+(D�20D�/(D��FD� +�
0�������>@D�2/D�3(�
0��������>(D�/1D�91�
0�������� 0D��1D�(3�
0���������FD�3@D��GD�57�
�
��
�
��
��
��
'�
;�
:�
<�
���
High Employment with Low Productivity?
The Service Sector as a Determinant
of Economic Development
130 Monetary Policy & the Economy Q1/06�
The classification presented in thisstudy offers an alternative basis for dis-cussion with respect to the usualdichotomy between the U.S.A. andthe EU. Numerous economists con-sider the service sector as a key tounderstanding the productivity andgrowth gap between Europe and theU.S.A. Rogerson (2005) also explainsEurope�s post-1950s employment gapwith the underdevelopment of marketservices. Although, beginning in 1973,the tertiary sector significantly con-tributed to the deceleration of produc-tivity growth in both economic areas,services (particularly financial and dis-tribution services) caught up with theindustry sector in the U.S.A. duringthe mid-1990s and subsequently con-tributed to an acceleration of produc-tivity growth. Triplett and Bosworth(2003) conclude that Baumol�s cost dis-ease is cured and that the phenomenonknown as productivity paradox — the fail-ure of reinvestment in technology toboost productivity growth in the ser-vice sector — is solved. Van Ark(2005) pins his hope on the possibilitythat Europe could follow a similar pat-tern, even if the increase in the produc-tivity of market services resulting froma more widespread ICT use wouldoccur with a certain delay. The rapidadjustment of the economy requires,however, a supportive macroeconomicenvironment, flexible structures inproduct and factor markets, and thepromotion of innovation diffusion andhuman capital creation. The EU�s Lis-bon strategy proposes a range of corre-sponding measures. Perhaps the objec-tive of becoming the most competitive anddynamic knowledge-based economy in theworld seems somewhat ambitious. Yet
the pursuit of employment and pro-ductivity gains in the service sector isnevertheless essential for the promo-tion of economic growth.
5 ConclusionsSectoral change is a �natural� process(Economist, 2005) that occurs in allcountries throughout the world andcan be accelerated or slowed downonly to a limited extent. The impor-tance of the service sector for eco-nomic growth is often underestimated.In the enlarged EU, the service indus-try is already a crucial source ofemployment, and there is still roomfor expansion. Moreover, the potentialof services to boost productivity hasyet to be unlocked. Cross-links to themanufacturing sector and its role inthe globalization process also influencethe growth dynamics of the servicesector. The experience of the U.S.A.or of countries like Denmark, Finlandand Sweden shows that the suspicionof an inevitable trade-off betweenemployment and productivity isunfounded. These examples also dem-onstrate that various combinations ofdistribution, business, social and per-sonal services can produce similarlypositive results.
The classification into four modelsof development paths presented in thisstudy is only a rough sketch but con-firms the initial impression of the exis-tence of different tertiarization mod-els, although an empirical test has notyet been performed. A further fieldof research is the productivity growthof services.21 The European servicesector can only be effectively curedonce the cost disease has correctly beendiagnosed. Its recovery would boost
21 More insights into this topic can be expected in the near future, for example from the EU KLEMS Project onProductivity in the European Union coordinated by the Groningen Growth and Development Centre(www.euklems.net).
High Employment with Low Productivity?
The Service Sector as a Determinant
of Economic Development
Monetary Policy & the Economy Q1/06 131�
economic growth and thus facilitatesecuring price stability in monetarypolicy22 in the longer term (Cetteand Pfister, 2004).
Particularly, the Member Statesthat joined the EU during the southernenlargement round (Greece, Spain andPortugal) and the new Central andEastern European EU Member Statesneed to decide which of the advancedtertiarization models would be the bestway forward for them. In this respect,the Lisbon strategy provides somedirection for convergence toward themodel of managed tertiarization (Euro-pean Commission, 2006). A largenumber of the quantitative Lisbonobjectives would imply direct or indi-rect impulses for the development ofhighly productive and socially balancedservice economies. Efforts will focuson increasing employment rates, espe-cially in the female labor force, facili-tating broad-based education amongyoung people, raising the levels of pri-vate and public R&D investments,intensifying competition, improvingregulation23 and ultimately completingthe single market for services whilepreserving social cohesion. OECD rec-
ommendations, moreover, urge forfurther reforms to increase productiv-ity in the service sector: Open nationaland international markets for services,flexible labor markets, lifelong humancapital investment, targeted innovationpolicies, comprehensive implementa-tion of information and communica-tion technology, and a favorable tax sys-tem assist in meeting the challenge ofglobalization (Pilat, 2005).
Knowledge-intensive corporateservices increasingly shrink the bor-ders between the different sectors.The multiplier effect of such servicesultimately guarantees the continuityof industrial production with a highdegree of value added. At the sametime, (public) social services and (pri-vate) personal services provide the pre-requisites for reconciling family andcareer, drive out the hidden economyand improve the quality of life in a pop-ulation characterized by a changing agestructure. Last but not least, an evolv-ing service culture that meets newneeds and that combines professionalwith social skills and innovation withflexibility promotes both growth andemployment.
ReferencesAring, J. 2003. Industrielle Produktion und Dienstleistungsgesellschaft als komplementa‹re Sa‹ulen der
Modernisierung in Schweden. Norden 15. 15—22.
Baumol, W. J. 1967. Macroeconomics of Unbalanced Growth: the Anatomy of Urban Crisis. In: The
American Economic Review 57. 415—426.
Bosch, G. and A. Wagner. 2003. Bescha‹ftigungshoffnung Dienstleistungen braucht politische
Begleitung. IAT-Report 2003-04. Wissenschaftszentrum Institut Arbeit und Technik. Gelsenkirchen.
Cette, G. and C. Pfister. 2004. Challenges of the �New Economy� for Monetary Policy. International
Productivity Monitor. CSLS. Ottawa.
Clark, C. 1940. (Revised New Edition 1951). The Conditions of Economic Progress. London: Macmillan.
Cohen, S. and J. Zysmann. 1987. Manufacturing Matters. The Myth of the Postindustrial Economy. New
York: Basic Books.
22 In the short term, however, insecurities regarding potential growth lead to asymmetric costs (Cette and Pfister,2004).
23 Peneder, Kaniovsky and Dachs (2001) make a plausible case that services are confronted with asymmetric infor-mation problems to a greater extent because of the simultaneous nature of production and consumption. Therefore,standardization of quality is called for to strengthen consumer trust and competition.
High Employment with Low Productivity?
The Service Sector as a Determinant
of Economic Development
132 Monetary Policy & the Economy Q1/06�
Economist. 2005. Industrial Metamorphosis: Manufacturing Employment. The Economist. September 29.
European Commission. 2003. The Competitiveness of Business-Related Services and their Contribu-
tion to the Performance of European Enterprises. Brussels: European Commission.
European Commission. 2006. The New Lisbon Strategy: An Estimation of the Economic Impact of
Reaching Five Lisbon Targets. http://europa.eu.int/comm/enterprise/enterprise_policy/competitive-